Desfibriladores cardíacos implantables para los pacientes con miocardiopatía no isquémica
Resumen
Antecedentes
Hay evidencia de que el desfribrilador cardioversor implantable (DCI) para la prevención primaria en pacientes con una miocardiopatía isquémica mejora la tasa de supervivencia. La evidencia que apoya esta intervención en pacientes con miocardiopatía no isquémica no es tan definitiva; el ensayo danés publicado recientemente no encontró ninguna mejoría en la tasa de supervivencia. Se necesitó una revisión sistemática de todos los estudios aptos para evaluar los efectos beneficiosos y perjudiciales del uso de DCI para la prevención primaria en pacientes con miocardiopatía no isquémica.
Objetivos
Evaluar los efectos beneficiosos y perjudiciales del uso en comparación con ningún uso del DCI para la prevención primaria en pacientes con cardiomiopatía no isquémica que reciben tratamiento médico óptimo.
Métodos de búsqueda
Se hicieron búsquedas en CENTRAL, MEDLINE, Embase, y en la Web of Science Core Collection el 10 octubre 2018. Para encontrar ensayos clinicos en curso o no publicados, se hicieron búsquedas en el US National Institutes of Health Ongoing Trials Register ClinicalTrials.gov, en la World Health Organization (WHO) International Clinical Trials Registry Platform (ICTRP), y en el ISRCTN registry. Para identificar los estudios de evaluación económica, se realizó una búsqueda por separado hasta el 31 de marzo de 2015 en la NHS Economic Evaluation Database, y desde marzo de 2015 hasta octubre de 2018 en MEDLINE y Embase.
Criterios de selección
Se incluyeron ensayos controlados aleatorios que incorporaron a pacientes adultos con miocardiopatía crónica no isquémica por una disfunción sistólica ventricular izquierda con una fracción de expulsión de un 35% o menos (New York Heart Association [NYHA] tipo I‐IV). Los pacientes del grupo de intervención debían haber recibido un DCI además del tratamiento médico óptimo y los del grupo control recibieron tratamiento médico óptimo solo. Se incluyeron estudios con tratamiento de resincronización cardíaca cuando estaban equilibrados adecuadamente los grupos experimental y de control.
Obtención y análisis de los datos
Los resultados primarios fueron: la mortalidad por todas las causas, la mortalidad cardiovascular, la muerte cardíaca súbita y los eventos adversos asociados con la intervención. Los resultados secundarios fueron: la muerte no cardiovascular, la calidad de vida relacionada con la salud, la hospitalización por insuficiencia cardíaca, la primera hospitalización relacionada con el DCI y el coste. Se extrajeron el logaritmo (cociente de riesgos instantáneos) y la varianza de los informes de los ensayos para los datos de tiempo transcurrido hasta el evento para la supervivencia. Se extrajeron los datos sin procesar necesarios para calcular el cociente de riesgo. Se resumieron los datos sobre la calidad de vida y coste‐efectividad de forma narrativa. Se evaluó la certeza de la evidencia para todos resultados usando criterios GRADE.
Resultados principales
Se identificaron seis ensayos aleatorios elegibles con un total de 3128 participantes. El uso de DCI más el tratamiento médico óptimo en comparación con el tratamiento médico óptimo solo, disminuye el riesgo de mortalidad por todas las causas (cociente de riesgo instantáneos [CRI] 0,78; intervalo de confianza [IC] del 95%: 0,66 a 0,92; participantes = 3128; estudios = 6; evidencia de certeza alta). Un promedio de 24 pacientes necesitan ser tratados con un DCI para evitar una muerte adicional por cualquier causa (número necesario a tratar para lograr un resultado beneficioso adicional [NNTB] = 24). Los pacientes menores de 65 años obtienen más efectos beneficiosos que los mayores de 65 (CRI 0,51; IC del 95%: 0,29 a 0,91; participantes = 348; estudios = 1) (NNTB = 10). Cuando se agrega al tratamiento médico, los DCI probablemente disminuye la mortalidad cardiovascular en comparación con ningún DCI (cociente de riesgos [CR] 0,75; IC del 95%: 0,46 a 1,21; participantes = 1781; estudios = 4; evidencia de certeza moderada) (posibilidad tanto de beneficio posible como de ningún efecto). También se halló que el desfibrilador cardioversor implantable disminuye los casos de muerte cardíaca súbita (CRI 0,45; IC del 95%: 0,29 a 0,70; participantes = 1677; estudios = 3; evidencia de certeza alta). Un promedio de 25 pacientes necesitan ser tratados con un DCI para evitar una muerte cardíaca súbita adicional (NNTB = 25). Se halló que los DCI probablemente aumenten los eventos adversos (posibilidad tanto de efecto perjudicial como beneficioso), pero quizás tengan poco o ningún efecto sobre la mortalidad no cardiovascular (CR 1,17; IC del 95%: 0,81 a 1,68; participantes = 1781; estudios = 4; evidencia de certeza moderada) (posibilidad tanto de beneficio posible como de ningún efecto). Por último, el uso del tratamiento con DCI probablemente tiene poco o ningún efecto sobre la calidad de vida, aunque los choques del dispositivo causan un deterioro de la calidad de vida. Ningún estudio informó del resultado de primera hospitalización relacionada con el DCI.
Conclusiones de los autores
El uso de DCI además del tratamiento médico en pacientes con miocardiopatía no isquémica reduce la mortalidad por todas las causas y las muertes cardíacas súbitas y probablemente reduce la mortalidad de causa cardiovascular en comparación con el tratamiento médico solo. El uso probablemente aumenta el riesgo de eventos adversos. Sin embargo, estos dispositivos implican un coste elevado, y los choques de los DCI causan un deterioro en la calidad de vida.
PICO
Resumen en términos sencillos
Uso preventivo de los desfibriladores cardíacos implantables en pacientes con función deficiente del corazón
¿Cuál era el objetivo de esta revisión?
El objetivo de esta revisión Cochrane fue comparar los efectos beneficiosos y perjudiciales de usar versus no usar los dispositivos implantables que restauran el ritmo cardíaco (desfibriladores cardioversores implantables [DCI]) además de fármacos en pacientes con cardiopatía no isquémica.
Mensaje clave
El uso de DCI además de fármacos en pacientes con cardiopatía no isquémica reduce la tasa de mortalidad en comparación con no usar el dispositivo.
¿Qué se estudió en la revisión?
La función cardíaca deficiente reduce la capacidad del corazón de bombear suficiente sangre a los diversos sistemas orgánicos del cuerpo humano. Lo anterior puede deberse a una irrigación sanguínea insuficiente a los músculos cardíacos (cardiopatía isquémica) u otras causas (cardiopatía no isquémica). En ambos casos, el riesgo de muerte súbita en los pacientes es mayor. El objetivo del tratamiento es reducir este riesgo a través de fármacos o mediante la implantación de un DCI.
La investigación disponible indica que el uso preventivo de un DCI en la primera categoría de pacientes (cardiopatía isquémica) reduce la tasa de mortalidad. En cambio, la publicación reciente de un ensayo de gran tamaño no mostró ningún beneficio general en la segunda categoría de pacientes (cardiopatía no isquémica).
¿Cuáles son los principales resultados de esta revisión?
En esta revisión, se sintetizaron los resultados de seis ensayos clínicos principales que se identificaron con una búsqueda exhaustiva para comprender mejor la eficacia de los DCI en pacientes con cardiopatía no isquémica. El análisis involucró a 3128 participantes.
Se encontró evidencia de certeza alta que indica que el uso de estos dispositivos (en comparación con ningún uso) en pacientes con cardiopatía no isquémica reduce el riesgo de muerte por cualquier causa y de muerte súbita. Hay evidencia de certeza moderada que indica que los pacientes con estos dispositivos probablemente tengan más complicaciones que los que no los tienen. La evidencia actual indica que el agregado del tratamiento con DCI probablemente tiene poco o ningún efecto sobre la calidad de vida en comparación con ningún dispositivo, aunque los choques eléctricos de los DCI empeoran la calidad de vida.
¿Qué grado de actualización tiene esta revisión?
Se buscaron estudios disponibles hasta el 10 de octubre de 2018.
Authors' conclusions
Summary of findings
| ICD plus optimal medical therapy compared to optimal medical therapy alone for people with non‐ischaemic cardiomyopathy Population: people with non‐ischaemic cardiomyopathy Setting: USA, Israel, New Zealand, Canada, Germany, and Denmark Intervention: implantable cardioverter‐defibrillator in addition to optimal medical therapy Comparator: optimal medical therapy alone | |||||
| Outcomes length of follow‐up (range) | № of participants | Certainty of the evidence | Relative effect | Anticipated absolute effects* (95% CI) | |
| Risk with optimal medical therapy alone | Risk difference with ICD plus optimal medical therapy | ||||
| All‐cause mortality (HR) ‐ main analysisa 16.5 to 67.6 months | 3128 | ⊕⊕⊕⊕ | HR 0.78 | Study population | |
| 216 per 1000 | 43 fewer per 1000 | ||||
| Cardiovascular mortality (RR)b 22.8 to 67.6 months | 1781 | ⊕⊕⊕⊝ | RR 0.75 | Study population | |
| 142 per 1000 | 35 fewer per 1000 | ||||
| Sudden cardiac death (HR)a 24 to 67.6 months | 1677 | ⊕⊕⊕⊕ | HR 0.45 | Study population | |
| 74 per 1000 | 40 fewer per 1000 | ||||
| Adverse events 67.7 months | 1116 | ⊕⊕⊕⊝ | ‐ | The adverse events reported were: device infection, serious device infection, bleeding requiring intervention, and pneumothorax. An analysis of 1116 participants showed that ICD when added to optimal medical therapy probably increases the risk of device infection and pneumothorax (RR 1.36, 95% CI 0.77 to 2.40 and RR 1.85, 95% CI 0.69 to 4.96, respectively). Implantable cardioverter‐defibrillator probably slightly increases the risk for serious device infection (RR 1.16, 95% CI 0.56 to 2.42) and may increase the risk for bleeding requiring intervention (RR 3.02, 95% CI 0.12 to 74.01). | |
| Noncardiovascular mortality (RR)b 22.8 to 67.6 months | 1781 | ⊕⊕⊕⊝ | RR 1.17 | Study population | |
| 57 per 1000 | 10 more per 1000 | ||||
| Health‐related quality of life 24 to 29 months | 561 | ⊕⊕⊕⊝ | ‐ | The health‐related quality of life of 561 participants extracted from 2 studies was evaluated using 4 different scales. None of the studies showed a statistically significant difference in score between the ICD and the control group. | |
| First ICD‐related hospitalisation ‐ not reported | ‐ | ‐ | ‐ | ‐ | ‐ |
| *The risk in the intervention group (and its 95% confidence interval) is based on the assumed risk in the comparison group and the relative effect of the intervention (and its 95% CI). | |||||
| GRADE Working Group grades of evidence | |||||
| aBoth HR and RR were calculated. However, we reported HR since it is more informative for this outcome, pooling more participants than RR. 1One of six studies appears to be at high risk of bias (COMPANION). However, the weight of this study in the meta‐analysis was only 5.3%. We conducted a sensitivity analysis excluding this study, and the results did not change significantly. | |||||
Background
Description of the condition
Heart failure is a clinical syndrome characterised by an impaired systemic delivery of blood, whereby the heart fails to pump enough blood to meet the body's metabolic demand (McMurray 2012). Ischaemic heart failure is caused by myocardial ischaemia due to an underlying coronary artery disease (Ho 1993). Various potential causes leading to non‐ischaemic cardiomyopathy are described in the literature, which are classified into four main categories: dilated cardiomyopathy (idiopathic, viral illness, alcoholism, etc.), hypertrophic cardiomyopathy (genetic factors and hypertension), restrictive cardiomyopathy (amyloidosis, sarcoidosis, haemochromatosis, etc.), and arrhythmogenic right ventricular dysplasia (Wu 2007). Dilated cardiomyopathy is characterised by systolic dysfunction leading to a reduced left ventricular ejection fraction (LVEF) (Daughenbaugh 2007). While not all people with dilated cardiomyopathy display signs of heart failure, it is believed that longstanding dilated cardiomyopathy eventually leads to heart failure (McNally 2013; Dass 2015). In fact, people with dilated cardiomyopathy can be either asymptomatic (New York Heart Assocation (NYHA) class I), or can display signs and symptoms of heart failure (e.g. dyspnoea, fatigue, fluid retention) (NYHA class II‐IV depending on severity), in which case they are considered to have non‐ischaemic systolic heart failure (Yancy 2013; Ponikowski 2016).
People with cardiomyopathy, whether ischaemic or non‐ischaemic, are at increased risk of developing ventricular arrhythmias due to underlying structural and mechanical factors (e.g. increased inward sodium and calcium currents due to myocardial stretch) (Wu 2007). These can range from non‐sustained ones, such as premature ventricular beats, to life‐threatening ones, such as ventricular fibrillation (VF) that leads to sudden cardiac death (SCD). Sudden cardiac death is defined as a rapid and fatal cardiovascular decompensation in a previously haemodynamically stable patient that happens within one hour, and its risk increases as the LVEF falls below 40% (Mosterd 2001; Yap 2005; Shiga 2009). Sudden cardiac death has long been considered the leading cause of death in people with heart failure (Bardy 2005; Packer 2009). However, a recent study (CERTITUDE) found that progressive heart failure is now the leading cause of death in people on cardiac resynchronisation therapy (CRT) (Marijon 2015). Other studies have also found that mortality due to progressive heart failure and to non‐cardiovascular causes were more common than SCD in people with heart failure (Henkel 2008; Pons 2010). Nevertheless, current medical and device therapies are directed towards preventing and terminating arrhythmic events before their progression to fatal VF and SCD (Derfler 2004).
People with heart failure can also present with sudden severe symptoms (acute decompensated heart failure) or with an insidious onset (chronic heart failure). The two conditions are managed differently: acute heart failure therapy is mainly managed pharmacologically (diuretics, vasodilators, etc.), while chronic heart failure is managed through both device and medical therapy (Ponikowski 2016). Since our analysis focuses on device therapy, our target population are people with chronic heart failure.
The burden of heart failure has increased over the past decades. It is estimated that more than 37.7 million people were affected by this disease globally as of 2016 (Ziaeian 2016). The annual global economic burden of the disease was estimated at USD 108,000 million per annum in 2012: USD 65,000 million in direct costs to healthcare systems and USD 43,000 million in indirect costs (through lost productivity, morbidity, premature mortality, etc.) (Ambrosy 2014). While the discovery of several evidence‐based drug and device therapies has improved the outcomes for ambulatory patients with heart failure, postdischarge mortality and readmission rates of hospitalised patients with heart failure have not changed in the past two decades (Ambrosy 2014).
Description of the intervention
Guidelines recommend (primarily Class I recommendations) optimal medical therapy as a first‐line treatment for people with heart failure, either with or without device therapy (Ponikowski 2016; Al‐Khatib 2017b). Treatment with angiotensin converting enzyme inhibitors (ACE‐I) or angiotensin receptor blockers (ARBs) in addition to a beta‐blocker (Class I Level A) is the mainstay for the pharmacological treatment of heart failure with reduced ejection fraction (i.e. LVEF ≤ 40%) (Ponikowski 2016; Al‐Khatib 2017b). Studies have linked the use of these drugs with decreased morbidity and mortality in people with heart failure (Heran 2012; Chatterjee 2013). If symptoms persist despite treatment with ACE‐I and a beta‐blocker, a mineralocorticoid receptor antagonist (MRA) is recommended (Class 1 Level A) to reduce the risk of heart failure hospitalisation and death (Ponikowski 2016; Al‐Khatib 2017b). Long‐term control of weight, blood pressure, glucose, and lipid levels, and reduction in smoking and alcohol consumption also improves survival and reduces the risk of heart failure in at‐risk patients (McMurray 2012).
Implantable cardioverter‐defibrillators (ICDs) are devices that deliver electrical energy to the heart during episodes of ventricular arrhythmias, thus ending the life‐threatening event and resetting the sinus rhythm. They have been efficacious in reducing mortality in people with tachycardia, fibrillation, and other arrhythmic anomalies (Kuck 2000; Young 2003; Josephson 2004). The very first guidelines that discussed the use of ICD in clinical practice were based on the Antiarrhythmics Versus Implantable Defibrillators (AVID) study, a large, multicentre trial that showed a reduction in all‐cause mortality in cardiac arrest survivors (AVID Investigators 1997). Hence, a Class I recommendation was established by the American College of Cardiology (ACC)/American Heart Association (AHA) for the use of ICD in secondary prevention in people meeting enrolment criteria for AVID (Poole 2014). The Canadian Implantable Defibrillator Study (CIDS) and the Cardiac Arrest Study Hamburg (CASH) trials supported the results of this trial. A meta‐analysis of secondary prevention trials showed that the use of ICD extended the survival of people with previous ventricular fibrillation or sustained ventricular tachycardia by a mean of 4.4 months over a six‐year follow‐up period (Connolly 2000). While these studies lacked statistical significance, a pattern of mortality reduction in ICD‐treated patients started to emerge (Connolly 2000; Kuck 2000).
It was not until after the Multicenter Automatic Defibrillator Implantation Trial II (MADIT II) that guidelines upgraded ICD from a secondary to a primary and secondary prevention therapy (Moss 2002). Furthermore, guidelines were once again updated in 2006 based on the results of the Sudden Cardiac Death in Heart Failure Trial (SCD‐HeFT), assigning Class I recommendation for ICD implantation in people with non‐ischaemic heart failure as well. As a matter of fact, the recommendations have not changed since: ICD implantation is a Class I recommendation for the primary and secondary prevention of SCD due to ventricular tachycardia/ventricular fibrillation (VT/VF) in more severe cases of non‐ischaemic heart failure (LVEF ≤ 35% despite ≥ three months of optimal medical therapy) as an adjunct to medical therapy (Ponikowski 2016; Al‐Khatib 2017b).
Patients who meet the criteria for ICD implantation may present with a pre‐existing device therapy: a cardiac resynchronisation therapy device (CRT). Cardiac resynchronisation therapy is recommended for symptomatic patients with heart failure in sinus rhythm with a QRS interval duration ≥ 150 msec (normal 80 to 100 msec) and left bundle branch block (LBBB) QRS morphology and with LVEF ≤ 35% despite optimal medical therapy in order to improve symptoms and reduce morbidity and mortality (Ponikowski 2016; Al‐Khatib 2017b). There are other indications for CRT implantation, the strength of which depends on the QRS duration and presence or absence of LBBB. In fact, ICDs can be implanted alone, or in conjunction with a CRT device, in which case the device is upgraded to a CRT defibrillator (CRT‐D), maintaining its initial function as a pacemaker, and also taking on a new function, which is that of the defibrillator. In other words, if these patients to whom a pacemaker (CRT‐P) was already implanted meet the criteria for ICD implantation, their device is upgraded to a CRT‐D.
Implantable cardioverter‐defibrillator implantation is associated with a number of adverse events that are both physical (e.g. haemothorax, pneumothorax) and psychological (Rosenqvist 1998). The AVID trial found that participants randomised to the ICD arm of the study had a significant decline in quality of life manifested by a decrease in physical functioning and mental well‐being and increased anxiety (Schron 2002). Implantable cardioverter‐defibrillators deliver unexpected shocks to patients without warning, which creates distress to them and their family members (Dunbar 1993; Dougherty 1995). Patients live in a state of anxiety, constantly anticipating an electric shock, which results in an elevated incidence of anxiety disorders and panic attacks (Sears 2002). Finally, post‐traumatic stress disorder has also been reported to be elevated in people with ICD, who re‐experience the events of shock and manifest emotions associated with them (Hamner 1999; Ladwig 2008).
How the intervention might work
Beta‐blockers suppress the firing of these action potentials by blocking the sodium and calcium channels. However, ICDs work through a different mechanism: stopping the chain reaction created by the abnormal pacemaker cells. During episodes of arrhythmias, they deliver an electric shock that depolarises all the cardiac cells simultaneously, thereby halting the progression of the arrhythmia. The primary purpose of ICDs is thus to end life‐threatening ventricular arrhythmias and reduce SCD or arrhythmia‐related complications. We can therefore only expect a relevant reduction in mortality rate in subgroups of patients with heart failure with high incidence of sustained ventricular arrhythmias leading to cardiac arrest if not terminated.
In people with non‐ischaemic cardiomyopathy, currents that are abnormally generated in the ventricle can be immediately stopped through the delivery of a therapeutic dose of electric energy from an ICD device.
Why it is important to do this review
Several studies have assessed the efficacy of ICD treatment in people with non‐ischaemic cardiomyopathy (NICM), however these studies had conflicting results, with some finding significant improvement in primary outcome (e.g. COMPANION) and others finding no benefit (e.g. CAT and AMIOVIRT trials)
The ACC and European Society of Cardiology (ESC) guidelines for device‐based therapy give Class IA recommendation for ICD implantation in people with non‐ischaemic heart failure with LVEF ≤ 35% (Ponikowski 2016; Al‐Khatib 2017b).
The results of a recently published large randomised controlled trial, the DANISH study, appear to be inconsistent with current guidelines and recent systematic reviews, suggesting that ICD use in NICM patients does not reduce the all‐cause mortality rate.
While a number of systematic reviews have been published on this topic since the publication of the DANISH results (Golwala 2016; Akel 2017; Akinapelli 2017; Barakat 2017; Kolodziejczak 2017; Luni 2017; Masri 2017; Narayanan 2017; Omar 2017; Romero 2017; Shah 2017; Shun‐Shin 2017; Singh 2017; Stavrakis 2017; Turagam 2017; Wolff 2017; Xing 2017; Al‐Khatib 2017a; Alba 2018; Beggs 2018), none of them assessed the adverse events of ICD implantation, its impact on quality of life, and associated costs. Hence, the purpose of this Cochrane Review was to systematically assess the benefit and harms of ICD use in people with non‐ischaemic cardiomyopathy, and thus provide a framework for future guideline updates.
Objectives
To evaluate the benefits and harms of using compared to not using ICD for primary prevention in people with non‐ischaemic cardiomyopathy receiving optimal medical therapy.
Methods
Criteria for considering studies for this review
Types of studies
We considered cluster‐randomised controlled trials (cluster‐RCTs), parallel randomised controlled trials (RCTs), and economic evaluation studies that focused on the primary prevention of SCD in people with non‐ischaemic cardiomyopathy published after 1975 in any language. The first ICD was implanted in February 1980 at Johns Hopkins Hospital by Dr Levi Watkins (Mirowski 1980). All RCT and economic evaluation studies were therefore supposedly published after this date. However, we allowed a safety margin of five years (1975). We included studies reported either as full‐text or as abstracts, in addition to unpublished studies.
Types of participants
We included all adults (aged 18 years or older) with a diagnosis of chronic non‐ischaemic cardiomyopathy due to a left ventricular systolic dysfunction and with ejection fraction ≤ 35% (NYHA type I‐IV).
Left ventricular dysfunction includes both systolic and diastolic ventricular dysfunctions. The left ventricular systolic dysfunction is defined by an LVEF, whereas the left ventricular diastolic dysfunction is defined by an abnormal filling of left ventricle accompanied by an elevated filling pressure (Wu 2007).
Many published studies include both ischaemic and non‐ischaemic participants. In such situations, we contacted the authors of the studies for data on the non‐ischaemic participants. If we could not obtain this information, we extracted data from both ischaemic and non‐ischaemic participants when the percentage of participants with ischaemic cardiomyopathy constituted less than 25% of the total population for the following outcomes: adverse events, health‐related quality of life, and cost.
Types of interventions
Intervention
The intervention of interest is implantable cardioverter‐defibrillator (ICD) or cardiac resynchronisation therapy‐defibrillator (CRT‐D), in addition to optimal medical therapy.
Control
The control of interest is optimal medical therapy alone for studies with ICD as the intervention, or optimal medical therapy with cardiac resynchronisation therapy‐pacemaker (CRT‐P) for studies with CRT‐D as the intervention.
We included CRT trials that include a defibrillator arm (CRT‐D) (intervention group) and a cardiac resynchronisation pacing‐only arm (CRT‐P) (control group) since the control group (CRT‐P) is appropriately balanced for the antiarrhythmic effect of CRTs. We excluded studies that compared CRT‐D to ICD since both treatment arms will have ICDs. We also excluded studies that compared CRT‐D to no device.
Types of outcome measures
Primary outcomes
-
All‐cause mortality.
-
Cardiovascular mortality.
-
Sudden cardiac death (SCD).
-
Adverse events of using CRT‐D or ICD (adverse events included serious device infection, pneumothorax, haemothorax, inappropriate shocks, lead displacement, dissection and tamponade, lead‐failure/fracture).
Secondary outcomes
-
Non‐cardiovascular death.
-
Health‐related quality of life (measured on any validated scale such as the Chronic Heart Failure Questionnaire (Guyatt 1989), Quality of Life Questionnaire for Severe Heart Failure (Wiklund 1987), the Kansas City Cardiomyopathy Questionnaire (Green 2000), the Left Ventricular Dysfunction questionnaire (O'Leary 2000), and the Minnesota Living with Heart Failure Questionnaire (Rector 1987)).
-
Cost‐effectiveness (measured by quality‐adjusted life‐year (QALYs), disability‐adjusted life‐years (DALYs), life‐year saved (LYS)).
-
Heart failure hospitalisation.
-
First ICD‐related hospitalisation.
We included studies with a follow‐up time of at least 12 months, since only long‐term trials can obtain sufficient and reliable results for the mortality‐related outcomes of interest (e.g. SCD, all‐cause mortality). Reporting one or more of the outcomes listed here in the trial was not an inclusion criterion of the review.
Search methods for identification of studies
Electronic searches
We searched the following bibliographic databases on 10 October 2018.
-
Cochrane Central Register of Controlled Trials (CENTRAL) in the Cochrane Library (Issue 9 of 12, 2018).
-
MEDLINE and Epub Ahead of Print, In‐Process & Other Non‐Indexed Citations and Daily (Ovid, 1946 to 9 October 2018).
-
Embase (Ovid, 1980 to 2018 week 41).
-
Web of Science Core Collection (Thomson Reuters, 1900 to 10 October 2018).
We adapted the search strategy developed for MEDLINE (Ovid) for use in the other databases (Appendix 1). We applied the Cochrane sensitivity‐maximising RCT filter to MEDLINE (Ovid) and adaptations of it to the other databases except CENTRAL (Lefebvre 2011).
We also searched the following clinical trial registries for ongoing or unpublished trials on 12 October 2018.
-
US National Institutes of Health Ongoing Trials Register ClinicalTrials.gov (www.clinicaltrials.gov).
-
World Health Organization (WHO) International Clinical Trials Registry Platform (ICTRP) (apps.who.int/trialsearch/).
-
ISRCTN registry (www.isrctn.com/).
We used the following keywords when searching the clinical trials registers: non‐ischaemic cardiomyopathy, implantable cardioverter defibrillator, implantable defibrillator and ICD.
We searched all databases starting 1975, as the first ICD was implanted in February 1980 at Johns Hopkins Hospital by Dr Levi Watkins, therefore all RCTs were likely to be published after this date (Mirowski 1980). However, we allowed a five‐year safety margin by searching from 1975. We then set a weekly search alert for MEDLINE to capture subsequent publications. We imposed no restriction on language of publication or publication status.
We conducted a separate search of the NHS Economic Evaluation Database in the Cochrane Library (from 1975 to 31 March 2015) to identify economic evaluation studies. As this database has not been updated since 2015, we also searched MEDLINE (Ovid) and Embase (Ovid) from 2015 to October 2018. We adapted the review search strategy, removing the RCT filter and applying an adaptation of the Centre for Reviews and Dissemination economics evaluation search filter instead to MEDLINE (Ovid) (Appendix 1) (Centre for Reviews and Dissemination).
Finally, we used the European Association for Grey Literature Exploitation (EAGLE) and National Technical Information Serve (NTIS) databases (October 2018) to search the grey literature using the following strategy: ‘(non‐ischemic OR non‐ischaemic OR nonischemic OR nonischaemic) AND (cardiomyopathy OR heart failure)’ (Appendix 1).
We did not perform a separate search for adverse events of interventions used for the treatment of non‐ischaemic heart failure. We considered the adverse effects described in the included studies only.
Searching other resources
We checked reference lists of all included studies and any relevant systematic reviews identified for additional references to trials. We also examined any relevant retraction statements and errata for included studies.
Data collection and analysis
Selection of studies
Two review authors (ME, JN) screened in duplicate and independently the titles and abstracts of all citations identified by the search for potential eligibility (eligible or unclear eligibility). We retrieved the full texts of citations judged as potentially eligible by at least one of the two review authors. The two review authors (ME, JN) screened in duplicate and independently the full texts for eligibility. Any disagreements were resolved through discussion or with the help of a content expert (MR) when necessary.
We identified and excluded duplicate articles and collated reports that related to the same study. Each study, rather than each report, was the unit of interest in the review. We completed a PRISMA flow diagram to record the selection process. We also completed a ʽCharacteristics of excluded studies' table to record the reasons for exclusion of the ineligible studies.
Data extraction and management
Two review authors (JN, ME) extracted independently and in duplicate data regarding study characteristics from the included studies. We developed and pilot tested a data collection form for study characteristics and outcome data. Any disagreements were resolved through discussion or with the help of a content expert (MR) when necessary.
We extracted data of the following study characteristics.
-
Methods: study design, total duration of study, details of any 'run in' period, number of study centres and location, study setting, withdrawals, and date of study.
-
Participants: inclusion and exclusion criteria, number of participants randomised, number of participants lost to follow‐up/withdrawn, number of participants analysed, and general characteristics (e.g. age, gender, LVEF, NYHA class, diagnostic criteria).
-
Interventions: intervention, comparison, concomitant medications, and excluded medications.
-
Outcomes: primary and secondary outcomes reported, and time points specified.
-
Notes: funding for trial, reported conflicts of interest of trial authors.
Many published studies included both ischaemic and non‐ischaemic participants. In such situations, we contacted the authors of the studies for data on the non‐ischaemic participants.
For survival data, we abstracted the log (hazard ratio (HR)) and its variance from trial reports (and when not available, the data needed to calculate them). The COMPANION study did not report the HR explicitly (COMPANION). We used the indirect and mixed‐treatment method to extract the HR with its 95% confidence interval (CI) (Salanti 2012). For dichotomous data, we extracted data needed to calculate the risk ratio (RR). We contacted the study authors for incompletely reported data.
Health‐related quality of life data was presented as a continuous variable. We extracted for each scale and at each follow‐up time the reported statistic (e.g. mean/median score ± standard deviation (SD), mean change from baseline and its SD, or per cent difference in means value from baseline and its 95% CI). For cost, we extracted the lifetime cost of each arm of the study and the QALY and the "dollars per life‐year saved" (LYS) provided by the studies.
One review author (ME) transferred data into the Review Manager 5 file (RevMan 2014). We double‐checked that data were entered correctly by comparing the data presented in the forest plot with the study reports. A second review author (JN) spot‐checked study characteristics for accuracy against the trial report.
Assessment of risk of bias in included studies
Two review authors (ME, JN) assessed independently and in duplicate the risk of bias for each included study. Any disagreements were resolved by discussion or by consulting a third review author (GI) when necessary.
We assessed risk of bias using the following criteria outlined in the Cochrane Handbook for Systematic Reviews of Interventions (Higgins 2011a).
-
Random sequence generation.
-
Allocation concealment.
-
Blinding of participants and personnel.
-
Blinding of data collectors and outcome adjudicators.
-
Incomplete outcome data.
-
Selective outcome reporting.
-
Other bias.
We graded each potential source of bias as low, high, or unclear and provided a quote from the study report, together with a justification for our judgement, in the ʽRisk of bias' table. We summarised the ʽRisk of bias' judgements across different studies for each of the domains listed. Where information on risk of bias related to unpublished data or correspondence with a trial author, we noted this in the ʽRisk of bias' table.
When considering treatment effects, we considered the risk of bias for the studies that contributed to that outcome.
Assessment of bias in conducting the systematic review
We conducted the review according to its published protocol and have reported any deviations from it in the Differences between protocol and review section of the review.
Measures of treatment effect
We analysed dichotomous data as risk ratios (RR) and time‐to‐event data as hazard ratios (HR), with 95% confidence intervals (CIs). When data were available for both RR and HR, we ran analyses for the two effect measures. For continuous data, we had planned to use the mean difference (MD) when pooling data from studies that used the same tool to assess the outcome of interest, and the standardised mean difference (SMD) when pooling data from studies that used different tools. The only outcome reported as a continuous variable by the included studies was quality of life. Since these studies reported quality of life in different ways (e.g. mean score ± SD, median, change from baseline) and at different time points, we decided against the pooling of data. We instead extracted relevant data for each scale and at different follow‐up times and reported them in a summary table (Table 1).
| Study | Questionnaire | Total number of participants | Measure | Baseline score | Score/change at 3 months | Score/change at 6 months | Score/change at 12 months | Score/change at 30 months | Notes | |
| Quality of Well‐Being Schedule | 103 | Baseline vs 1 year (mean ± SD) | Amiodarone: 70 ± 17 | N/A | N/A | Amiodarone: 70 ± 22 | N/A | Scores were not significantly different at 1 year between ICD and amiodarone groups (P > 0.05). | ||
| State‐Trait Anxiety Inventory | Amiodarone: 79 ± 21 | Amiodarone: 67 ± 20 | ||||||||
| MLHFQ | Physical | 458 | Change in quality of life (mean ± SD per month) | Placebo: 20 ± 12 | Placebo: ‐0.7 ± 0.1/month | N/A | Placebo: 0.7 ± 0.3/year | No significant difference in long‐term MLHFQ scores between ICD and control groups | ||
| Emotional | Placebo: 10 ± 8 | Placebo: ‐1.6 ± 0.2/month | N/A | |||||||
| SF‐12 | Physical (PCS) | Placebo: 38 ± 10 | Placebo: +1.0 ± 0.2/month | Placebo: ‐0.4 ± 0.3/year | No significant difference in long‐term PCS scores between ICD and placebo groups | |||||
| Mental (MCS) | Placebo: 47 ± 11 | Placebo: 0.3 ± 0.2/month | Placebo: ‐1.8 ± 0.3/year | No significant difference in long‐term MCS scores between ICD and placebo groups (P = 0.89) | ||||||
Abbreviations: ICD: implantable cardioverter‐defibrillator; MCS: mental component summary; MLHFQ: Minnesota Living With Heart Failure Questionnaire; N/A: not available; PCS: physical component symmary; SD: standard deviation; SF‐12: 12‐item Short Form Health Survey
195% confidence intervals for difference in mean values for continuous variables.
Unit of analysis issues
Had we identified any cluster‐RCTs that did not make adjustments for correlation between cluster participants and that met the inclusion criteria, we would have contacted the corresponding authors of such studies for information about the correlation between participants of the individual clusters.
Dealing with missing data
We attempted to contact investigators or study sponsors in order to verify key study characteristics and to obtain missing numerical outcome data (e.g. when we identified a study as an abstract only). When this was not possible, and we considered that the missing data introduced serious bias, we explored the impact of including such studies in the overall assessment of results by a sensitivity analysis (Akl 2013; Ebrahim 2013; Ebrahim 2014).
COMPANION suffered from high risk of attrition bias due to missing participant data. We planned to conduct a sensitivity analysis to explore the impact of missing data on the results using worst‐case assumption (i.e. all missing participants in the intervention group died and none of the missing participants in control group died). If the sensitivity analysis showed no change in the results, we would conclude that missing data is not associated with an appreciable risk of bias. If there was a significant change in the results, we would move to more plausible and less extreme assumptions (Akl 2013). As we could not extract the number of events for non‐ischaemic participants from the study, we could not perform such an analysis. We instead assumed that missing data from COMPANION introduced a serious risk of bias, and we performed a sensitivity analysis excluding this trial to explore how it impacted the overall assessment of our results.
For trials reporting no loss to follow‐up for the primary outcome (all‐cause mortality in most trials), we considered that there was also no loss to follow‐up for other mortality‐related outcomes (e.g. cardiovascular mortality, SCD, and non‐cardiovascular mortality).
Assessment of heterogeneity
Clinical heterogeneity
We assessed clinical heterogeneity by comparing the population, experimental intervention, and control intervention.
Statistical heterogeneity
We used the standard Chi² test value (P = 0.1) and a visual analysis of a forest plot to explore statistical heterogeneity in the included trials. Additionally, we used the I² statistic to measure heterogeneity among the trials in each analysis. We considered a statistically significant value for the Chi² test along with an I² statistic value of ≥ 50% as substantial statistical heterogeneity (Higgins 2011a). In such cases, we explored possible causes of the heterogeneity by prespecified subgroup analysis.
Methodological heterogeneity
We explored methodological heterogeneity by comparing the quality and study design of the included trials.
Assessment of reporting biases
We planned to create and examine a funnel plot to explore possible small‐study biases for the primary outcomes if pooling of more than 10 trials was possible. Otherwise, the power of the tests becomes too low to distinguish chance variation from real asymmetry (Higgins 2011a).
Data synthesis
We undertook meta‐analyses only where it was meaningful to do so, that is if the treatments, participants, and the underlying clinical question were similar enough for pooling to make sense. We pooled the log (HRs) for time‐to‐event data using a random‐effects model, and the generic inverse variance method in Review Manager 5 (RevMan 2014). For dichotomous data, we calculated the RR separately for each study and pooled them using a random‐effects model since the studies differed in the mixes of participants and in the implementations of interventions, etc. For outcomes where both HR and RR were calculated, we considered the analysis with the higher number of participants to be more informative and used it in the 'Summary of findings' table and to derive conclusions. When the number of participants was similar, we considered HR to be more informative than RR since it accounts for time and censorship. We presented all results with the corresponding 95% CIs. We explained the calculations of effect estimates for all‐cause mortality in Appendix 2. We conducted all analyses according to the guidelines in the Cochrane Handbook for Systematic Reviews of Interventions and with the statistical components of Review Manager 5 (Higgins 2011a; RevMan 2014). We included outcome measures only if it was the intention of the study to perform the necessary assessments in all included participants (i.e. not an optional outcome or only performed in some centres).
For adverse events, we performed a separate analysis for each reported complication. We reported the number of inappropriate shocks and less serious complications descriptively in the text.
For quality of life, we grouped the scales into three broad categories: quality of life, functional status, and psychological well‐being. We were not able perform a meta‐analysis since the outcome was reported differently across studies (one study reporting the mean change from baseline versus another reporting the total score at each follow‐up time). We instead extracted the data as described in the Data extraction and management section, tabulated it in a summary table, and provided a narrative synthesis of the findings. We then counted the number of studies reporting a significant difference in quality of life between intervention and control and those that did not. When we found statistical significance, we checked the minimal clinically important difference (MCID) of the scale involved and compared it to the difference between both groups (ICD and placebo) to judge its clinical significance (Guyatt 2002).
Given that pooling of results was not possible, we summarised the results for costs descriptively.
We reported our findings using the language suggested by Glenton and colleagues, focusing on the size of the effect and its clinical significance in relation to the certainty of the evidence on which the result is based (including the precision of the effect) (see Appendix 3) (Glenton 2010).
ʽSummary of findings' table
We created a GRADE ʽSummary of findings' table using the following outcomes: all‐cause mortality, cardiovascular mortality, SCD, adverse effects of using CRT‐D or ICD, non‐cardiovascular death, health‐related quality of life, and first ICD‐related hospitalisations.
For outcomes where both HR and RR were calculated, we reported the analysis that pooled the highest number of participants. If the number of participants was equal, we reported the HR since it is more informative, accounting for time and censorship.
We assessed the certainty of evidence based on the following factors: study limitations, consistency of effect, imprecision, indirectness, and publication bias (Balshem 2011; Guyatt 2011a; Guyatt 2011b; Guyatt 2011c; Guyatt 2011d; Guyatt 2011e; Guyatt 2011f; Guyatt 2013a; Guyatt 2013b; Guyatt 2013c). We used the methods and recommendations described in Section 8.5 and Chapter 12 of the Cochrane Handbook for Systematic Reviews of Interventions (Schünemann 2011; Higgins 2011b), employing GRADEpro software (GRADEpro GDT 2015). We justified all decisions to downgrade the certainty of evidence using footnotes and made comments to aid the reader's understanding of the review where necessary.
Subgroup analysis and investigation of heterogeneity
We planned to conduct the following subgroup analyses for the primary outcome.
-
Mean age (< 65 years versus ≥ 65 years).
-
CRT therapy (yes versus no).
-
NYHA functional class (NYHA I‐II versus III‐IV).
-
Gender (male versus female).
-
Mean baseline LVEF (measured by echocardiography) (LVEF ≥ 25% versus LVEF < 25%).
-
Mean heart failure duration (< 18 months versus ≥ 18 months).
-
Follow‐up duration of studies (< 24 months versus 24 to 36 months versus > 36 months).
-
Year of publication of RCT (studies published before or in 2003 versus studies published from 2004 onwards).
The paradigm of heart failure treatment has shifted over time, and the introduction of beta‐blockers to the optimal medical therapy regimen is largely due to the publication of large RCTs in the early 2000s that showed reduction in mortality rate with the use of these drugs. Since recruitment of participants in ICD trials usually takes two to three years, we considered 2003 as the relevant time cut‐off. We expect trials published after 2004 to have most participants taking beta‐blocker, now considered an essential pillar in the treatment of cardiomyopathy (ischaemic and non‐ischaemic), but not trials published before 2003. The benefit of ICD therapy might differ depending on the medications included under 'optimal medical therapy'. Hence, we conducted a subgroup analysis based on whether trials were published before or in 2003 versus from 2004 onwards.
We performed a subgroup analysis based on whether the intervention included a CRT or not for the outcome of adverse events, since the presence of a CRT is a potential effect modifier. We attempted to contact the corresponding authors of studies for information about subgroups whenever they were not well defined and data were not available separately. We used the formal test for subgroup interactions in Review Manager 5 (RevMan 2014).
We performed a post hoc meta‐regression analysis on Stata (Stata 2013) using residual maximum likelihood (REML) to estimate the between‐study variance with Knapp‐Hartung modification.
Sensitivity analysis
We performed a sensitivity analysis to assess the potential impact of bias by excluding all studies at high risk of bias (Higgins 2011a). We included only studies at low and unclear risk of bias.
The nature of the intervention makes it difficult to blind participants and healthcare personnel. Some trials that studied the effect of device therapy, though not necessarily ICD, versus pharmacological therapy blinded participants with regard to the treatment received by having the device switched on or switched off (Young 2003). Also, in some studies that compared CRT‐Ds to CRT‐Ps, participants were blinded to the type of device received (Higgins 2003). However, blinding was either not clear or not performed in the RCTs included in this review. Hence, we did not perform a sensitivity analysis that excluded trials with high risk of bias for blinding of participants and personnel for the hard outcomes such as mortality. Trials that had a high risk of bias for any of the other 'Risk of bias' domains (random sequence generation, allocation concealment, blinding of data collectors and outcome adjudicators, incomplete outcome data, selective outcome reporting, and other bias) were excluded from the analysis.
We also planned to perform a sensitivity analysis to assess the potential impact of missing data using recent GRADE guidance (Guyatt 2017).
The AMIOVIRT study compared ICD to amiodarone, a Class III antiarrhythmic medication. We thus conducted a sensitivity analysis excluding AMIOVIRT in order to assess to impact of this study on our results.
For the outcomes of health‐related quality of life and adverse events, we had planned to pool data from trials with mixed populations when the percentage of participants with ischaemic cardiomyopathy was less than 25% of the total population. We planned to then perform a sensitivity analysis excluding trials with mixed population. However, as we did not encounter any such trials we did not perform this analysis.
Reaching conclusions
We based our conclusions only on findings from the quantitative and narrative syntheses of included studies. When both HR and RR were reported for an outcome, we derived our conclusions based on the most informative analysis that pooled the most participants. When the number of participants was equal, we used HR since it is more informative, accounting for time and censorship. We avoided making recommendations for practice, and our implications for research suggest priorities for future research and outline what the remaining uncertainties are in the area.
Results
Description of studies
Results of the search
The study flow diagram is depicted in Figure 1. Our searches identified 16,662 records via bibliographic databases, six studies via clinical trial registries, 310 via economic evaluation databases, and nine via the grey literature. We identified a total of 11,136 unique citations.
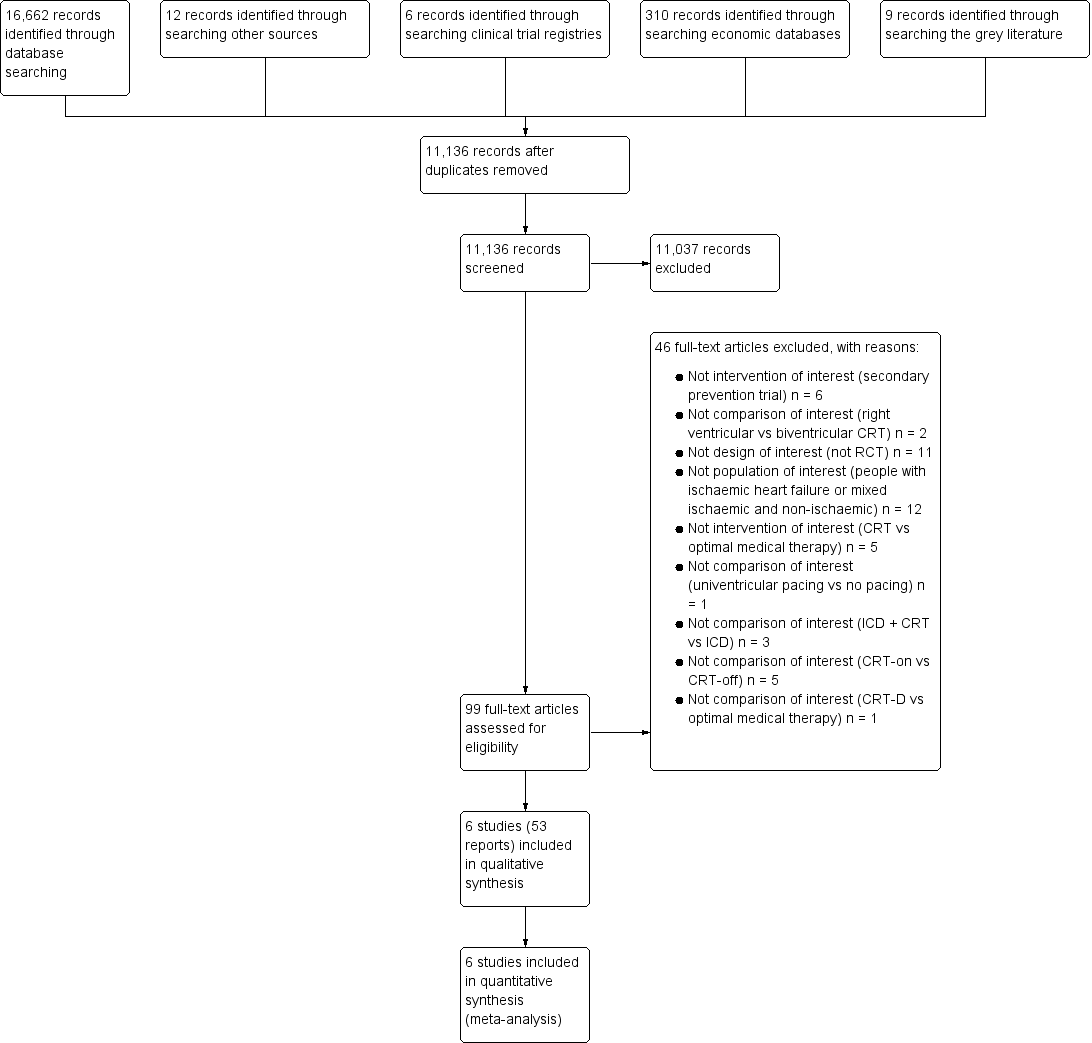
Study flow diagram.
Title and abstract screening resulted in 99 potentially relevant studies. Full‐text screening of these articles identified 53 reports for six eligible RCTs (AMIOVIRT; CAT; COMPANION; DANISH; DEFINITE; SCD‐HeFT). We did not encounter any cluster‐RCTs.
Included studies
We included data from six RCTs in this meta‐analysis, the characteristics of which are summarised in the Characteristics of included studies tables.
Setting
The trials included data from centres in the USA (AMIOVIRT; COMPANION; DEFINITE; SCD‐HeFT), Germany (CAT), Denmark (DANISH), Israel (DEFINITE), Canada, and New Zealand (SCD‐HeFT). There is a gap of nearly 15 years between the time of publication of the first trial, CAT, and the last trial, DANISH. Five of the six trials were published in the early to mid‐2000s (AMIOVIRT; CAT; COMPANION; DEFINITE; SCD‐HeFT), however the DANISH study was published a decade later, in 2016.
Participants
The six trials recruited a total of 3128 participants with non‐ischaemic cardiomyopathy. The studies focused on adult patients, and excluded all patients less than 18 years old. The mean age of participants ranged from 52, in CAT, to 68, in COMPANION. The mean LVEF was similar across trials, ranging from 21.4%, in DEFINITE, to 25%, in DANISH. The SCD‐HeFT study did not report the mean LVEF value; the median LVEF was reported and was equal to 25%. All studies included patients with NYHA III. The COMPANION trial was the only study that included patients with NYHA IV, as well as the only one not to include patients with NYHA II. AMIOVIRT and DEFINITE included patients with NYHA I. The number of events among non‐ischaemic participants in the experimental and control group was only available in four RCTs (AMIOVIRT; CAT; DANISH; DEFINITE). We only used the reported HR for the remaining two RCTs (COMPANION; SCD‐HeFT).
Interventions
Of the six included RCTs, five used ICD plus optimal medical therapy as the intervention and optimal medical therapy alone as the control (AMIOVIRT; CAT; DANISH; DEFINITE; SCD‐HeFT), and one used CRT‐D as the intervention and CRT‐P as the control (COMPANION). More than half of the participants of the DANISH study received a CRT (58% in both groups).
Outcomes
The outcome all‐cause mortality was studied in all the included trials, and was the primary endpoint in all but one study (AMIOVIRT; CAT; DANISH; DEFINITE; SCD‐HeFT). The primary endpoint of the COMPANION trial was a composite of death from any cause or hospitalisation from any cause; death from any cause was a secondary endpoint. Other mortality‐related outcomes such as SCD and deaths from cardiovascular causes were assessed in the AMIOVIRT, CAT, COMPANION, DANISH, and DEFINITE trials. For non‐mortality related outcomes, the AMIOVIRT, COMPANION, DEFINITE, and SCD‐HeFT trials compared the quality of life of participants from both groups, and the AMIOVIRT, DEFINITE, and SCD‐HeFT studied the cost‐effectiveness of the intervention. Although the DANISH study did not publish data on quality of life, the outcome is nonetheless listed in the methods section, implying that it will be published in future manuscripts.
Only DANISH and DEFINITE provided clear definitions of outcomes and details of how they were assessed. The DEFINITE trial used the definitions set forth in the paper 'Classification of death in antiarrhythmia trials' (Epstein 1996). DANISH defined cardiovascular death as death due to heart failure, sudden presumed cardiac death (witnessed and unwitnessed), death due to other cardiovascular causes (e.g. pulmonary embolus, stroke), and presumed cardiovascular death. Sudden presumed cardiac death was defined as death that occurs unexpectedly in a previously stable patient (witnessed and unwitnessed). Non‐cardiovascular death was defined as any death not covered by cardiac death or vascular death (e.g. renal failure, pneumonia, sepsis, malignancy, etc.).
The AMIOVIRT and SCD‐HeFT trials did not define any of the outcomes of interest in this review. The CAT study only defined cardiovascular mortality as including SCD and non‐SCD deaths. The COMPANION trial only defined adverse events as any undesirable clinical outcome, which included device‐related events as well as events related to the participants’ general condition.
Trial duration
All trials had a duration of follow‐up of at least 12 months for all‐cause mortality.
Source of funding
All six trials received industry funding. The SCD‐HeFT study received additional government funding (National Heart, Lung, and Blood Institute and US National Institutes of Health), while the DANISH study received additional funding from a non‐governmental organisation (the Danish Heart Foundation).
Excluded studies
We excluded full‐text articles for the following reasons:
-
not intervention of interest:
-
ICD for secondary prevention (6 studies), CRT versus optimal medical therapy (5 studies), CRT‐D versus optimal medical therapy (1 study);
-
-
not comparison of interest: right ventricular versus biventricular CRT (2 studies), univentricular pacing versus no pacing (1 study), ICD + CRT versus CRT (3 studies), CRT‐on versus CRT‐off (5 studies);
-
not design of interest: not RCT (11 studies);
-
not population of interest: people with ischaemic cardiomyopathy (12 studies) (see Characteristics of excluded studies).
Risk of bias in included studies
'Risk of bias' judgements are summarised in Figure 2 and Figure 3.
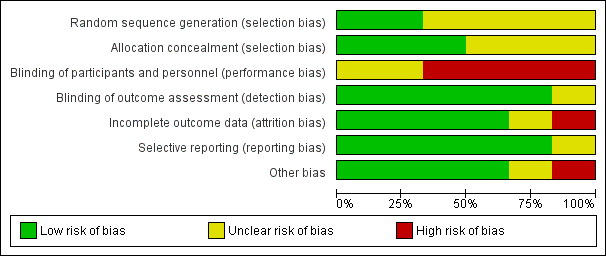
Risk of bias graph: review authors' judgements about each risk of bias item presented as percentages across all included studies.

Risk of bias summary: review authors' judgements about each risk of bias item for each included study.
Allocation
The method of sequence generation was adequate for only two studies (CAT; DANISH), and unclear for the remaining four studies (AMIOVIRT; COMPANION; DEFINITE; SCD‐HeFT).
Allocation was adequately concealed in three studies (CAT; DANISH; SCD‐HeFT). It was unclear whether it was adequately concealed in the remaining three studies (AMIOVIRT; COMPANION; DEFINITE).
Blinding
Blinding of participants and personnel (performance bias)
We judged participants and personnel to be unblinded in four studies (AMIOVIRT; COMPANION; DANISH; DEFINITE); it was unclear whether participants were blinded in the remaining two studies (CAT; SCD‐HeFT).
Blinding of outcome assessment (detection bias)
We judged outcome assessors to be blinded in five studies (AMIOVIRT; CAT; COMPANION; DANISH; DEFINITE); it was unclear if outcome assessors were blinded in one study (SCD‐HeFT).
Incomplete outcome data
Only one study reported a high attrition rate (COMPANION), and was considered to be at high risk for attrition bias. The risk of attrition bias was unclear for one study that did not report withdrawal rate or missing participant data (CAT). The remaining studies reported no loss to follow‐up and were therefore judged as at low risk of bias (AMIOVIRT; DANISH; DEFINITE; SCD‐HeFT).
Selective reporting
Five of the six studies had a protocol published prior to the publication of the main paper (CAT; COMPANION; DANISH; DEFINITE; SCD‐HeFT), and one study had its protocol published after the publication of the main article (AMIOVIRT). All of the prespecified outcomes in the protocol were reported in either the main paper of each study or in subsequent publications. We judged the AMIOVIRT study to be at unclear risk of reporting bias since a protocol published after the manuscript does not offer any indication of whether or not there was selective reporting.
We did not have access to the protocol of one study (SCD‐HeFT), however all the specified outcomes in the methods section of the manuscript were reported.
Other potential sources of bias
One study reported a statistically significant difference in the use of beta‐blockers at the time of the last follow‐up visit between the intervention and the control groups (P < 0.001) (SCD‐HeFT). One study excluded people with a history of non‐compliance with oral heart failure therapy (COMPANION).
Effects of interventions
We contacted the authors of the COMPANION, DEFINITE, and SCD‐HeFT studies for information on study design (e.g. allocation concealment, random sequence generation) and data on participants with non‐ischaemic cardiomyopathy (e.g. number of events in each group, HR of mortality‐related outcomes). None of the authors were able to provide us with the requested information.
The CAT trial reported the number of deaths from any cause after one year and after long‐term follow‐up. The remaining outcomes (i.e. SCD, cardiac and non‐cardiac deaths) were only reported after one‐year follow‐up. We conducted the all‐cause mortality analysis using the number of events reported after the long‐term follow‐up. For the SCD, cardiovascular and non‐cardiovascular mortality analyses, we used the number of events reported after one‐year follow‐up.
All‐cause mortality
A meta‐analysis that pooled hazard ratios (HRs) from the six RCTs with 3128 participants found that the use of ICD in addition to optimal medical therapy compared to optimal medical therapy alone decreases all‐cause mortality (HR 0.78, 95% confidence interval (CI) 0.66 to 0.92; participants = 3128; studies = 6; high‐certainty evidence) (see Analysis 1.1; summary of findings Table for the main comparison; Appendix 2) (AMIOVIRT; CAT; COMPANION; DANISH; DEFINITE; SCD‐HeFT). An average of 24 patients need to be implanted with an ICD to prevent one additional mortality from any cause (number needed to treat for an additional beneficial outcome (NNTB) = 24). A meta‐analysis of the relative risk of only four of the six RCTs including 1781 participants suggested that using ICD in addition to optimal medical therapy probably decreases all‐cause mortality rate slightly compared to optimal medical therapy alone (risk ratio (RR) 0.87, 95% CI 0.72 to 1.05; participants = 1781; studies = 4; moderate‐certainty evidence) (possibility of both plausible benefit and no effect) (see Analysis 1.2) (AMIOVIRT; CAT; DANISH; DEFINITE). We downgraded the certainty of evidence to moderate due to imprecision, since the CI of the absolute effect includes values suggesting clinically significant benefit and values suggesting no effect (28 fewer per 1000, 95% CI from 61 fewer to 11 more). We could not retrieve the number of events in the non‐ischaemic subgroup from the SCD‐HeFT and COMPANION trials. Hence, these trials, which carry a significant weight in the analysis due to their high number of participants, could not be pooled in the RR analysis. Since the number of participants pooled was higher for HR than for RR, we reported HR in the 'Summary of findings' table and based our conclusion on this analysis (summary of findings Table for the main comparison).
The I² value, which indicates that the percentage of the variability in effect estimates is due to heterogeneity rather than sampling error (chance), was absent (I² = 0%) for the comparison of ICD plus optimal medical therapy versus optimal medical therapy alone. Due to the relatively few trials to permit an accurate assessment, we did not create and examine an inverted funnel plot.
Since the primary meta‐analysis found a statistically significant effect (HR 0.78, 95% CI 0.66 to 0.92; participants = 3128; studies = 6; high‐certainty evidence), we conducted a sensitivity analysis in which the COMPANION study, which was found to have a high risk of overall bias, was excluded. The results did not change, and the use of ICD in addition to optimal medical therapy was shown to decrease all‐cause mortality compared to optimal medical therapy alone (HR 0.79, 95% CI 0.67 to 0.95; participants = 2573; studies = 5; high‐certainty evidence) (see Analysis 1.3).
We could not conduct a sensitivity analysis to explore the impact of missing outcome data. Indeed, four trials reported complete follow‐up for all participants (AMIOVIRT; DANISH; DEFINITE; SCD‐HeFT). The CAT study did not report missing participant data. Finally, the COMPANION trial suffered from significant attrition rate. However, we derived the effect estimate using the indirect method (see Appendix 2), and we did not have the number of events in each group to conduct such an analysis.
We conducted a sensitivity analysis excluding AMIOVIRT, since the participants randomised to the control group of this trial received amiodarone, an antiarrhythmic medication. The results did not change, and the use of ICD in addition to medical therapy was shown to decrease all‐cause mortality compared to medical therapy alone (HR 0.78, 95% CI 0.65 to 0.92; participants = 3025; studies = 5; high‐certainty evidence) (see Analysis 1.4).
Only the DANISH study reported outcomes for the subgroups age, NYHA functional class, gender, baseline LVEF, CRT, and mean heart failure duration. We performed a subgroup analysis in the DEFINITE trial, and the risk ratios of 95% confidence intervals are plotted in Figure 2 of the manuscript, however the numbers are not displayed, and we could not extract the data. We could not pool subgroup data from the SCD‐HeFT and COMPANION trials since they included both ischaemic and non‐ischaemic cardiomyopathy patients.
We conducted the subgroup meta‐analyses listed in the Methods section. The test for subgroup effect was only statistically significant for age (P = 0.05, I² = 74.4%). Our results suggest that ICD, when added to optimal medical therapy, may decrease the rate of death from any cause in patients who are younger than 65 years of age (HR 0.51, 95% CI 0.29 to 0.91; participants = 348; studies = 1; high‐certainty evidence), but probably has little or no effect on patients who are 65 years of age or older (HR 0.98, 95% CI 0.73 to 1.31; participants = 768; studies = 1; moderate‐certainty evidence) (possibility of both plausible benefit and no effect). An average of 10 patients younger than 65 years of age need to be treated with an ICD to prevent one additional death from any cause (NNTB = 10). The remaining tests were not statistically significant (gender: P = 0.57, I² = 0%; CRT: P = 0.86, I² = 0%; NYHA class: P = 0.62, I² = 0%; heart failure duration: P = 0.77, I² = 0%; LVEF: P = 0.71, I² = 0%; year of publication of study: P = 0.84, I² = 0%; mean follow‐up time: P = 0.53, I² = 0%) (see Analysis 1.5; Analysis 1.6; Analysis 1.7; Analysis 1.8; Analysis 1.9; Analysis 1.10; Analysis 1.11; Analysis 1.12).
We performed a post hoc meta‐regression based on the number of patients included per centre per year. The values we used to perform this are reported in Table 2. While there seems to be a tendency for lower beneficial effect of ICD when the inclusion rate is higher, the results were not statistically significant (P = 0.30) (see Figure 4).

Inclusion rate meta‐regression.
| Study | Start year | End year | Duration | Country | Number of participants | Number of centres | Number of patients included per hospital per year |
| 1996 | 2001 | 4 years 10 months | USA | 103 | 10 | 2.13 | |
| 1991 | 1997 | 5 years 9 months | Germany | 104 | 15 | 1.21 | |
| 2000 | 2002 | 3 years | USA | 555 | 128 | 1.45 | |
| 2007 | 2016 | 8 years 7 months | Denmark | 1116 | 5 | 26 | |
| 2002 | 2004 | 3 years | USA/Israel | 458 | 48 | 3.18 | |
| 1997 | 2001 | 3 years 10 months | Canada/New Zealand/USA | 792 | 148 | 1.40 |
Cardiovascular mortality
A meta‐analysis that pooled the HR from two RCTs with 1219 participants showed that use of ICD plus optimal medical therapy probably decreases cardiovascular mortality compared to optimal medical therapy alone (HR 0.78, 95% CI 0.58 to 1.05; participants = 1219; studies = 2; moderate‐certainty evidence) (possibility of both plausible benefit and no effect) (see Analysis 1.13) (AMIOVIRT; DANISH). We downgraded the certainty of evidence to moderate due to imprecision, since the CI of the absolute effect includes values suggesting clinically significant benefit and values suggesting no effect (33 fewer per 1000, 95% CI from 64 fewer to 7 more).
Another meta‐analysis that pooled the RR from four RCTs with 1781 participants also showed that the use of ICD in addition to optimal medical therapy probably decreases cardiovascular mortality compared to optimal medical therapy alone (RR 0.75, 95% CI 0.46 to 1.21; participants = 1781; studies = 4; moderate‐certainty evidence) (possibility of both plausible benefit and no effect) (see Analysis 1.14) (AMIOVIRT; CAT; DANISH; DEFINITE). We downgraded the certainty of evidence to moderate due to imprecision, since the CI of the absolute effect includes values suggesting clinically significant benefit and values suggesting no effect (35 fewer per 1000, 95% CI from 77 fewer to 30 more). Since the number of participants pooled was higher for RR than for HR, we reported RR in the 'Summary of findings' table and based our conclusion on this analysis (summary of findings Table for the main comparison).
The I² value indicates that the percentage of the variability in effect estimates that is due to heterogeneity rather than sampling error (chance) may represent low heterogeneity (I² = 39%).
Sudden cardiac death
Four studies compared the effect of adding versus not adding ICD to optimal medical therapy on SCD (AMIOVIRT; CAT; DANISH; DEFINITE). There were no reported sudden cardiac deaths in the ICD and control groups of the CAT trial. A meta‐analysis on the other three trials including data from 1677 participants showed that the use of ICD in addition to optimal medical therapy decreases SCD compared to optimal medical therapy alone (HR 0.45, 95% CI 0.29 to 0.70; participants = 1677; studies = 3; high‐certainty evidence) (see Analysis 1.15). An average of 25 patients need to be treated with an ICD to prevent one additional SCD (NNTB = 25). The I² value indicates that the percentage of the variability in effect estimates that is due to heterogeneity rather than sampling error (chance) was absent (I² = 0%). The certainty of the evidence was high (see summary of findings Table for the main comparison).
Another analysis that pooled the RR of these three trials with the same number of participants (n = 1677) also showed that that the use of ICD in addition to optimal medical therapy decreases SCD compared to optimal medical therapy alone (RR 0.47, 95% CI 0.30 to 0.73; participants = 1677; studies = 3; high‐certainty evidence) (see Analysis 1.16) (AMIOVIRT; DANISH; DEFINITE). Since the number of participants pooled was higher for HR than for RR, we reported HR in the 'Summary of findings' table and based our conclusion on this analysis (see summary of findings Table for the main comparison).
Adverse events
The COMPANION and DANISH trials included data for adverse events. We did not pool data from the COMPANION trial since 55% of the participants had ischaemic cardiomyopathy.
The adverse events reported were: device infection, serious device infection, bleeding requiring intervention, and pneumothorax. An analysis of the DANISH trial including 1116 participants suggested that using ICD in addition to optimal medical therapy probably increases the risk for device infection (RR 1.36, 95% CI 0.77 to 2.40; participants = 1116; studies = 1; moderate‐certainty evidence) (possibility of both plausible harm and benefit) and pneumothorax (RR 1.85, 95% CI 0.69 to 4.96; participants = 1116; studies = 1; moderate‐certainty evidence) (possibility of both plausible harm and benefit) compared to optimal medical therapy alone (see Analysis 1.17; Analysis 1.18). We downgraded the certainty of evidence to moderate, since the CI of the absolute effect includes values suggesting clinically significant benefit and values suggesting no effect (device infection: 13 more per 1000, 95% CI from 8 fewer to 50 more; pneumothorax: 9 more per 1000, 95% CI from 3 fewer to 42 more). Results from the analysis also suggest that adding ICD to optimal medical therapy probably slightly increases the risk for serious device infection compared to not adding ICD (RR 1.16, 95% CI 0.56 to 2.42; participants = 1116; studies = 1; moderate‐certainty evidence) (possibility of both plausible harm and benefit) (see Analysis 1.19). We downgraded the certainty of evidence to moderate, since the CI of the absolute effect includes values suggesting clinically significant benefit and values suggesting no effect (4 more per 1000, 95% CI from 10 fewer to 33 more). Finally, adding ICD to optimal medical therapy may increase the risk for bleeding requiring intervention compared to not adding it (RR 3.02, 95% CI 0.12 to 74.01; participants = 1116; studies = 1; low‐certainty evidence) (possibility of both plausible harm and benefit) (see Analysis 1.20). The analysis suffered from very serious imprecision, and the certainty of evidence was downgraded to low since the CI of the effect estimate was very wide.
In the CAT study, 10 complications occurred in 7 participants: dislocation of electrode and sensing/isolation defect (7), device infection and replacement (2), and perforation (1).
Two studies reported the number of inappropriate shocks in the ICD group: in the DANISH study, 33 participants (5.9%) had inappropriate shocks, while in the DEFINITE study, 49 participants had inappropriate shocks. The AMIOVIRT study did not report the number of inappropriate shocks and adverse events.
Subgroup analysis
We performed a subgroup analysis based on CRT for device infection and serious device infection (see Analysis 1.21; Analysis 1.22). The test for subgroup effect was only statistically significant for device infection (P = 0.02, I² = 0%). Our results suggest that using ICD in addition to optimal medical therapy increases the risk for device infection in patients with no CRT compared to not using ICD (RR 6.08, 95% CI 1.38 to 26.86; participants = 471; studies = 1; high‐certainty evidence), but probably has little or no effect in patients with a CRT (RR 0.82, 95% CI 0.34 to 1.95; participants = 645; studies = 1; moderate‐certainty evidence) (possibility of both plausible harm and benefit). For DANISH, we did not pool pneumothorax and bleeding events in our analysis since we did not know which participants had a CRT and which ones did not.
Non‐cardiovascular death
A meta‐analysis that pooled the HR of two RCTs with 1219 participants showed that adding ICD to optimal medical therapy probably has little or no effect on non‐cardiovascular mortality compared to not adding it (HR 1.11, 95% CI 0.72 to 1.71; participants = 1219; studies = 2; moderate‐certainty evidence) (possibility of both plausible benefit and no effect) (see Analysis 1.23) (AMIOVIRT; DANISH). We downgraded the certainty of evidence to moderate due to imprecision, since the CI of absolute effect includes values suggesting clinically significant benefit and values suggesting no effect (7 more per 1000, 95% CI from 17 fewer to 42 more).
A meta‐analysis that pooled the RR from four RCTs with 1781 participants also showed that the use of ICD in addition to optimal medical therapy probably has little or no effect on non‐cardiovascular mortality compared to optimal medical therapy alone (RR 1.17, 95% CI 0.81 to 1.68; participants = 1781; studies = 4; moderate‐certainty evidence) (possibility of both plausible benefit and no effect) (see Analysis 1.24) (AMIOVIRT; CAT; DANISH; DEFINITE). We downgraded the certainty of evidence to moderate due to imprecision, since the CI of absolute effect includes values suggesting clinically significant benefit and values suggesting no effect (10 more per 1000, 95% CI from 11 fewer to 39 more) (see summary of findings Table for the main comparison). The I² value indicates that the percentage of the variability in effect estimates that is due to heterogeneity rather than sampling error (chance) was absent (I² = 0%). Since the number of participants pooled was higher for RR than for HR, we reported RR in the 'Summary of findings' table and based our conclusion on this analysis (see summary of findings Table for the main comparison).
Health‐related quality of life
Two studies with a total of 561 participants evaluated the health‐related quality of life of participants using four different scales: Quality of Well‐Being Schedule (n = 1), Minnesota Living With Heart Failure Questionnaire (MLHFQ) (n = 1), 12‐Item Short Form Health Survey (SF‐12) (n = 1), and State‐Trait Anxiety Inventory (n = 1) (Table 1) (AMIOVIRT; DEFINITE). We did not include data from COMPANION and SCD‐HeFT, since the percentage of participants with ischaemic cardiomyopathy in these trials was more than 25% (55% and 52%, respectively).
There was no difference in quality of life score between the ICD and the control group, suggesting that ICD probably has little or no effect on patient quality of life. We downgraded the certainty of the evidence to moderate due to high risk of bias, since lack of blinding can influence the results of a subjective outcome (summary of findings Table for the main comparison). We did not perform a sensitivity analysis excluding trials with mixed populations (participants with ischaemic cardiomyopathy < 25% of total population), since we did not encounter any such trials.
One study assessed the impact of shocks on quality of life (DEFINITE). Health‐related quality of life scores between shocked and non‐shocked participants was not significantly different. However, an analysis of the pre‐shock and postshock quality of life of individuals receiving a discharge found a decline in the mental and emotional components of the MLHFQ. These changes represented small changes in the overall score.
Cost‐effectiveness
We identified one study that assessed the cost and/or cost‐effectiveness of ICD therapy in people with non‐ischaemic cardiomyopathy (AMIOVIRT; SCD‐HeFT). The COMPANION study assessed the cost‐effectiveness of ICD therapy in participants with ischaemic and non‐ischaemic cardiomyopathy and was thus not included in the analysis.
The SCD‐HeFT study showed that the incremental cost per life‐year added for ICD therapy in participants with non‐ischaemic cardiomyopathy was USD 32,100 per life‐year saved when undiscounted, and USD 38,557 when discounted at 3%. The results were highly sensitive to how long the benefits of ICD persist, with efficiency increasing with longer follow‐up time (SCD‐HeFT).
The AMIOVIRT study showed that the cost of therapy in the ICD group was USD 22,079 +/‐ USD 22,039, while the cost in the amiodarone group was USD 8879 +/‐ USD 27,614 in the first year after entry into the study (P = 0.1).
Other
None of the included studies assessed the outcomes of heart failure hospitalisation or first ICD‐related hospitalisation.
Discussion
Summary of main results
Our findings suggest that the use of ICD therapy in addition to optimal medical treatment decreases all‐cause mortality and sudden cardiac deaths compared to optimal medical therapy alone. There is moderate‐certainty evidence showing that the use of ICDs in addition to optimal medical therapy probably decreases cardiovascular mortality compared to optimal medical therapy alone.
The results of the DANISH trial show that there was an age‐related effect for ICD therapy. In fact, ICD therapy decreases mortality rate in patients who are younger than 65 years of age, but probably has little or no effect on patients who are 65 years old or more. Unfortunately, there were no sub‐analyses allowing confirmation of those results in the remaining trials. The main role of ICD is to decrease mortality by preventing SCD. Older participants were more likely to die of causes other than SCD compared to younger participants, which might be why ICDs have little or no benefit in older participants (Elming 2017).
Some reviews have chosen to exclude the COMPANION trial from their analysis due to concomitant CRT in all participants (see Table 3; Table 4). We are currently living in an era in which CRT is part of the armamentarium used to treat non‐ischaemic cardiomyopathy with wide QRS (especially with left bundle branch block morphology) who remain in NYHA functional class II, III, and ambulatory IV despite adequate medical therapy. This trend is mirrored in the DANISH trial, where more participants than not had a concomitant CRT device (58% of all participants had a CRT). Its use has been shown to improve symptoms and quality of life, and decrease adverse events in patients with heart failure and cardiac dyssynchrony. This is achieved through reverse left ventricular remodelling (Cleland 2005). The investigators of the DANISH trial conducted a subgroup analysis to determine whether participants with a CRT would derive different benefits from ICD treatment than participants without a CRT. The test for CRT subgroup effect failed to reach significance for all‐cause mortality. This suggests that there is no real effect difference between patients with and without a CRT. We included the COMPANION trial in the all‐cause mortality analysis. Based on the DANISH trial, it was unlikely that CRT would affect our results. In fact, we performed a sensitivity analysis where we excluded the COMPANION trial, and the results did not change significantly: using ICDs in addition to optimal medical therapy decreases all‐cause mortality compared to optimal medical therapy alone. Furthermore, we performed a subgroup analysis pooling data from the six trials (3128 participants) to determine whether concomitant CRT therapy affected our results. The test of subgroup effect showed no difference in effect between participants with and without a CRT. Finally, other systematic reviews have included the COMPANION trial. However, in contrast to other reviews which compared CRT‐D to optimal medical therapy, we compared CRT‐D to CRT‐P, thereby properly balancing the effect of CRT in both groups.
| Our study | |||||||||||||||||||||
| Outcomes | All‐cause mortality | Yes | 0.78 (0.66, 0.92) | Yes | 0.8 (0.67, 0.96) | Yes | 0.88 (0.73, 1.07) | Yes | 0.78 (0.66, 0.92) | Yes | 0.75 (0.61, 0.93) | Yes | 0.79 (0.64, 0.93) | Yes | 0.76 (0.65, 0.91) | Yes | 0.77 (0.64, 0.91) | Yes | 0.81 (0.72, 0.91) | Yes | 0.76 (0.64, 0.91) |
| Cardiovascular mortality | Yes | 0.80 (0.47, 1.35) | No | Yes | 0.66 (0.42, 1.03) | Yes | 0.77 (0.60, 0.98) | No | No | No | No | Yes | 0.80 (0.40, 1.59) | No | |||||||
| Sudden cardiac death | Yes | 0.45 (0.29, 0.70) | Yes | 0.51 (0.34, 0.76) | Yes | 0.47 (0.30, 0.73) | Yes | 0.45 (0.29, 0.70) | No | Yes | 0.47 (0.30, 0.73) | No | No | Yes | 0.44 (0.17, 1.12) | No | |||||
| Non‐cardiovascular mortality | Yes | 1.17 (0.81, 1.68) | No | No | No | No | No | No | No | Yes | 1.08 (0.58, 2.02) | No | |||||||||
| Adverse events | Yes | No | No | No | No | No | No | No | No | No | |||||||||||
| Cost‐effectiveness | Yes | No | No | No | No | No | No | No | No | No | |||||||||||
| Studies included | Yes | No | No | Yes | No | No | Yes | Yes | No | Yes | |||||||||||
| Yes | Yes | Yes | Yes | Yes | Yes | Yes | Yes | Yes | Yes | ||||||||||||
| Yes | Yes | Yes | Yes | No | Yes | Yes | Yes | Yes | Yes | ||||||||||||
| Yes | Yes | Yes | Yes | Yes | Yes | Yes | Yes | Yes | Yes | ||||||||||||
| Yes | Yes | Yes | Yes | Yes | Yes | Yes | Yes | Yes | Yes | ||||||||||||
| Yes | Yes | No | Yes | Yes | Yes | Yes | Yes | Yes | Yes | ||||||||||||
| Analysis performed (HR/RR/OR) | HR & HR | HR | RR | HR & RR | HR | HR | RR | HR | HR | OR | |||||||||||
| GRADE | Yes | No | No | Yes | No | Yes | No | No | No | No | |||||||||||
| Risk of bias | Yes | No | No | Yes | No | Yes | No | No | Yes | Yes | |||||||||||
| Subgroup analysis | Yes | No | No | No | No | Yes | No | No | Yes | No | |||||||||||
HR: hazard ratio; OR: odds ratio; RR: risk ratio
| Outcomes | All‐cause mortality | Yes | 0.79 (0.66, 0.91) | Yes | 0.84 (0.71, 0.99) | Yes | 0.832 (0.712, 0.973) | Yes | 0.76 (0.64, 0.90) | Yes | 0.79 (0.68, 0.91) | Yes | 0.78 (0.66, 0.92) | Yes | 0.75 (0.64, 0.89) | Yes | 0.77 (0.64, 0.93) | Yes | 0.83 (0.71, 0.97) | Yes | 0.76 (0.64, 0.91) | Yes | 0.76 (0.63, 0.91) |
| Cardiovascular mortality | No | No | No | No | No | No | No | Yes | 0.83 (0.62, 1.12) | No | Yes | 0.75 (0.39, 1.44) | No | ||||||||||
| Sudden cardiac death | No | Yes | 0.47 (0.30, 0.73) | No | No | No | Yes | 0.46 (0.29, 0.71) | Yes | 0.45 (0.28, 0.71) | Yes | 0.43 (0.27, 0.69) | Yes | 0.54 (0.21, 1.37) | Yes | 0.40 (0.18, 0.90) | Yes | 0.27 (0.15, 0.50) | |||||
| Non‐cardiovascular mortality | No | No | No | No | No | No | No | Yes | 1.18 (0.76, 1.83) | No | No | No | |||||||||||
| Adverse events | No | No | No | No | No | No | No | No | No | No | No | ||||||||||||
| Cost‐effectiveness | No | No | No | No | No | No | No | No | No | No | No | ||||||||||||
| Studies included | Yes | No | No | Yes | Yes | Yes | Yes | No | No | Yes | Yes | ||||||||||||
| Yes | Yes | Yes | Yes | Yes | Yes | Yes | Yes | Yes | Yes | Yes | |||||||||||||
| Yes | Yes | Yes | Yes | Yes | Yes | Yes | Yes | Yes | No | Yes | |||||||||||||
| Yes | Yes | Yes | Yes | Yes | Yes | Yes | Yes | Yes | Yes | Yes | |||||||||||||
| Yes | Yes | Yes | Yes | Yes | Yes | Yes | Yes | Yes | Yes | Yes | |||||||||||||
| Yes | Yes | Yes | Yes | Yes | Yes | Yes | Yes | Yes | Yes | Yes | |||||||||||||
| Analysis performed (HR/RR/OR) | RR | RR | RR | HR | RR | HR | RR | OR | RR | RR | RR | ||||||||||||
| GRADE | No | No | No | No | No | No | No | No | Yes | No | No | ||||||||||||
| Risk of bias | No | Yes | No | Yes | No | No | No | Yes | No | Yes | No | ||||||||||||
| Subgroup analysis | No | No | No | No | No | Yes | No | No | No | No | Yes | ||||||||||||
HR: hazard ratio; OR: odds ratio; RR: risk ratio
Our findings suggest that adding an ICD to optimal medical therapy probably increases the risk of adverse events. In fact, the use of this device probably increases the risk of device infection and pneumothorax compared to no such use. A subgroup analysis showed that ICD, when added to optimal medical therapy in participants with no previous CRT, increases the risk for device infection, but probably has little or no effect in participants with a previous CRT. We also showed that ICD probably slightly increases the risk of serious device infection. Finally, using ICD in addition to optimal medical therapy may increase the risk of bleeding requiring intervention compared to optimal medical therapy alone, however the evidence supporting this finding was of low certainty since the results suffered from very serious imprecision. Data from a large registry involving 5918 patients and published in 2013 showed that around 1 in 10 patients implanted with any cardiovascular device experienced at least one complication (Kirkfeldt 2014). The improvement of implantation techniques, from thoracotomy in the 1990s to transcutaneous procedure today, was associated with a reduction in complication rate (Ezzat 2005). Nevertheless, limitations in current techniques such as subclavian puncture without the use of ultrasound guidance contributes to a higher rate of adverse events in patients undergoing device implantation.
Our results showed that adding ICDs to optimal medical therapy probably has little or no effect on non‐cardiovascular mortality compared to not adding them. The evidence supporting this finding was of moderate certainty due to imprecision. This is not surprising given the mechanism by which ICDs work. These high‐energy devices were designed to deliver an electric shock that terminates potentially fatal arrhythmic events. Hence, besides reducing arrhythmic deaths, they have no other obvious benefits.
Factors other than mortality rate come into consideration when deciding whether or not to implant a patient with an ICD, notably the quality of life that accompanies device therapy. While an improvement in quality of life was not expected, the risk accompanying ICD therapy such as inappropriate shocks and complications were of concern since they could affect the patient's psychological well‐being and the quality of life (Mark 2008). The currently available evidence suggests that adding ICD therapy probably has little or no effect on quality of life when compared to no ICD therapy (see summary of findings Table for the main comparison). The evidence supporting this finding was of moderate certainty, since participants were not blinded to the treatment received, which introduces a serious risk of bias for this subjective outcome. One study showed that while there was no difference in the quality of life of participants who received a shock and those who did not receive a shock, participants who experienced a shock had a deterioration in their emotional and mental well‐being (DEFINITE). However, the data were limited due to the lack of blinding of participants to the treatment received.
The lifetime cost of ICD therapy is significantly higher than that of medical therapy. The literature still lacks strong evidence of the cost‐effectiveness of ICD therapy. Most RCTs were not designed to assess the cost‐effectiveness of ICD intervention, as the majority were performed over a relatively short period of time, and a short follow‐up period will not be able to reveal the full benefit of such a high‐cost intervention.
We found no studies that looked at heart failure hospitalisation or first ICD‐related hospitalisation.
Overall completeness and applicability of evidence
This Cochrane Review includes six RCTs that found that the use of ICDs in addition to optimal medical therapy decreases all‐cause mortality and SCD compared to optimal medical therapy alone. The clinical, statistical, and methodological heterogeneity across the pooled studies was low. Our results showed that ICD in addition to optimal medical therapy probably decreases cardiovascular mortality compared to optimal medical therapy alone.
The mainstay of heart failure treatment has shifted over time, and therapies that are now considered essential in treating heart failure were once considered counterintuitive. This is especially the case of beta‐blockers, which were less commonly used in older studies (e.g. CAT; MADIT) compared to newer studies (e.g. DANISH; SCD‐HeFT). Medications that have been shown to reduce mortality from heart failure (angiotensin converting enzyme inhibitors, beta‐blockers, spironolactone) were used much more in the DANISH study than in any other trial. One could argue that this change in standard of care may explain why the benefit of ICD appears lower in the DANISH compared to older trials.
Our results suggest that ICD therapy probably increases adverse events, and probably has little or no effect on quality of life when compared to no ICD therapy. However, the number of events was low, which lowered the precision of our findings.
Our results are in agreement with the latest American College of Cardiology (ACC) guidelines, which give a Class Ia recommendation for ICD implantation in people with non‐ischaemic cardiomyopathy (NYHA II‐III and LVEF < 35%) (Al‐Khatib 2017b).
Certainty of the evidence
For the comparison of ICD plus optimal medical therapy to optimal medical therapy alone, we judged the certainty of evidence as high for all‐cause mortality and sudden cardiac deaths. We downgraded the certainty of evidence to moderate for cardiovascular mortality, non‐cardiovascular mortality, and adverse events (pneumothorax and device infection) due to imprecision. We downgraded the certainty of evidence to moderate for health‐related quality of life due to serious risk of bias (summary of findings Table for the main comparison).
Potential biases in the review process
The major weakness of this review was the discrepancy between pooled RR and HR analyses for all‐cause mortality, which was due to the inconsistent reporting of number of events in the non‐ischaemic participants across the studies. We could not pool two large‐scale trials in the RR analysis since they did not report the number of events in the non‐ischaemic subgroups (COMPANION; SCD‐HeFT). Other systematic reviews attempted to compensate for this problem by pooling RR and HR into a single meta‐analysis. However, we refrained from pooling time‐to‐event and dichotomous data as other reviews did.
Our systematic approach to searching, study selection, and data extraction should have minimised the likelihood of missing relevant studies or relevant data.
Agreements and disagreements with other studies or reviews
Our searching strategy, last updated in April 2018, has identified 20 published systematic reviews and meta‐analyses on this topic (Golwala 2016; Akel 2017; Akinapelli 2017; Barakat 2017; Kolodziejczak 2017; Luni 2017; Masri 2017; Narayanan 2017; Omar 2017; Romero 2017; Shah 2017; Shun‐Shin 2017; Singh 2017; Stavrakis 2017; Turagam 2017; Wolff 2017; Xing 2017; Al‐Khatib 2017a; Alba 2018; Beggs 2018). Despite this large number, there are many differences between these studies and our study. We grouped the major differences under the following four categories: outcomes, analysis, 'Risk of bias' assessment, and certainty of evidence assessment. We have included a table that displays some of the differences between the reviews (see Table 3; Table 4).
Outcomes
Our paper is the only review to include non‐mortality‐related outcomes. We are the only study to address quality of life, adverse events, and cost‐effectiveness. While Wolff and colleagues reported the device‐related complications for each trial, they did not conduct an analysis to determine whether participants in the ICD arm were more likely to experience adverse events than participants in the control arm (Wolff 2017).
Analysis
We are the only review to perform both RR and HR meta‐analyses for all mortality‐related outcomes. While Alba and colleagues conducted a meta‐analysis on all‐cause mortality using HR and RR, they did not do so for other outcomes (Alba 2018). By employing this approach, we were able to maximise the amount of data that could be used in the analysis. For some outcomes, more data were available for HR than for RR, and more studies could be pooled for HR. For other outcomes, more data were available for RR than for HR, and more studies could be pooled for RR.
The pooled effect estimates for all‐cause mortality were consistent among all studies, ranging from 0.75 (95% CI 0.61 to 0.93), Al‐Khatib 2017a, to 0.87 (95% CI 0.67 to 0.96), Akel 2017. To our knowledge, our review is the first to pool the HR from all six identified RCTs for the primary analysis. Other reviews that included the six RCTs pooled HR and RR into a single analysis, especially when the HR was not explicitly displayed (AMIOVIRT; CAT), or when data for the non‐ischaemic subgroup could not be extracted from the COMPANION and SCD‐HeFT studies. The SCD‐HeFT study provides the HR for all‐cause mortality in participants with non‐ischaemic cardiomyopathy with a 97.5% CI. Only two reviews beside ours converted this number to a 95% CI (Shun‐Shin 2017; Al‐Khatib 2017a). The remaining reviews pooled the HR and its 97.5% CI with the HRs and their 95% CI of other studies.
Most studies did not include the COMPANION trial. Of the studies that did, five included the HR of CRT‐D versus optimal medical therapy (Golwala 2016; Luni 2017; Masri 2017; Stavrakis 2017; Beggs 2018), and two others included the HR of CRT‐D versus CRT‐P of ischaemic and non‐ischaemic participants combined (Singh 2017; Turagam 2017). Only one study included COMPANION and had the same effect estimate as ours, however it is unclear how they derived its 95% CI (Shun‐Shin 2017).
'Risk of bias' assessment
Several studies conducted a 'Risk of bias' assessment for the included trials. Our review was the only one to include an explanation for each judgement in the 'Risk of bias' table. Shun‐Shin and colleagues provided an elaborate table on risk of bias assessment, however not all judgements were justified (Shun‐Shin 2017).
Certainty of evidence assessment
Two studies reported using the GRADE methodology to assess the certainty of the evidence of the outcomes included (Barakat 2017; Alba 2018); only one of these studies included a 'Summary of findings' table (Alba 2018). This study reported using the random‐effects model in their meta‐analysis. However, the RR (and its 95% CI) of cardiovascular mortality displayed in the 'Summary of findings' table suggests that they conducted their analysis using the fixed‐effect model. The CI interval was subsequently narrowed to the point that it did not cross 1, therefore they considered the outcome not to be imprecise and assessed the certainty of evidence as high. We conducted a similar analysis for this outcome using the random‐effects model. The 95% CI crossed 1, and we downgraded the certainty of evidence to moderate due to imprecision.
Finally, we used GRADE to assess the certainty of evidence for all outcomes, not only those reported in our 'Summary of findings' table.
We are in the process of drafting a paper that further explores the differences between all the reviews.

Study flow diagram.

Risk of bias graph: review authors' judgements about each risk of bias item presented as percentages across all included studies.

Risk of bias summary: review authors' judgements about each risk of bias item for each included study.
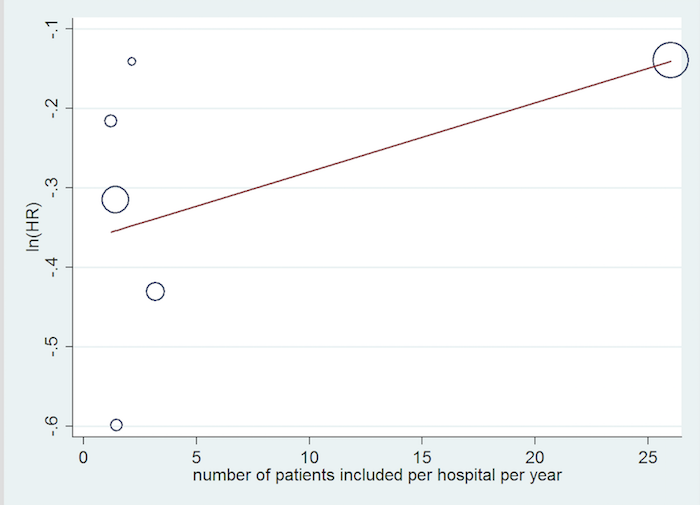
Inclusion rate meta‐regression.

Comparison 1 ICD plus optimal medical therapy compared to optimal medical therapy alone, Outcome 1 All‐cause mortality (HR) ‐ main analysis.

Comparison 1 ICD plus optimal medical therapy compared to optimal medical therapy alone, Outcome 2 All‐cause mortality (RR).
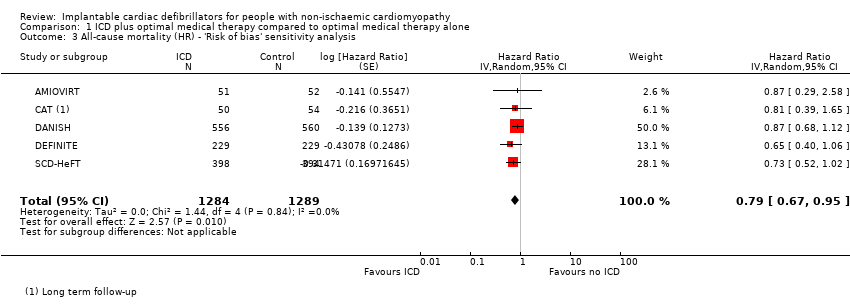
Comparison 1 ICD plus optimal medical therapy compared to optimal medical therapy alone, Outcome 3 All‐cause mortality (HR) ‐ 'Risk of bias' sensitivity analysis.
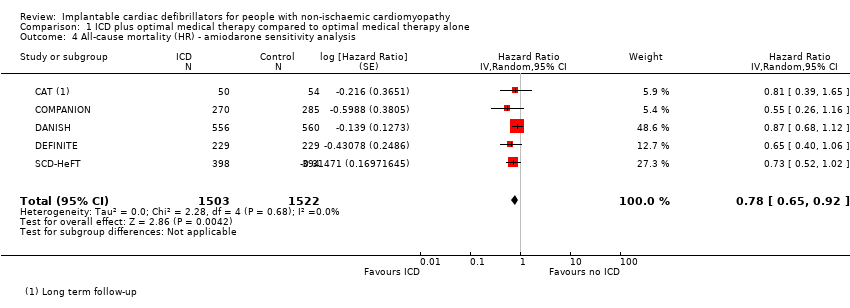
Comparison 1 ICD plus optimal medical therapy compared to optimal medical therapy alone, Outcome 4 All‐cause mortality (HR) ‐ amiodarone sensitivity analysis.
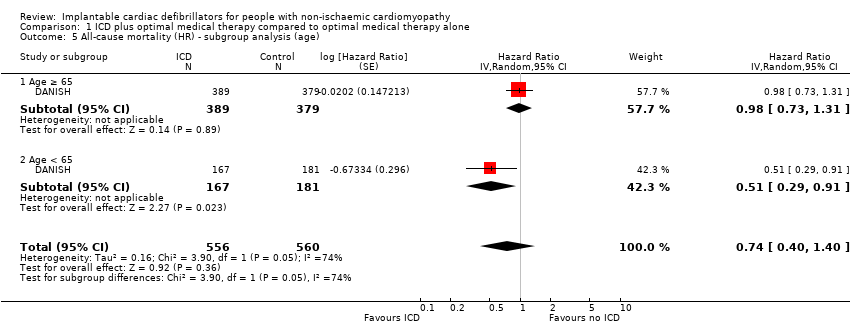
Comparison 1 ICD plus optimal medical therapy compared to optimal medical therapy alone, Outcome 5 All‐cause mortality (HR) ‐ subgroup analysis (age).

Comparison 1 ICD plus optimal medical therapy compared to optimal medical therapy alone, Outcome 6 All‐cause mortality (HR) ‐ subgroup analysis (gender).

Comparison 1 ICD plus optimal medical therapy compared to optimal medical therapy alone, Outcome 7 All‐cause mortality (HR) ‐ subgroup analysis (CRT).

Comparison 1 ICD plus optimal medical therapy compared to optimal medical therapy alone, Outcome 8 All‐cause mortality (HR) ‐ subgroup analysis (NYHA).

Comparison 1 ICD plus optimal medical therapy compared to optimal medical therapy alone, Outcome 9 All‐cause mortality (HR) ‐ subgroup analysis (heart failure duration).

Comparison 1 ICD plus optimal medical therapy compared to optimal medical therapy alone, Outcome 10 All‐cause mortality (HR) ‐ subgroup analysis (LVEF).

Comparison 1 ICD plus optimal medical therapy compared to optimal medical therapy alone, Outcome 11 All‐cause mortality (HR) ‐ subgroup analysis (year of publication).

Comparison 1 ICD plus optimal medical therapy compared to optimal medical therapy alone, Outcome 12 All‐cause mortality (HR) ‐ subgroup analysis (mean follow‐up time).

Comparison 1 ICD plus optimal medical therapy compared to optimal medical therapy alone, Outcome 13 Cardiovascular mortality (HR).
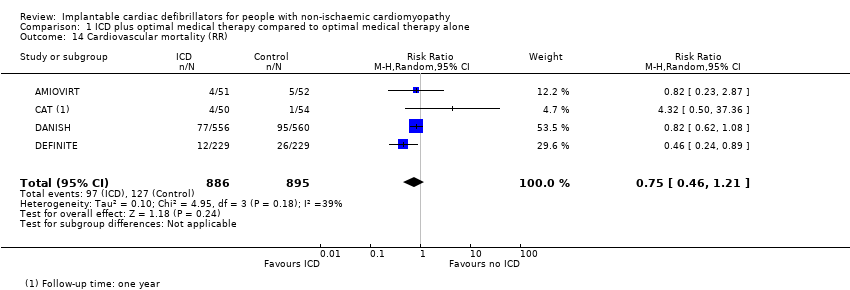
Comparison 1 ICD plus optimal medical therapy compared to optimal medical therapy alone, Outcome 14 Cardiovascular mortality (RR).
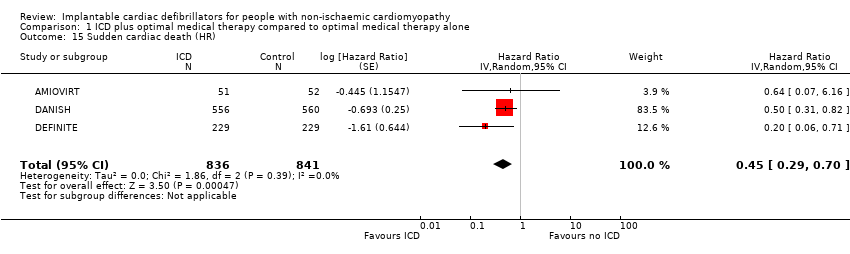
Comparison 1 ICD plus optimal medical therapy compared to optimal medical therapy alone, Outcome 15 Sudden cardiac death (HR).
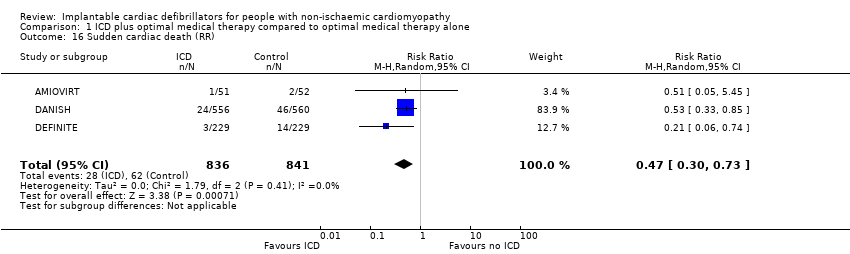
Comparison 1 ICD plus optimal medical therapy compared to optimal medical therapy alone, Outcome 16 Sudden cardiac death (RR).

Comparison 1 ICD plus optimal medical therapy compared to optimal medical therapy alone, Outcome 17 Adverse events ‐ device infection (RR).
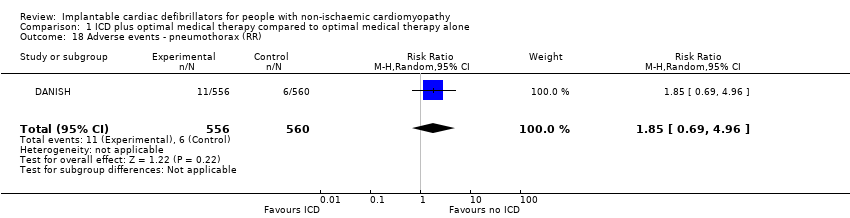
Comparison 1 ICD plus optimal medical therapy compared to optimal medical therapy alone, Outcome 18 Adverse events ‐ pneumothorax (RR).
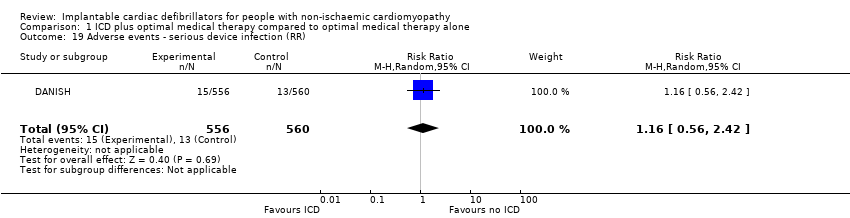
Comparison 1 ICD plus optimal medical therapy compared to optimal medical therapy alone, Outcome 19 Adverse events ‐ serious device infection (RR).

Comparison 1 ICD plus optimal medical therapy compared to optimal medical therapy alone, Outcome 20 Adverse events ‐ bleeding requiring intervention (RR).
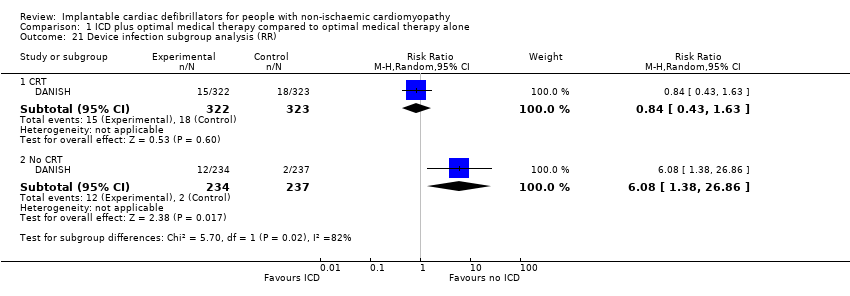
Comparison 1 ICD plus optimal medical therapy compared to optimal medical therapy alone, Outcome 21 Device infection subgroup analysis (RR).

Comparison 1 ICD plus optimal medical therapy compared to optimal medical therapy alone, Outcome 22 Serious device infection subgroup analysis (RR).
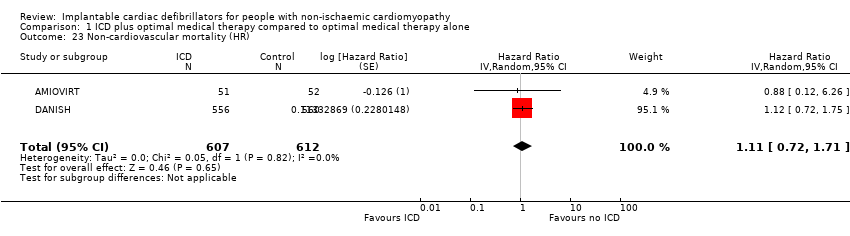
Comparison 1 ICD plus optimal medical therapy compared to optimal medical therapy alone, Outcome 23 Non‐cardiovascular mortality (HR).

Comparison 1 ICD plus optimal medical therapy compared to optimal medical therapy alone, Outcome 24 Non‐cardiovascular mortality (RR).
| ICD plus optimal medical therapy compared to optimal medical therapy alone for people with non‐ischaemic cardiomyopathy Population: people with non‐ischaemic cardiomyopathy Setting: USA, Israel, New Zealand, Canada, Germany, and Denmark Intervention: implantable cardioverter‐defibrillator in addition to optimal medical therapy Comparator: optimal medical therapy alone | |||||
| Outcomes length of follow‐up (range) | № of participants | Certainty of the evidence | Relative effect | Anticipated absolute effects* (95% CI) | |
| Risk with optimal medical therapy alone | Risk difference with ICD plus optimal medical therapy | ||||
| All‐cause mortality (HR) ‐ main analysisa 16.5 to 67.6 months | 3128 | ⊕⊕⊕⊕ | HR 0.78 | Study population | |
| 216 per 1000 | 43 fewer per 1000 | ||||
| Cardiovascular mortality (RR)b 22.8 to 67.6 months | 1781 | ⊕⊕⊕⊝ | RR 0.75 | Study population | |
| 142 per 1000 | 35 fewer per 1000 | ||||
| Sudden cardiac death (HR)a 24 to 67.6 months | 1677 | ⊕⊕⊕⊕ | HR 0.45 | Study population | |
| 74 per 1000 | 40 fewer per 1000 | ||||
| Adverse events 67.7 months | 1116 | ⊕⊕⊕⊝ | ‐ | The adverse events reported were: device infection, serious device infection, bleeding requiring intervention, and pneumothorax. An analysis of 1116 participants showed that ICD when added to optimal medical therapy probably increases the risk of device infection and pneumothorax (RR 1.36, 95% CI 0.77 to 2.40 and RR 1.85, 95% CI 0.69 to 4.96, respectively). Implantable cardioverter‐defibrillator probably slightly increases the risk for serious device infection (RR 1.16, 95% CI 0.56 to 2.42) and may increase the risk for bleeding requiring intervention (RR 3.02, 95% CI 0.12 to 74.01). | |
| Noncardiovascular mortality (RR)b 22.8 to 67.6 months | 1781 | ⊕⊕⊕⊝ | RR 1.17 | Study population | |
| 57 per 1000 | 10 more per 1000 | ||||
| Health‐related quality of life 24 to 29 months | 561 | ⊕⊕⊕⊝ | ‐ | The health‐related quality of life of 561 participants extracted from 2 studies was evaluated using 4 different scales. None of the studies showed a statistically significant difference in score between the ICD and the control group. | |
| First ICD‐related hospitalisation ‐ not reported | ‐ | ‐ | ‐ | ‐ | ‐ |
| *The risk in the intervention group (and its 95% confidence interval) is based on the assumed risk in the comparison group and the relative effect of the intervention (and its 95% CI). | |||||
| GRADE Working Group grades of evidence | |||||
| aBoth HR and RR were calculated. However, we reported HR since it is more informative for this outcome, pooling more participants than RR. 1One of six studies appears to be at high risk of bias (COMPANION). However, the weight of this study in the meta‐analysis was only 5.3%. We conducted a sensitivity analysis excluding this study, and the results did not change significantly. | |||||
| Study | Questionnaire | Total number of participants | Measure | Baseline score | Score/change at 3 months | Score/change at 6 months | Score/change at 12 months | Score/change at 30 months | Notes | |
| Quality of Well‐Being Schedule | 103 | Baseline vs 1 year (mean ± SD) | Amiodarone: 70 ± 17 | N/A | N/A | Amiodarone: 70 ± 22 | N/A | Scores were not significantly different at 1 year between ICD and amiodarone groups (P > 0.05). | ||
| State‐Trait Anxiety Inventory | Amiodarone: 79 ± 21 | Amiodarone: 67 ± 20 | ||||||||
| MLHFQ | Physical | 458 | Change in quality of life (mean ± SD per month) | Placebo: 20 ± 12 | Placebo: ‐0.7 ± 0.1/month | N/A | Placebo: 0.7 ± 0.3/year | No significant difference in long‐term MLHFQ scores between ICD and control groups | ||
| Emotional | Placebo: 10 ± 8 | Placebo: ‐1.6 ± 0.2/month | N/A | |||||||
| SF‐12 | Physical (PCS) | Placebo: 38 ± 10 | Placebo: +1.0 ± 0.2/month | Placebo: ‐0.4 ± 0.3/year | No significant difference in long‐term PCS scores between ICD and placebo groups | |||||
| Mental (MCS) | Placebo: 47 ± 11 | Placebo: 0.3 ± 0.2/month | Placebo: ‐1.8 ± 0.3/year | No significant difference in long‐term MCS scores between ICD and placebo groups (P = 0.89) | ||||||
| Abbreviations: ICD: implantable cardioverter‐defibrillator; MCS: mental component summary; MLHFQ: Minnesota Living With Heart Failure Questionnaire; N/A: not available; PCS: physical component symmary; SD: standard deviation; SF‐12: 12‐item Short Form Health Survey 195% confidence intervals for difference in mean values for continuous variables. | ||||||||||
| Study | Start year | End year | Duration | Country | Number of participants | Number of centres | Number of patients included per hospital per year |
| 1996 | 2001 | 4 years 10 months | USA | 103 | 10 | 2.13 | |
| 1991 | 1997 | 5 years 9 months | Germany | 104 | 15 | 1.21 | |
| 2000 | 2002 | 3 years | USA | 555 | 128 | 1.45 | |
| 2007 | 2016 | 8 years 7 months | Denmark | 1116 | 5 | 26 | |
| 2002 | 2004 | 3 years | USA/Israel | 458 | 48 | 3.18 | |
| 1997 | 2001 | 3 years 10 months | Canada/New Zealand/USA | 792 | 148 | 1.40 |
| Our study | |||||||||||||||||||||
| Outcomes | All‐cause mortality | Yes | 0.78 (0.66, 0.92) | Yes | 0.8 (0.67, 0.96) | Yes | 0.88 (0.73, 1.07) | Yes | 0.78 (0.66, 0.92) | Yes | 0.75 (0.61, 0.93) | Yes | 0.79 (0.64, 0.93) | Yes | 0.76 (0.65, 0.91) | Yes | 0.77 (0.64, 0.91) | Yes | 0.81 (0.72, 0.91) | Yes | 0.76 (0.64, 0.91) |
| Cardiovascular mortality | Yes | 0.80 (0.47, 1.35) | No | Yes | 0.66 (0.42, 1.03) | Yes | 0.77 (0.60, 0.98) | No | No | No | No | Yes | 0.80 (0.40, 1.59) | No | |||||||
| Sudden cardiac death | Yes | 0.45 (0.29, 0.70) | Yes | 0.51 (0.34, 0.76) | Yes | 0.47 (0.30, 0.73) | Yes | 0.45 (0.29, 0.70) | No | Yes | 0.47 (0.30, 0.73) | No | No | Yes | 0.44 (0.17, 1.12) | No | |||||
| Non‐cardiovascular mortality | Yes | 1.17 (0.81, 1.68) | No | No | No | No | No | No | No | Yes | 1.08 (0.58, 2.02) | No | |||||||||
| Adverse events | Yes | No | No | No | No | No | No | No | No | No | |||||||||||
| Cost‐effectiveness | Yes | No | No | No | No | No | No | No | No | No | |||||||||||
| Studies included | Yes | No | No | Yes | No | No | Yes | Yes | No | Yes | |||||||||||
| Yes | Yes | Yes | Yes | Yes | Yes | Yes | Yes | Yes | Yes | ||||||||||||
| Yes | Yes | Yes | Yes | No | Yes | Yes | Yes | Yes | Yes | ||||||||||||
| Yes | Yes | Yes | Yes | Yes | Yes | Yes | Yes | Yes | Yes | ||||||||||||
| Yes | Yes | Yes | Yes | Yes | Yes | Yes | Yes | Yes | Yes | ||||||||||||
| Yes | Yes | No | Yes | Yes | Yes | Yes | Yes | Yes | Yes | ||||||||||||
| Analysis performed (HR/RR/OR) | HR & HR | HR | RR | HR & RR | HR | HR | RR | HR | HR | OR | |||||||||||
| GRADE | Yes | No | No | Yes | No | Yes | No | No | No | No | |||||||||||
| Risk of bias | Yes | No | No | Yes | No | Yes | No | No | Yes | Yes | |||||||||||
| Subgroup analysis | Yes | No | No | No | No | Yes | No | No | Yes | No | |||||||||||
| HR: hazard ratio; OR: odds ratio; RR: risk ratio | |||||||||||||||||||||
| Outcomes | All‐cause mortality | Yes | 0.79 (0.66, 0.91) | Yes | 0.84 (0.71, 0.99) | Yes | 0.832 (0.712, 0.973) | Yes | 0.76 (0.64, 0.90) | Yes | 0.79 (0.68, 0.91) | Yes | 0.78 (0.66, 0.92) | Yes | 0.75 (0.64, 0.89) | Yes | 0.77 (0.64, 0.93) | Yes | 0.83 (0.71, 0.97) | Yes | 0.76 (0.64, 0.91) | Yes | 0.76 (0.63, 0.91) |
| Cardiovascular mortality | No | No | No | No | No | No | No | Yes | 0.83 (0.62, 1.12) | No | Yes | 0.75 (0.39, 1.44) | No | ||||||||||
| Sudden cardiac death | No | Yes | 0.47 (0.30, 0.73) | No | No | No | Yes | 0.46 (0.29, 0.71) | Yes | 0.45 (0.28, 0.71) | Yes | 0.43 (0.27, 0.69) | Yes | 0.54 (0.21, 1.37) | Yes | 0.40 (0.18, 0.90) | Yes | 0.27 (0.15, 0.50) | |||||
| Non‐cardiovascular mortality | No | No | No | No | No | No | No | Yes | 1.18 (0.76, 1.83) | No | No | No | |||||||||||
| Adverse events | No | No | No | No | No | No | No | No | No | No | No | ||||||||||||
| Cost‐effectiveness | No | No | No | No | No | No | No | No | No | No | No | ||||||||||||
| Studies included | Yes | No | No | Yes | Yes | Yes | Yes | No | No | Yes | Yes | ||||||||||||
| Yes | Yes | Yes | Yes | Yes | Yes | Yes | Yes | Yes | Yes | Yes | |||||||||||||
| Yes | Yes | Yes | Yes | Yes | Yes | Yes | Yes | Yes | No | Yes | |||||||||||||
| Yes | Yes | Yes | Yes | Yes | Yes | Yes | Yes | Yes | Yes | Yes | |||||||||||||
| Yes | Yes | Yes | Yes | Yes | Yes | Yes | Yes | Yes | Yes | Yes | |||||||||||||
| Yes | Yes | Yes | Yes | Yes | Yes | Yes | Yes | Yes | Yes | Yes | |||||||||||||
| Analysis performed (HR/RR/OR) | RR | RR | RR | HR | RR | HR | RR | OR | RR | RR | RR | ||||||||||||
| GRADE | No | No | No | No | No | No | No | No | Yes | No | No | ||||||||||||
| Risk of bias | No | Yes | No | Yes | No | No | No | Yes | No | Yes | No | ||||||||||||
| Subgroup analysis | No | No | No | No | No | Yes | No | No | No | No | Yes | ||||||||||||
| HR: hazard ratio; OR: odds ratio; RR: risk ratio | |||||||||||||||||||||||
| Outcome or subgroup title | No. of studies | No. of participants | Statistical method | Effect size |
| 1 All‐cause mortality (HR) ‐ main analysis Show forest plot | 6 | 3128 | Hazard Ratio (Random, 95% CI) | 0.78 [0.66, 0.92] |
| 2 All‐cause mortality (RR) Show forest plot | 4 | 1781 | Risk Ratio (M‐H, Random, 95% CI) | 0.87 [0.72, 1.05] |
| 3 All‐cause mortality (HR) ‐ 'Risk of bias' sensitivity analysis Show forest plot | 5 | 2573 | Hazard Ratio (Random, 95% CI) | 0.79 [0.67, 0.95] |
| 4 All‐cause mortality (HR) ‐ amiodarone sensitivity analysis Show forest plot | 5 | 3025 | Hazard Ratio (Random, 95% CI) | 0.78 [0.65, 0.92] |
| 5 All‐cause mortality (HR) ‐ subgroup analysis (age) Show forest plot | 1 | 1116 | Hazard Ratio (Random, 95% CI) | 0.74 [0.40, 1.40] |
| 5.1 Age ≥ 65 | 1 | 768 | Hazard Ratio (Random, 95% CI) | 0.98 [0.73, 1.31] |
| 5.2 Age < 65 | 1 | 348 | Hazard Ratio (Random, 95% CI) | 0.51 [0.29, 0.91] |
| 6 All‐cause mortality (HR) ‐ subgroup analysis (gender) Show forest plot | 1 | 1116 | Hazard Ratio (Random, 95% CI) | 0.88 [0.68, 1.13] |
| 6.1 Male | 1 | 809 | Hazard Ratio (Random, 95% CI) | 0.85 [0.64, 1.12] |
| 6.2 Female | 1 | 307 | Hazard Ratio (Random, 95% CI) | 1.03 [0.57, 1.87] |
| 7 All‐cause mortality (HR) ‐ subgroup analysis (CRT) Show forest plot | 6 | 3128 | Hazard Ratio (Random, 95% CI) | 0.78 [0.65, 0.92] |
| 7.1 CRT | 2 | 1200 | Hazard Ratio (Random, 95% CI) | 0.79 [0.51, 1.23] |
| 7.2 No CRT | 5 | 1928 | Hazard Ratio (Random, 95% CI) | 0.76 [0.62, 0.93] |
| 8 All‐cause mortality (HR) ‐ subgroup analysis (NYHA) Show forest plot | 1 | 1116 | Hazard Ratio (Random, 95% CI) | 0.86 [0.67, 1.10] |
| 8.1 NYHA I‐II | 1 | 597 | Hazard Ratio (Random, 95% CI) | 0.92 [0.63, 1.35] |
| 8.2 NYHA III‐IV | 1 | 519 | Hazard Ratio (Random, 95% CI) | 0.81 [0.58, 1.13] |
| 9 All‐cause mortality (HR) ‐ subgroup analysis (heart failure duration) Show forest plot | 1 | 1115 | Hazard Ratio (Random, 95% CI) | 0.83 [0.65, 1.06] |
| 9.1 Heart failure duration < 18 months | 1 | 531 | Hazard Ratio (Random, 95% CI) | 0.88 [0.54, 1.43] |
| 9.2 Heart failure duration ≥ 18 months | 1 | 584 | Hazard Ratio (Random, 95% CI) | 0.81 [0.61, 1.08] |
| 10 All‐cause mortality (HR) ‐ subgroup analysis (LVEF) Show forest plot | 1 | 1116 | Hazard Ratio (Random, 95% CI) | 0.83 [0.65, 1.07] |
| 10.1 LVEF < 25% | 1 | 506 | Hazard Ratio (Random, 95% CI) | 0.87 [0.62, 1.22] |
| 10.2 LVEF ≥ 25% | 1 | 610 | Hazard Ratio (Random, 95% CI) | 0.79 [0.55, 1.14] |
| 11 All‐cause mortality (HR) ‐ subgroup analysis (year of publication) Show forest plot | 6 | Hazard Ratio (Random, 95% CI) | 0.78 [0.66, 0.92] | |
| 11.1 Year of publication before 2003 | 2 | Hazard Ratio (Random, 95% CI) | 0.82 [0.45, 1.50] | |
| 11.2 Year of publication 2004 or after | 4 | Hazard Ratio (Random, 95% CI) | 0.77 [0.65, 0.93] | |
| 12 All‐cause mortality (HR) ‐ subgroup analysis (mean follow‐up time) Show forest plot | 6 | Hazard Ratio (Random, 95% CI) | 0.78 [0.66, 0.92] | |
| 12.1 Mean follow‐up time < 36 months | 2 | Hazard Ratio (Random, 95% CI) | 0.68 [0.44, 1.06] | |
| 12.2 Mean follow‐up time ≥ 36 months | 4 | Hazard Ratio (Random, 95% CI) | 0.80 [0.66, 0.96] | |
| 13 Cardiovascular mortality (HR) Show forest plot | 2 | 1219 | Hazard Ratio (Random, 95% CI) | 0.78 [0.58, 1.05] |
| 14 Cardiovascular mortality (RR) Show forest plot | 4 | 1781 | Risk Ratio (M‐H, Random, 95% CI) | 0.75 [0.46, 1.21] |
| 15 Sudden cardiac death (HR) Show forest plot | 3 | 1677 | Hazard Ratio (Random, 95% CI) | 0.45 [0.29, 0.70] |
| 16 Sudden cardiac death (RR) Show forest plot | 3 | 1677 | Risk Ratio (M‐H, Random, 95% CI) | 0.47 [0.30, 0.73] |
| 17 Adverse events ‐ device infection (RR) Show forest plot | 1 | 1116 | Risk Ratio (M‐H, Random, 95% CI) | 1.36 [0.77, 2.40] |
| 18 Adverse events ‐ pneumothorax (RR) Show forest plot | 1 | 1116 | Risk Ratio (M‐H, Random, 95% CI) | 1.85 [0.69, 4.96] |
| 19 Adverse events ‐ serious device infection (RR) Show forest plot | 1 | 1116 | Risk Ratio (M‐H, Random, 95% CI) | 1.16 [0.56, 2.42] |
| 20 Adverse events ‐ bleeding requiring intervention (RR) Show forest plot | 1 | 1116 | Risk Ratio (M‐H, Random, 95% CI) | 3.02 [0.12, 74.01] |
| 21 Device infection subgroup analysis (RR) Show forest plot | 1 | Risk Ratio (M‐H, Random, 95% CI) | Subtotals only | |
| 21.1 CRT | 1 | 645 | Risk Ratio (M‐H, Random, 95% CI) | 0.84 [0.43, 1.63] |
| 21.2 No CRT | 1 | 471 | Risk Ratio (M‐H, Random, 95% CI) | 6.08 [1.38, 26.86] |
| 22 Serious device infection subgroup analysis (RR) Show forest plot | 1 | Risk Ratio (M‐H, Random, 95% CI) | Subtotals only | |
| 22.1 CRT | 1 | 645 | Risk Ratio (M‐H, Random, 95% CI) | 0.82 [0.34, 1.95] |
| 22.2 No CRT | 1 | 471 | Risk Ratio (M‐H, Random, 95% CI) | 3.04 [0.62, 14.90] |
| 23 Non‐cardiovascular mortality (HR) Show forest plot | 2 | 1219 | Hazard Ratio (Random, 95% CI) | 1.11 [0.72, 1.71] |
| 24 Non‐cardiovascular mortality (RR) Show forest plot | 4 | 1781 | Risk Ratio (M‐H, Random, 95% CI) | 1.17 [0.81, 1.68] |