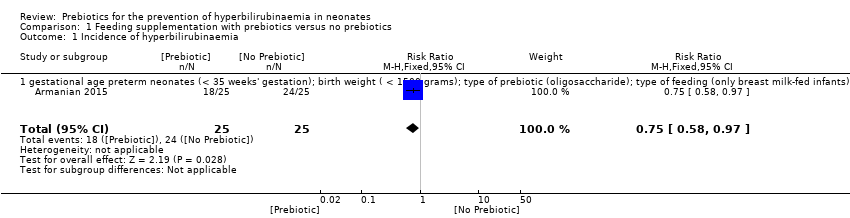
| 1 Incidence of hyperbilirubinaemia Show forest plot | 1 | 50 | Risk Ratio (M‐H, Fixed, 95% CI) | 0.75 [0.58, 0.97] |
|
| 1.1 gestational age preterm neonates (< 35 weeks' gestation); birth weight ( < 1500 grams); type of prebiotic (oligosaccharide); type of feeding (only breast milk‐fed infants) | 1 | 50 | Risk Ratio (M‐H, Fixed, 95% CI) | 0.75 [0.58, 0.97] |
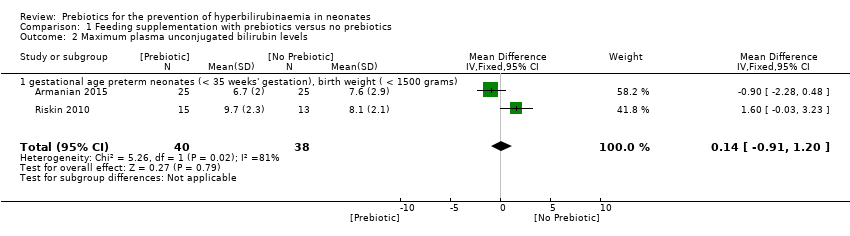
| 2 Maximum plasma unconjugated bilirubin levels Show forest plot | 2 | 78 | Mean Difference (IV, Fixed, 95% CI) | 0.14 [‐0.91, 1.20] |
|
| 2.1 gestational age preterm neonates (< 35 weeks' gestation), birth weight ( < 1500 grams) | 2 | 78 | Mean Difference (IV, Fixed, 95% CI) | 0.14 [‐0.91, 1.20] |
| 3 Maximum plasma unconjugated bilirubin levels Show forest plot | 2 | 78 | Mean Difference (IV, Fixed, 95% CI) | 0.14 [‐0.91, 1.20] |
|
| 3.1 breastfed only infants, oligosaccharide | 1 | 50 | Mean Difference (IV, Fixed, 95% CI) | ‐0.90 [‐2.28, 0.48] |
| 3.2 given a mixed form of feeding, lactulose | 1 | 28 | Mean Difference (IV, Fixed, 95% CI) | 1.60 [‐0.03, 3.23] |
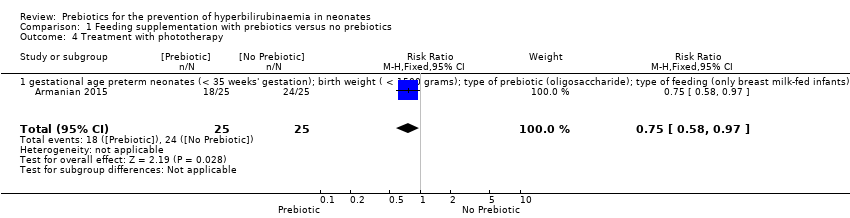
| 4 Treatment with phototherapy Show forest plot | 1 | 50 | Risk Ratio (M‐H, Fixed, 95% CI) | 0.75 [0.58, 0.97] |
|
| 4.1 gestational age preterm neonates (< 35 weeks' gestation); birth weight ( < 1500 grams); type of prebiotic (oligosaccharide); type of feeding (only breast milk‐fed infants) | 1 | 50 | Risk Ratio (M‐H, Fixed, 95% CI) | 0.75 [0.58, 0.97] |
| 5 Stool frequency: gestational age Show forest plot | 3 | 154 | Mean Difference (IV, Fixed, 95% CI) | 1.18 [0.90, 1.46] |
|
| 5.1 term neonates (gestational age ≥ 37 weeks) | 1 | 76 | Mean Difference (IV, Fixed, 95% CI) | 1.7 [1.34, 2.06] |
| 5.2 preterm neonates (< 35 weeks' gestation) | 2 | 78 | Mean Difference (IV, Fixed, 95% CI) | 0.4 [‐0.05, 0.85] |
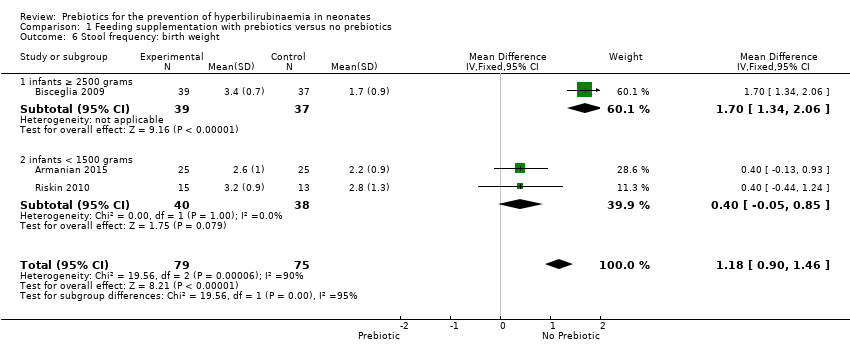
| 6 Stool frequency: birth weight Show forest plot | 3 | 154 | Mean Difference (IV, Fixed, 95% CI) | 1.18 [0.90, 1.46] |
|
| 6.1 infants ≥ 2500 grams | 1 | 76 | Mean Difference (IV, Fixed, 95% CI) | 1.7 [1.34, 2.06] |
| 6.2 infants < 1500 grams | 2 | 78 | Mean Difference (IV, Fixed, 95% CI) | 0.4 [‐0.05, 0.85] |
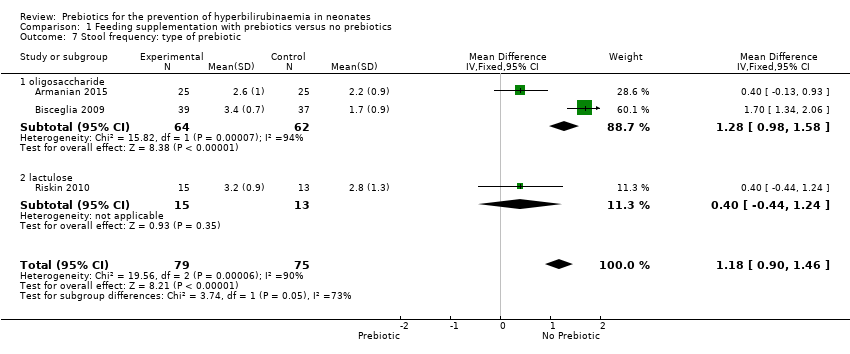
| 7 Stool frequency: type of prebiotic Show forest plot | 3 | 154 | Mean Difference (IV, Fixed, 95% CI) | 1.18 [0.90, 1.46] |
|
| 7.1 oligosaccharide | 2 | 126 | Mean Difference (IV, Fixed, 95% CI) | 1.28 [0.98, 1.58] |
| 7.2 lactulose | 1 | 28 | Mean Difference (IV, Fixed, 95% CI) | 0.40 [‐0.44, 1.24] |
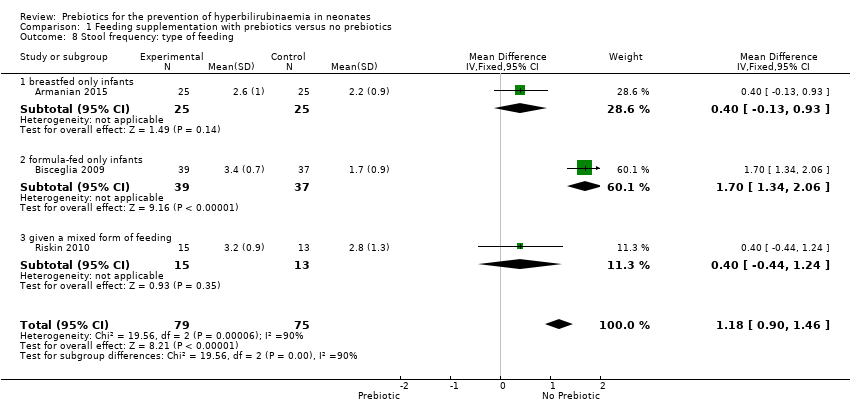
| 8 Stool frequency: type of feeding Show forest plot | 3 | 154 | Mean Difference (IV, Fixed, 95% CI) | 1.18 [0.90, 1.46] |
|
| 8.1 breastfed only infants | 1 | 50 | Mean Difference (IV, Fixed, 95% CI) | 0.40 [‐0.13, 0.93] |
| 8.2 formula‐fed only infants | 1 | 76 | Mean Difference (IV, Fixed, 95% CI) | 1.7 [1.34, 2.06] |
| 8.3 given a mixed form of feeding | 1 | 28 | Mean Difference (IV, Fixed, 95% CI) | 0.40 [‐0.44, 1.24] |
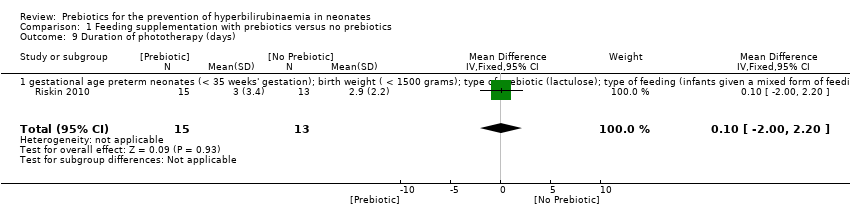
| 9 Duration of phototherapy (days) Show forest plot | 1 | 28 | Mean Difference (IV, Fixed, 95% CI) | 0.10 [0.00, 2.20] |
|
| 9.1 gestational age preterm neonates (< 35 weeks' gestation); birth weight ( < 1500 grams); type of prebiotic (lactulose); type of feeding (infants given a mixed form of feeding) | 1 | 28 | Mean Difference (IV, Fixed, 95% CI) | 0.10 [0.00, 2.20] |
| 10 Length of hospital stay (days) Show forest plot | 2 | 78 | Mean Difference (IV, Fixed, 95% CI) | ‐10.57 [‐17.81, ‐3.33] |
|
| 10.1 gestational age preterm neonates (< 35 weeks' gestation), birth weight ( < 1500 grams) | 2 | 78 | Mean Difference (IV, Fixed, 95% CI) | ‐10.57 [‐17.81, ‐3.33] |
| 11 Length of hospital stay (days) Show forest plot | 2 | 78 | Mean Difference (IV, Fixed, 95% CI) | ‐10.57 [‐17.81, ‐3.33] |
|
| 11.1 breastfed only infants, oligosaccharide | 1 | 50 | Mean Difference (IV, Fixed, 95% CI) | ‐10.2 [‐17.59, ‐2.81] |
| 11.2 given a mixed form of feeding, lactulose | 1 | 28 | Mean Difference (IV, Fixed, 95% CI) | ‐19.10 [‐54.58, 16.38] |
| 12 Neonatal mortality Show forest plot | 2 | 78 | Risk Ratio (M‐H, Fixed, 95% CI) | 0.94 [0.14, 6.19] |
|
| 12.1 gestational age preterm neonates (< 35 weeks' gestation), birth weight ( < 1500 grams) | 2 | 78 | Risk Ratio (M‐H, Fixed, 95% CI) | 0.94 [0.14, 6.19] |
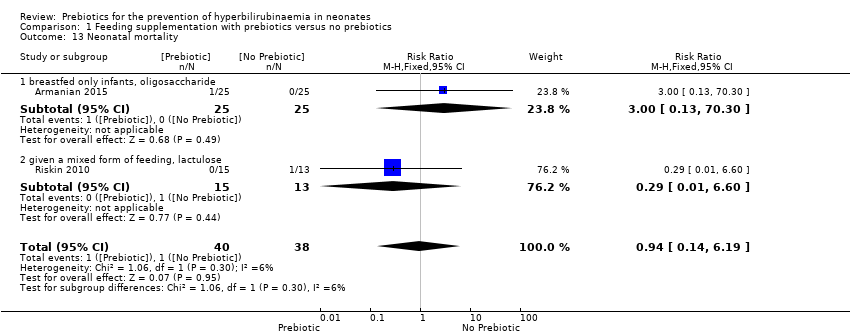
| 13 Neonatal mortality Show forest plot | 2 | 78 | Risk Ratio (M‐H, Fixed, 95% CI) | 0.94 [0.14, 6.19] |
|
| 13.1 breastfed only infants, oligosaccharide | 1 | 50 | Risk Ratio (M‐H, Fixed, 95% CI) | 3.0 [0.13, 70.30] |
| 13.2 given a mixed form of feeding, lactulose | 1 | 28 | Risk Ratio (M‐H, Fixed, 95% CI) | 0.29 [0.01, 6.60] |