Prebióticos para prevenir la hiperbilirrubinemia en recién nacidos
Appendices
Appendix 1. Standard search methodology
PubMed: ((infant, newborn[MeSH] OR newborn OR neonate OR neonatal OR premature OR low birth weight OR VLBW OR LBW or infan* or neonat*) AND (randomized controlled trial [pt] OR controlled clinical trial [pt] OR randomized [tiab] OR placebo [tiab] OR drug therapy [sh] OR randomly [tiab] OR trial [tiab] OR groups [tiab]) NOT (animals [mh] NOT humans [mh]))
Embase: (infant, newborn or newborn or neonate or neonatal or premature or very low birth weight or low birth weight or VLBW or LBW or Newborn or infan* or neonat*) AND (human not animal) AND (randomized controlled trial or controlled clinical trial or randomized or placebo or clinical trials as topic or randomly or trial or clinical trial)
CINAHL: (infant, newborn OR newborn OR neonate OR neonatal OR premature OR low birth weight OR VLBW OR LBW or Newborn or infan* or neonat*) AND (randomized controlled trial OR controlled clinical trial OR randomized OR placebo OR clinical trials as topic OR randomly OR trial OR PT clinical trial)
Cochrane Library: (infant or newborn or neonate or neonatal or premature or preterm or very low birth weight or low birth weight or VLBW or LBW)
Appendix 2. Risk of bias tool
We used the standard methods of Cochrane and Cochrane Neonatal to assess the methodological quality of the trials. For each trial, we sought information regarding the method of randomisation, blinding, and reporting of all outcomes of all the infants enrolled in the trial. We assessed each criterion as being at a low, high, or unclear risk of bias. Two review authors (AMA and NS) independently assessed each study. Any disagreements were resolved by discussion or by a third assessor. We added this information to the table Characteristics of included studies. We evaluated the following issues and entered the findings into the risk of bias table:
1. Sequence generation (checking for possible selection bias). Was the allocation sequence adequately generated?
For each included study, we categorised the method used to generate the allocation sequence as:
-
low risk (any truly random process e.g. random number table; computer random number generator);
-
high risk (any non‐random process e.g. odd or even date of birth; hospital or clinic record number); or
-
unclear risk.
2. Allocation concealment (checking for possible selection bias). Was allocation adequately concealed?
For each included study, we categorised the method used to conceal the allocation sequence as:
-
low risk (e.g. telephone or central randomisation; consecutively numbered sealed opaque envelopes);
-
high risk (open random allocation; unsealed or non‐opaque envelopes, alternation; date of birth); or
-
unclear risk.
3. Blinding of participants and personnel (checking for possible performance bias). Was knowledge of the allocated intervention adequately prevented during the study?
For each included study, we categorised the methods used to blind study participants and personnel from knowledge of which intervention a participant received. Blinding was assessed separately for different outcomes or class of outcomes. We categorised the methods as:
-
low risk, high risk or unclear risk for participants; and
-
low risk, high risk or unclear risk for personnel.
4. Blinding of outcome assessment (checking for possible detection bias). Was knowledge of the allocated intervention adequately prevented at the time of outcome assessment?
For each included study, we categorised the methods used to blind outcome assessment. Blinding was assessed separately for different outcomes or class of outcomes. We categorised the methods as:
-
low risk for outcome assessors;
-
high risk for outcome assessors; or
-
unclear risk for outcome assessors.
5. Incomplete outcome data (checking for possible attrition bias through withdrawals, dropouts, protocol deviations). Were incomplete outcome data adequately addressed?
For each included study and for each outcome, we described the completeness of data including attrition and exclusions from the analysis. We noted whether attrition and exclusions were reported, the numbers included in the analysis at each stage (compared with the total randomised participants), reasons for attrition or exclusion where reported, and whether missing data were balanced across groups or were related to outcomes. Where sufficient information was reported or supplied by the trial authors, we re‐included missing data in the analyses. We categorised the methods as:
-
low risk (< 20% missing data);
-
high risk (≥ 20% missing data); or
-
unclear risk.
6. Selective reporting bias. Are reports of the study free of suggestion of selective outcome reporting?
For each included study, we described how we investigated the possibility of selective outcome reporting bias and what we found. For studies in which study protocols were published in advance, we compared prespecified outcomes versus outcomes eventually reported in the published results. If the study protocol was not published in advance, we contacted study authors to gain access to the study protocol. We assessed the methods as:
-
low risk (where it is clear that all of the study's prespecified outcomes and all expected outcomes of interest to the review have been reported);
-
high risk (where not all the study's prespecified outcomes have been reported; one or more reported primary outcomes were not prespecified outcomes of interest and are reported incompletely and so cannot be used; study fails to include results of a key outcome that would have been expected to have been reported); or
-
unclear risk.
7. Other sources of bias. Was the study apparently free of other problems that could put it at a high risk of bias?
For each included study, we described any important concerns we had about other possible sources of bias (for example, whether there was a potential source of bias related to the specific study design or whether the trial was stopped early due to some data‐dependent process). We assessed whether each study was free of other problems that could put it at risk of bias as:
-
low risk;
-
high risk;
-
unclear risk.
If needed, we explored the impact of the level of bias through undertaking sensitivity analyses.

Guidelines for phototherapy in infants at ≥ 35 weeks' gestation.
(American Academy of Pediatrics Subcommittee on Hyperbilirubinaemia. Management of hyperbilirubinaemia in the newborn infant 35 or more weeks of gestation. Pediatrics 2004;114:297.)
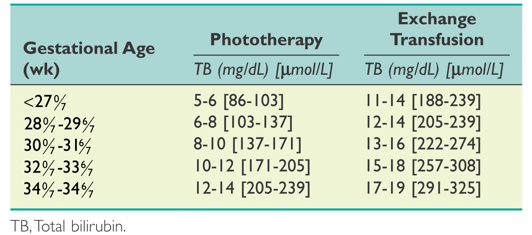
Suggested guidelines for initiating phototherapy or exchange transfusion in preterm infants (< 35 weeks' gestation).
(Maisels MJ, Watchko JF, Bhutani VK, et al. An approach to the management of hyperbilirubinaemia in the preterm infant less than 35 weeks of gestation. Journal of Perinatology 2012;32:660‐664.)
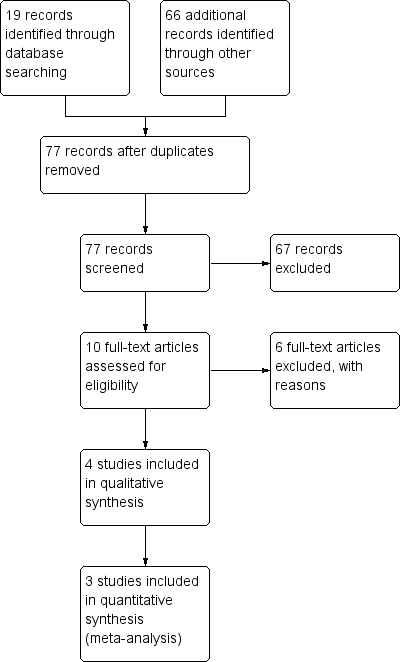
Study flow diagram.
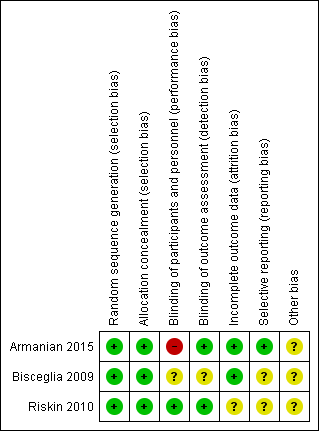
Risk of bias summary: review authors' judgements about each risk of bias item for each included study.
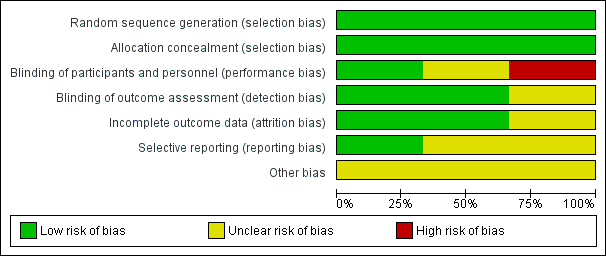
Risk of bias graph: review authors' judgements about each risk of bias item presented as percentages across all included studies.
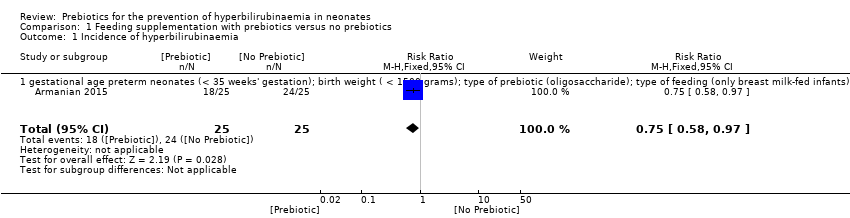
Comparison 1 Feeding supplementation with prebiotics versus no prebiotics, Outcome 1 Incidence of hyperbilirubinaemia.
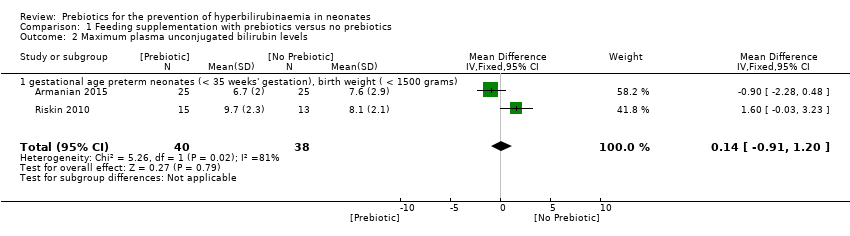
Comparison 1 Feeding supplementation with prebiotics versus no prebiotics, Outcome 2 Maximum plasma unconjugated bilirubin levels.

Comparison 1 Feeding supplementation with prebiotics versus no prebiotics, Outcome 3 Maximum plasma unconjugated bilirubin levels.
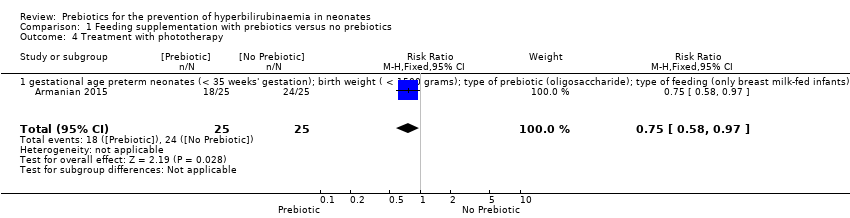
Comparison 1 Feeding supplementation with prebiotics versus no prebiotics, Outcome 4 Treatment with phototherapy.

Comparison 1 Feeding supplementation with prebiotics versus no prebiotics, Outcome 5 Stool frequency: gestational age.
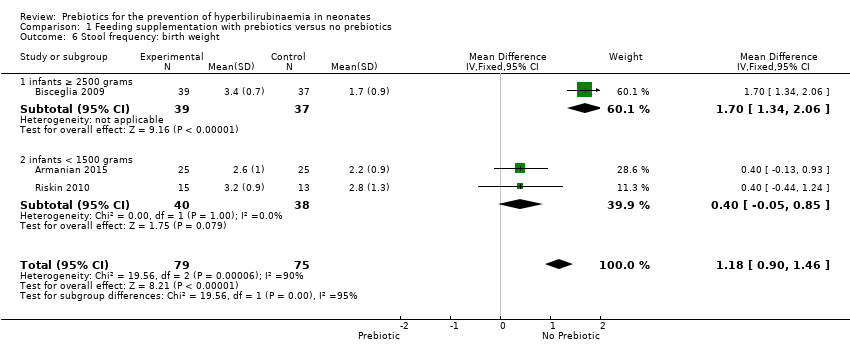
Comparison 1 Feeding supplementation with prebiotics versus no prebiotics, Outcome 6 Stool frequency: birth weight.
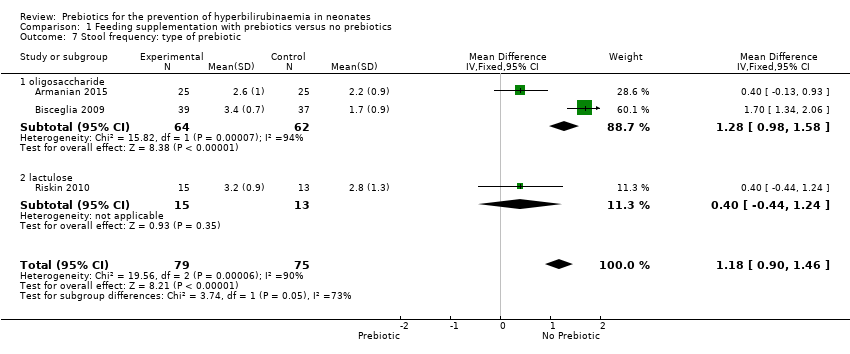
Comparison 1 Feeding supplementation with prebiotics versus no prebiotics, Outcome 7 Stool frequency: type of prebiotic.
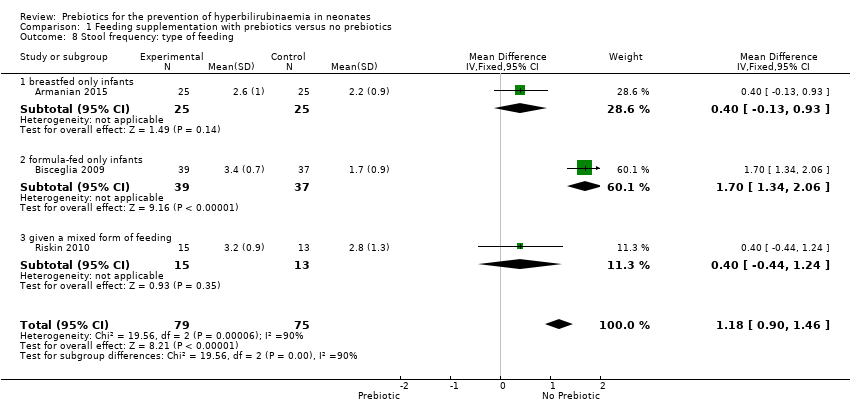
Comparison 1 Feeding supplementation with prebiotics versus no prebiotics, Outcome 8 Stool frequency: type of feeding.
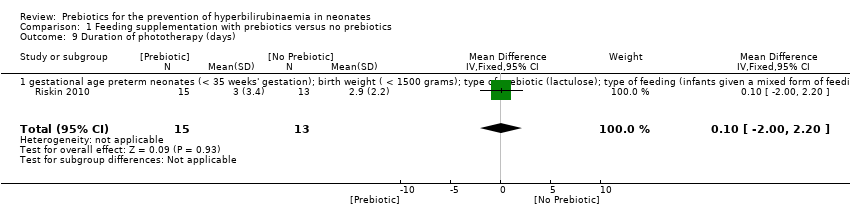
Comparison 1 Feeding supplementation with prebiotics versus no prebiotics, Outcome 9 Duration of phototherapy (days).

Comparison 1 Feeding supplementation with prebiotics versus no prebiotics, Outcome 10 Length of hospital stay (days).

Comparison 1 Feeding supplementation with prebiotics versus no prebiotics, Outcome 11 Length of hospital stay (days).

Comparison 1 Feeding supplementation with prebiotics versus no prebiotics, Outcome 12 Neonatal mortality.
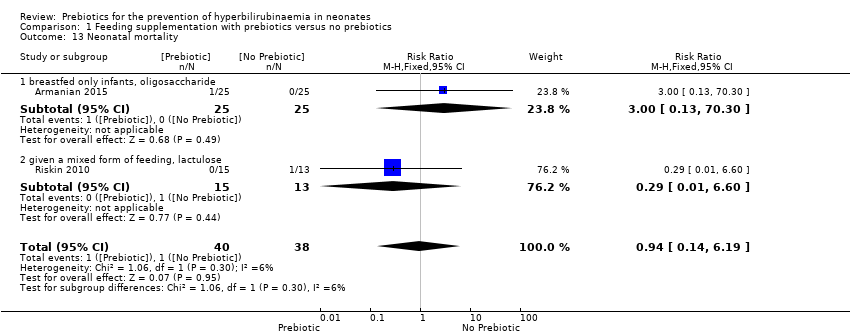
Comparison 1 Feeding supplementation with prebiotics versus no prebiotics, Outcome 13 Neonatal mortality.
| Feeding supplementation with prebiotics compared to no prebiotics for the prevention of hyperbilirubinaemia in neonates | ||||||
| Patient or population: Neonates, including term neonates (gestational age ≥ 37 weeks), late preterm neonates (35 to 37 weeks' gestation) and preterm neonates (< 35 weeks' gestation) | ||||||
| Outcomes | Anticipated absolute effects* (95% CI) | Relative effect | № of participants | Certainty of the evidence | Comments | |
| Risk with no prebiotics | Risk with Feeding supplementation with prebiotics | |||||
| Incidence of hyperbilirubinaemia | Study population | RR 0.75 | 50 | ⊕⊕⊝⊝ | ||
| 960 per 1,000 | 720 per 1,000 | |||||
| Maximum plasma unconjugated bilirubin levels; | The mean maximum plasma unconjugated bilirubin levels; ranged from 7.6 to 8.1 mg/dL | MD 0.14 mg/dL higher | ‐ | 78 | ⊕⊕⊝⊝ | |
| Treatment with phototherapy | Study population | RR 0.75 | 50 | ⊕⊕⊝⊝ | ||
| 960 per 1,000 | 720 per 1,000 | |||||
| Stool frequency | The mean stool frequency; ranged from 1 to 3 | MD 1.18 higher | ‐ | 154 | ⊕⊕⊕⊕ | |
| Duration of phototherapy (days) | The mean duration of phototherapy (days); ranged from 2 to 3 days | MD 0.1 days higher | ‐ | 28 | ⊕⊕⊝⊝ | |
| Length of hospital stay (days) | The mean length of hospital stay (days); ranged from 29 to 72 days | MD 10.57 days lower | ‐ | 78 | ⊕⊕⊝⊝ | |
| Neonatal mortality | Study population | RR 0.94 | 78 | ⊕⊕⊝⊝ | ||
| 26 per 1,000 | 25 per 1,000 | |||||
| Acute bilirubin encephalopathy (encephalopathy) | Study population | not estimable | (0 RCTs) | ‐ | None of the included studies showed any acute bilirubin encephalopathy. | |
| 0 per 1,000 | 0 per 1,000 | |||||
| Exchange transfusion (exchange) | Study population | not estimable | (0 RCTs) | ‐ | There were no reports of the need for exchange transfusion in included studies. | |
| 0 per 1,000 | 0 per 1,000 | |||||
| Chronic bilirubin encephalopathy or kernicterus (kernicterus) | Study population | not estimable | (0 RCTs) | ‐ | There were no reports of the incidence of chronic bilirubin encephalopathy in included studies. | |
| 0 per 1,000 | 0 per 1,000 | |||||
| Major neurodevelopmental disability | Study population | not estimable | (0 RCTs) | ‐ | Major neurodevelopmental disability was not reported in any of the included studies. | |
| 0 per 1,000 | 0 per 1,000 | |||||
| Side effects | Study population | not estimable | (0 RCTs) | ‐ | No side effects were reported in any of the included studies. | |
| 0 per 1,000 | 0 per 1,000 | |||||
| *The risk in the intervention group (and its 95% confidence interval) is based on the assumed risk in the comparison group and the relative effect of the intervention (and its 95% CI). | ||||||
| GRADE Working Group grades of evidence | ||||||
| a Downgraded one level due to high risk of performance bias b Downgraded one level due to uncertainty about precision (one study) c Downgraded one level due to uncertainty about precision (small study) d Downgraded one level due to unclear risk of attrition bias (incomplete outcome data) | ||||||
| Outcome or subgroup title | No. of studies | No. of participants | Statistical method | Effect size |
| 1 Incidence of hyperbilirubinaemia Show forest plot | 1 | 50 | Risk Ratio (M‐H, Fixed, 95% CI) | 0.75 [0.58, 0.97] |
| 1.1 gestational age preterm neonates (< 35 weeks' gestation); birth weight ( < 1500 grams); type of prebiotic (oligosaccharide); type of feeding (only breast milk‐fed infants) | 1 | 50 | Risk Ratio (M‐H, Fixed, 95% CI) | 0.75 [0.58, 0.97] |
| 2 Maximum plasma unconjugated bilirubin levels Show forest plot | 2 | 78 | Mean Difference (IV, Fixed, 95% CI) | 0.14 [‐0.91, 1.20] |
| 2.1 gestational age preterm neonates (< 35 weeks' gestation), birth weight ( < 1500 grams) | 2 | 78 | Mean Difference (IV, Fixed, 95% CI) | 0.14 [‐0.91, 1.20] |
| 3 Maximum plasma unconjugated bilirubin levels Show forest plot | 2 | 78 | Mean Difference (IV, Fixed, 95% CI) | 0.14 [‐0.91, 1.20] |
| 3.1 breastfed only infants, oligosaccharide | 1 | 50 | Mean Difference (IV, Fixed, 95% CI) | ‐0.90 [‐2.28, 0.48] |
| 3.2 given a mixed form of feeding, lactulose | 1 | 28 | Mean Difference (IV, Fixed, 95% CI) | 1.60 [‐0.03, 3.23] |
| 4 Treatment with phototherapy Show forest plot | 1 | 50 | Risk Ratio (M‐H, Fixed, 95% CI) | 0.75 [0.58, 0.97] |
| 4.1 gestational age preterm neonates (< 35 weeks' gestation); birth weight ( < 1500 grams); type of prebiotic (oligosaccharide); type of feeding (only breast milk‐fed infants) | 1 | 50 | Risk Ratio (M‐H, Fixed, 95% CI) | 0.75 [0.58, 0.97] |
| 5 Stool frequency: gestational age Show forest plot | 3 | 154 | Mean Difference (IV, Fixed, 95% CI) | 1.18 [0.90, 1.46] |
| 5.1 term neonates (gestational age ≥ 37 weeks) | 1 | 76 | Mean Difference (IV, Fixed, 95% CI) | 1.7 [1.34, 2.06] |
| 5.2 preterm neonates (< 35 weeks' gestation) | 2 | 78 | Mean Difference (IV, Fixed, 95% CI) | 0.4 [‐0.05, 0.85] |
| 6 Stool frequency: birth weight Show forest plot | 3 | 154 | Mean Difference (IV, Fixed, 95% CI) | 1.18 [0.90, 1.46] |
| 6.1 infants ≥ 2500 grams | 1 | 76 | Mean Difference (IV, Fixed, 95% CI) | 1.7 [1.34, 2.06] |
| 6.2 infants < 1500 grams | 2 | 78 | Mean Difference (IV, Fixed, 95% CI) | 0.4 [‐0.05, 0.85] |
| 7 Stool frequency: type of prebiotic Show forest plot | 3 | 154 | Mean Difference (IV, Fixed, 95% CI) | 1.18 [0.90, 1.46] |
| 7.1 oligosaccharide | 2 | 126 | Mean Difference (IV, Fixed, 95% CI) | 1.28 [0.98, 1.58] |
| 7.2 lactulose | 1 | 28 | Mean Difference (IV, Fixed, 95% CI) | 0.40 [‐0.44, 1.24] |
| 8 Stool frequency: type of feeding Show forest plot | 3 | 154 | Mean Difference (IV, Fixed, 95% CI) | 1.18 [0.90, 1.46] |
| 8.1 breastfed only infants | 1 | 50 | Mean Difference (IV, Fixed, 95% CI) | 0.40 [‐0.13, 0.93] |
| 8.2 formula‐fed only infants | 1 | 76 | Mean Difference (IV, Fixed, 95% CI) | 1.7 [1.34, 2.06] |
| 8.3 given a mixed form of feeding | 1 | 28 | Mean Difference (IV, Fixed, 95% CI) | 0.40 [‐0.44, 1.24] |
| 9 Duration of phototherapy (days) Show forest plot | 1 | 28 | Mean Difference (IV, Fixed, 95% CI) | 0.10 [0.00, 2.20] |
| 9.1 gestational age preterm neonates (< 35 weeks' gestation); birth weight ( < 1500 grams); type of prebiotic (lactulose); type of feeding (infants given a mixed form of feeding) | 1 | 28 | Mean Difference (IV, Fixed, 95% CI) | 0.10 [0.00, 2.20] |
| 10 Length of hospital stay (days) Show forest plot | 2 | 78 | Mean Difference (IV, Fixed, 95% CI) | ‐10.57 [‐17.81, ‐3.33] |
| 10.1 gestational age preterm neonates (< 35 weeks' gestation), birth weight ( < 1500 grams) | 2 | 78 | Mean Difference (IV, Fixed, 95% CI) | ‐10.57 [‐17.81, ‐3.33] |
| 11 Length of hospital stay (days) Show forest plot | 2 | 78 | Mean Difference (IV, Fixed, 95% CI) | ‐10.57 [‐17.81, ‐3.33] |
| 11.1 breastfed only infants, oligosaccharide | 1 | 50 | Mean Difference (IV, Fixed, 95% CI) | ‐10.2 [‐17.59, ‐2.81] |
| 11.2 given a mixed form of feeding, lactulose | 1 | 28 | Mean Difference (IV, Fixed, 95% CI) | ‐19.10 [‐54.58, 16.38] |
| 12 Neonatal mortality Show forest plot | 2 | 78 | Risk Ratio (M‐H, Fixed, 95% CI) | 0.94 [0.14, 6.19] |
| 12.1 gestational age preterm neonates (< 35 weeks' gestation), birth weight ( < 1500 grams) | 2 | 78 | Risk Ratio (M‐H, Fixed, 95% CI) | 0.94 [0.14, 6.19] |
| 13 Neonatal mortality Show forest plot | 2 | 78 | Risk Ratio (M‐H, Fixed, 95% CI) | 0.94 [0.14, 6.19] |
| 13.1 breastfed only infants, oligosaccharide | 1 | 50 | Risk Ratio (M‐H, Fixed, 95% CI) | 3.0 [0.13, 70.30] |
| 13.2 given a mixed form of feeding, lactulose | 1 | 28 | Risk Ratio (M‐H, Fixed, 95% CI) | 0.29 [0.01, 6.60] |