Interventions for promoting physical activity in people with chronic obstructive pulmonary disease (COPD)
Abstract
Background
Escalating awareness of the magnitude of the challenge posed by low levels of physical activity in people with chronic obstructive pulmonary disease (COPD) highlights the need for interventions to increase physical activity participation. The widely‐accepted benefits of physical activity, coupled with the increasing availability of wearable monitoring devices to objectively measure participation, has led to a dramatic rise in the number and variety of studies that aimed to improve the physical activity of people with COPD. However, little was known about the relative efficacy of interventions tested so far.
Objectives
In people with COPD, which interventions are effective at improving objectively‐assessed physical activity?
Search methods
We identified trials from the Cochrane Airways Trials Register Register, which contains records identified from bibliographic databases including the Cochrane Central Register of Controlled Trials, MEDLINE, Embase, CINAHL, AMED, and PsycINFO. We also searched PEDro, ClinicalTrials.gov, the World Health Organization International Clinical Trials Registry Platform portal and the Australian New Zealand Clinical Trials Registry (from inception to June 2019). We checked reference lists of all primary studies and review articles for additional references, as well as respiratory journals and respiratory meeting abstracts, to identify relevant studies.
Selection criteria
We included randomised controlled trials of interventions that used objective measures for the assessment of physical activity in people with COPD. Trials compared an intervention with no intervention or a sham/placebo intervention, an intervention in addition to another standard intervention common to both groups, or two different interventions.
Data collection and analysis
We used standard methods recommended by Cochrane. Subgroup analyses were possible for supervised compared to unsupervised pulmonary rehabilitation programmes in clinically‐stable COPD for a range of physical activity outcomes. Secondary outcomes were health‐related quality of life, exercise capacity, adverse events and adherence. Insufficient data were available to perform prespecified subgroup analyses by duration of intervention or disease severity. We undertook sensitivity analyses by removing studies that were at high or unclear risk of bias for the domains of blinding and incomplete outcome data.
Main results
We included 76 studies with 8018 participants. Most studies were funded by government bodies, although some were sponsored by equipment or drug manufacturers. Only 38 studies had physical activity as a primary outcome. A diverse range of interventions have been assessed, primarily in single studies, but improvements have not been systematically demonstrated following any particular interventions. Where improvements were demonstrated, results were confined to single studies, or data for maintained improvement were not provided. Step count was the most frequently reported outcome, but it was commonly assessed using devices with documented inaccuracy for this variable.
Compared to no intervention, the mean difference (MD) in time in moderate‐ to vigorous‐intensity physical activity (MVPA) following pulmonary rehabilitation was four minutes per day (95% confidence interval (CI) −2 to 9; 3 studies, 190 participants; low‐certainty evidence). An improvement was demonstrated following high‐intensity interval exercise training (6 minutes per day, 95% CI 4 to 8; 2 studies, 275 participants; moderate‐certainty evidence). One study demonstrated an improvement following six months of physical activity counselling (MD 11 minutes per day, 95% CI 7 to 15; 1 study, 280 participants; moderate‐certainty evidence), but we found mixed results for the addition of physical activity counselling to pulmonary rehabilitation. There was an improvement following three to four weeks of pharmacological treatment with long‐acting muscarinic antagonist and long‐acting beta2‐agonist (LAMA/LABA) compared to placebo (MD 10 minutes per day, 95% CI 4 to 15; 2 studies, 423 participants; high‐certainty evidence). These interventions also demonstrated improvements in other measures of physical activity.
Other interventions included self‐management strategies, nutritional supplementation, supplemental oxygen, endobronchial valve surgery, non‐invasive ventilation, neuromuscular electrical stimulation and inspiratory muscle training.
Authors' conclusions
A diverse range of interventions have been assessed, primarily in single studies. Improvements in physical activity have not been systematically demonstrated following any particular intervention. There was limited evidence for improvement in physical activity with strategies including exercise training, physical activity counselling and pharmacological management. The optimal timing, components, duration and models for interventions are still unclear. Assessment of quality was limited by a lack of methodological detail. There was scant evidence for a continued effect over time following completion of interventions, a likely requirement for meaningful health benefits for people with COPD.
PICO
Plain language summary
What are the most effective ways to encourage people with chronic obstructive pulmonary disease (COPD) to be more physically active?
Background
Being physically active is important for everyone's health. It can be particularly difficult for people with COPD and we do not know the best way to improve physical activity.
Study characteristics
This review includes 76 studies involving 8018 people with COPD (published before 27 June 2019). Most studies were funded by government bodies, although some were sponsored by equipment or drug manufacturers. Many strategies have been developed and different studies have measured physical activity in lots of different ways. This means that it was hard to compare and combine their findings. It was also hard to tell exactly what was involved in some of the interventions, and therefore which components were important for improving physical activity.
Key results
Some studies looked at current interventions for people with COPD, including pulmonary rehabilitation and different types of exercise training as well as self‐management and education. Other studies have looked at special types of nutritional supplements, oxygen therapy, surgery, muscle stimulation and singing.
Some strategies that did work involved exercise training, physical activity counselling and COPD medications. Some studies showed that people did an extra 6 to 24 minutes of at least moderate‐intensity physical activity, as well as walking for longer or taking more steps each day. However, we are still uncertain about when or how these approaches should be used. Only a few studies followed people up after the intervention finished. It is not clear exactly what needs to be done to improve physical activity in the long term, which is what may be required for health benefits.
Quality of the evidence
The quality of evidence was generally low, due to difficulties working out exactly what people did in the studies, and also because there were lots of single studies (some quite small) looking at different types of interventions. This means that it was difficult to generalise these findings to all people with COPD.
Authors' conclusions
Summary of findings
| Population: people with COPD, clinical stability Intervention: pulmonary rehabilitation/exercise training Comparisons: intervention versus no intervention Outcome: time in physical activity (of at least moderate intensity) at end intervention | ||||||
| Interventions | Outcome | Illustrative comparative risks* [mean difference (95% CI) unless indicated] | Number of participants (studies) | Quality of the evidence | Comments | |
| Assumed risk | Corresponding risk | |||||
| No intervention | Pulmonary rehabilitation/exercise training | |||||
| Pulmonary rehabilitation vs. no intervention (8 to 10 weeks) | Time/change in time in MVPA | The mean change in time ranged from −1 to 6 minutes per day, mean time 27 minutes per day | The mean difference was 4 (−2 to 9) minutes per day | 190 participants (3 studies; Analysis 1.2) | ⊕⊕⊝⊝ | Baseline values: De Roos 2017 no intervention mean 11 (SD 10), pulmonary rehabilitation 12 (11); Wootton 2017 no intervention 46 (39), pulmonary rehabilitation 54 (43) |
| High‐intensity interval training vs. no intervention (8 to 12 weeks) | Time in MVPA | The mean time ranged from 12 to 14 minutes per day | The mean difference was 6 (4 to 8) minutes per day | 275 participants (2 studies; Analysis 1.9) | ⊕⊕⊕⊝ moderateb | ‐ |
| Maintenance (telerehabilitation) following high‐intensity interval training vs. no intervention (12 months) | Time in moderate intensity physical activity | The mean time was 11 minutes per day | The mean difference was 7 (4 to 10) minutes per day | 97 participants (1 study; Vasilopoulou 2017; Table 1) | ⊕⊕⊕⊝ moderateb | ‐ |
| Maintenance (centre‐based) following high intensity interval training vs. no intervention (12 months) | The mean difference was 11 (8 to 14) minutes per day | 100 participants (1 study; Vasilopoulou 2017; Table 1) | ||||
| *The basis for the assumed risk (e.g. the median control group risk across studies) is provided in footnotes. The corresponding risk (and its 95% confidence interval) is based on the assumed risk in the comparison group and the relative effect of the intervention (and its 95% CI). | ||||||
| GRADE Working Group grades of evidence | ||||||
| aDowngraded one level for high risk of performance bias. Downgraded one level for imprecision as CI does not exclude possibility of no effect. | ||||||
| Study | Comparison (setting, if known) Clinical stability unless indicated | Timepoint (end intervention unless indicated) | Outcome (minutes unless indicated) | Intervention group | Comparison group | Between‐group MD (95% CI) where available unless indicated | ||
| n | mean (95% CI) unless indicated | n | mean (95% CI) unless indicated | |||||
| Physical activity counselling vs. no intervention (primary care) | 12 weeks | ∆ step count (n) | 22 | median 537 (IQR −611 to 1740) | 18 | median 431 (IQR −899 to 749) | P = 0.48* | |
| ∆ "daily physical activity" (n) | median 1408 (IQR −2165 to 3304) | median 528 (IQR −966 to 2179) | P = 0.35* | |||||
| follow‐up (12 months post‐intervention) | ∆ step count (n) | 20 | median 157 (IQR −1679 to 994) | 18 | median 48 (IQR −1004 to 885) | P = 0.90* | ||
| ∆ "daily physical activity" (n) | median 353 (IQR −1518 to 3038) | median −576 (IQR −2517 to 1008) | P = 0.26* | |||||
| Physical activity counselling vs. no intervention (secondary care) | 12 weeks | ∆ step count (n) | 21 | median 1002 (IQR −612 to 3077) | 22 | median −814 (IQR −2827 to 1063) | P = 0.007* | |
| ∆ "daily physical activity" (n) | median 1575 (IQR −752 to 3864) | median −1041 (IQR −1971 to 1031) | P = 0.007* | |||||
| follow‐up (12 months post‐intervention) | ∆ step count (n) | 20 | median 1128 (IQR −1322 to 2707) | 19 | median −217 (IQR −1951 to 1147) | P = 0.15* | ||
| ∆ "daily physical activity" (n) | median 1798 (IQR −1994 to 3128) | median −718 (IQR −1812 to 512) | P = 0.11* | |||||
| Physical activity counselling with PR vs. PR | 12 weeks | ∆ step count (n) | 22 | median 547 (IQR 187 to 1323) | 15 | median −211 (IQR −1337 to 1038) | P = 0.03* | |
| ∆ "daily physical activity" (n) | median 1302 (IQR −173 to 1922) | median −849 (IQR −2223 to 961) | P = 0.03* | |||||
| follow‐up (12 months post‐intervention) | ∆ step count (n) | 10 | median −569 (IQR −2512 to 1551) | 13 | median −1137 (IQR −2376 to 1427) | P = 0.58* | ||
| ∆ "daily physical activity" (n) | median −213 (IQR −4525 to 2274) | median −1827 (IQR −3540 to 629) | P = 0.97* | |||||
| Physical activity counselling vs. no intervention (primary care) SUBGROUP: ≥ 10,000 steps per day (baseline) | 12 weeks | ∆ step count (n) | median 675 (IQR 4 to 1853) | median 342 (IQR −955 to 658) | P = 0.20* | |||
| ∆ "daily physical activity" (n) | median 1807 (IQR 164 to 3720) | median 519 (IQR −1089 to 1709] | P = 0.11* | |||||
| follow‐up (12 months post‐intervention) | ∆ step count (n) | median 201 (IQR −693 to 1170) | median 38 (IQR −1071 to 821) | P = 0.55* | ||||
| ∆ "daily physical activity" (n) | median 525 (IQR −545 to 3078) | median −726 (IQR −2954 to 711) | P = 0.06* | |||||
| Physical activity counselling vs. no intervention (secondary care) SUBGROUP: ≤ 10,000 steps per day (baseline) | 12 weeks | ∆ step count (n) | median 1289 (IQR −183 to 3107) | median 34 (IQR −1707 to 1095) | P = 0.02* | |||
| ∆ "daily physical activity" (n) | median 1763 (IQR −763 to 3913) | median −925 (IQR −1452 to 1052) | P = 0.03* | |||||
| follow‐up (12 months post‐intervention) | ∆ step count (n) | median 1436 (IQR −1492 to 2722) | median 0 (IQR −1825 to 1103) | P = 0.12* | ||||
| ∆ "daily physical activity" (n) | median 1928 (IQR −1140 to 3320) | median −526 (IQR −1657 to 435) | P = 0.078* | |||||
| Physical activity counselling with PR vs. PR SUBGROUP: ≤ 10,000 steps per day (baseline) | 12 weeks | ∆ step count (n) | median 547 (IQR 187 to 1323) | median −198 (IQR −1403 to 1051) | P = 0.04* | |||
| ∆ "daily physical activity" (n) | median 1302 (IQR −173 to 1922) | median −843 (IQR −1737 to 1329) | P = 0.052* | |||||
| follow‐up (12 months post intervention) | ∆ step count (n) | median −569 (IQR −1770 to 2170) | median −759 (IQR −2027 to 1641) | P = 0.78* | ||||
| ∆ "daily physical activity" (n) | median −213 (IQR −4525 to 2274) | median −644 (IQR −3706 to 844) | P = 0.91* | |||||
| LAMA vs. placebo | 3 weeks | ∆ step count (n) | 51 | median 69 (IQR −834 to 1262) | 53 | median 125 (IQR −1180 to 1249) | P = 0.73 | |
| ∆ MVPA time | median 1 (IQR −22 to 25) | median −6 (IQR −21 to 15) | P = 0.11 | |||||
| ∆ PAL | median 0.00 (IQR −0.08 to 0.09) | median −0.01 (IQR −0.09 to 0.09) | P = 0.95 | |||||
| ∆ active EE (kcal) | median 10 (−131 to 116) | median −44 (IQR −122 to 40) | P = 0.11 | |||||
| Physical activity counselling with pedometer vs. pedometer | 12 weeks | step count (n) | 49 | x | 50 | x | x | |
| Self‐management (health coaching) with PR referral vs. PR referral | 12 months | ∆ PAL | 108 | mean −0.10 | 106 | mean 0.01 | P = not significant* | |
| step count (n) | only baseline values reported | only baseline values reported | "We did not find a difference in any physical activity outcome between the intervention and control arms at any time point"* | |||||
| time sedentary | ||||||||
| LIPA time | ||||||||
| MPA time | ||||||||
| VPA time | ||||||||
| resting metabolic rate (calories per 24 hours) | ||||||||
| total EE (calories per 24 hours) | ||||||||
| Self‐management vs. education and symptom management | 16 weeks | activity time | 162 | mean 13 (SE 1) | 164 | mean 11 (SE 1) | P = 0.045* | |
| MPA time | mean 6 (SE 0.4) | mean 5.5 (SE 0.4) | 0.5 (−0.6 to 1.6) | |||||
| total EE ("caloric expenditure") | mean 3605 (SE 211) | mean 3113 (SE 212) | P = 0.022* | |||||
| Exercise training (whole‐body resistance training) vs. no intervention (inpatient) | 4‐week follow‐up | time lying | 15 | mean 224 (SD 131) | 14 | mean 203 (SD 140) | 21 (−78 to 120) | |
| time sitting | mean 287 (122) | mean 298 (SD 107) | −11 (−94 to 72) | |||||
| time standing | mean 168 (104) | mean 153 (SD 94) | 15 (−57 to 87) | |||||
| time walking | mean 31 (21) | mean 50 (SD 35) | −19 (−40 to 2) | |||||
| Nordic walking with education vs. education | 12 weeks | ∆ time sitting | 30 | mean −128 (SD 15) | 30 | "Controls did not show any significant change in | P = 0.014* | |
| ∆ time standing | mean 129 (SD 26) | x | ||||||
| ∆ time walking | mean 15 (SD 20) | P = 0.034* | ||||||
| follow‐up (3 months post‐intervention) | ∆ time sitting | mean −120 (SD 32) | P < 0.05* | |||||
| ∆ time standing | mean 133 (SD 14) | P < 0.05* | ||||||
| ∆ time walking | mean 13 (SD 2) | x | ||||||
| follow‐up (6 months post‐intervention) | time sitting | mean 233 (SD 172) | mean 342 (SD 126) | P < 0.01* | ||||
| time standing | mean 320 (SD 178) | mean 220 (SD 130) | P = 0.16 | |||||
| time walking | mean 56 (SD 38) | mean 32 (SD 25) | P < 0.01 | |||||
| Web‐based PR vs. centre‐based PR | 7 weeks | step count (n) | 20 | x | 34 | x | P = 0.37* | |
| "20 min bouts of purposeful activity" (n) | mean change 10% | x | P = 0.26* | |||||
| Inspiratory muscle training with PR vs. sham with PR | 12 weeks (total n = 150) | step count (n) | x | mean 3958 (SD 2253) | x | mean 4506 (SD 1899) | −206 (−923 to 512)* | |
| ACE inhibitor with PR vs. placebo with PR | 10 weeks | ∆ step count (n) | 18 | mean −382 (SD 2082) | 22 | mean 561 (SD 2528) | −943 (−2372 to 486) | |
| ∆ PAL | mean −0.06 (SD 0.16) | mean 0.04 (SD 0.15) | −0.10 (−0.20 to −0.00) | |||||
| Physical activity counselling vs. no intervention | 12 weeks | ∆ time walking | 140 | 7 (1 to 13) | 140 | −10 (−14 to −6) | 17 (10 to 24) | |
| ∆ intensity movement (m/s2) | 0.06 (0.02 to 0.10) | −0.03 (−0.06 to −0.00) | 0.09 (0.04 to 0.14) | |||||
| ∆ MVPA time | 8 (5 to 12) | −3 (−6 to 0.2) | 11 (7 to 15) | |||||
| Non‐invasive ventilation with PR vs. PR | 12 weeks | step count (n) | 24 | median 2799 (IQR 891 to 6135) | 32 | median 2093 (IQR 914 to 3155) | median 1269 (IQR 242 to 2296)* | |
| Water‐based exercise training vs. land‐based exercise training | 6 months | active (n) (> 7500 steps per day) | 20 | baseline 4 end intervention 10 | 16 | baseline 4 end intervention 5 | x | |
| Endobronchial valve surgery vs. no intervention | 6 months post‐surgery | ∆ step count (n) | 19 | 1252 (545 to 1960) | 24 | −148 (−512 to 216) | 1400 (655 to 2145) | |
| ∆ time walking (%) | 1 (0 to 2) | 0 (−1 to 0) | 1 (0 to 2) | |||||
| ∆ time sitting (%) | 0 (−3 to 3) | 2 (1 to 3) | −2 (−5 to 1) | |||||
| ∆ time inactive | −1 (−3 to 1) | 0 (−1 to 1) | −1 (−3 to 1) | |||||
| ∆ intensity movement (g) | 0.01 (0.00 to 0.01) | 0.00 (−0.01 to 0.00) | 0.01 (0.00 to 0.02) | |||||
| Physical activity counselling vs. no intervention | 4 weeks | ∆ step count (n) | 12 | 984 (217 to 1752) | 14 | 1013 (307 to 1719) | −29 (−969 to 911) | |
| ∆ time walking | 13 (3 to 23) | 13 (5 to 21) | 0 (−12 to 12) | |||||
| ∆ intensity movement (m/s2) | 0.06 (0.03 to 0.09) | 0.08 (−0.05 to 0.11) | −0.02 (−0.06 to 0.02) | |||||
| Self‐management vs. no intervention | 12 months | MVPA time a week | 179 | mean 347 (SD 277) | 232 | mean 316 (SD 256) | 12 (−21 to 45)* | |
| Self‐management (SPACE) vs. no intervention (post‐admission) | 7 days | ∆ step count (n) | 15 | −208 (−1146 to 730) | 10 | −518 (−2572 to 1536) | 310 (−1665 to 2285) | |
| ∆ time sedentary | −14 (−71 to 43) | −18 (−87 to 51) | 4 (−75 to 83) | |||||
| ∆time in "physical activity" | −1 (−14 to 12) | −16 (−66 to 34) | 15 (−30 to 60) | |||||
| ∆ MPA time | −1 (−14 to 12) | −14 (−61 to 33) | 13 (−30 to 56) | |||||
| ∆ VPA time | 0 (−1 to 1) | −2 (−61 to 2) | 2 (−1 to 5) | |||||
| ∆ total EE (kcal) | −128 (−236 to −20) | −98 (−292 to 96) | −30 (−225 to 165) | |||||
| ∆ active EE (kcal) | −12 (−77 to 53) | −97 (−310 to 116) | 85 (−108 to 278) | |||||
| Physical activity counselling with PR vs. PR | 12 months | ∆ time sitting | 12 | 59 (−6 to 124) | 15 | 6 (−44 to 56) | 53 (−21 to 127) | |
| ∆ time standing | 43 (24 to 60) | 31 (5 to 57) | 11 (−18 to 40) | |||||
| ∆ time walking | 51 (10 to 92) | 12 (−2 to 27) | 39 (1 to 78) | |||||
| ∆ time lying | −53 (−96 to −10) | −29 (−60 to 2) | −24 (−72 to 24) | |||||
| ∆ frequency postural changes: total (n) | 40 (−2 to 82) | 19 (−5 to 43) | 21 (−23 to 65) | |||||
| ∆ frequency postural changes: getting up (n) | 0 (−16 to 16) | 6 (−11 to 23) | −6 (−27 to 15) | |||||
| ∆ frequency postural changes: standing up (n) | 43 (5 to 81) | 14 (−5 to 33) | 29 (−9 to 67) | |||||
| Exercise‐specific self‐efficacy training with upper‐body resistance training vs. upper‐body resistance training | 4 months | time sedentary | 15 | mean 602 (SD 112) | 20 | mean 577 (SD 107) | 25 (−49 to 99) | |
| time sedentary (% monitored time) | mean 70 (SD 10) | mean 70 (SD 9) | 0 (−6 to 6) | |||||
| MVPA time | mean 6 (SD 6) | mean 4 (SD 3) | 2 (−1 to 5) | |||||
| Upper‐body resistance training with health education vs. health education | time sedentary | 20 | mean 577 (SD 107) | 14 | mean 634 (SD 114) | −57 (−133 to 19) | ||
| time sedentary (% monitored time) | mean 70 (SD 9) | mean 70 (SD 9) | −2 (−8 to 4) | |||||
| MVPA time | mean 4 (SD 3) | mean 3 (SD 2) | 1 (−1 to 3) | |||||
| Physical activity counselling with PR vs. PR | 12 weeks | ∆ step count (n) | 25 | x | 25 | x | MD 1319 (SE 571), P = 0.02* | |
| ∆ MVPA time | MD 8 (SE 4), P = 0.11* | |||||||
| 9 months (follow‐up) | ∆ step count (n) | MD 1348 (SE 628), P = 0.03* | ||||||
| ∆ MVPA time | MD 13 (SE 5), P = 0.02* | |||||||
| Singing vs. sham | 8 weeks | ∆ step count (n) | 13 | −763 (−1758 to 232) | 11 | 1011 (337 to 1685) | −1774 (−2848 to −700) | |
| ∆ time sedentary | −36 (−113 to 41) | −27 (−72 to 18) | −9 (−88 to 71) | |||||
| ∆ “physical activity duration” | −93 (−224 to 38) | 50 (22 to 77) | −142 (−263 to −22) | |||||
| ∆ "activity‐related" EE (kJ) | −144 (−408 to 119) | 229 (131 to 327) | −373 (−625 to −121) | |||||
| High‐intensity interval training vs. no intervention | 12 weeks | step count (n) | 85 | mean 5136 (SD 2866) | 43 | mean 3453 (SD 2493) | 1683 (721 to 2646) | |
| vector magnitude units (n) | mean 495 (SD 213) | mean 406 (SD 205) | 89 (13 to 165) | |||||
| "sedentarism" (%) (< 5000 steps per day) | baseline 69 end intervention 48 | baseline 68 end intervention 69 | x | |||||
| LAMA vs. placebo | 3 weeks | ∆ step count (n) | 14 | median 177 (IQR −222 to 1038) | 15 | median 86 (IQR −366 to 1000) | P = 0.63 | |
| ∆ MVPA time | median −2 (IQR −12 to 26] | median −4 (IQR −16 to 19) | P = 0.51 | |||||
| ∆ PAL | median 0.01 (IQR −0.03 to 0.07] | median 0.01 (IQR −0.06 to 0.04) | P = 0.71 | |||||
| ∆ active EE (kcal) | median 43 (IQR −25 to 153) | median 17 (IQR −69 to 50) | P = 0.51 | |||||
| Physical activity counselling with PR vs. PR | 12 weeks | ∆ step count (n) | 22 | mean 1251 (SD 2408) | 22 | mean −410 (SD 1118) | 1661 (552 to 2770) | |
| Pedometer with physical activity counselling vs. physical activity counselling | 12 weeks | ∆ step count (n) | 50 | mean 3080 (SD 3255) | 47 | mean 138 (SD 1950) | 2942 (1881 to 4003) | |
| Self‐management (SPACE) vs. no intervention | 6 weeks | ∆ step count (n) | 52 | 333 (−85 to 751) | 65 | −214 (−566 to 138) | 547 (12 to 1082) | |
| ∆ time sedentary | −10 (−53 to 33) | 13 (−21 to 47) | −23 (−77 to 31) | |||||
| ∆ total EE (kcal) | −4 (−105 to 97) | −20 (−83 to 43) | 16 (−100 to 132) | |||||
| time in bouts (data from graph) | median 142 (95% CI 91 to 190) | median 96 (95% CI 56 to 135) | P = 0.215* | |||||
| LAMA (aclidinium bromide) vs. LAMA (tiotropium) | 8 weeks | "physical activity with sedentary time" | 22 | x | 22 | x | P = 0.385* | |
| LAMA vs. placebo | 12 weeks | not defined | 123 | x | 125 | x | "increase of activity in tiotropium relative to placebo from 7.9% to 12.23%" "the majority of the mean values over time in the tiotropium group are larger than those in the placebo group" | |
| ICS (beclomethasone) with LABA (formoterol) vs. ICS (budesonide) with LABA (formoterol) | 16 weeks (4‐week run‐in, 12 week intervention) | step count (n) | 30 | mean 3826 (SD 2097) | 29 | mean 3510 (SD 2409) | 316 (−838 to 1470) | |
| Four‐wheeled walker vs. no intervention | 4 weeks | step count (n) | 8 | mean 6465 (SD 4541) minimum 3039, maximum 16,558 | 9 | mean 2384 (SD 1319) minimum 574, maximum 4453 | 4081 (818 to 7344) N.B. no baseline assessment; likely imbalance, data skewed | |
| Physical activity counselling with PR vs. PR | 8 weeks (mid‐intervention, post‐PR) | ∆ step count (n) (SenseWear) | 63 | median 272 (IQR −342 to 782) | 59 | median 155 (IQR −438 to 867) | P = 0.99* | |
| ∆ step count (n) (pedometer) | median 727 (IQR −1493 to 3119) | median 892 (IQR −1187 to 2534) | P = 0.55* | |||||
| ∆ MVPA time | median 11 (IQR −1 to 33) | median 11 (IQR −2 to 28) | P = 0.62* | |||||
| 6 months | ∆ step count (n) (SenseWear) | 56 | median −263 (IQR −778 to 197) | 57 | median −461 (IQR −1168 to −62) | P = 0.09* | ||
| ∆ step count (n) (pedometer) | median 116 (IQR −1698 to 3200) | median 481 (IQR −1931 to 1781) | P = 0.85* | |||||
| ∆ MVPA time | median 2 (IQR −12 to 25) | median 12 (IQR −7 to 31) | P = 0.16* | |||||
| ∆ LIPA time | 44 | median 13 (IQR −38 to 33) | 49 | median 0 (IQR −62 to 36) | P = 0.60* | |||
| ∆ time sedentary | median 2 (IQR −38 to 62) | median 22 (IQR −36 to 81) | P = 0.31 | |||||
| Physical activity counselling vs. PR | 12 weeks physical activity counselling, 6 weeks PR | ∆ MVPA time | 14 | 7 (−10 to 24) | 12 | 1 (−3 to 5) | 6 (−10 to 22) | |
| ∆ MVPA bouts (n) | 0.5 (0.2 to 1.1) | −0.03 (−0.1 to 0.05) | 0.5 (0.3 to 0.8) | |||||
| ∆ MVPA time in bouts | 9 (−4 to 22) | −0.4 (−1 to 1) | 10 (−2 to 21) | |||||
| Feedback and education vs. no intervention; Education vs. no intervention; Feedback with education vs. education (post‐admission) | 14 days | ∆ step count (n) | no group data presented | |||||
| "stationary" time | ||||||||
| "light activity" time | ||||||||
| MVPA time | ||||||||
| Enriched nutritional supplement with inpatient PR vs. nutritional supplement with inpatient PR | hospital discharge | ∆ step count | 24 | mean 1900 (SD 2110) | 21 | mean 1700 (SD 1694) | 200 (−913 to 1313) | |
| ∆ EE (kcal) | mean 1521 (SD 285) | mean 1441 (SD 235) | 80 (−72 to 232) | |||||
| Physical activity counselling vs. no intervention | 4 weeks (mid intervention) | % ∆ MPA time | 10 | mean 19 (SD 30) | 8 | mean −5 (SD 13) | 2 (4 to 45) | |
| 8 weeks | mean 20 (SD 29) | mean −12 (SD 22) | 32 (8 to 55) | |||||
| Exercise training (callisthenics) vs. exercise training (endurance and strength training) | 12 weeks (data from graph) | step count (n) | 20 | mean 4235 (SD 822) | 20 | mean 4198 (SD 680) | "There were no significant inter‐group differences in any variable"* | |
| time walking | mean 43 (SD 26) | mean 53 (SD 39) | ||||||
| time standing | mean 231 (SD 123) | mean 243 (SD 106) | ||||||
| time sitting | mean 334 (SD 126) | mean 318 (SD 108) | ||||||
| time lying | mean 115 (SD 89) | mean 100 (SD 78) | ||||||
| MVPA time | mean 55 (SD 15) | mean 75 (SD 19) | ||||||
| active EE (kcal) | mean 335 (SD 104) | mean 389 (SD 119) | ||||||
| total EE (kcal) | mean 1362 (SD 186) | mean 1318 (SD 113) | ||||||
| Physical activity counselling vs. no intervention | 8 weeks (total n = 28) | % ∆ MPA time | x | mean −9 (SD 24) | x | mean −21 (SD 21) | P = 0.116* | |
| Supplemental oxygen vs. placebo (air) | 8 weeks | % ∆ "domestic activity counts" | 10 | mean 7 (SD 54) | 10 | mean −8 (SD 19) | 15 (−21 to 51) | |
| Exercise training (eccentric cycle training) vs. exercise training (concentric cycle training) | 10 weeks | "physical activity levels" | 8 | x | 8 | x | "unchanged"* | |
| Aware of purpose of pedometer with PR vs. unaware of purpose of pedometer with PR | 7 days | step count (n) | 10 | mean 4098 | 9 | mean 3679 | MD 419 "no significant difference between groups"* | |
| Adherence intervention vs. PR | 6 months (follow‐up) | step count (n) | 32 | mean 5045 (SD 3147) | 31 | mean 5204 (SD 3261) | −159 (−1742 to 1424) | |
| peak performance | mean 56 (SD 19) | mean 56 (SD 19) | 0 (−9 to 9) | |||||
| time inactive (%) | mean 68 (SD 15) | mean 70 (SD 13) | −2 (−9 to 5) | |||||
| Physical activity counselling with optional supervised exercise vs. optional supervised exercise | 4 weeks | step count (n) | 13 | mean 5603 (SD 3475) | 16 | mean 4617 (SD 3460) | 986 (−1553 to 3525) | |
| Exercise training (progressive walking and functional‐resistance exercises) vs. no intervention (inpatient) | hospital discharge | step count (n) | 17 | median 4215 (IQR 2133 to 6693) | 17 | median 2198 (IQR 1242 to 4857) | P = 0.07** | |
| LAMA with behavioural management vs. placebo with behavioural management | 6 months | step count (n) | 221 | mean 6485 | 205 | mean 6122 | x | |
| MVPA time | mean 72 | mean 64 | MD 8 | |||||
| LIPA time | mean 111 (SD 82) | mean 101 (SD 80) | 10 (−6 to 26) | |||||
| inactive (%) (< 6000 steps per day) | mean 40 | mean 43 | OR 0.86 (95% CI 0.57 to 1.30) P = 0.477* | |||||
| PR (telerehabilitation) vs. no intervention | 8 weeks | ∆ PAL | 19 | −0.03 (−0.1 to 0.02) | 17 | −0.02 (−0.1 to 0.1) | 0.08 (−0.1 to 0.1) | |
| Maintenance (telerehabilitation) following HIIT vs. no intervention | 12 months (data from graph) | time sedentary | 47 | mean 584 (SD 98) | 50 | mean 615 (SD 76) | −31 (−66 to 4) | |
| LIPA time | mean 157 (SD 44) | mean 113 (SD 44) | 44 (27 to 62) | |||||
| MPA time | mean 18 (SD 6) | mean 11 (SD 7) | 7 (4 to 10) | |||||
| "lifestyle" physical activity time | mean 41 (SD 16) | mean 34 (SD 16) | 7 (1 to 13) | |||||
| Maintenance (centre‐based) following HIIT vs. no intervention | time sedentary | 50 | mean 551 (SD 83) | 50 | 615 (SD 76) | −64 (−95 to −33) | ||
| LIPA time | mean 159 (SD 43) | 113 (SD 44) | 46 (29 to 63) | |||||
| MPA time | mean 22 (SD 7) | 11 (SD 7) | 11 (8 to 14) | |||||
| "lifestyle" physical activity time | mean 52 (SD 17) | 34 (SD 16) | 18 (12 to 25) | |||||
| Maintenance (telerehabilitation) vs. maintenance (centre‐based) following HIIT | time sedentary | 47 | mean 584 (SD 98) | 50 | mean 551 (SD 83) | 33 (−3 to 69) | ||
| LIPA time | mean 157 (SD 44) | mean 159 (SD 43) | −2 (−19 to 15) | |||||
| MPA time | mean 18 (SD 6) | mean 22 (SD 7) | −4 (−7 to −1) | |||||
| "lifestyle" physical activity time | mean 41 (SD 16) | mean 52 (SD 17) | −11 (−18 to −4) | |||||
| LAMA/LABA vs. placebo | 4 weeks | inactive (%) (< 6000 steps per day) | 127 | mean 41 | 123 | mean 55 | OR 0.27 (95% CI 0.1 to 0.5)* | |
| Physical activity counselling vs. PR | 6 weeks | step count (n) | 18 | mean 6021 (SD 2549) | 18 | mean 6113 (SD 2403) | −92 (−1710 to 1526) | |
| Ground‐based walking vs. no intervention | 8 weeks | time sedentary (% awake time) | 62 | mean 69 (SD 10) | 39 | mean 68 (SD 10) | −2 (−6 to 2)* | |
| LIPA time (% awake time) | mean 25 (SD 7) | mean 25 (SD 7) | 1 (−2 to 4)* | |||||
| MPA time (% awake time) | mean 7 (SD 5) | mean 7 (SD 5) | 1 (−2 to 4)* | |||||
| VPA time (% awake time) | mean 0 (SD 0) | mean 0 (SD 0) | 0 (0 to 0)* | |||||
| Physical activity counselling with pedometer vs. no intervention (following ground‐based walking training) | 12 months | ∆ total EE (kcal) | 23 | −75 (−156 to 6) | 20 | −80 (−166 to 5) | 17 (−131 to 164)* | |
| ∆ step count (n) | −157 (−753 to 439) | −1051 (−1687 to −424) | −617 (−1669 to 453)* | |||||
| ∆ time sedentary | −9 (−34 to 17) | −13 (−40 to 14) | −8 (−50 to 33)* | |||||
| ∆ LIPA time | 8 (−19 to 35) | −16 (−44 to 13) | −27 (−70 to 14)* | |||||
| ∆ MPA time | −11 (−23 to 1) | −1 (−13 to 12) | 20 (−1 to 41)* | |||||
| ∆VPA time | 0 (−1 to 1) | 0 (−1 to 1) | 0 (0 to 1)* | |||||
| * from paper ACE: angiotensin‐converting enzyme; ∆ change from baseline; cpm: counts per minute; "daily physical activity": step count + metabolic equivalents; EE: energy expenditure; ICS: inhaled corticosteroid; LABA: long‐acting beta2 agonist; LAMA: long‐acting muscarinic antagonist; LIPA: light‐intensity physical activity; MD: mean difference; METs: metabolic equivalents; MPA: moderate‐intensity physical activity; MVPA: moderate‐to‐vigorous intensity physical activity; n: number of participants; OR: odds ratio; PAL: physical activity level; PR: pulmonary rehabilitation; SPACE: self‐management programme of activity, coping and education; SD: standard deviation; VPA: vigorous‐intensity physical activity | ||||||||
| Population: people with COPD, clinical stability Intervention: pulmonary rehabilitation/exercise training Comparisons: intervention vs. another intervention Outcome: time in physical activity (of at least moderate intensity) at end intervention | ||||||
| Interventions | Outcome | Illustrative comparative risks* [mean difference (95% CI) unless indicated] | No of participants | Quality of the evidence | Comments | |
| Assumed risk | Corresponding risk | |||||
| Comparator | Intervention of interest | |||||
| Home‐based pulmonary rehabilitation vs. centre‐based pulmonary rehabilitation (8 weeks) | Change in time in MVPA | The mean change in time in the centre‐based group was 5 minutes per day | The mean difference was 6 (−19 to 31) minutes per day | 58 participants (1 study; Analysis 4.2) | ⊕⊕⊝⊝ | Baseline values: centre‐based median 79 (IQR 24 to 136), home‐based median 68 (IQR 29 to 121) |
| Calisthenics vs. exercise training (12 weeks) | Time in MVPA | The mean time in the exercise training group was 75 minutes per day | "no significant inter‐group differences in any variable" | 40 participants (1 study; Probst 2011; Table 1) | ⊕⊕⊝⊝ | ‐ |
| Physical activity counselling vs. pulmonary rehabilitation (6 to 12 weeks) | Change in time in MVPA | The mean change in time in the pulmonary rehabilitation group was 1 (−3 to 5) minutes per day | The mean difference was 6 (−10 to 22) minutes per day | 26 participants (1 study; O'Neill 2018; Table 1) | ⊕⊕⊝⊝ | Baseline values: pulmonary rehabilitation mean 15 (SD 5), physical activity counselling mean 14 (SD 15) |
| Telerehabilitation maintenance programme vs. centre‐based maintenance programme (following high‐intensity interval training, 12 months) | Time in moderate‐intensity physical activity | The mean time in the centre‐based group was 22 minutes per day | The mean difference was −4 (−7 to −1) minutes per day | 97 participants (1 study; Vasilopoulou 2017; Table 1) | ⊕⊕⊕⊝ moderatec | ‐ |
| *The basis for the assumed risk (e.g. the median control group risk across studies) is provided in footnotes. The corresponding risk (and its 95% confidence interval) is based on the assumed risk in the comparison group and the relative effect of the intervention (and its 95% CI). | ||||||
| GRADE Working Group grades of evidence | ||||||
| aDowngraded one level for high risk of performance bias. Downgraded one level for imprecision as CI does not exclude possibility of no effect. bDowngraded one level for unclear risk of selection, performance, detection, attrition and other potential bias. Downgraded one level for imprecision as CI does not exclude possibility of no effect. | ||||||
| Population: people with COPD, clinical stability Intervention: physical activity counselling Comparisons: intervention vs. no intervention, intervention in addition to a standard intervention common to both groups Outcome: time in physical activity (of at least moderate intensity) at end intervention | ||||||
| Interventions | Outcome | Illustrative comparative risks* [mean difference (95% CI) unless indicated] | Number of participants (studies) | Quality of the evidence | Comments | |
| Assumed risk | Corresponding risk | |||||
| Comparator | Intervention of interest | |||||
| Comparison: intervention vs. no intervention | ||||||
| Physical activity counselling vs. no intervention (12 weeks) | Change in time in MVPA | The mean change in time was −3 (−0.6 to 0.2) minutes per day | The mean difference was 11 (7 to 15) minutes per day | 280 participants (1 study; Demeyer 2017; Table 1) | ⊕⊕⊕⊝ moderatea | Baseline values: no intervention median 15 (IQR 5 to 35), intervention median 14 (IQR 5 to 26) |
| Physical activity counselling vs. no intervention (following pulmonary rehabilitation, 12 months) | Change in time in moderate intensity physical activity | The mean change was −1 (−13 to 12) minutes per day | The mean difference was 20 (−1 to 41) minutes per day | 43 participants (1 study; Wootton 2017; Table 1) | ⊕⊕⊝⊝ | Baseline values: no intervention mean 51 (SD 49), intervention mean 59 (SD 52) |
| Comparison: intervention in addition to a standard intervention common to both groups | ||||||
| Physical activity counselling with pulmonary rehabilitation vs. pulmonary rehabilitation (6 months) | Time in MVPA | The mean time in the pulmonary rehabilitation group was 28 minutes per day | The mean difference was 24 (2 to 45) minutes per day | 26 participants (1 study; Analysis 3.21) | ⊕⊕⊕⊝ moderatec | P = 0.03 |
| Change in time in MVPA | The median change in time in the pulmonary rehabilitation group was 12 minutes per day | The median change in time was 2 (−12 to 25) minutes per day | 113 participants (1 study; Nolan 2017; Table 1) | ⊕⊕⊝⊝ | P = 0.16 Baseline values: no intervention median 47 (IQR 18 to 103), intervention median 45 (IQR 20 to 81) | |
| Physical activity counselling with pulmonary rehabilitation vs. sham intervention with pulmonary rehabilitation (6 months) | Change in time in MVPA | The mean change in time in the pulmonary rehabilitation group was 0 minutes per day | The mean difference was −6 (−16 to 3) minutes per day | 50 participants (1 study; Analysis 3.25) | ⊕⊝⊝⊝ | Baseline values: no intervention median 29 (IQR 17 to 44), intervention median 33 (IQR 16 to 47) |
| *The basis for the assumed risk (e.g. the median control group risk across studies) is provided in footnotes. The corresponding risk (and its 95% confidence interval) is based on the assumed risk in the comparison group and the relative effect of the intervention (and its 95% CI). | ||||||
| GRADE Working Group grades of evidence | ||||||
| aDowngraded one level for high risk of performance bias and detection bias. | ||||||
| Population: people with COPD, clinical stability Intervention: self‐management Comparisons: intervention vs. no intervention, intervention in addition to a standard intervention common to both groups, intervention vs. another intervention Outcome: time in physical activity (of at least moderate intensity) at end intervention | ||||||
| Interventions | Outcome | Illustrative comparative risks* [mean difference (95% CI) unless indicated] | Number of participants (studies) | Quality of the evidence | Comments | |
| Assumed risk | Corresponding risk | |||||
| Comparator | Intervention of interest | |||||
| Comparison: intervention vs. no intervention | ||||||
| Self‐management vs. no intervention (12 months) | Time in MVPA | The mean time was 316 minutes a week | The mean difference was 12 (−21 to 45) minutes a week | 411 participants (1 study; Jolly 2018; Table 1) | ⊕⊕⊝⊝ | P = 0.48 |
| Comparison: intervention in addition to a standard intervention common to both groups | ||||||
| Self‐efficacy training with upper limb exercise vs. education with upper limb exercise (16 weeks) | Time in moderate‐intensity physical activity | The mean time in the education and upper‐limb exercise group was 4 minutes per day | The mean difference was 2 (−1 to 5) minutes per day | 35 participants (1 study; Larson 2014; Table 1) | ⊕⊕⊝⊝ | ‐ |
| Comparison: intervention vs. another intervention | ||||||
| Self‐management vs. education and symptom monitoring (16 weeks) | Time in moderate‐intensity physical activity | The mean time in the self‐management group was 6 minutes per day | The mean difference was 1 (−1 to 2) minutes per day | 326 participants (1 study; Blumenthal 2014; Table 1) | ⊕⊕⊝⊝ | ‐ |
| *The basis for the assumed risk (e.g. the median control group risk across studies) is provided in footnotes. The corresponding risk (and its 95% confidence interval) is based on the assumed risk in the comparison group and the relative effect of the intervention (and its 95% CI). | ||||||
| GRADE Working Group grades of evidence | ||||||
| aDowngraded one level for high risk of performance bias. Downgraded one level for imprecision as CI does not exclude possibility of no effect. | ||||||
| Population: people with COPD, clinical stability Intervention: pharmacological interventions Comparisons: intervention vs. placebo, intervention in addition to a standard intervention common to both groups Outcome: time in physical activity (of at least moderate intensity) at end intervention | ||||||
| Interventions | Outcome | Illustrative comparative risks* [mean difference (95% CI) unless indicated] | Number of participants (studies) | Quality of the evidence | Comments | |
| Assumed risk | Corresponding risk | |||||
| Comparator | Intervention of interest | |||||
| Comparison: intervention vs. sham/placebo intervention | ||||||
| LAMA vs. placebo (3 weeks) | Change in time in MVPA | The median change in time was −6 minutes per day | The median change in time was −1 (IQR −17 to 24) minutes per day | 131 participants (2 studies; Beeh 2014; Magnussen 2017; Table 1) | ⊕⊕⊕⊝ moderatea | P = 0.07 Baseline values: Beeh 2014 placebo median 73 (IQR 38 to 135), LAMA median 74 (IQR 32 to 132) Magnussen 2017 placebo mean 88 (SD 65), intervention mean 57 (SD 32) |
| LAMA/LABA vs. placebo (3 to 4 weeks) | Change in time in MVPA | The mean change in time ranged from −16 to −1 minutes per day | The mean difference was 10 (4 to 15) minutes per day | 423 participants (2 studies; Analysis 2.3) | ⊕⊕⊕⊕ high | Baseline values: Watz 2016 placebo mean 130, LAMA/LABA mean 125 |
| Comparison: intervention in addition to a standard intervention common to both groups | ||||||
| LAMA with behaviour modification vs. placebo with behaviour modification (12 weeks to 6 months) | Time in MVPA | The mean time was 64 minutes per day | The mean difference was 8 minutes per day | 426 participants (1 study; Troosters 2014; Table 1) | ⊕⊕⊕⊝ moderateb | P = "not statistically significantly different" |
| *The basis for the assumed risk (e.g. the median control group risk across studies) is provided in footnotes. The corresponding risk (and its 95% confidence interval) is based on the assumed risk in the comparison group and the relative effect of the intervention (and its 95% CI). | ||||||
| GRADE Working Group grades of evidence | ||||||
| aDowngraded one level for imprecision as results do not exclude possibility of no effect. | ||||||
Background
Description of the condition
Chronic obstructive pulmonary disease (COPD) is a common, treatable but incurable obstructive lung disease defined by persistent airflow limitation. Diagnosis is confirmed by spirometry in the clinical context of a person presenting with dyspnoea, chronic cough or sputum production, and a history of risk factor exposure (GOLD 2019). Development of COPD is primarily attributable to an enhanced chronic inflammatory airway response to noxious particles or gases, and is strongly linked to a history of smoking. However, there are a number of other risk factors including exposure to air pollution, occupational exposures, genetics, chronic asthma, history of severe childhood respiratory infections and low socioeconomic status (GOLD 2019). Systemic effects, including systemic inflammation and muscle dysfunction, and comorbid conditions, including cardiovascular disease, anxiety and depression, are commonly associated with COPD (Choudhury 2014). Prevalence studies suggest that COPD affects upwards of 384 million people (Adeloye 2015) and is the third leading cause of death worldwide (WHO 2017). Associated with advancing age (Anton 2016), and in the context of the fastest rate of population growth occurring in people over 65 years of age (UN 2015), COPD poses a substantial and growing economic and social burden globally (GOLD 2019).
Description of the intervention
We define the term ‘physical activity’ as any bodily movement produced by skeletal muscles that results in energy expenditure (Casperson 1985). It is a complex behaviour traditionally described according to type, intensity and duration, and incorporates a subset of undertakings including exercise, occupational and household activities. Public health promotion for regular participation in physical activity typically recommends a minimum of 150 minutes a week of at least moderate‐intensity activity as ‘sufficient’ for health benefits across the adult population (U.S. Department of Health and Human Services 2018). These benefits include reduced risk of all‐cause mortality, coronary heart disease, hypertension, stroke, metabolic syndrome, type 2 diabetes and depression (Lee 2012).
Participation in regular physical activity is also endorsed for people with COPD (GOLD 2019). Low levels of physical activity are one of the main risk factors for development of cardiovascular, metabolic and musculoskeletal comorbid conditions in people with COPD, and is observed across the disease spectrum (Van Remoortel 2014). Recent studies show that physical activity is reduced in smokers prior to diagnosis (Furlanetto 2014) and in people with a recent diagnosis and mild COPD before symptom onset (Johnson‐Warrington 2014). Physical activity participation is not clearly related to other clinical characteristics including impaired exercise capacity (Fastenau 2013; Gagnon 2015; Van Remoortel 2013; Watz 2009), but is reduced compared to healthy peers (Pitta 2005; Vorrink 2011) and to people with other chronic conditions (Arne 2009). It is further compromised during and after hospitalisation for an acute exacerbation (Pitta 2006a) and with increasing disease severity (Shrikrishna 2012; Troosters 2010; Waschki 2015). In people with COPD, low levels of participation in physical activity have been independently associated with poor outcomes, including increased risks of hospitalisation and mortality (Garcia‐Aymerich 2006; Garcia‐Rio 2012; Vaes 2014; Waschki 2011).
Much attention has been given to the development of physical activity interventions that incorporate strategies specifically designed to promote the adoption and maintenance of active lifestyles in the general population (Marcus 2006). Such interventions may be provided by a broad range of healthcare professionals and be delivered in a variety of ways (for example, in person, by internet or telephone).
How the intervention might work
Evidence suggests that people with COPD avoid participation in physical activity due to the perception of breathlessness, resulting from inefficiencies related to gas trapping and lung hyperinflation. A vicious circle is perpetuated, where muscle deconditioning results from avoiding activities that involve physical exertion and exacerbate symptoms, further compromising physical capacity to engage in activity (O’Donnell 2014). It is theorised that targeted interventions may be able to interrupt this cycle and increase participation in physical activity at a range of intensities that are associated with health benefits. The dual role of low physical activity levels as both a cause and consequence in chronic disease identifies physical activity as a potentially modifiable target that could affect health‐related quality of life and disease trajectory (Esteban 2010; Vaes 2014; Watz 2014a). Whether improvements in physical activity can ameliorate these effects in COPD is unknown.
Many physical and physiological disease features also appear to influence participation in physical activity by people with COPD. However, the quality of association between such features, including lung function, systemic inflammation, body composition, comorbidities and psychosocial factors, and physical activity participation is variable (Gimeno‐Santos 2011). Additional considerations, including fatigue (Andersson 2015), balance (Iwakura 2016), and seasonal and environmental factors (Alahmari 2015; Sewell 2010) may also impact on physical activity participation in this group. The broad range of strategies considered to date to address low levels of physical activity in people with COPD (for instance, exercise training, nutritional interventions and behavioural strategies) reflect the complexity of this issue.
There is evidence for a relationship between physical activity and rate of acute exacerbations (Esteban 2014) and therefore targeting improvements in physical activity in people with COPD may be an important therapeutic goal (Langer 2016; Singh 2016). However, achieving consistent improvements in participation and convincing evidence for the positive impact on health outcomes remain elusive.
Why it is important to do this review
Escalating awareness of the magnitude of the challenge posed by low levels of physical activity in people with COPD at all points in the disease course highlights the need for interventions to increase physical activity participation by people with COPD. The widely‐accepted benefits of physical activity, coupled with the increasing availability of wearable monitoring devices to objectively measure participation, has led to a dramatic rise in the number and variety of studies that aim to improve physical activity levels in people with COPD. However, little is known about the range of interventions tested so far, partly attributable to the complexities of data analysis and the challenge of rapidly evolving technology, and the relationship between effects on physical activity and other outcomes including exercise capacity and health‐related quality of life. This Cochrane Review aims to evaluate the efficacy of existing interventions to increase physical activity in people with COPD, and to signpost directions for future work.
Objectives
In people with COPD, which interventions are effective at improving objectively‐assessed physical activity?
Methods
Criteria for considering studies for this review
Types of studies
We include randomised controlled trials (RCTs) of any intervention where objectively‐assessed physical activity or sedentary behaviour was a measured outcome in people with COPD, as previous consensus statements (Watz 2014a) and systematic reviews (Dhillon 2015; Gimeno‐Santos 2011) have failed to identify subjective tools that accurately reflect this in people with COPD.
We include studies reported as full‐text articles, those published as abstract only and unpublished data. Physical activity could be either a primary or a secondary outcome of the study. We include cross‐over trials where pre‐cross‐over data were available from study authors.
Types of participants
We include adults (18 years of age and over) with a diagnosis of COPD according to established criteria, regardless of disease severity. We planned to include studies that incorporated a mix of diagnostic groups, only if we could obtain data on any of the review outcomes separately for people with COPD.
Types of interventions
We include trials that objectively assessed physical activity as an outcome. These trials compared an intervention versus no intervention or a sham/placebo intervention, compared an intervention in addition to another standard intervention common to both groups or to a different intervention. Interventions could be supervised or unsupervised. Interventions could include, but were not limited to, physical activity counselling, education programmes and self‐management strategies. Studies including exercise training undertaken as a stand‐alone intervention or as part of a comprehensive pulmonary rehabilitation programme incorporating other components targeting chronic disease self‐management (Hill 2013) were considered together. We analysed studies that included pulmonary rehabilitation (as defined by authors) separately from studies that did not include pulmonary rehabilitation. We also included studies in which both groups received pulmonary rehabilitation and which assessed the inclusion of an additional specific physical activity intervention in one group.
Comparisons
-
One or more interventions versus no intervention
-
One or more interventions versus sham/placebo intervention
-
One or more interventions in addition to a standard intervention common to both groups
-
One or more interventions versus a different intervention
Types of outcome measures
Primary outcomes
-
Studies had to include variable(s) that reflected participation in physical activity or sedentary behaviour, as measured objectively using a pedometer, accelerometer or activity monitor. Outcomes of interest included but were not limited to step count, activity counts, energy expenditure and physical activity time (different intensities, range of thresholds used). Primary time points were at baseline (prior to start) and at the time of intervention completion; we used change in physical activity from baseline for analysis where possible. We also categorised any follow‐up measurements reported following intervention completion as either short‐term (within one month), medium‐term (between one and six months) or long‐term (longer than six months). We sought raw data from the study authors where possible to facilitate comparisons.
Secondary outcomes
-
Health‐related quality of life (measured using either a generic or disease‐specific tool)
-
Exercise capacity: measured using a laboratory or field exercise test, e.g. cardiopulmonary exercise test, six‐minute walk test (6MWT)
-
Adverse events, e.g. musculoskeletal injury
-
Adherence to intervention
Search methods for identification of studies
Electronic searches
We identified studies from the Cochrane Airways Trials Register, which is maintained by the Information Specialist for the Group. The Cochrane Airways Trials Register contains studies identified from several sources:
-
Monthly searches of the Cochrane Central Register of Controlled Trials (CENTRAL), through the Cochrane Register of Studies Online (crso.cochrane.org);
-
Weekly searches of MEDLINE Ovid SP 1946 to June 2019;
-
Weekly searches of Embase Ovid SP 1974 to June 2019;
-
Monthly searches of PsycINFO Ovid SP 1967 to June 2019;
-
Monthly searches of Cumulative Index to Nursing and Allied Health Literature (CINAHL EBSCO), 1937 to June 2019;
-
Monthly searches of Allied and Complementary Medicine (AMED EBSCO), all years to June 2019;
-
Handsearches of the proceedings of major respiratory conferences.
Studies contained in the Trials Register are identified through search strategies based on the scope of Cochrane Airways. Details of these strategies, as well as a list of handsearched conference proceedings, are in Appendix 1. See Appendix 2 and Appendix 3 for search terms used to identify studies for this review.
We also searched Physiotherapy Evidence Database (PEDro), www.clinicaltrials.gov, the WHO ICTRP portal (www.who.int/ictrp/en/) and the Australian New Zealand Clinical Trials Registry (www.anzctr.org.au/). We searched all databases from their inception to June 2019, and imposed no restriction on language of publication.
Searching other resources
We checked reference lists of all primary studies and review articles for additional references. We searched relevant manufacturers' websites for trial information.
We searched for errata or retractions from included studies published in full text on PubMed (www.ncbi.nlm.nih.gov/pubmed) on 12 July 2019.
Data collection and analysis
Selection of studies
Two review authors (AB and NC) independently screened titles and abstracts for inclusion of all the potentially eligible studies we identified from the search, and coded them as either 'retrieve' (eligible or potentially eligible/unclear) or 'do not retrieve'. We retrieved the full‐text study reports/publications and two review authors (AB and NC) independently screened the full‐text articles and identified studies for inclusion, recording reasons for exclusion of the ineligible studies. We resolved any disagreement through discussion or, if required, we consulted a third review author (AH). We identified and excluded duplicates and collated multiple reports of the same study so that each study rather than each report was the unit of interest in the review. We recorded the selection process in sufficient detail to complete a PRISMA flow diagram and Characteristics of excluded studies tables (Moher 2009).
Data extraction and management
We used a data collection form that was piloted on at least one study included in the review, to record study characteristics and outcome data. Two review authors (AB and NC) independently extracted the following study characteristics from included studies:
-
Methods: study design, duration of study, study locations, study setting, date of study;
-
Participants: number, mean age, age range, gender, severity of condition, diagnostic criteria, baseline lung function, smoking history, inclusion criteria, exclusion criteria, withdrawals;
-
Interventions: intervention, comparison, concomitant interventions;
-
Measurement tool;
-
Outcomes: primary and secondary outcomes specified and collected (at baseline and at the time of intervention completion) and follow‐up measurements at any other time points noted;
-
Notes: funding for trial, declared conflicts of interest by trial authors.
We resolved disagreements by reaching consensus, or by involving a third review author (AH or MA). We noted in the Characteristics of included studies table if the included studies did not report outcome data in a useable way. We contacted study authors to verify extracted data when necessary and we provided details of missing data when possible. One review author (AB) transferred data into the Review Manager 5 (RevMan 5) file (Review Manager 2014). We double‐checked that the review author had entered data correctly by comparing data presented in the systematic review with data provided in the study reports. A second review author (NC) spot‐checked study characteristics for accuracy against the trial report.
Where meta‐analyses of physical activity outcome were possible, we included figures in the review.
Assessment of risk of bias in included studies
Two review authors (AB and NC) independently assessed risks of bias for each included RCT, using the criteria outlined in the Cochrane Handbook for Systematic Reviews of Interventions (Higgins 2017). We resolved disagreements by discussion or by involving another review author (AH or MA). Where conflicts of interest were present, an independent co‐author conducted the assessment. We assessed risks of bias according to the following domains:
-
Random sequence generation;
-
Allocation concealment;
-
Blinding of participants and personnel;
-
Blinding of outcome assessment;
-
Incomplete outcome data;
-
Selective outcome reporting;
-
Other potential bias.
For the 'blinding of outcome assessment' domain, we rated both primary and secondary outcomes as ‘objective’ for objectively‐measured outcomes and ‘other’ for those outcomes with greater potential to be affected by lack of blinding (e.g. quality of life questionnaires).
We graded each potential source of bias as either high, low or unclear, and provided an extract from the study report together with a justification for our judgement. We resolved discrepancies by consensus. We summarised the 'Risk of bias' judgements across different studies for each of the domains listed and summarised results in a ’Risk of bias' table. When considering treatment effects, we took into account the risks of bias for studies that contributed to this outcome.
Assessment of bias in conducting the systematic review
We conducted the review according to this published protocol and have reported any deviations from it in the Differences between protocol and review section of the review.
Measures of treatment effect
We analysed all the data reported for each outcome, irrespective of dropout rate or use of intention‐to‐treat analysis.
We undertook meta‐analyses only when this was meaningful, i.e. if treatments, participants and the underlying clinical question were similar enough for pooling to make clinical sense.
We intended to analyse dichotomous data as odds ratios (ORs) and 95% confidence intervals (CIs) but no data were available. For continuous data we calculated mean differences (MDs: same metric scale). To retain the units of measurement, we did not express any data as standardised mean differences (SMDs: different metric scales) with 95% CIs. We narratively described skewed data reported as medians and interquartile ranges.
Where multiple arms were reported in a single trial, we included only the relevant arms. We had intended to halve the control group to avoid double‐counting in the event that we combined two comparisons (e.g. drug A versus placebo and drug B versus placebo) in the same meta‐analysis, but this approach was not required.
Unit of analysis issues
Where studies randomly allocated individual participants to study groups, we considered the participant as the unit of analysis. We only included cross‐over trials where data were available prior to cross‐over, due to the potential carry‐over effects of behavioural interventions. We had intended to consider the cluster as the unit of analysis for cluster‐randomised studies, but this approach was not required.
Dealing with missing data
In the event of missing data, we contacted investigators or study sponsors to verify key study characteristics and to obtain missing numerical outcome data when possible, e.g. when a study was reported only as an abstract. If this was not possible, we had intended to analyse the impact of including studies with missing data that may be related to the intervention by performing a sensitivity analysis, but this approach was not required.
Assessment of heterogeneity
We used the I2 statistic to measure heterogeneity among the trials in each analysis. Where we identified it, we considered statistical heterogeneity to be substantial if I2 was greater than 50% (Deeks 2017), and explored possible causes using prespecified subgroup analyses.
Assessment of reporting biases
We had intended to create a funnel plot to explore possible small‐study and publication biases if we could pool more than 10 included trials, but this was not possible.
Data synthesis
We performed a pooled quantitative synthesis where the trials were clinically homogeneous. We pooled data using a random‐effects model to incorporate between‐study heterogeneity into the meta‐analysis. Where the trials were clinically heterogeneous, we performed a narrative synthesis. For instance, we analysed data for different types of interventions separately, and data for studies starting in the period following acute exacerbation separately from those in stable disease.
'Summary of findings' table
We created 'Summary of findings' tables using the following outcomes:
-
time spent in moderate or moderate‐to‐vigorous physical activity at end intervention in participants with clinically‐stable COPD.
We used the five Grading of Recommendations Assessment, Development and Evaluation (GRADE) working group considerations (study limitations, consistency of effect, imprecision, indirectness and publication bias) to assess the quality of a body of evidence as it related to studies that contributed data to the meta‐analyses for prespecified outcomes. We used methods and recommendations described in Section 8.5 (Higgins 2017) and Chapter 12 (Schünemann 2017) of the Cochrane Handbook for Systematic Reviews of Interventions, and we used the GRADEpro Guideline Development Tool software (GRADEpro GDT 2014). We justified all decisions to downgrade or upgrade the quality of the evidence using footnotes, and we provide comments to aid the reader's understanding of the review where necessary. We did not include data from studies published only in abstract form or on clinical trial registries, due to inadequate assessment of risks of bias.
Subgroup analysis and investigation of heterogeneity
We planned to perform the following subgroup analyses.
-
Duration of intervention (≤ 3 months versus > 3 months);
-
Supervision of intervention (yes or no);
-
Disease severity (mild disease, defined as forced expiratory volume in one second (FEV1) % predicted ≥ 80%, forced expiratory ratio (FER) < 0.7, compared with other classifications).
We used physical activity as the outcome for subgroup analyses.
We used the formal test for subgroup interactions in Review Manager 5 (RevMan 5) (Review Manager 2014).
Sensitivity analysis
We examined the effects of methodological quality on the pooled estimate by removing studies that were at high or unclear risk of bias for the domains of blinding and incomplete outcome data. We had also intended to examine the effects of measurement device on the pooled estimate by removing studies that used pedometers, as previous studies suggest that these might be less accurate in detecting steps in people with COPD (Pitta 2006b).
Results
Description of studies
Details are available in the Characteristics of included studies and Characteristics of excluded studies tables.
Results of the search
The search yielded 3233 citations and ended with 76 studies included from 179 citations. These included 12 abstracts (see Figure 1).
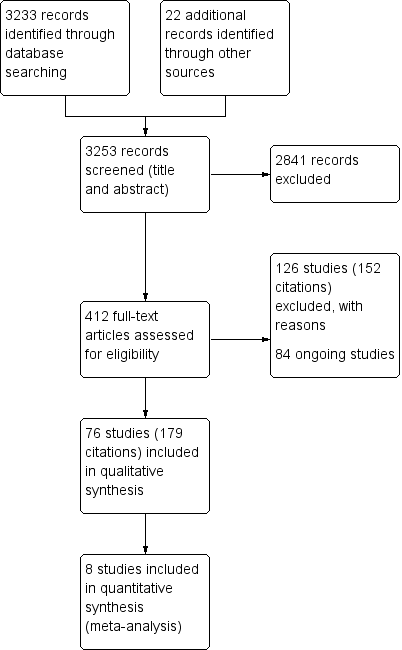
Study flow diagram.
Eighty‐four studies are currently underway and pending study completion/publication (see Ongoing studies).
Included studies
Of the 76 studies included, 24 studies compared an intervention to promote physical activity versus no intervention (comparison 1). These included pulmonary rehabilitation/exercise training (Borges 2014; De Roos 2017; Egan 2010; Louvaris 2016, Tahirah 2015; Tsai 2016; Vasilopoulou 2017; Wootton 2017), physical activity counselling (Altenburg 2015; Arbillaga‐Etxarri 2018; Demeyer 2017; Hornikx 2015; Hospes 2009; Orme 2018; Priori 2017; Saini 2017; Wootton 2017), self‐management (Jolly 2018; Kanabar 2015; Mitchell 2013; Tabak 2014b), nutritional supplementation (Goris 2003), gait aid (Ng 2015) and endobronchial valve surgery (Hartman 2016).
There were 10 studies that compared an intervention to promote physical activity to sham/placebo (comparison 2). These included self‐management (Schuz 2015), pharmaceutical interventions (Beeh 2014;Magnussen 2017;NCT00144326; Watz 2016;Watz 2017), nutritional supplementation (Dal Negro 2012), supplemental oxygen (Sandland 2008), singing (Lord 2012) and neuromuscular electrical stimulation (Maddocks 2016).
There were 31 studies that compared an intervention to promote physical activity in addition to an intervention common to both groups (comparison 3). These included pulmonary rehabilitation/exercise training (Breyer 2010; Effing 2011; Larson 2014; Troosters 2018; Varas 2018), physical activity counselling (Altenburg 2015; Bender 2016; Cruz 2016; De Blok 2006; Kawagoshi 2015; Loeckx 2018; Mantoani 2018; Mendoza 2015; Moy 2015a; Nguyen 2009; Nolan 2017; Orme 2018; Singh 1998; Tabak 2014a; Vorrink 2016; Wan 2017), self‐management (Benzo 2016; Larson 2014), pharmaceutical interventions (Curtis 2016; Troosters 2014; Troosters 2018), nutritional supplementation (Ogasawara 2018; Van de Bool 2017) supplemental oxygen (Alison 2019), non‐invasive ventilation (Duiverman 2008) and inspiratory muscle training (Charususin 2018).
Sixteen studies compared two interventions to increase physical activity with each other (comparison 4). These studies included alternative models of or alternatives to pulmonary rehabilitation/exercise training (Chaplin 2017; Felcar 2018; Gamper 2019; Holland 2017; O'Neill 2018; Polkey 2018; Probst 2011; Rinaldo 2017; Sena 2013; Steele 2019; Vasilopoulou 2017; Widyastuti 2018), self‐management (Blumenthal 2014), pharmaceutical interventions (Nakamura 2016; NCT01351792) and a lightweight cylinder for supplemental oxygen (Casaburi 2012).
Of studies with more than two groups, four contributed to more than one comparison (Altenburg 2015; Larson 2014; Orme 2018; Vasilopoulou 2017).
The total number of participants involved in the included studies was 8018. The sample sizes ranged from eight participants (Nguyen 2009; Priori 2017; Sena 2013) to 289 participants (Jolly 2018). The mean age of participants was 66 years and mean FEV1 54% predicted. On average, groups comprised 63% men, but details relating to the sex of participants were not reported in four abstracts (Egan 2010; Nakamura 2016; Priori 2017; Sena 2013), three papers (Larson 2014; Lord 2012; Polkey 2018) and two clinical trial registries (NCT00144326; NCT01351792). Interventions were provided in person and by telephone call, smart phone app, website, device or printed information. Study duration ranged from one day (surgical procedure) to 12 months, with follow‐up provided in 11 studies (ranging from seven days to 12 months post‐intervention). Three studies assessed interventions provided during inpatient admissions for acute exacerbation of COPD (AECOPD) and five studies in the post‐admission phase. Of the 76 studies included, 38 had assessed physical activity as a primary outcome. Details are available in the Characteristics of included studies table.
Excluded studies
We excluded most of these 134 studies (n = 84) due to physical activity not being objectively assessed. We report reasons for exclusion in the Characteristics of excluded studies table.
Risk of bias in included studies
Overall, the domains with the highest risks of bias were performance bias, as the method of delivery of some interventions precluded participant blinding, and reporting bias. Domains with the lowest risks of bias were detection bias, as objective assessment of physical activity was an inclusion criterion, and selection bias, as most studies did report the method of random sequence generation (Figure 2).

Risk of bias summary: review authors' judgements about each risk of bias item for each included study.
Allocation
For random sequence generation, 48 studies had a low risk of bias. Insufficient information was available to inform a decision for 17 studies (Bender 2016; Burtin 2015; Casaburi 2012; De Blok 2006; Gamper 2019; Hartman 2016; Hornikx 2015; Hospes 2009; Kawagoshi 2015; Magnussen 2017; Orme 2018; Polkey 2018; Probst 2011; Sandland 2008; Troosters 2014; Watz 2017; Widyastuti 2018), nine abstracts (Egan 2010; Kanabar 2015; Loeckx 2018; Mantoani 2018; Nakamura 2016; Ng 2015; Priori 2017; Saini 2017; Singh 1998) and studies from two clinical trial registries (NCT00144326; NCT01351792).
For allocation concealment, one study was assessed at high risk of bias (Altenburg 2015) and 28 at low risk of bias. Insufficient information was available to inform a decision in 36 studies (Beeh 2014; Bender 2016; Benzo 2016; Blumenthal 2014; Breyer 2010; Casaburi 2012; Curtis 2016; De Blok 2006; Duiverman 2008; Effing 2011; Gamper 2019; Goris 2003; Hartman 2016; Hornikx 2015; Hospes 2009; Kawagoshi 2015; Larson 2014; Magnussen 2017; Mendoza 2015; Moy 2015a; Nolan 2017; Ogasawara 2018; Orme 2018; Polkey 2018; Probst 2011; Rinaldo 2017; Sandland 2008; Steele 2019; Troosters 2014; Tsai 2016; Varas 2018; Vasilopoulou 2017; Vorrink 2016; Watz 2016; Watz 2017; Widyastuti 2018), nine abstracts (Egan 2010; Kanabar 2015; Loeckx 2018; Mantoani 2018; Nakamura 2016; Ng 2015; Priori 2017; Saini 2017; Singh 1998) and studies from two clinical trial registries (NCT00144326; NCT01351792).
Blinding
We assessed performance bias separately for participants and personnel.
Participants
We rated the risk of performance bias as high in 47 studies, in some cases due to the nature of the intervention precluding participant blinding. Most pharmaceutical interventions were able to blind participants and were assessed as being at low risk of performance bias (Beeh 2014; Curtis 2016; Magnussen 2017; NCT01351792; Troosters 2014; Watz 2016; Watz 2017), apart from the high risk assessment for Nakamura 2016 (lack of blinding) and unclear risk for NCT00144326 and Troosters 2018 (insufficient information). Similarly, studies involving nutritional supplementation were also able to blind participants and were assessed at low risk (Dal Negro 2012; Van de Bool 2017), apart from the high risk assessment for Ogasawara 2018 (lack of blinding) and unclear risk for Goris 2003 (insufficient information).
Other studies assessed as low risk were Alison 2019,Burtin 2015,Charususin 2018, Curtis 2016, Larson 2014, Maddocks 2016, Sandland 2008 and Varas 2018. Other studies with unclear risk due to insufficient information were Arbillaga‐Etxarri 2018,Cruz 2016,Loeckx 2018, NCT00144326, Probst 2011,Rinaldo 2017,Saini 2017, Schuz 2015,Sena 2013,Singh 1998, and Tahirah 2015.
Personnel
We judged most studies (n = 45) to be subject to unclear risk due to insufficient information. Studies at low risk (n = 12) included pharmacological interventions (Beeh 2014; Magnussen 2017; NCT01351792; Watz 2016; Watz 2017), supplemental oxygen (Alison 2019; Sandland 2008) and nutritional supplementation (Van de Bool 2017), as well as studies involving an intervention in addition to pulmonary rehabilitation programs (Burtin 2015; Charususin 2018; Nolan 2017) and one physical activity counselling study (De Blok 2006). There were 19 studies assessed at high risk which was primarily attributable to personnel awareness of group allocation during the study (Altenburg 2015; Arbillaga‐Etxarri 2018; Borges 2014; Casaburi 2012; Cruz 2016; Duiverman 2008; Felcar 2018; Gamper 2019; Maddocks 2016; Mantoani 2018; Moy 2015a; Nakamura 2016; Ogasawara 2018; Polkey 2018; Steele 2019; Tabak 2014b; Tahirah 2015; Varas 2018; Vasilopoulou 2017).
We assessed detection bias separately for outcomes that were or were not objectively assessed.
Objective outcomes
In line with the inclusion criteria, all studies objectively assessed physical activity. Most (n = 64) were therefore classified as low risk of detection bias. Studies at unclear risk were Altenburg 2015, Bender 2016, De Blok 2006, Gamper 2019,Loeckx 2018,Ogasawara 2018,Priori 2017, Saini 2017, Tabak 2014a, Tabak 2014b, Varas 2018 and Widyastuti 2018, as there was insufficient information to make an assessment.
Other outcomes
We rated 35 studies at low risk of detection bias (Alison 2019; Arbillaga‐Etxarri 2018; Beeh 2014; Blumenthal 2014; Borges 2014; Burtin 2015; Casaburi 2012; Chaplin 2017; Charususin 2018; Curtis 2016; Felcar 2018; Goris 2003; Jolly 2018; Larson 2014; Louvaris 2016; Magnussen 2017; Mendoza 2015; Mitchell 2013; NCT01351792; Nguyen 2009; Nolan 2017; O'Neill 2018; Priori 2017; Schuz 2015; Sena 2013; Singh 1998; Steele 2019; Tahirah 2015; Troosters 2014; Tsai 2016; Varas 2018; Vorrink 2016; Wan 2017; Watz 2017; Wootton 2017). We judged 12 studies to be at high risk (Altenburg 2015; Cruz 2016; Demeyer 2017; De Roos 2017; Duiverman 2008; Mantoani 2018; Moy 2015a; Orme 2018; Ogasawara 2018; Polkey 2018; Tabak 2014b; Widyastuti 2018), due to lack of assessor blinding. Insufficient information was available to inform a decision on the remaining 29 studies.
Incomplete outcome data
We rated most studies (n = 46) at low risk of attrition bias. We assessed 14 studies (Altenburg 2015; Benzo 2016; Borges 2014; Dal Negro 2012; Duiverman 2008; Felcar 2018; Goris 2003; Jolly 2018; Louvaris 2016; Probst 2011; Sandland 2008; Steele 2019; Vasilopoulou 2017; Wootton 2017) and 10 abstracts (Egan 2010; Kanabar 2015; Loeckx 2018; Mantoani 2018; Mitchell 2013; Ng 2015; Priori 2017; Saini 2017; Singh 1998; Tahirah 2015) to be at unclear risk.
We judged four studies to have a high risk of bias where attrition was unevenly distributed between groups (Tabak 2014b), documented but not detailed (Bender 2016), specifically addressed by authors (Vorrink 2016) or clearly related to the intervention (Hartman 2016).
Selective reporting
Most studies (n = 58) had a registered or published trial protocol which facilitated assessment for risk of reporting bias, except for 11 studies (Altenburg 2015; Dal Negro 2012; De Blok 2006; Goris 2003; Hospes 2009; Kawagoshi 2015; Probst 2011; Rinaldo 2017; Varas 2018; Vorrink 2016; Widyastuti 2018) and seven abstracts (Kanabar 2015; Loeckx 2018; Nakamura 2016; Ng 2015; Saini 2017; Priori 2017; Sena 2013).
We rated 12 studies at low risk (Alison 2019; Arbillaga‐Etxarri 2018; Beeh 2014; Charususin 2018; De Roos 2017; Gamper 2019; Maddocks 2016; Magnussen 2017; Ogasawara 2018; Rinaldo 2017; Troosters 2018; Watz 2016).
We judged 25 studies (Altenburg 2015; Bender 2016; Benzo 2016; Blumenthal 2014; Borges 2014; Breyer 2010; Burtin 2015; Chaplin 2017; Cruz 2016; Dal Negro 2012; Demeyer 2017; Duiverman 2008; Effing 2011; Hartman 2016; Hornikx 2015; Lord 2012; Louvaris 2016; Nguyen 2009; Orme 2018; Polkey 2018; Schuz 2015; Tabak 2014a; Tabak 2014b; Vasilopoulou 2017; Wan 2017), two abstracts (Kanabar 2015; Nakamura 2016) and one clinical trial registry study (NCT01351792) to be at high risk. This was primarily due to discrepancies between trial registration and publications (including identification of primary and secondary outcomes), as well as between the way that outcomes were prespecified to be analysed and actually reported. Thirty‐six studies were at unclear risk of reporting bias.
Other potential sources of bias
We rated most studies (n = 55) as being at unclear risk, or at low risk (n = 18; Alison 2019; Altenburg 2015; Beeh 2014; Curtis 2016; De Blok 2006; Hartman 2016; Holland 2017; Hospes 2009; Jolly 2018; Kanabar 2015; Kawagoshi 2015; Magnussen 2017; Mendoza 2015; Nolan 2017; Schuz 2015; Tsai 2016; Wan 2017; Watz 2016) from other potential sources of bias. We deemed three studies to be at high risk from other potential sources of bias (methodological concerns, Bender 2016, Nguyen 2009; lack of physical activity data by group, Orme 2018).
Effects of interventions
See: Summary of findings for the main comparison Pulmonary rehabilitation/exercise training versus no intervention; Summary of findings 2 Comparison of types of pulmonary rehabilitation/exercise training; Summary of findings 3 Physical activity counselling; Summary of findings 4 Self‐management; Summary of findings 5 Pharmacological interventions
Structure of the analysis
After examining the data, we found that the included studies examined a wide range of interventions (Table 2) across the four defined comparisons (intervention versus no intervention; intervention versus placebo/sham; intervention with common intervention versus common intervention; intervention versus intervention).
| Comparison | Description of intervention(s) | OUTCOMES | ||||
| Physical activity | Health‐related quality of life | Exercise capacity | Adherence | Adverse events | ||
| TYPE OF INTERVENTION: Pulmonary rehabilitation/exercise training | ||||||
| Clinically stable | ||||||
| Intervention vs. no intervention | Pulmonary rehabilitation vs. no intervention | Y | Y | Y | N | |
| Y | Y | N | N | |||
| Y | Y | Y | Y | |||
| Y | Y | Y | Y | |||
| High‐intensity interval training vs. no intervention | Y | Y | N | N | ||
| Y | Y | Y | Y | |||
| Maintenance (telerehabilitation) following high‐intensity interval training vs. no intervention | ||||||
| Maintenance (centre‐based) following high‐intensity interval training vs. no intervention | ||||||
| Intervention in addition to an intervention common to both groups | Nordic walking with education vs. education | Y | Y | Y | Y | |
| Structure exercise training (COPE‐active) with self‐management vs. self management | Y | Y | Y | Y | ||
| Upper limb exercises with education vs. education | N | N | N | N | ||
| Exercise training and LABA with LAMA and behavioural modification vs. LAMA and behavioural modification | Y | Y | Y | Y | ||
| Exercise training with LAMA/LABA and behavioural modification vs. LAMA/LABA and behavioural modification | ||||||
| Exercise training and LAMA/LABA with behavioural modification vs. placebo with behavioural modification | ||||||
| Exercise training and physical activity counselling with pedometer vs. pedometer | Y | Y | Y | N | ||
| Intervention vs. intervention | Web‐based pulmonary rehabilitation vs. centre‐based pulmonary rehabilitation | Y | Y | N | Y | |
| Exercise training (eccentric cycle training) vs. exercise training (concentric cycle training) | N | Y | N | N | ||
| Home‐based pulmonary rehabilitation vs. centre‐based pulmonary rehabilitation | Y | Y | Y | Y | ||
| Water‐based exercise training vs. land‐based exercise training | Y | Y | Y | Y | ||
| Tai Chi vs. pulmonary rehabilitation | Y | Y | Y | Y | ||
| Exercise training (callisthenics) vs. exercise training (endurance and strength training) | Y | Y | Y | N | ||
| Exercise training (outdoor walking) vs. exercise training (cycle ergometry) | Y | Y | N | Y | ||
| physical activity counselling vs. pulmonary rehabilitation | Y | Y | N | N | ||
| Y | Y | Y | Y | |||
| Exercise training with tapering supervision vs. supervised exercise training | Y | Y | Y | N | ||
| Adherence intervention vs. pulmonary rehabilitation | Y | Y | Y | N | ||
| Maintenance following high‐intensity interval training: telerehabilitation vs. centre‐based | Y | Y | Y | N | ||
| Acute | ||||||
| Intervention vs. no intervention | Exercise training vs. no intervention | N | Y | Y | N | |
| Y | Y | Y | Y | |||
| TYPE OF INTERVENTION: Physical activity counselling | ||||||
| Clinically stable | ||||||
| Intervention vs. no intervention | Physical activity counselling vs. no intervention | N | N | Y | N | |
| Y | Y | N | Y | |||
| Y | Y | N | Y | |||
| Y | Y | Y | Y | |||
| Y | Y | Y | Y | |||
| N | N | N | N | |||
| Y | Y | Y | Y | |||
| Intervention in addition to an intervention common to both groups | Physical activity counselling with optional supervised exercise vs. optional supervised exercise | Y | N | Y | N | |
| Y | Y | Y | N | |||
| Pedometer with physical activity counselling vs. physical activity counselling | Y | Y | Y | N | ||
| Physical activity counselling with pedometer vs. pedometer | Y | N | N | Y | ||
| N | Y | Y | Y | |||
| Y | Y | Y | Y | |||
| Y | N | Y | Y | |||
| Pedometer with pulmonary rehabilitation: aware vs. unaware of purpose of pedometer | N | N | N | N | ||
| Physical activity counselling with pulmonary rehabilitation vs. pulmonary rehabilitation | Y | Y | N | N | ||
| Y | Y | Y | N | |||
| Y | Y | N | N | |||
| Y | Y | Y | N | |||
| Y | Y | Y | Y | |||
| Y | Y | Y | Y | |||
| Y | Y | N | N | |||
| Physical activity counselling with pulmonary rehabilitation vs. sham intervention with pulmonary rehabilitation | Y | Y | Y | N | ||
| Acute | ||||||
| Intervention vs. no intervention | Physical activity counselling vs. no intervention | Y | Y | N | Y | |
| Feedback and education vs. no intervention | Y | N | Y | Y | ||
| Education vs. no intervention | ||||||
| Intervention in addition to an intervention common to both groups | Feedback with education vs. education | |||||
| TYPE OF INTERVENTION: Self‐management | ||||||
| Clinically stable | ||||||
| Intervention vs. no intervention | Self‐management vs. no intervention | Y | Y | N | Y | |
| Y | Y | Y | N | |||
| Y | N | Y | Y | |||
| Intervention vs. sham/placebo intervention | Self‐management (health mentoring) vs. sham | Y | N | Y | Y | |
| Intervention in addition to an intervention common to both groups | Self‐efficacy training with upper limb exercises vs. education with upper limb exercises | N | N | N | N | |
| Intervention vs. intervention | Self‐management (coping skills training) vs. education and symptom monitoring | Y | Y | Y | Y | |
| Acute | ||||||
| Intervention vs. no intervention | Self‐management (SPACE) vs. no intervention | N | Y | N | N | |
| Intervention in addition to an intervention common to both groups | Self‐management (health coaching) with pulmonary rehabilitation referral vs. pulmonary rehabilitation referral | Y | N | Y | Y | |
| TYPE OF INTERVENTION: Pharmacological treatments | ||||||
| Clinically stable | ||||||
| Intervention vs. sham/placebo intervention | LAMA vs. placebo | N | Y | N | Y | |
| Y | N | N | Y | |||
| Y | Y | N | Y | |||
| LAMA/LABA vs. placebo | N | N | Y | Y | ||
| N | Y | N | Y | |||
| Intervention in addition to an intervention common to both groups | LAMA with behavioural modification vs. placebo with behavioural modification | N | N | Y | Y | |
| Y | Y | Y | Y | |||
| LAMA/LABA with behavioural modification vs. placebo with behavioural modification | Y | Y | Y | Y | ||
| LABA with LAMA and behavioural modification vs. LAMA and behavioural modification | ||||||
| ACE inhibitor with pulmonary rehabilitation vs. placebo with pulmonary rehabilitation | Y | Y | Y | Y | ||
| Intervention vs. intervention | ICS and LABA vs. ICS and LABA | Y | N | N | Y | |
| LAMA vs. LAMA | Y | N | Y | Y | ||
| TYPE OF INTERVENTION: Nutritional supplementation | ||||||
| Clinically stable | ||||||
| Intervention vs. no intervention | Nutritional supplement vs. no intervention | N | N | Y | N | |
| Intervention vs. sham/placebo intervention | Nutritional supplement vs. placebo | Y | N | N | N | |
| Intervention in addition to an intervention common to both groups | Nutritional supplement with pulmonary rehabilitation vs. placebo with pulmonary rehabilitation | Y | Y | Y | Y | |
| Nutritional supplement with physical activity counselling vs. physical activity counselling | ||||||
| Acute | ||||||
| Intervention in addition to an intervention common to both groups | Enriched nutritional supplement with inpatient pulmonary rehabilitation vs. nutritional supplement with inpatient pulmonary rehabilitation | Y | N | N | N | |
| TYPE OF INTERVENTION: Supplemental oxygen | ||||||
| Clinically stable | ||||||
| Intervention vs. sham/placebo intervention | Supplemental oxygen vs. placebo (air) | Y | Y | Y | Y | |
| Intervention in addition to an intervention common to both groups | Supplemental oxygen with exercise training vs. sham with exercise training | Y | Y | Y | Y | |
| Intervention vs. intervention | Supplemental oxygen (lightweight ambulatory) vs. supplemental oxygen (E‐cylinder) | N | N | Y | Y | |
| TYPE OF INTERVENTION: Other interventions | ||||||
| Clinically stable | ||||||
| Intervention vs. no intervention | Four‐wheeled walker vs. no intervention | Y | N | N | N | |
| Endobronchial valve surgery vs. no intervention | Y | Y | N | Y | ||
| Intervention vs. sham/placebo intervention | Singing vs. sham | Y | Y | Y | N | |
| Neuromuscular electrical stimulation vs. placebo | Y | Y | Y | Y | ||
| Intervention in addition to an intervention common to both groups | Non‐invasive ventilation with pulmonary rehabilitation vs. pulmonary rehabilitation | Y | Y | Y | Y | |
| Inspiratory muscle training with pulmonary rehabilitation vs. sham with pulmonary rehabilitation | Y | Y | Y | N | ||
ACE: angiotensin‐converting enzyme; ICS: inhaled corticosteroid; LABA: long‐acting beta2 agonist; LAMA: long‐acting muscarinic antagonist; SPACE: self‐management programme of activity, coping and education
We present results for the primary outcome of physical activity here. We present results for secondary outcomes in Appendix 4 (health‐related quality of life), Appendix 5 (exercise capacity), Appendix 6 (adherence) and Appendix 7 (adverse events).
We present results by type of intervention, with precise comparison by clinical setting (clinically‐stable disease, acute exacerbation). We define the following types of intervention to aid the reader in finding relevant data:
-
pulmonary rehabilitation/exercise training;
-
physical activity counselling;
-
self‐management;
-
pharmacological;
-
nutritional supplementation;
-
supplemental oxygen;
-
other interventions.
INTERVENTION: Pulmonary rehabilitation/exercise training
See summary of findings Table for the main comparison and summary of findings Table 2.
COMPARISON: Intervention versus no intervention (clinically‐stable COPD)
Pulmonary rehabilitation versus no intervention
No clear improvement in physical activity was demonstrated following pulmonary rehabilitation compared to no intervention, with a single variable showing an increase. The mean difference (MD) in step count was 208 steps (95% confidence interval (CI) −165 to 581; 3 studies, 180 participants; low‐certainty evidence; Analysis 1.1; Figure 3).

Forest plot of comparison 1: Intervention vs. no intervention
Outcome 1.1: Physical activity: change in step count (steps per day)
The mean difference in time in moderate‐to‐vigorous intensity physical activity (MVPA) was 4 minutes (95% CI −2 to 9; 3 studies, 190 participants; low‐certainty evidence; Analysis 1.2; Figure 4).

Forest plot of comparison 1: Intervention vs. no intervention
Outcome 1.2: Physical activity: change in time in moderate‐to‐vigorous intensity physical activity (minutes per day)
The mean difference in time in light‐intensity physical activity (LIPA) was −2 minutes (95% CI −28 to 25; 3 studies, 182 participants; low‐certainty evidence; Analysis 1.3; Figure 5), with substantial heterogeneity evident (I2 = 77%) .
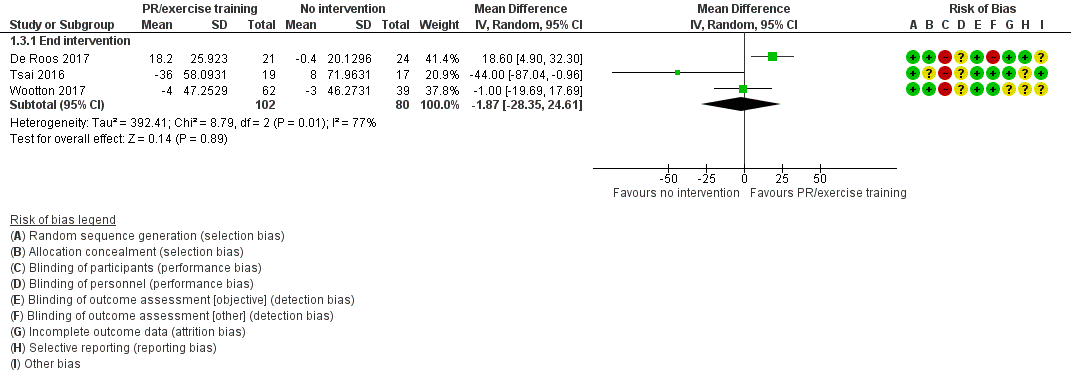
Forest plot of comparison 1: Intervention vs. no intervention
Outcome 1.4: Physical activity: change in time in light‐intensity physical activity (minutes per day)
The mean difference in total energy expenditure was −42 kcal (95% CI −90 to 7; 2 studies, 144 participants; low‐certainty evidence; Analysis 1.4; Figure 6).
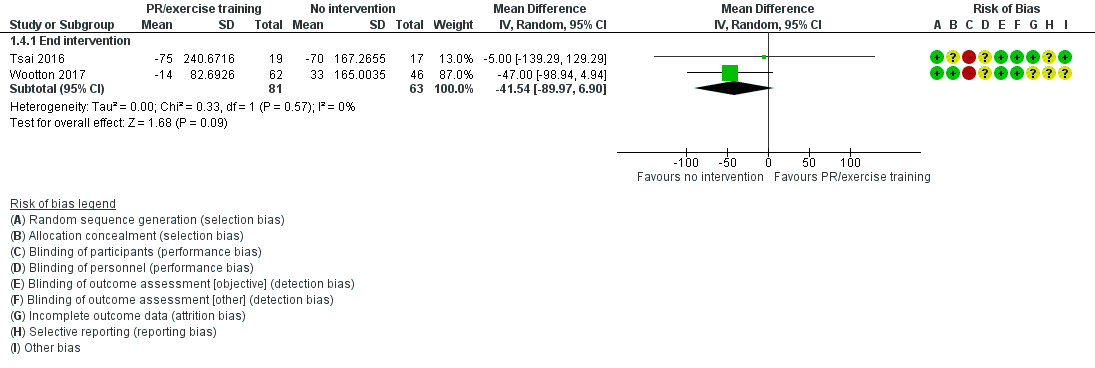
Forest plot of comparison 1: Intervention vs. no intervention
Outcome 1.3: Physical activity: change in total energy expenditure (kcal)
The mean difference in physical activity level (PAL) was 0.1 (95% CI −0.1 to 0.1; Tsai 2016, 36 participants; low‐certainty evidence; Table 1) following telerehabilitation, consisting of pulmonary rehabilitation delivered by videoconferencing into the home. The only clear improvement in physical activity following pulmonary rehabilitation was a greater increase in total time spent in physical activity (MD 23 minutes, 95% CI 6 to 40; 2 studies, 88 participants; low‐certainty evidence; Analysis 1.5; Figure 7).

Forest plot of comparison 1: Intervention vs. no intervention
Outcome 1.6: Physical activity: change in time in physical activity (total, minutes per day)
The mean difference in change in sedentary time was 17 minutes (95% CI −27 to 60; 2 studies, 137 participants; low‐certainty evidence; Analysis 1.6; Figure 8) following pulmonary rehabilitation compared to no intervention.

Forest plot of comparison 1: Intervention vs. no intervention
Outcome 1.5: Physical activity: change in sedentary time (minutes per day)
High‐intensity interval training versus no intervention
Improvements in physical activity were demonstrated following high‐intensity interval training compared to no intervention in two studies from the same research team. Improvements in time in 'lifestyle' physical activity (MD 9 minutes, 95% CI 4 to 15; Analysis 1.7; Figure 9), in LIPA (MD 28 minutes, 95% CI 16 to 41; Analysis 1.8; Figure 10), in MVPA (MD 6 minutes, 95% CI 4 to 8; Analysis 1.9; Figure 11) and sedentary (MD −34 minutes, 95% CI −56 to −13; Analysis 1.10; Figure 12) were demonstrated at end intervention (2 studies, 275 participants; moderate‐certainty evidence).

Forest plot of comparison 1: Intervention vs. no intervention
Outcome: 1.8 Physical activity: time in "lifestyle" physical activity (minutes per day)

Forest plot of comparison: 1 Intervention vs. no intervention
Outcome: 1.7 Physical activity: time in light‐intensity physical activity (minutes per day)

Forest plot of comparison 1: Intervention vs. vs. no intervention
Outcome 1.9: Physical activity: time in MVPA (minutes per day)

Forest plot of comparison 1: Intervention vs. no intervention
Outcome 1.10: Physical activity: sedentary time (minutes per day)
Additionally, improvements in step count (MD 1683 steps, 95% CI 721 to 2646) and vector magnitude units (VMU) (MD 89, 95% CI 13 to 165) were demonstrated following a 12‐week intervention (moderate‐certainty evidence; Louvaris 2016; 128 participants; Table 1).
Maintenance (telerehabilitation) following high‐intensity interval training versus no intervention
Increased time in LIPA (MD 44 minutes, 95% CI 27 to 62), moderate‐intensity (MD 7 minutes, 95% CI 4 to 10) and "lifestyle" physical activity (MD 7 minutes, 95% CI 1 to 13) were demonstrated following a 12‐month telerehabilitation maintenance programme compared to no intervention (moderate‐certainty evidence; Vasilopoulou 2017, 97 participants; Table 1). The mean difference in change in sedentary time was −31 minutes (95% CI −66 to 4; low‐certainty evidence; Vasilopoulou 2017, 97 participants; Table 1) at end intervention.
Maintenance (centre‐based) following high‐intensity interval training versus no intervention
Increased time in LIPA (MD 46 minutes, 95% CI 29 to 63), moderate‐intensity (MD 11 minutes, 95% CI 8 to 14) and "lifestyle" physical activity (MD 18 minutes, 95% CI 12 to 25) were demonstrated following a 12‐month centre‐based maintenance programme compared to no intervention. An improvement in sedentary time (MD −64 minutes, 95% CI −95 to −33; moderate‐certainty evidence; Vasilopoulou 2017, 100 participants; Table 1) was also demonstrated at end intervention.
COMPARISON: Intervention versus sham intervention
No studies presented data for this comparison.
COMPARISON: Intervention versus standard common intervention (clinically‐stable COPD)
A range of interventions have been tested in single studies such that meta‐analysis was not possible.
Nordic walking with education versus education
Increased movement intensity was demonstrated following a 12‐week Nordic walking programme with education compared to education alone (MD 0.51 m/s2, 95% CI 0.27 to 0.75) and maintained at nine‐month follow‐up (MD 0.42 m/s2, 95% CI 0.21 to 0.63; Breyer 2010, 60 participants; low‐certainty evidence; Analysis 3.1). However, it was the only fully‐reported physical activity variable in this study and no data were available for time sitting, standing and walking in the education group (Breyer 2010; Table 1).
Structured exercise training (COPE‐active) with self‐management versus self‐management
The mean difference in step count was 565 steps (95% CI −354 to 1484) after seven months of an 11‐month structured exercise training programme (COPE‐active) with self‐management compared to self‐management. An increase in step count was demonstrated at end intervention (MD 1178 steps, 95% CI 260 to 2096) and this improvement was maintained at 24‐month follow‐up (MD 1193 steps, 95% CI 226 to 2160; Effing 2011, 110 participants; low‐certainty evidence; Analysis 3.2).
Upper‐limb exercise with education versus education
The mean difference in time in LIPA was 3 minutes (95% CI −31 to 38) at end intervention and 14 minutes (95% CI −36 to 64) at 12‐month follow‐up after a four‐month study of upper‐limb exercise with education compared to education alone (Larson 2014, 34 participants; low‐certainty evidence; Analysis 3.3).
The mean difference in time spent in moderate‐intensity physical activity was 1 minute (95% CI −1 to 3), sedentary time was −57 minutes (95% CI −133 to 19) and proportion of time spent sedentary was −2% (95% CI −8 to 4) at end intervention (Larson 2014, 34 participants; low‐certainty evidence; Table 1).
Exercise training and long‐acting muscarinic antagonist/long‐acting beta agonist (LAMA/LABA) with behaviour modification versus placebo with behaviour modification
The mean difference in step count was −328 steps (95% CI −1214 to 558) after eight weeks and −541 steps (95% CI −1433 to 350) at end intervention following a 12‐week study for exercise training and LAMA/LABA with behavioural modification compared to placebo with behavioural modification (Troosters 2018; 8 weeks: 124 participants; 12 weeks: 112 participants; moderate‐certainty evidence; Analysis 3.4). The mean difference in walking time was −3 minutes (95% CI −13 to 6) after eight weeks and −6 minutes (95% CI −15 to 4) at end intervention (Troosters 2018; 8 weeks: 124 participants; 12 weeks: 112 participants; moderate‐certainty evidence; Analysis 3.5). The mean difference in walking intensity was −0.03 m/s2 (95% CI −0.11 to 0.05) after eight weeks and −0.02 (95% CI −0.10 to 0.06) at end intervention (Troosters 2018; 8 weeks: 124 participants; 12 weeks: 112 participants; moderate‐certainty evidence; Analysis 3.6).
Exercise training and LABA with LAMA and behaviour modification versus LAMA and behaviour modification
The mean difference in step count was −82 steps (95% CI −968 to 803) after eight weeks and 404 steps (95% CI −474 to 1281) at end intervention following a 12‐week study for exercise training and LABA with LAMA and behaviour modification compared to LAMA and behaviour modification (Troosters 2018; 8 weeks: 124 participants; 12 weeks: 114 participants; moderate‐certainty evidence; Analysis 3.7). The mean difference in walking time was −1 minute (95% CI −10 to 9) after eight weeks and 3 minutes (95% CI −6 to 13) at end intervention (Troosters 2018; 8 weeks: 124 participants; 12 weeks: 114 participants; moderate‐certainty evidence; Analysis 3.8). The mean difference in walking intensity was −0.05 m/s2 (95% CI −0.13 to 0.03) after eight weeks and 0.04 m/s2 (95% CI −0.04 to 0.12) at end intervention (Troosters 2018; 8 weeks: 124 participants; 12 weeks: 113 participants; moderate‐certainty evidence; Analysis 3.9).
Exercise training with LAMA/LABA and behaviour modification versus LAMA/LABA and behaviour modification
The mean difference in step count was −554 steps (95% CI −1432 to 325) after eight weeks and −837 steps (95% CI −1708 to 33) at end intervention following a 12‐week study for exercise training with LAMA/LABA and behaviour modification compared to LAMA/LABA and behaviour modification (Troosters 2018; 8 weeks: 126 participants; 12 weeks: 117 participants; moderate‐certainty evidence; Analysis 3.10).
The mean difference in walking time was −4 minutes (95% CI −14 to 5) after eight weeks and −8 minutes (95% CI −18 to 1) at end intervention (Troosters 2018; 8 weeks: 126 participants; 12 weeks: 117 participants; moderate‐certainty evidence; Analysis 3.11).
Walking intensity was lower in the group without exercise training (−0.09 m/s2, 95% CI −0.17 to −0.01) after eight weeks. The mean difference in walking intensity was −0.04 m/s2 (95% CI −0.12 to 0.04) at end intervention (Troosters 2018; 8 weeks: 126 participants; 12 weeks: 115 participants; moderate‐certainty evidence; Analysis 3.12).
Exercise training and physical activity counselling with pedometer versus pedometer alone
An increase in step count (MD 3174 steps, 95% CI 1453 to 4895) was demonstrated following an eight‐week exercise training and physical activity counselling (in‐person) programme with pedometer compared to pedometer alone. This improvement was maintained at three‐month (MD 3841 steps, 95% CI 2225 to 5457) and 12‐month follow‐up (MD 2547 steps, 95% CI 927 to 4167; Varas 2018, 33 participants; moderate‐quality evidence; Analysis 3.13).
COMPARISON: Intervention versus intervention (clinically‐stable COPD)
Web‐based pulmonary rehabilitation versus centre‐based pulmonary rehabilitation
No data were presented in a seven‐week study of web‐based pulmonary rehabilitation compared to a centre‐based program (Chaplin 2017, 54 participants; very low‐certainty evidence; Table 1).
Exercise training (eccentric cycle training) versus exercise training (concentric cycle training)
No data were presented in a 10‐week study of eccentric cycle training compared to concentric training (Sena 2013, 16 participants; very low‐certainty evidence; Table 1).
Home‐based pulmonary rehabilitation versus centre‐based pulmonary rehabilitation
Similar results were demonstrated for change in step count (Analysis 4.1), time in MVPA (Analysis 4.2), number of MVPA bouts (Analysis 4.3), time in MVPA bouts (Analysis 4.4), sedentary time (Analysis 4.5), sedentary awake time (Analysis 4.6), number of sedentary bouts (Analysis 4.7), time in sedentary bouts (Analysis 4.8), METs (Analysis 4.9) and total energy expenditure (Analysis 4.10) at end intervention and 14‐month follow‐up in an equivalence study comparing an eight‐week home‐based pulmonary rehabilitation programme with a centre‐based programme (Holland 2017, 58 participants; low‐certainty evidence).
Water‐based exercise training versus land‐based exercise training
The mean difference in step count was 676 steps (95% CI −645 to 1997; Analysis 4.11) and total energy expenditure was 39 kcal (95% CI −14 to 92; Felcar 2018, Analysis 4.12). Ten participants in the water‐based group and five participants in the land‐based group were classified as "active" following a six‐month study of water‐based exercise training compared to a land‐based programme (Felcar 2018, 36 participants; low‐certainty evidence; Table 1).
Tai Chi versus pulmonary rehabilitation
An increase in step count was demonstrated in the Tai Chi group (MD 1349 steps, 95% CI 93 to 2605; Polkey 2018, 110 participants; moderate‐certainty evidence; Analysis 4.13) following 22 weeks in a 24‐week study of Tai Chi compared to pulmonary rehabilitation.
Calisthenics versus exercise training
"No significant differences" in step count, MVPA time, time walking, time standing, time sitting, time lying, active energy expenditure or total energy expenditure were reported following a 12‐week callisthenics and breathing exercises programme compared to exercise training (Probst 2011, 40 participants; low‐certainty evidence Table 1).
Exercise training (outdoor walking) versus exercise training (cycle ergometry)
The mean difference in step count was −928 steps (95% CI −2515 to 659) following a three‐week study comparing outdoor walking and cycle ergometry. The mean difference in step count was −267 steps (95% CI −1622 to 1088) at three‐month follow up (Gamper 2019, 16 participants; low‐certainty evidence; Analysis 4.14).
Physical activity counselling versus pulmonary rehabilitation
The mean difference in step count was −92 steps (95% CI −1710 to 1526; Widyastuti 2018, 36 participants; low‐certainty evidence; Table 1) following a six‐week physical activity counselling intervention (in‐person) compared to pulmonary rehabilitation.
The mean difference in step count was 1291 steps (95% CI −749 to 333) at end intervention following a 12‐week physical activity counselling intervention (in‐person) compared to six weeks of pulmonary rehabilitation. The mean difference in step count was 347 steps (95% CI −2216 to 2910) at three‐month follow‐up (O'Neill 2018, 26 participants; low‐certainty evidence; Analysis 4.15).
An improvement in number in MVPA bouts was demonstrated in the physical activity counselling group (MD 0.5, 95% CI 0.3 to 0.8).
The mean difference in time in MVPA was 6 minutes (95% CI −10 to 22) and time in MVPA bouts was 10 minutes (95% CI −2 to 21) at end intervention (O'Neill 2018, 26 participants; low‐certainty evidence; Table 1).
Exercise training with tapering supervision versus exercise training
The mean difference in total energy expenditure was 520 kcal (95% CI −105 to 1145) at end intervention and 400 kcal (95% CI −109 to 909) at 42‐week follow‐up after a 28‐week study of exercise training with tapered supervision compared to supervised exercise training (Rinaldo 2017, 24 participants; moderate‐certainty evidence; Analysis 4.16).
Adherence intervention versus pulmonary rehabilitation
The mean difference in step count was −159 steps (95% CI −1742 to 1424), time inactive was −2% (95% CI −9 to 5) and peak performance was 0 (95% CI −9 to 9) following six months of an adherence intervention compared to eight weeks of pulmonary rehabilitation (Steele 2019, 63 participants; low‐certainty evidence; Table 1).
Maintenance following high‐intensity interval training: telerehabilitation versus centre‐based programme
Less time was spent in lifestyle (MD −11 minutes, 95% CI −18 to −4) and moderate‐intensity physical activity (MD −4 minutes, 95% CI −7 to −1) in the telerehabilitation group compared to a centre‐based group following a 12‐month study of maintenance after eight weeks of high‐intensity interval exercise training.
The mean difference in time in LIPA was −2 minutes (95% CI −19 to 15) and sedentary time was 33 minutes (95% CI −3 to 69; Vasilopoulou 2017, 100 participants; moderate‐quality evidence; Table 1).
COMPARISON: Intervention versus no intervention (acute exacerbation of COPD)
Inpatient exercise training versus no intervention
No clear improvement in physical activity was demonstrated following two inpatient exercise‐training interventions.
The median step count for the exercise training group was 4215 steps (interquartile range (IQR) 2133 to 6693) compared to no intervention (median 2198 steps (IQR 1242 to 4857; P = 0.07; low‐certainty evidence; Tahirah 2015, 34 participants; Table 1) at discharge following inpatient walking and functional‐resistance training compared to no intervention.
The mean difference for time in standing was 15 minutes (95% CI −57 to 87), sitting was −11 minutes (95% CI −94 to 72), walking was −19 minutes (95% CI −40 to 2) and lying was 21 minutes (95% CI −78 to 120; low‐certainty evidence; Borges 2014, 29 participants; Table 1) four weeks after discharge following inpatient resistance training compared to no intervention.
INTERVENTION: Physical activity counselling
See summary of findings Table 3.
COMPARISON: Intervention versus no intervention (clinically‐stable COPD)
Physical activity counselling versus no intervention
We were unable to pool studies for quantitative synthesis due to data type (Altenburg 2015) and heterogeneous interventions (Arbillaga‐Etxarri 2018; Demeyer 2017; Hospes 2009; Priori 2017; Saini 2017; Wootton 2017; see Characteristics of included studies).
An increased proportion of time spent in moderate‐intensity physical activity (MD 32%, 95% CI 8 to 55; Priori 2017, 18 participants; very low‐certainty evidence; Table 1) was demonstrated following an eight‐week study of an automated coaching intervention compared to no intervention.
The same 12‐week in‐person intervention was used in three studies (two within this comparison). The mean difference in step count in one study was 1700 steps (95% CI −678 to 4078; Hospes 2009, 35 participants; low‐certainty evidence; Analysis 1.11) compared to no intervention. In a subsequent study, the median change in step count in participants recruited from primary care was 537 steps (IQR −611 to 1740) in the physical activity counselling group and 431 steps (IQR −899 to 749) in the no‐intervention group at end intervention (P = 0.48). The median change in step count was 157 steps (IQR −1679 to 994) in the physical activity counselling group and 48 steps (IQR −1004 to 885) in the no‐intervention group (P = 0.90) at 12‐month follow‐up (Altenburg 2015; 12 weeks: 40 participants; 12 months: 38 participants; low‐certainty evidence; Table 1). A greater median change in step count in participants recruited from secondary care was demonstrated in the physical activity counselling group (1002 steps, IQR −612 to 3077) compared to the no‐intervention group (−814 steps, IQR −2827 to 1063) at end intervention (P = 0.007). The median change in step count was 1128 steps (IQR −1322 to 2707) in the physical activity counselling group and −217 steps (IQR −1951 to 1147) in the no‐intervention group (P = 0.15) at 12‐month follow‐up (Altenburg 2015; 12 weeks: 43 participants; 12 months: 39 participants; low‐certainty evidence; Table 1). Participants in secondary care had more severe disease, as indicated by a lower baseline FEV1 (Characteristics of included studies). Subgroup analyses for participants with ≤ 10,000 steps per day at baseline revealed a similar pattern (Altenburg 2015; Table 1).
An increase in the mean difference for step count was 1548 steps (95% CI 1045 to 2051; Demeyer 2017; 280 participants; moderate‐certainty evidence; Analysis 1.11) following a 12‐week telecoaching intervention compared to no intervention. Improvements in walking time (MD 17 minutes, 95% CI 10 to 24), movement intensity (MD 0.09 m/s2, 95% CI 0.04 to 0.14) and MVPA time (MD 11 minutes, 95% CI 7 to 15) were also demonstrated (Demeyer 2017, 280 participants; moderate‐certainty evidence; Table 1).
The mean difference in step count was 177 steps (95% CI −828 to 1182; Arbillaga‐Etxarri 2018, 280 participants; low‐certainty evidence; Analysis 1.11) following a 12‐month Urban Training intervention compared to no intervention.
The mean difference in change in proportion of time in moderate‐intensity physical activity was −9% (standard deviation (SD) 24) in the physical activity counselling group and −21% (SD 21) in the no‐intervention group (P = 0.116) following an eight‐week physical activity counselling intervention compared to no intervention (Saini 2017, 28 participants; very low‐certainty evidence; Table 1).
The mean difference in step count was −617 steps (95% CI −1669 to 453), time in LIPA was −27 min (95% CI −70 to 14), time in moderate‐intensity physical activity was 20 minutes (95% CI −1 to 41), time in vigorous‐intensity physical activity was 0 minutes (95% CI 0 to 1) and energy expenditure wads 17 kcal (95% CI −131 to 164) following 12 months of physical activity counselling compared to no intervention, which was completion of phase 2 of a 14‐month study that all participants began with eight weeks of ground‐based walking training (Wootton 2017, 43 participants; low‐certainty evidence; Table 1).
COMPARISON: Intervention versus sham intervention
No studies presented data for this comparison.
COMPARISON: Intervention versus standard common intervention (clinically‐stable COPD)
Physical activity counselling with optional supervised exercise versus optional supervised exercise
The mean difference in step count was 986 steps (95% CI −1553 to 3525; Tabak 2014a, 29 participants; low‐certainty evidence; Table 1) following a three‐week physical activity counselling intervention (telecoaching) with optional supervised exercise compared to optional supervised exercise.
The mean difference in step count was 240 steps (95% CI −417 to 897) at end intervention and −77 steps (95% CI −763 to 609) at 12‐month follow‐up of a study of a six‐month physical activity counselling intervention (text message) following pulmonary rehabilitation with optional supervised exercise compared to optional supervised exercise (Vorrink 2016, 132 participants; low‐certainty evidence; Analysis 3.14). The mean difference in METs was −0.08 (95% CI −0.22 to 0.06) at end intervention and 0.05 (95% CI −0.10 to 0.20) at 12‐month follow‐up (Vorrink 2016, 121 participants; low‐certainty evidence; Analysis 3.15).
Pedometer with physical activity counselling versus physical activity counselling
An increase in step count was demonstrated (MD 2942 steps, 95% CI 1881 to 4003; Mendoza 2015, 97 participants; moderate‐certainty evidence; Table 1) following a 12‐week study of pedometer use with physical activity counselling (in‐person) compared to physical activity counselling alone.
Physical activity counselling with pedometer versus pedometer
No data were presented for step count (completer data only) in a 12‐week study of a physical activity counselling intervention (phone call) with pedometer compared to pedometer alone (Bender 2016, 99 participants; very low‐certainty; Table 1).
The mean difference in step count was −75 steps (95% CI −1002 to 852; Wan 2017, 109 participants; low‐certainty evidence; Analysis 3.16) following a 12‐week physical activity counselling intervention (web‐based) with pedometer compared to pedometer alone.
The mean difference in step count was 1427 steps (95% CI −1482 to 4336) after 12 weeks and −63 steps (95% CI −3080 to 2754) following a six‐month physical activity counselling intervention (text message, coached) with pedometer compared to pedometer alone (Nguyen 2009, 17 participants; low‐certainty evidence; Analysis 3.16.
The mean difference in active time was 6 minutes (95% CI −2 to 13) after 12 weeks and −0 minutes (95% CI −7 to 7) at end intervention (Nguyen 2009, 17 participants; low‐certainty evidence; Analysis 3.17.
The mean difference in inactive time was −4 minutes (95% CI −15 to 8) after 12 weeks and 0 minutes (95% CI −12 to 1) at end intervention (Nguyen 2009, 17 participants; low‐certainty evidence; Analysis 3.18).
The mean difference in peak performance was 0 steps/min (95% CI −15 to 15) after 12 weeks and −12 steps/min (95% CI −27 to 3) at end intervention (Nguyen 2009, 17 participants; low‐certainty evidence; Analysis 3.19).
An increase in step count was demonstrated after four months (MD 793 steps, 95% CI 236 to 1350; 201 participants) but not at end intervention (MD 107 steps, 95% CI −498 to 712; Moy 2015a, 238 participants; low‐certainty evidence; Analysis 3.16) following a 12‐month physical activity counselling intervention (web‐based) with pedometer compared to pedometer alone.
Pedometer during pulmonary rehabilitation
The mean difference in step count was 419 steps in a seven‐day study of pedometer use during pulmonary rehabilitation with awareness of the purpose of the pedometer compared to lack of awareness (Singh 1998, 19 participants; very low‐certainty evidence; Table 1).
Physical activity counselling with pulmonary rehabilitation versus pulmonary rehabilitation
An increase in step count was demonstrated (MD 1661 steps, 95% CI 552 to 2770; Mantoani 2018, 44 participants; very low‐certainty evidence; Table 1) following a 12‐week physical activity counselling intervention (web‐based) with pulmonary rehabilitation compared to pulmonary rehabilitation.
The addition of the same 12‐week physical activity counselling intervention (in‐person) had mixed results in two studies where participants in both groups received pulmonary rehabilitation.
The mean difference in step count was 680 steps (95% CI −1105 to 2465; De Blok 2006, 16 participants; low‐certainty evidence; Analysis 3.20) following a 12‐week study of physical activity counselling with pulmonary rehabilitation compared to pulmonary rehabilitation alone. In a subsequent study, a greater median change in step count was demonstrated in the physical activity counselling and pulmonary rehabilitation group (547 steps, IQR 187 to 1323) compared to the pulmonary rehabilitation group (−211 steps, IQR −1337 to 1038) at end intervention (P = 0.03). The median change in step count was −569 steps (IQR −2512 to 1551) in the physical activity counselling and pulmonary rehabilitation group, and −1137 steps (IQR −2376 to 1427) in the pulmonary rehabilitation group (P = 0.58) at 12‐month follow‐up (Altenburg 2015; 12 weeks: 37 participants; 12 months: 23 participants; low‐certainty evidence; Table 1).
Longer studies have also had contradictory findings.
An increase in step count was demonstrated (MD 4010 steps, 95% CI 1407 to 6613) at 12 weeks and end intervention (MD 3267 steps, 95% CI 589 to 5944; Cruz 2016, 26 participants; moderate‐certainty evidence; Analysis 3.20) following a six‐month study of a physical activity counselling intervention (in‐person) with 12 weeks of pulmonary rehabilitation compared to 12 weeks of pulmonary rehabilitation. An increase in MVPA time was demonstrated (MD 31 minutes, 95% CI 10 to 52) at 12 weeks and end intervention (MD 24 minutes, 95% CI 2 to 45; Cruz 2016, 26 participants; moderate‐certainty evidence; Analysis 3.21). An increase in total physical activity time was demonstrated (MD 68 minutes, 95% CI 18 to 117) at 12 weeks and end intervention (MD 66 minutes, 95% CI 10 to 122; Cruz 2016, 26 participants; moderate‐certainty evidence; Analysis 3.22). An improvement in sedentary time was demonstrated at 12 weeks (MD −90 minutes, 95% CI −159 to −20). The mean difference in sedentary time was 12 minutes (95% CI −73 to 97) at end intervention; Cruz 2016, 26 participants; moderate‐certainty evidence; Analysis 3.23).
The median difference in accelerometer‐assessed step count was 272 steps (IQR −342 to 782) in the physical activity counselling with pulmonary rehabilitation group and 155 steps (IQR −438 to 867) in the pulmonary rehabilitation group (P = 0.99) following a study of a six‐month in‐person physical activity counselling intervention with eight weeks of pulmonary rehabilitation compared to eight weeks of pulmonary rehabilitation alone. The median difference in pedometer‐assessed step count was 727 steps (IQR −1493 to 3119) in the physical activity counselling with pulmonary rehabilitation group and 892 steps (IQR −1187 to 2534) in the pulmonary rehabilitation group (P = 0.55) at end intervention. The median difference in MVPA time was 11 minutes (IQR −1 to 33) in the physical activity counselling with pulmonary rehabilitation group and 11 minutes (IQR −2 to 28) in the pulmonary rehabilitation group (P = 0.62) at end intervention (Nolan 2017, 122 participants; low‐certainty evidence; Table 1).
An improvement in change in walking time was demonstrated (MD 39 minutes, 95% CI 1 to 78) following a 12‐month study of physical activity counselling with pulmonary rehabilitation compared to pulmonary rehabilitation alone. The mean difference in standing time was 11 minutes (95% CI −18 to 40), lying time was −24 minutes (95% CI −72 to 24), frequency of postural changes was 21 (95% CI −23 to 65) and sitting time was 53 minutes (95% CI −21 to 127) at end intervention (Kawagoshi 2015, 27 participants; low‐certainty evidence; Table 1).
An improvement in change in step count was demonstrated (MD 1319 steps, standard error (SE) 571, P = 0.02) at end intervention and nine‐month follow‐up (MD 1348 steps, SE 628, P = 0.03) following 12 weeks of physical activity counselling with pulmonary rehabilitation compared to pulmonary rehabilitation after all participants undertook 12 weeks of pulmonary rehabilitation. The mean difference in change in MVPA time was 8 minutes (SE 4) (P = 0.11) at end intervention and an improvement in change in MVPA time was demonstrated at nine‐month follow‐up (MD 13 minutes, (SE 5), P = 0.02; Loeckx 2018, 50 participants; very low‐certainty evidence; Table 1).
Physical activity counselling with pulmonary rehabilitation versus sham intervention with pulmonary rehabilitation
The mean difference in step count was 182 steps (95% CI −812 to 1176) after 12 weeks and −532 steps (95% CI −1584 to 520) following a six‐month study of a physical activity counselling intervention (in‐person) with pulmonary rehabilitation compared to a sham intervention with pulmonary rehabilitation (Burtin 2015; 12 weeks: 61 participants; 6 months: 50 participants; very low‐certainty evidence; Analysis 3.24). The mean difference in time in MVPA was MD −1 minute (95% CI −13 to 12) after 12 weeks and −7 minutes (95% CI −16 to 3) at end intervention (Burtin 2015; 12 weeks: 61 participants; 6 months: 50 participants; very low‐certainty evidence; Analysis 3.25). The mean difference in walking time was −3 minutes (95% CI −12 to 7) after 12 weeks and −1 minute (95% CI −18 to 16) at end intervention (Burtin 2015; 12 weeks: 61 participants; 6 months: 50 participants; very low‐certainty evidence; Analysis 3.26). The mean difference in total physical activity time was −12 minutes (95% CI −39 to 15) after 12 weeks and −34 minutes (95% CI −48 to −20) at end intervention (Burtin 2015; 12 weeks: 61 participants; 6 months: 50 participants; very low‐certainty evidence; Analysis 3.27).
COMPARISON: Intervention versus intervention
No studies presented data for this comparison.
COMPARISON: Intervention versus no intervention (acute exacerbation of COPD)
Two studies have evaluated physical activity counselling following hospital admission for AECOPD.
Physical activity counselling versus no intervention
The mean difference in step count was −29 steps (95% CI −969 to 911), walking time was 0 minutes (95% CI −12 to 12) and walking intensity was −0.02 m/s2 (95% CI −0.06 to 0.02; Hornikx 2015, 26 participants; low‐certainty evidence; Table 1) after a four‐week study comparing physical activity counselling to no intervention following hospital admission for AECOPD.
Feedback and education versus no intervention; education versus no intervention
No data were presented for a 14‐day study of feedback and education compared to no intervention (14 participants) or education compared to no intervention (9 participants) following hospital admission for AECOPD (Orme 2018; very low‐certainty evidence; Table 1).
COMPARISON: Intervention versus standard common intervention (acute exacerbation of COPD)
Feedback with education versus education
No data were presented in a 14‐day study of feedback with education compared to education (Orme 2018; 11 participants; very low‐certainty evidence; Table 1).
INTERVENTION: Self‐management
See summary of findings Table 4.
COMPARISON: Intervention versus no intervention (clinically‐stable COPD)
Self‐management versus no intervention
An increase in step count was demonstrated (MD 547 steps, 95% CI 12 to 1082) following a six‐week SPACE programme compared to no intervention. The mean difference in sedentary time was −23 minutes (95% CI −77 to 31). The median time in bouts of physical activity was 142 minutes (95% CI 91 to 190) in the self‐management group and 96 minutes (95% CI 56 to 135) in the no‐intervention group at end intervention (P = 0.215). The mean difference in total energy expenditure was 16 kcal (95% CI −100 to 132) at end intervention (Mitchell 2013, 117 participants; very low‐certainty evidence; Table 1).
Improvement in 'IMA' (time integral of the modulus of accelerometer output) was demonstrated (MD 176 cpm, 95% CI 53 to 298) after four weeks and at end intervention (MD 176 cpm, 95% CI 51 to 301) following a 12‐week self‐management intervention compared to no intervention (Tabak 2014b, 20 participants; moderate‐certainty evidence; Analysis 1.12).
The mean difference in time in MVPA was 12 minutes (95% CI −21 to 45) at 12 months following a six‐month self‐management programme compared to no intervention (Jolly 2018, 411 participants; moderate‐certainty evidence; Table 1).
COMPARISON: Intervention versus sham intervention (clinically‐stable COPD)
Health mentoring versus sham intervention
The mean difference in step count was 61 steps (95% CI −951 to 1073) following a 12‐month study of phone call‐based health mentoring compared to a sham intervention (Schuz 2015, 120 participants; low‐certainty evidence; Analysis 2.1).
COMPARISON: Intervention versus standard common intervention (clinically‐stable COPD)
Self‐efficacy training with upper‐limb exercise versus education with upper‐limb exercise
An increase in time in LIPA was demonstrated (MD 43 minutes, 95% CI 15 to 71) at end intervention and the mean difference was 32 minutes (95% CI −18 to 82) at 12‐month follow‐up after a four‐month study of self‐efficacy training with upper‐limb exercise compared to upper‐limb exercise alone (Larson 2014, 35 participants; low‐certainty evidence; Analysis 3.28). The mean difference in time spent in moderate‐intensity physical activity was 2 minutes (95% CI −1 to 5), sedentary time was 25 minutes (95% CI −49 to 99) and the proportion of time spent sedentary was 0% (95% CI −6 to 6) at end intervention (Larson 2014, 35 participants; low‐certainty evidence; Table 1).
COMPARISON: Intervention versus intervention (clinically‐stable COPD)
Self‐management versus education and symptom monitoring
An increase in physical activity was demonstrated in the self‐management group (mean 13 minutes (SE 1)) compared to the education and symptom‐monitoring group (mean 11 minutes (SE 1); P = 0.045) following 16 weeks of self‐management compared to education and symptom monitoring. An increase in total energy expenditure was also demonstrated in the self‐management group (MD 3605 (SE 211)) compared to the education and symptom‐monitoring group (MD 3113 (SE 212); P = 0.022) at end intervention. The mean difference in time in moderate‐intensity physical activity was 0.5 minutes (95% CI −0.6 to 1.6) at end intervention (Blumenthal 2014, 326 participants; low‐certainty evidence; Table 1).
COMPARISON: Intervention versus no intervention (acute exacerbation of COPD)
Self‐management versus no intervention
The mean difference in step count was 310 steps (95% CI −1665 to 2285), time in physical activity was 15 minutes (95% CI −30 to 60), time in moderate‐intensity physical activity was 13 minutes (95% CI −30 to 56), time in vigorous‐intensity physical activity was 2 minutes (95% CI −1 to 5), sedentary time was 4 minutes (95% CI −75 to 83), active energy expenditure was 85 kcal (95% CI −108 to 278), and total energy expenditure was −30 kcal (95% CI −225 to 165) following a seven‐day post‐admission self‐management programme of activity, coping and education (SPACE) compared to no intervention (Kanabar 2015, 25 participants; very low‐certainty evidence; Table 1).
COMPARISON: Intervention versus standard common intervention (acute exacerbation of COPD)
Health coaching with pulmonary rehabilitation referral versus pulmonary‐rehabilitation referral
No data were presented in a 12‐month post‐admission study of the addition of health coaching to pulmonary‐rehabilitation referral compared to pulmonary‐rehabilitation referral alone (Benzo 2016, 214 participants; very low‐certainty evidence; Table 1).
INTERVENTION: Pharmacological treatments
See summary of findings Table 5.
COMPARISON: Intervention versus no intervention
No studies presented data for this comparison.
COMPARISON: Intervention versus sham intervention (clinically‐stable COPD)
LAMA versus placebo
Two three‐week studies examined the impact of a long‐acting muscarinic antagonist (LAMA) compared to placebo. Individual‐level pre‐cross‐over data were obtained directly from the authors and used for combined analysis. The median change in step count was 104 steps (IQR −603 to 1228) in the LAMA group and 113 steps (IQR −936 to 1216) in the placebo group (P = 0.64) at end intervention. The median change in time in MVPA was −1 minute (IQR −17 to 24) in the LAMA group and −6 minutes (IQR −18 to 15) in the placebo group (P = 0.07) at end intervention. The median change in active energy expenditure was 15 kcal (IQR −103 to 117) in the LAMA group and −24 kcal (IQR −104 to 43) in the placebo group (P = 0.08) at end intervention. The median change in PAL was 0.00 (IQR −0.07 to 0.09) in the LAMA group and −0.01 (IQR −0.06 to 0.09) in the placebo group (P = 0.80) at end intervention (Beeh 2014; Magnussen 2017; 133 participants; moderate‐certainty evidence; Table 1).
No data were presented in another 12‐week study comparing LAMA with placebo (NCT00144326, 250 participants; very low‐certainty evidence; Table 1).
LAMA/LABA versus placebo
Two short‐term studies have assessed the effect of LAMA/long‐acting beta2 agonist (LABA); three weeks of indacaterol/glycopyrronium 110/50 μg once daily, Watz 2016; four weeks of aclidinium bromide/formoterol fumarate 400/12 μg twice daily, Watz 2017) compared to placebo. Meta‐analyses demonstrated improvements in step count (MD 531 steps, 95% CI 167 to 895; 2 studies, 426 participants; high‐certainty evidence; Analysis 2.2; Figure 13), time in MVPA (MD 10 minutes, 95% 4 to 15; 2 studies, 423 participants; high‐certainty evidence; Analysis 2.3; Figure 14) and active energy expenditure (MD 44 kcal, 95% CI 18 to 70; 2 studies, 423 participants; high‐certainty evidence; Analysis 2.4; Figure 15). Some heterogeneity was evident for step count (I2 = 27%), but not for other outcomes. Additionally, a reduced odds ratio (OR) was demonstrated for being classified as 'inactive' post‐intervention (OR 0.27, 95% CI 0.1 to 0.5; Watz 2017, 250 participants; high‐certainty evidence; Table 1).

Forest plot of comparison 2: Intervention vs. placebo
Outcome 2.2: Physical activity: change in step count (steps per day)

Forest plot of comparison 2: Intervention vs. placebo
Outcome 2.3: Physical activity: change in time in moderate‐to‐vigorous intensity physical activity (minutes per day)

Forest plot of comparison 2: Intervention vs. placebo
Outcome 2.4: Physical activity: change in active energy expenditure (kcal)
COMPARISON: Intervention versus standard common intervention (clinically‐stable COPD)
LAMA with behaviour modification versus placebo with behaviour modification
The mean difference in time in MVPA was 8 minutes (95% CI −184 to 202), time in LIPA was 10 minutes (95% CI −6 to 26), odds ratio for being classified as 'inactive' post‐intervention 0.86 (95% CI 0.57 to 1.30; P = 0.477) following a six‐month study of LAMA compared to placebo (Troosters 2014, 426 participants; moderate‐certainty evidence; Table 1).
The mean difference in step count was −245 steps (95% CI −1146 to 655) after eight weeks. A deterioration in step count was demonstrated in the intervention group (MD −945 steps, 95% CI −1836 to −54) at end intervention following a 12‐week study for LAMA compared to placebo (Troosters 2018; 8 weeks: 120 participants; 12 weeks: 111 participants; moderate‐certainty evidence; Analysis 3.29). The mean difference in walking time was −3 minutes (95% CI −12 to 7) after eight weeks and −9 minutes (95% CI −20 to 2) at end intervention (Troosters 2018; 8 weeks: 120 participants; 12 weeks: 112 participants; moderate‐certainty evidence; Analysis 3.30). The mean difference in walking intensity was 0.02 m/s2 (95% CI −0.06 to 0.10) after eight weeks and −0.06 m/s2 (95% CI −0.14 to 0.02) at end intervention (Troosters 2018; 8 weeks: 120 participants; 12 weeks: 110 participants; moderate‐certainty evidence; Analysis 3.31).
LAMA/LABA with behaviour modification versus placebo with behaviour modification
The mean difference in step count was 226 steps (95% CI −668 to 1119) after eight weeks and 296 steps (95% CI −585 to 1177) at end intervention following a 12‐week study of LAMA/LABA compared to placebo (Troosters 2018; 8 weeks: 122 participants; 12 weeks: 115 participants; moderate‐certainty evidence; Analysis 3.32. The mean difference in walking time was 1 minute (95% CI −8 to 11) after eight weeks and 3 minutes (95% CI −7 to 12) at end intervention (Troosters 2018; 8 weeks: 122 participants; 12 weeks: 115 participants; moderate‐certainty evidence; Analysis 3.33). The mean difference in walking intensity was 0.06 m/s2 (95% CI −0.02 to 0.14) after eight weeks and 0.02 m/s2 (95% CI −0.06 to 0.10) at end intervention (Troosters 2018: 8 weeks: 120 participants; 12 weeks: 112 participants; moderate‐certainty evidence; Analysis 3.34).
LABA with LAMA and behaviour modification versus LAMA and behaviour modification
The mean difference in step count was 471 steps (95% CI −422 to 1364) after eight weeks and 1241 steps (95% CI 370 to 2112) at end intervention following a 12‐week study of LABA with LAMA and behaviour modification compared to LAMA and behaviour modification (Troosters 2018; 8 weeks: 122 participants; 12 weeks: 116 participants; moderate‐certainty evidence; Analysis 3.35). The mean difference in walking time was 4 minutes (5%CI −6 to 13) after eight weeks and 11 minutes (95% CI 2 to 21) at end intervention (Troosters 2018; 8 weeks: 122 participants; 12 weeks: 117 participants; moderate‐certainty evidence; Analysis 3.36). The mean difference in walking intensity was 0.04 m/s2 (95% CI −0.04 to 0.12) after eight weeks and 0.08 m/s2 (95% CI −0.00 to 0.16) at end intervention (Troosters 2018; 8 weeks: 122 participants; 12 weeks: 114 participants; moderate‐certainty evidence; Analysis 3.37).
Angiotensin‐converting enzyme (ACE) inhibitor with pulmonary rehabilitation versus placebo with pulmonary rehabilitation
The mean difference in change in step count was −943 steps (95% CI −2372 to 486) following a 10‐week study of an ACE inhibitor and pulmonary rehabilitation compared to a placebo and pulmonary rehabilitation. A deterioration in PAL was demonstrated in the ACE inhibitor group (MD −0.10, 95% CI −0.20 to −0.00; Curtis 2016, 40 participants; moderate‐certainty evidence; Table 1).
COMPARISON: Intervention versus intervention (clinically‐stable COPD)
Inhaled corticosteroid and LABA versus inhaled corticosteroid and LABA
The mean difference in step count was 316 steps (95% CI −838 to 1470) following a 12‐week study of inhaled corticosteroid (beclomethasone) and LABA compared to inhaled corticosteroid (budesonide) and LABA (NCT01351792, 59 participants; very low‐certainty evidence; Table 1).
LAMA versus LAMA
No data were presented in an eight‐week study of LAMA (aclidinium bromide) compared to LAMA (tiotropium; Nakamura 2016, 44 participants; very low‐certainty evidence; Table 1).
INTERVENTION: Nutritional supplementation
COMPARISON: Intervention versus no intervention (clinically‐stable COPD)
Nutritional supplement versus no intervention
The mean difference in PAL was 0.02 (95% CI −0.04 to 0.08) after four weeks and 0.06 (95% CI −0.12 to 0.24) after 12 weeks following pulmonary rehabilitation or hospital admission for nutritional supplementation compared to no intervention (Goris 2003: 4 weeks: 20 participants; 12 weeks: 19 participants; moderate‐certainty evidence; Analysis 1.13). The mean difference in total energy expenditure was −0.6 MJ (95% CI −3.59 to 2.29) after four weeks and 0.5 MJ (95% CI −1.39 to 2.39) after 12 weeks (Goris 2003; 4 weeks: 20 participants; 12 weeks: 19 participants; moderate‐certainty evidence; Analysis 1.14).
COMPARISON: Intervention versus sham intervention (clinically‐stable COPD)
Nutritional supplement versus placebo
The mean difference in step count was 228 steps (95% CI −69 to 525) after four weeks of a 12‐week study of essential amino acid supplementation compared to placebo. An increase in step count (MD 577 steps, 95% CI 341 to 813) was demonstrated at end intervention (Dal Negro 2012, 88 participants; low‐certainty evidence; Analysis 2.5). An increase in energy expenditure for ambulation was demonstrated after four weeks (MD 0.6 kcal/step/FFM kg, 95% CI 0.3 to 1.0) and at end intervention (MD 2.3 kcal/step/FFM kg; 95% CI 1.8 to 2.8; Dal Negro 2012, 88 participants; low‐certainty evidence; Analysis 2.6).
COMPARISON: Intervention versus standard common intervention (clinically‐stable COPD)
Nutritional supplement and pulmonary rehabilitation versus placebo and pulmonary rehabilitation
The mean difference in change in step count was 719 steps (95% CI −635 to 2073) after four months of a 15‐month study of nutritional supplementation and pulmonary rehabilitation compared to a placebo and pulmonary rehabilitation in people with low muscle mass. An increase in step count was demonstrated (MD 1030 steps, 95% CI 101 to 1959) after eight months. The mean difference in step count was 796 steps (95% CI −201 to 1793; Van de Bool 2017, 61 participants; moderate‐certainty evidence; Analysis 3.38) at 15‐month follow‐up.
COMPARISON: Intervention versus intervention
No studies presented data for this comparison.
COMPARISON: Intervention versus standard common intervention (acute exacerbation of COPD)
Enriched nutritional supplement and inpatient pulmonary rehabilitation versus nutritional supplement and inpatient pulmonary rehabilitation
The mean difference in step count was 200 steps (95% CI −913 to 1313) following eicosapentaenoic acid‐enriched nutritional supplement and inpatient pulmonary rehabilitation compared to an unenriched nutritional supplement and inpatient pulmonary rehabilitation during hospital admission for an acute exacerbation of COPD. The mean difference in energy expenditure was 80 kcal (95% CI −72 to 232; Ogasawara 2018, 45 participants; low‐certainty evidence; Table 1).
INTERVENTION: Supplemental oxygen
COMPARISON: Intervention versus no intervention
No studies presented data for this comparison.
COMPARISON: Intervention versus sham intervention (clinically‐stable COPD)
Supplemental oxygen versus placebo
The mean difference in "domestic activity counts" was 15 (95% CI −21 to 51) following an eight‐week study of supplemental oxygen following pulmonary rehabilitation compared to placebo (Sandland 2008, 20 participants; moderate‐certainty evidence; Table 1).
COMPARISON: Intervention versus standard common intervention (clinically‐stable COPD)
Supplemental oxygen and pulmonary rehabilitation versus sham and pulmonary rehabilitation
The mean difference in change in step count was 340 steps (95% CI −145 to 825) following eight weeks of supplemental oxygen and pulmonary rehabilitation compared to sham and pulmonary rehabilitation in people with desaturation on the six‐minute walk test (6MWT). The mean difference in change in step count was −316 steps (95% CI −865 to 233; Analysis 3.39) at six‐month follow‐up. The mean change in time in moderate‐intensity physical activity was 3 minutes (95% CI −5 to 11) at end intervention and −2 minutes (95% CI −11 to 7; Analysis 3.40) at follow‐up. The mean change in time in vigorous‐intensity physical activity was −1 minute (95% CI −3 to 1) at end intervention and −1 minute (95% CI −3 to 1; Analysis 3.41) at follow‐up. The mean change in LIPA time was −6 minutes (95% CI −35 to 23) at end intervention and −9 minutes (95% CI −41 to 23; Analysis 3.42) at follow‐up. The mean change in total energy expenditure was −59 kcal (95% CI −166 to 48) at end intervention and −4 kcal (95% CI −127 to 199; Analysis 3.43) at follow‐up. The mean change in sedentary time was 17 minutes (95% CI −28 to 62) at end intervention and 29 minutes (95% CI −25 to 75; Analysis 3.44) at follow‐up (Alison 2019: 8 weeks: 87 participants; 6 months: 65 participants; moderate‐certainty evidence).
COMPARISON: Intervention versus intervention (clinically‐stable COPD)
Lightweight versus standard oxygen‐cylinder use
The mean difference in "mid‐day activity" was 34 VMU/min (95% CI −23 to 91) following a six‐month study of lightweight ambulatory supplemental oxygen compared to supplemental oxygen with E‐cylinder (Casaburi 2012, 17 participants; low‐certainty evidence; Analysis 4.17).
INTERVENTION: Other interventions
COMPARISON: Intervention versus no intervention (clinically‐stable COPD)
Four‐wheeled walker versus no intervention
An increase in step count (MD 4081 steps, 95% CI 818 to 7344) was demonstrated over four weeks following pulmonary rehabilitation using a four‐wheeled walker compared to no intervention (Ng 2015, 17 participants; very low‐certainty evidence; Table 1).
Endobronchial valve surgery versus no intervention
An increase in step count (MD 1400 steps, 95% CI 655 to 2145), proportion of time walking MD 1% (95% CI 0 to 2) and movement intensity (MD 0.01 m/s2, 95% CI 0.00 to 0.02) were demonstrated six months after endobronchial valve surgery compared to no intervention. The mean difference in the proportion of time sitting was −2% (95% CI −5 to 1) and time inactive was −1 minute (95% CI −3 to 1) after six months (Hartman 2016, 43 participants; moderate‐certainty evidence; Table 1).
COMPARISON: Intervention versus sham intervention (clinically‐stable COPD)
Singing versus sham intervention
A deterioration in step count (MD −1774 steps, 95% CI −2848 to −700) and activity‐related energy expenditure (MD −373 kJ, 95% CI −625 to −121) were demonstrated in the intervention group following an eight‐week singing intervention compared to a sham intervention. The mean difference in time in physical activity was −142 minutes (95% CI −263 to −22) and sedentary time was −9 minutes (95% CI −88 to 71) at end intervention (Lord 2012, 24 participants; low‐certainty evidence; Table 1).
Neuromuscular electrical stimulation versus placebo
The mean difference in step count was 36 steps (95% CI −446 to 518) at end intervention and −160 steps (95% CI −692 to 372) at 12‐week follow‐up after a six‐week neuromuscular electrical stimulation (NMES) programme compared to placebo (Maddocks 2016, 52 participants; low‐certainty evidence; Analysis 2.7). The mean difference in change in number of up/down transitions was −5 (95% CI −12 to 3) at end intervention and −3 (95% CI −12 to 6) at 12‐week follow‐up (Maddocks 2016, 52 participants; low‐certainty evidence; Analysis 2.8). The mean difference in upright time was 0.5 hours (95% CI −0.4 to 1.3) at end intervention and −0.4 (95% CI −1.2 to 0.4) at 12‐week follow‐up (Maddocks 2016, 52 participants; low‐certainty evidence; Analysis 2.9).
COMPARISON: Intervention versus standard common intervention (clinically‐stable COPD)
Non‐invasive ventilation with pulmonary rehabilitation versus pulmonary rehabilitation
An increase in step count was demonstrated (MD 1269 steps, 95% CI 242 to 2296; Duiverman 2008, 56 participants; moderate‐certainty evidence; Table 1) following a 12‐week study of non‐invasive ventilation with pulmonary rehabilitation compared to pulmonary rehabilitation in people with hypercapnia.
Inspiratory muscle training and pulmonary rehabilitation versus sham and pulmonary rehabilitation
The mean difference in step count was −206 steps (95% CI −923 to 512; Charususin 2018, 150 participants; moderate‐certainty evidence; Table 1) following a 12‐week study of the addition of inspiratory muscle training to pulmonary rehabilitation compared to a sham intervention with pulmonary rehabilitation in people with inspiratory muscle weakness.
COMPARISON: Intervention versus intervention
No studies presented data for this comparison
Subgroup analysis and investigation of heterogeneity
Insufficient data were available to perform subgroup analyses according to disease severity or duration of intervention.
Subgroup analyses were possible for supervised versus unsupervised pulmonary rehabilitation programmes in clinically‐stable COPD for the following physical activity outcomes: step count; total energy expenditure; LIPA time; and total sedentary time.
Pulmonary rehabilitation: supervised versus unsupervised
The mean difference in step count in the supervised subgroup was 69 steps (95% CI −386 to 524; 2 studies, 144 participants) and unsupervised subgroup was 494 steps (95% CI −158 to 1146; Tsai 2016, 36 participants; low‐certainty evidence; test for subgroup differences: P = 0.29; Analysis 1.15).
There was a significant difference (P = 0.02) between the supervised (MD 10 minutes, 95% CI −9 to 29; 2 studies, 146 participants) and unsupervised subgroups (MD −44 minutes, 95% CI −87 to −1; Tsai 2016, 36 participants; Analysis 1.16), but there was substantial heterogeneity within the supervised subgroup (I2 = 64%) and between subgroups (I2 = 80%).
The mean difference in total energy expenditure in the supervised subgroup was −47 kcal (95% CI −99 to 5; Wootton 2017, 108 participants) and in the unsupervised subgroup was −5 kcal (95% CI −139 to 129; Tsai 2016, 36 participants; low‐certainty evidence; test for subgroup differences: P = 0.57; Analysis 1.17).
The mean difference in total sedentary time in the supervised subgroup was 3 minutes (95% CI −49 to 55; Wootton 2017, 101 participants) and in the unsupervised subgroup was 50 minutes (95% CI −31 to 131; Tsai 2016, 36 participants; low‐certainty evidence; test for subgroup differences: P = 0.34; Analysis 1.18).
Sensitivity analysis
We considered physical activity as the appropriate outcome for sensitivity analyses, as it was the prespecified primary outcome for the review. Insufficient data were available to perform sensitivity analyses to examine the effects of the measurement device on the pooled estimate by removing studies that used pedometers. Sensitivity analyses for missing data were not required.
We planned to examine the effects of methodological quality on the pooled estimate by removing studies that were at high or unclear risk of bias for the domains of blinding and incomplete outcome data.
Sensitivity analyses could be considered for three comparisons in clinically‐stable COPD: pulmonary rehabilitation versus no intervention; high‐intensity interval training versus no intervention; and LAMA/LABA versus placebo.
Pulmonary rehabilitation versus placebo
For change in step count, sensitivity analyses for blinding were not possible as all three included studies were at high/unclear risk of bias for the domain of blinding of participants and at low risk of bias for the domain of blinding of personnel (Egan 2010; Tsai 2016; Wootton 2017). Following the removal of the two studies at unclear risk of bias for the domain of incomplete outcome data (Egan 2010; Wootton 2017), the mean difference was 494 steps (95% CI −158 to 1146; Tsai 2016; 36 participants; low‐certainty evidence; Analysis 1.1).
For total physical activity time, sensitivity analyses for were not possible as both included studies were at high/unclear risk of bias for the domains of blinding of participants and personnel (Egan 2010; De Roos 2017). Following removal of the one study at unclear risk of bias for the domain of incomplete outcome data (Egan 2010), an improvement in total physical activity time was also demonstrated (MD 25 min, 95% CI 8 to 43; De Roos 2017, 45 participants; moderate‐certainty evidence; Analysis 1.5).
Sensitivity analyses were not possible for blinding of participants and personnel for time in MVPA (Analysis 1.2), time in LIPA (Analysis 1.3), total energy expenditure (Analysis 1.4) or total sedentary time (Analysis 1.6), as all included studies were at high/unclear risk of bias for these domains (De Roos 2017; Tsai 2016; Wootton 2017). Following the removal of the one study at unclear risk of bias for the domain of incomplete outcome data (Wootton 2017), the mean difference in time in MVPA was 5 minutes (95% CI −1 to 11; 2 studies; 81 participants; low‐certainty evidence; Analysis 1.2), the mean difference in time in LIPA was −9 minutes (95% CI −70 to 52; 2 studies; 81 participants; low‐certainty evidence; Analysis 1.3), the mean difference in total energy expenditure was −5 kcal (95% CI – 139 to 129; Tsai 2016; 36 participants; low‐certainty evidence; Analysis 1.4) and the mean difference in total sedentary time was – 50 minutes (95% CI –31 to 131; Tsai 2016; 36 participants; low‐certainty evidence; Analysis 1.6).
High‐intensity interval training versus placebo
Sensitivity analyses were not possible for blinding of participants and personnel or incomplete outcome data for time in “lifestyle” physical activity (Analysis 1.7), time in LIPA (Analysis 1.8), time in MVPA (Analysis 1.9) or sedentary time (Analysis 1.10), as both included studies were at high/unclear risk of bias for these domains (Louvaris 2016; Vasilopoulou 2017).
LAMA/LABA versus placebo
Sensitivity analyses were not possible for blinding of participants and personnel or incomplete outcome data for change in step count (Analysis 2.2), time in MVPA (Analysis 2.3) or active energy expenditure (Analysis 2.4), as both included studies were at low risk of bias for these domains (Watz 2016; Watz 2017).
Discussion
This review has synthesised the available evidence for interventions that have measured physical activity and sedentary behaviour in people with COPD. The complexity of a behaviour like physical activity (Casperson 1985) was reflected in the wide range of interventions that have been used to date (Table 2).
Summary of main results
Pulmonary rehabilitation/exercise training
Despite documented deterioration in physical activity associated with acute exacerbations of COPD (Pitta 2006a), there has been limited work targeting participation for people with COPD at this vulnerable time. To date, no improvements in physical activity have been demonstrated following inpatient exercise training (Borges 2014; Tahirah 2015), enriched nutritional supplementation during inpatient pulmonary rehabilitation (Ogasawara 2018), short‐term self‐management post‐discharge (Kanabar 2015; Orme 2018) or long‐term health coaching (Benzo 2016). This remains a key area of interest for future work.
Pulmonary rehabilitation represents the most widely‐studied intervention to improve physical activity to date. Findings in this review were consistent with clinically‐important and consistent improvements in health‐related quality of life and exercise capacity previously demonstrated across multiple trials (McCarthy 2015). However, translation of these benefits into improvement in physical activity was not clearly demonstrated. The appeal of using an existing intervention framework in an attempt to improve physical activity is clear. However, the addition of specific strategies underpinned by theoretical constructs to support behaviour change for physical activity is likely to be required. Meta‐analyses revealed only an increase in total physical activity time following pulmonary rehabilitation, which was not undesirable, but not consistent with the increased intensity required to meet physical activity recommendations for improving health (WHO 2010).
Specific treatments for components of COPD have been added to pulmonary rehabilitation in attempts to improve physical activity with varying success. No clear benefits for physical activity were evident with the addition of inspiratory muscle training in people with inspiratory muscle weakness (Charususin 2018), and results numerically favoured the placebo group in a study looking at the addition of an ACE‐inhibitor (Curtis 2016), although the confidence interval was wide. No clear benefit of supplemental oxygen was demonstrated in participants who desaturated during 6MWT (Alison 2019). However, increased step count was demonstrated following the addition of non‐invasive ventilation in people with hypercapnia (Duiverman 2008) and nutritional supplementation in people with low muscle mass (Van de Bool 2017).
Alternatives to pulmonary rehabilitation/exercise training programmes have been investigated in a range of single studies, including home‐based pulmonary rehabilitation (Holland 2017), water‐based exercise training (Felcar 2018), low‐intensity exercise training (Probst 2011), an exercise‐training programme with tapering supervision (Rinaldo 2017), outdoor walking (Gamper 2019), and an adherence intervention (Steele 2019), without improvements demonstrated. Improvement in physical activity has been demonstrated in a study of Tai Chi compared to pulmonary rehabilitation and was accompanied by improvements in health‐related quality of life and exercise capacity (Polkey 2018). Two studies assessed the impact of adding alternative models of exercise interventions to other components of pulmonary rehabilitation programmes (Nordic walking, COPE‐active) and also demonstrated improved physical activity alongside improved clinical outcomes (Breyer 2010; Effing 2011). At this stage, it appears that there are other exercise‐based interventions that may be equally (if not more) effective in improving physical activity compared to conventional pulmonary rehabilitation/exercise training programmes.
Use of a high‐intensity interval training protocol delivered improvements in physical activity in association with health‐related quality of life and exercise capacity at programme completion in two studies from the same group (Louvaris 2016; Vasilopoulou 2017). Mechanisms for these observed changes are yet to be clarified, longer‐term outcomes have not been demonstrated and results need to be replicated in other studies prior to recommendations for clinical practice.
The only study that has looked at two models of maintenance exercise programmes following high‐intensity interval training demonstrated that both telerehabilitation and centre‐based programmes were superior to usual care across a range of physical activity variables; these findings were mirrored by improvements in health‐related quality of life and exercise capacity. Comparing telerehabilitation and centre‐based maintenance to each other, there were no differences in health‐related quality of life, exercise capacity, time spent in light‐intensity physical activity or sedentary time, but lifestyle and moderate‐intensity physical activity were better in the centre‐based group (Vasilopoulou 2017). These results indicate a direction for the development of effective and sustainable interventions.
Physical activity counselling
Improvements in physical activity following physical activity counselling were inconsistently demonstrated, with a wide range of programme durations, participant interfaces and intervention components used (Arbillaga‐Etxarri 2018; Demeyer 2017; Hornikx 2015; Tabak 2014a; Vorrink 2016; Wootton 2017). The identification of effective components of interventions was complex. In some cases, clues to successful implementation were evident where the same intervention applied in different populations demonstrated (short‐term) improvements in step count that were mirrored by improvements in other outcomes in people with more severe disease (Altenburg 2015; Hospes 2009). Several features were shared with other successful interventions (Demeyer 2017; Vorrink 2016), where participants received direct feedback from a step counter, tracking of participation in activity as well as individual goal‐setting that was regularly revised. This was supported by some evidence specifically for the addition of a pedometer to physical activity counselling to increase step count (Mendoza 2015); however, evidence for the addition of physical activity counselling to use of a pedometer was less clear (Bender 2016; Moy 2015a; Nguyen 2009; Wan 2017). The components associated with success to date were not clearly linked to models of delivery or uniformly accompanied by improvements in health‐related quality of life or exercise capacity or both, but offer may merit further exploration.
Physical activity counselling and pulmonary rehabilitation/exercise training
Direct comparison of physical activity counselling with pulmonary rehabilitation was only undertaken in two studies. Whilst one compared interventions of equal duration (six weeks; Widyastuti 2018), the other compared a longer counselling programme (12 weeks) to pulmonary rehabilitation (six weeks; O'Neill 2018). The addition of physical activity counselling to pulmonary rehabilitation has been the subject of numerous studies. However, meta‐analyses were not possible due to diversity in trial designs. Whilst negative studies showed a lack of improvement in physical activity and clinical outcomes (Burtin 2015; De Blok 2006; Nolan 2017), positive results for physical activity were variably accompanied by improvements in health‐related quality of life and exercise capacity (Loeckx 2018; Mantoani 2018) or unaccompanied by these (Altenburg 2015; Cruz 2016; Kawagoshi 2015), maintained at follow‐up (Cruz 2016; Loeckx 2018) or not maintained (Altenburg 2015). One study has demonstrated that the combined addition of physical activity counselling and exercise training to use of a pedometer resulted in improvements in step count, health‐related quality of life and exercise capacity that were maintained at 12‐month follow‐up (Varas 2018), which provided a constructive indicator for programme development, suggesting that multifaceted interventions may be required for long‐term success.
Self‐management
Several shorter‐term self‐management interventions demonstrated some improvements in physical activity at end intervention compared to no intervention (Mitchell 2013; Tabak 2014b), as did education‐based alternatives (Blumenthal 2014; Larson 2014). These improvements were not seen in longer studies (Jolly 2018; Schuz 2015), which may reflect the challenge of longer‐term maintenance of this type of behaviour change.
Pharmacological treatments
There was mostly a lack of evidence for improvements in physical activity following LAMA treatment (Beeh 2014; Magnussen 2017). However, there was some evidence for a short‐term increase in step count and active energy expenditure following LAMA/LABA combination treatment (Watz 2016; Watz 2017). In the multiple comparisons of one study in which all groups received behaviour modification, no comprehensive improvements in physical activity were demonstrated with the addition of LAMA, LAMA/LABA or exercise training in any combination over 12 weeks (Troosters 2018). These results suggest that meaningful change in and long‐term adoption of regular participation in physical activity will require specific strategies targeting the behaviour of interest.
Endobronchial valve surgery
In one study assessing people six months after endobronchial valve surgery, expected improvement in exercise capacity was accompanied by improvement in a range of physical activity measures, but not measures of inactivity (Hartman 2016), which adds further evidence to the concept that improving physical capacity does not naturally result in comprehensive behaviour change.
Overall completeness and applicability of evidence
Study design
Of the 76 studies included, only 38 had physical activity as a primary outcome. In the context of the myriad of disparate interventions included in this review preventing meta‐analyses for most comparisons, findings were largely presented from individual studies. As a result, whether studies were sufficiently powered presents an important consideration.
Additionally, protocols for activity monitor‐wearing time resulted in fewer participants completing physical activity outcome assessments than health‐related quality of life or exercise‐capacity measures. Only 17 studies assessed physical activity after a post‐intervention follow‐up period, of which four studies demonstrated maintained improvements, so there was very limited information about the continued effect over time following interventions.
Methodology
A lack of comprehensive descriptions of interventions, particularly for physical activity counselling and exercise‐training interventions, and a paucity of data for adherence also made it difficult to know whether interventions were delivered as intended and therefore limited the identification of effective treatment components. The evolution of behaviour change theory and identification of critical components deployed in the development of interventions post‐dates some of this work (Michie 2013); future studies should provide sufficient detail to enable replication and implementation.
Devices
Rapid technological developments have led to a broad and ever‐growing range of tools being used within this field of practice. The most commonly‐used device to date (SenseWear Armband, 19 studies) is now obsolete, and the inaccuracy of step‐count data from this device has been documented (Lee 2015). Financial considerations will inevitably factor into decisions about device selection, both in research settings and in clinical practice. However, the accuracy of data generated by different devices in people with COPD warrants consideration. Although we could not conduct sensitivity analyses as planned according to pedometer use, it is worth noting that a quarter of the studies in this review (15 studies) assessed step count using pedometers, despite evidence for poor accuracy at slower gait speeds (Furlanetto 2010). The impact of device selection on step count was highlighted in the results of Nolan 2017, who demonstrated different results for pedometer‐assessed step count compared to another device.
Outcomes
Step count was the most commonly‐assessed outcome (54 studies), followed by MVPA time (23 studies), sedentary time (12 studies) and LIPA time (10 studies). One challenge with synthesis of these variables was the variety and, in many cases, lack of specification of threshold values used to define intensity of activity. A range of wearing protocols were used and details about data handling were not routinely specified. In some cases, it appeared that post‐intervention physical activity was assessed prior to completion (i.e. whilst participants were still undertaking the intervention).
Due to the small number of interventions that improved physical activity, it was not possible to evaluate whether improvements in physical activity were consistently accompanied by improvements in our secondary outcomes of health‐related quality of life or exercise capacity.
Other factors
To date, there has not been widespread regard for personal factors beyond disease, physical or physiological features. Given the complexity of physical activity behaviour, factors such as motivation, readiness to change and self‐efficacy are also likely to contribute to capacity to change physical activity, and therefore should be integrated into future design of interventions (Trost 2002).
Certainty of the evidence
In assessments of the quality of the evidence, most results were of low certainty, which was largely attributable to performance bias and imprecision. As expected, inclusion of studies that assessed physical activity objectively largely resulted in low risk of detection bias for physical activity outcomes. However, it is interesting to note that there were still instances where use of a device was subject to bias where participants were required to self‐report daily measures. The nature of many interventions, including exercise training and physical activity counselling, will inevitably limit the capacity to blind participants to group allocation. This places more importance on the role of blinding outcome assessors for other outcomes such as exercise capacity. It is therefore concerning that we rated only 33 studies at low risk of bias for this domain. Another common observation was the frequency with which physical activity outcomes were not identified or were reported in a different manner to prespecified protocols.
Potential biases in the review process
Data extraction and 'Risk of bias' assessments were undertaken independently by two review authors, with clarification sought from other co‐authors as required. The inclusion of data published only in conference abstracts ensured that we included all available data in the review. We sought additional information from 29 study authors to maximise accuracy of 'Risk of bias' assessment and data for inclusion, 21 of whom provided information (Characteristics of included studies).
Characteristics of the available data limited the application of prespecified analyses in this review, but it is likely that future versions will encompass these.
Use of cross‐over study designs provides a challenge to inclusion where behavioural components to interventions are delivered. Despite the best efforts of co‐operating authors, there were studies from which we could not obtain data that may have influenced estimates.
Cochrane Reviews often define study inclusion and exclusion criteria based on interventions; however, this review defined study criteria based on an outcome (objectively‐assessed physical activity). In this relatively new field of measurement of this complex behaviour, it is as yet unclear which interventions clearly demonstrate benefit, and therefore inclusion of any approach was intended to inform a comprehensive review of available data.
Agreements and disagreements with other studies or reviews
Previously, the two most comprehensive reviews of interventions to promote physical activity in people with COPD were conducted by Mantoani 2016 (to March 2015; 60 studies), and Lahham 2016 (to May 2016; 37 studies). Consistent with this review, both reviews noted poor quality of available evidence. Study inclusion criteria for our review restricted studies to those assessing physical activity objectively and to RCTs, where both previous reviews had included subjective assessment and Mantoani 2016 included non‐randomised, cohort and experimental designs. Previous observations about duration of pulmonary rehabilitation/exercise training relating to increased physical activity could not be substantiated in this review, however preliminary evidence for combined interventions (e.g. physical activity counselling and pulmonary rehabilitation/exercise training) was confirmed by these results. However, preservation of the original units of outcomes for analysis (e.g. number of steps, time in physical activity rather than effect sizes), rigour of inclusion criteria, a rapidly‐evolving area of clinical interest and concomitant increase in the number of papers have resulted in a unique body of evidence for the current review.

Study flow diagram.

Risk of bias summary: review authors' judgements about each risk of bias item for each included study.

Forest plot of comparison 1: Intervention vs. no intervention
Outcome 1.1: Physical activity: change in step count (steps per day)

Forest plot of comparison 1: Intervention vs. no intervention
Outcome 1.2: Physical activity: change in time in moderate‐to‐vigorous intensity physical activity (minutes per day)

Forest plot of comparison 1: Intervention vs. no intervention
Outcome 1.4: Physical activity: change in time in light‐intensity physical activity (minutes per day)

Forest plot of comparison 1: Intervention vs. no intervention
Outcome 1.3: Physical activity: change in total energy expenditure (kcal)
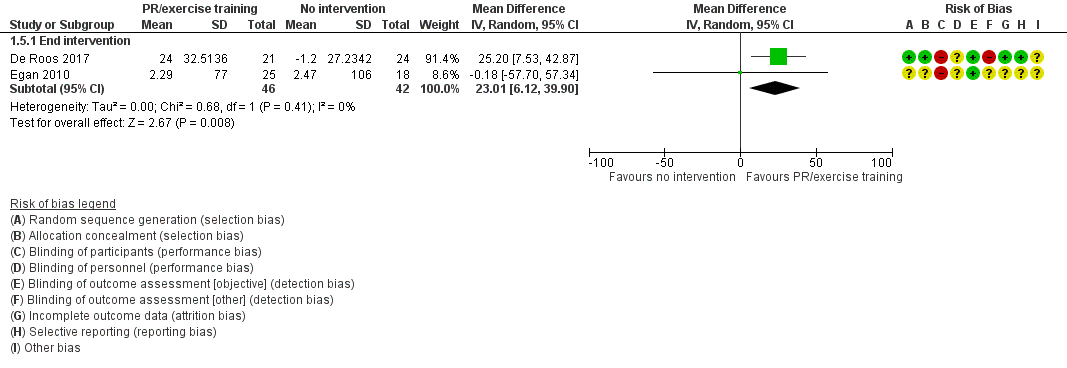
Forest plot of comparison 1: Intervention vs. no intervention
Outcome 1.6: Physical activity: change in time in physical activity (total, minutes per day)

Forest plot of comparison 1: Intervention vs. no intervention
Outcome 1.5: Physical activity: change in sedentary time (minutes per day)

Forest plot of comparison 1: Intervention vs. no intervention
Outcome: 1.8 Physical activity: time in "lifestyle" physical activity (minutes per day)
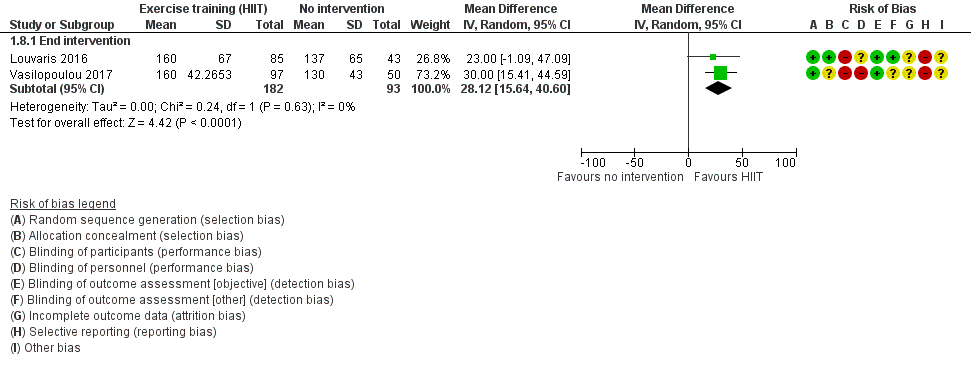
Forest plot of comparison: 1 Intervention vs. no intervention
Outcome: 1.7 Physical activity: time in light‐intensity physical activity (minutes per day)

Forest plot of comparison 1: Intervention vs. vs. no intervention
Outcome 1.9: Physical activity: time in MVPA (minutes per day)

Forest plot of comparison 1: Intervention vs. no intervention
Outcome 1.10: Physical activity: sedentary time (minutes per day)

Forest plot of comparison 2: Intervention vs. placebo
Outcome 2.2: Physical activity: change in step count (steps per day)

Forest plot of comparison 2: Intervention vs. placebo
Outcome 2.3: Physical activity: change in time in moderate‐to‐vigorous intensity physical activity (minutes per day)
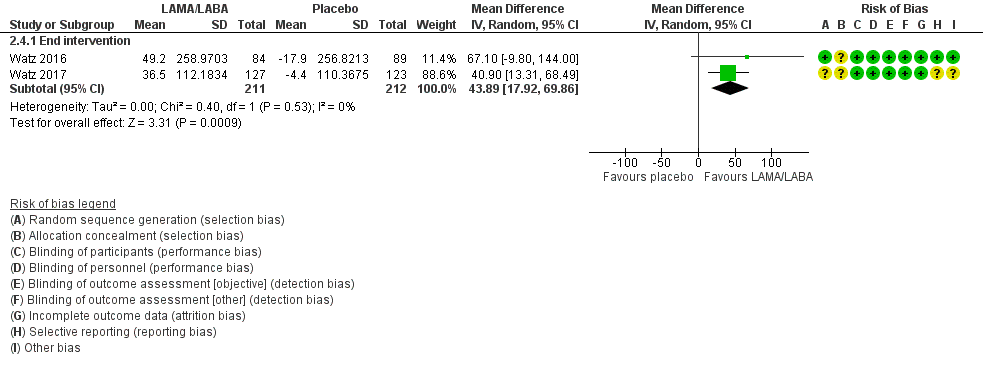
Forest plot of comparison 2: Intervention vs. placebo
Outcome 2.4: Physical activity: change in active energy expenditure (kcal)

Comparison 1 Physical activity: intervention vs. no intervention, Outcome 1 change in step count (steps per day); Intervention: pulmonary rehabilitation/exercise training.
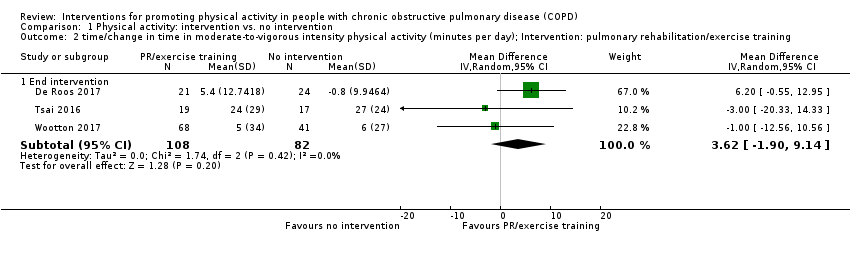
Comparison 1 Physical activity: intervention vs. no intervention, Outcome 2 time/change in time in moderate‐to‐vigorous intensity physical activity (minutes per day); Intervention: pulmonary rehabilitation/exercise training.
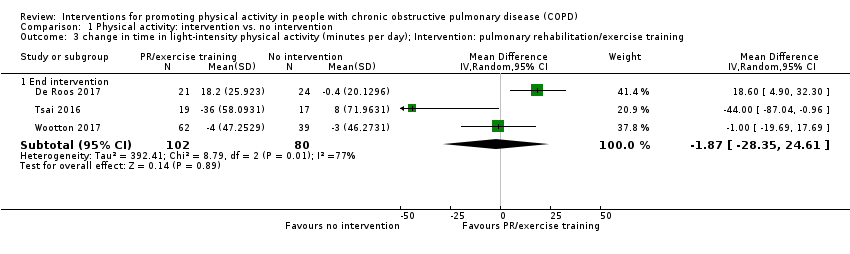
Comparison 1 Physical activity: intervention vs. no intervention, Outcome 3 change in time in light‐intensity physical activity (minutes per day); Intervention: pulmonary rehabilitation/exercise training.
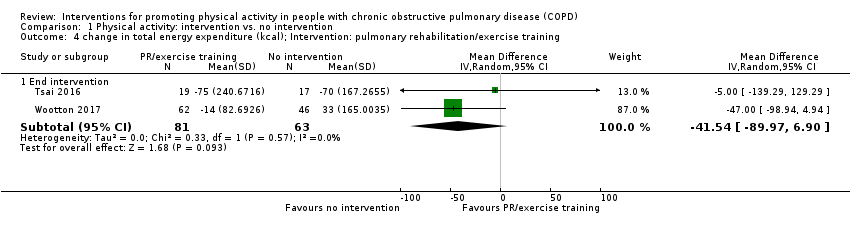
Comparison 1 Physical activity: intervention vs. no intervention, Outcome 4 change in total energy expenditure (kcal); Intervention: pulmonary rehabilitation/exercise training.

Comparison 1 Physical activity: intervention vs. no intervention, Outcome 5 change in time in physical activity (total; minutes per day); Intervention: pulmonary rehabilitation/exercise training.
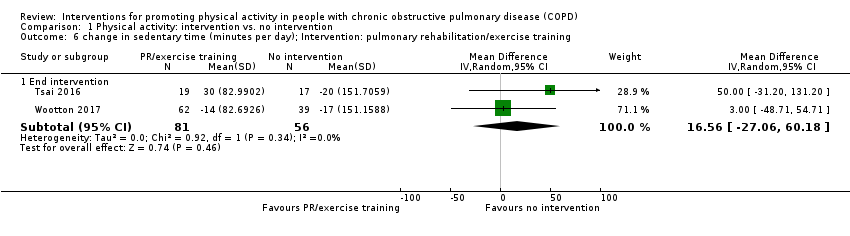
Comparison 1 Physical activity: intervention vs. no intervention, Outcome 6 change in sedentary time (minutes per day); Intervention: pulmonary rehabilitation/exercise training.

Comparison 1 Physical activity: intervention vs. no intervention, Outcome 7 time in "lifestyle" physical activity (minutes per day); Intervention: high‐intensity interval training.
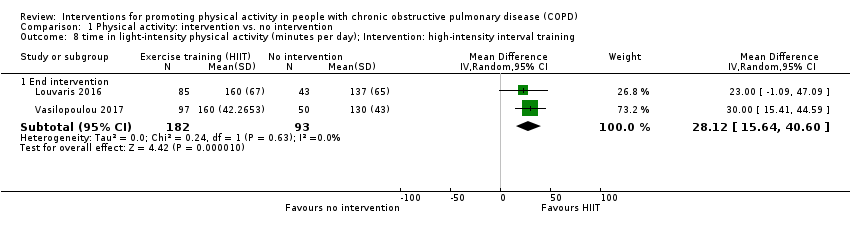
Comparison 1 Physical activity: intervention vs. no intervention, Outcome 8 time in light‐intensity physical activity (minutes per day); Intervention: high‐intensity interval training.

Comparison 1 Physical activity: intervention vs. no intervention, Outcome 9 time in moderate‐to‐vigorous intensity physical activity (minutes per day); Intervention: high‐intensity interval training.
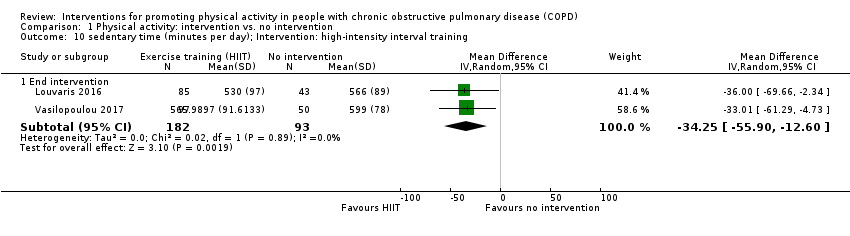
Comparison 1 Physical activity: intervention vs. no intervention, Outcome 10 sedentary time (minutes per day); Intervention: high‐intensity interval training.

Comparison 1 Physical activity: intervention vs. no intervention, Outcome 11 step count (steps per day); Intervention: physical activity counselling.
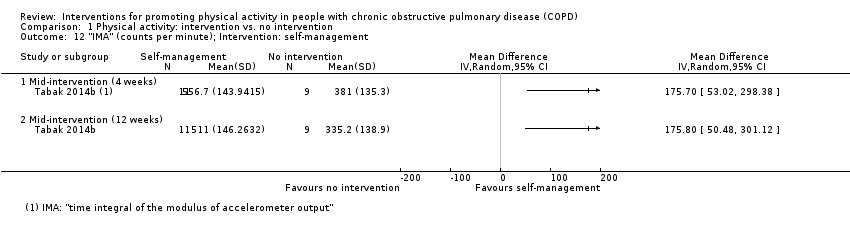
Comparison 1 Physical activity: intervention vs. no intervention, Outcome 12 "IMA" (counts per minute); Intervention: self‐management.

Comparison 1 Physical activity: intervention vs. no intervention, Outcome 13 physical activity level; Intervention: nutritional supplement.
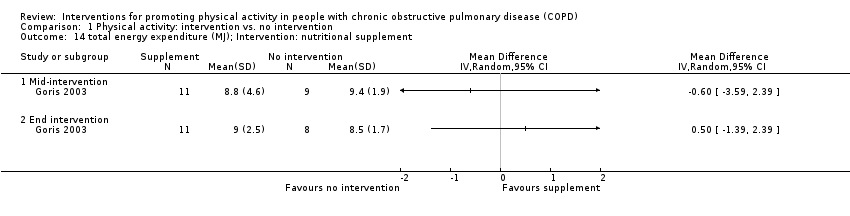
Comparison 1 Physical activity: intervention vs. no intervention, Outcome 14 total energy expenditure (MJ); Intervention: nutritional supplement.

Comparison 1 Physical activity: intervention vs. no intervention, Outcome 15 subgroup analysis (supervised vs. unsupervised); change in step count (steps per day); Intervention: pulmonary rehabilitation/exercise training.

Comparison 1 Physical activity: intervention vs. no intervention, Outcome 16 supgroup analysis (supervised vs. unsupervised); change in time in light‐intensity physical activity (minutes per day); Intervention: pulmonary rehabilitation/exercise training.
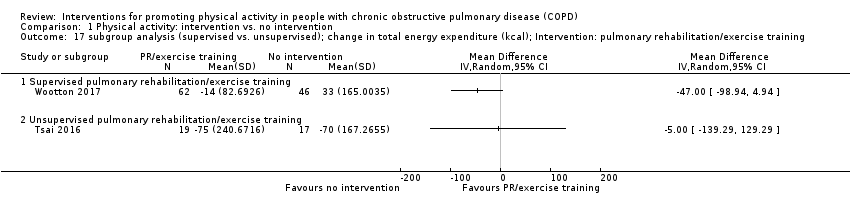
Comparison 1 Physical activity: intervention vs. no intervention, Outcome 17 subgroup analysis (supervised vs. unsupervised); change in total energy expenditure (kcal); Intervention: pulmonary rehabilitation/exercise training.
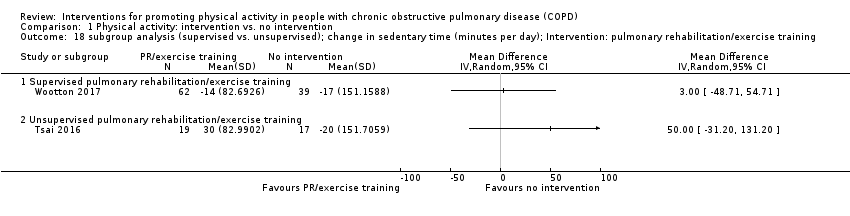
Comparison 1 Physical activity: intervention vs. no intervention, Outcome 18 subgroup analysis (supervised vs. unsupervised); change in sedentary time (minutes per day); Intervention: pulmonary rehabilitation/exercise training.

Comparison 2 Physical activity: intervention vs. placebo/sham, Outcome 1 step count (steps per day); Intervention: self‐management (health mentoring).

Comparison 2 Physical activity: intervention vs. placebo/sham, Outcome 2 change in step count (steps per day); Intervention: LAMA/LABA.
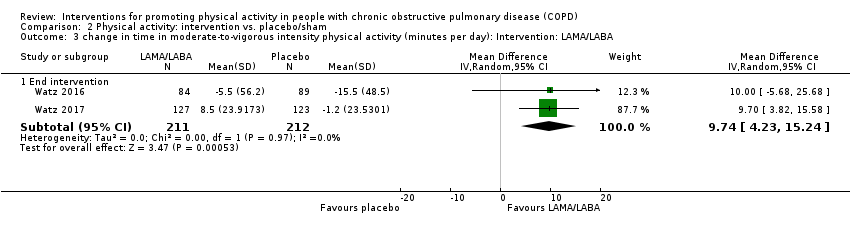
Comparison 2 Physical activity: intervention vs. placebo/sham, Outcome 3 change in time in moderate‐to‐vigorous intensity physical activity (minutes per day): Intervention: LAMA/LABA.

Comparison 2 Physical activity: intervention vs. placebo/sham, Outcome 4 change in active energy expenditure (kcal); Intervention: LAMA/LABA.

Comparison 2 Physical activity: intervention vs. placebo/sham, Outcome 5 step count (steps per day); Intervention: nutritional supplement.
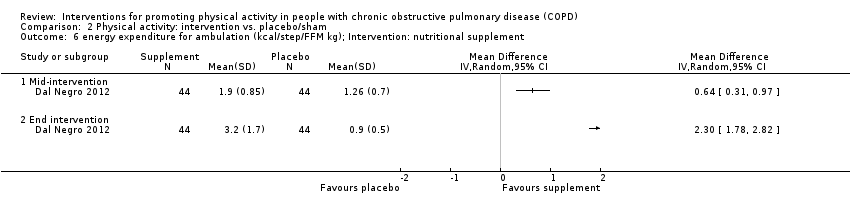
Comparison 2 Physical activity: intervention vs. placebo/sham, Outcome 6 energy expenditure for ambulation (kcal/step/FFM kg); Intervention: nutritional supplement.
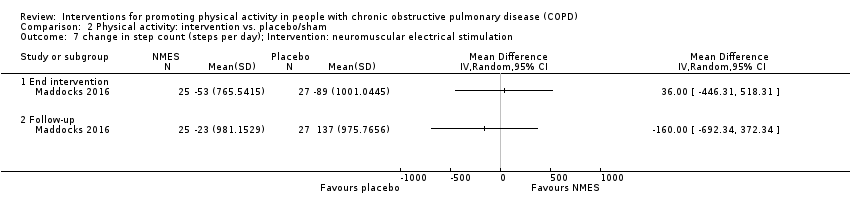
Comparison 2 Physical activity: intervention vs. placebo/sham, Outcome 7 change in step count (steps per day); Intervention: neuromuscular electrical stimulation.
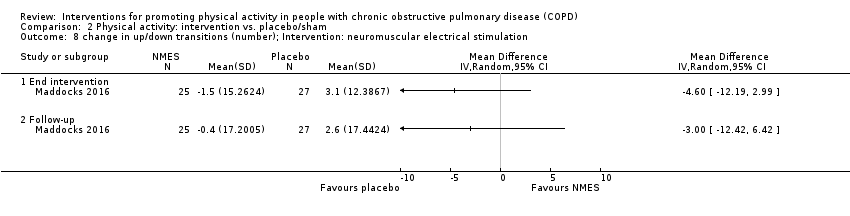
Comparison 2 Physical activity: intervention vs. placebo/sham, Outcome 8 change in up/down transitions (number); Intervention: neuromuscular electrical stimulation.

Comparison 2 Physical activity: intervention vs. placebo/sham, Outcome 9 change in time upright (hours); Intervention: neuromuscular electrical stimulation.

Comparison 3 Physical activity: intervention with common intervention vs. common intervention, Outcome 1 movement intensity (m/s2); Interventions: nordic walking with education vs. education.
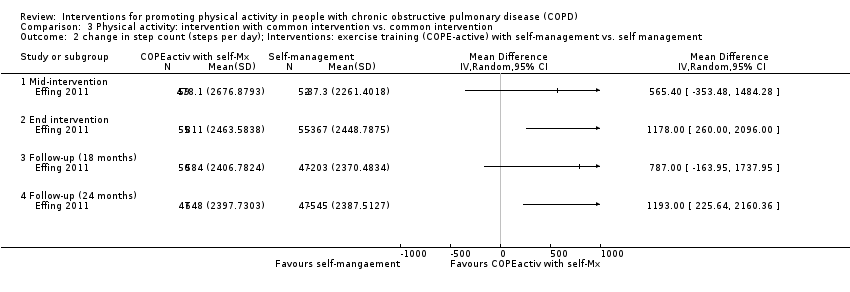
Comparison 3 Physical activity: intervention with common intervention vs. common intervention, Outcome 2 change in step count (steps per day); Interventions: exercise training (COPE‐active) with self‐management vs. self management.

Comparison 3 Physical activity: intervention with common intervention vs. common intervention, Outcome 3 change in time in light‐intensity physical activity (minutes per day); Interventions: upper body resistance training with health education vs. health education.
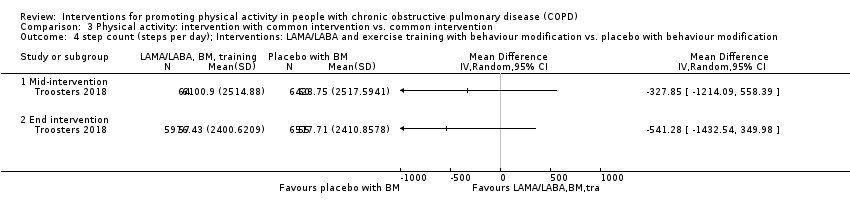
Comparison 3 Physical activity: intervention with common intervention vs. common intervention, Outcome 4 step count (steps per day); Interventions: LAMA/LABA and exercise training with behaviour modification vs. placebo with behaviour modification.

Comparison 3 Physical activity: intervention with common intervention vs. common intervention, Outcome 5 time walking (minutes per day); Interventions: LAMA/LABA and exercise training with behaviour modification vs. placebo with behaviour modification.

Comparison 3 Physical activity: intervention with common intervention vs. common intervention, Outcome 6 walking intensity (m/s2); Interventions: LAMA/LABA and exercise training with behaviour modification vs. placebo with behaviour modification.

Comparison 3 Physical activity: intervention with common intervention vs. common intervention, Outcome 7 step count (steps per day); Interventions: exercise training and LABA with LAMA and behaviour modification vs. LAMA and behaviour modification.
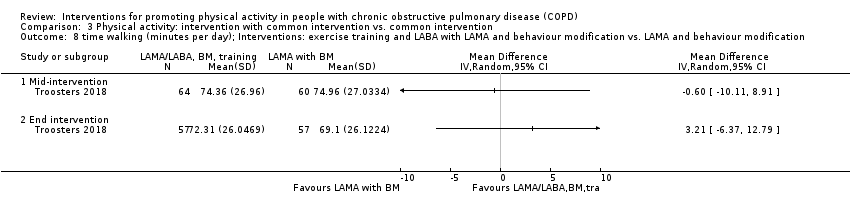
Comparison 3 Physical activity: intervention with common intervention vs. common intervention, Outcome 8 time walking (minutes per day); Interventions: exercise training and LABA with LAMA and behaviour modification vs. LAMA and behaviour modification.

Comparison 3 Physical activity: intervention with common intervention vs. common intervention, Outcome 9 walking intensity (m/s2); Interventions: exercise training and LABA with LAMA and behaviour modification vs. LAMA and behaviour modification.

Comparison 3 Physical activity: intervention with common intervention vs. common intervention, Outcome 10 step count (steps per day); Interventions: exercise training with LAMA/LABA and behaviour modification vs. LAMA/LABA and behaviour modification.
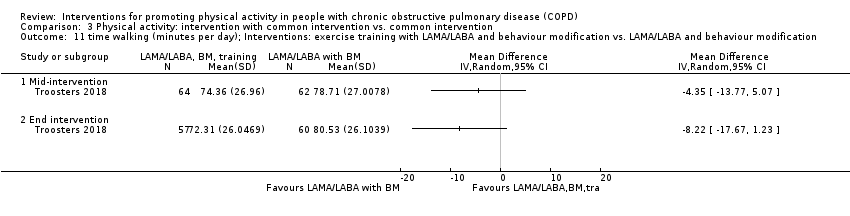
Comparison 3 Physical activity: intervention with common intervention vs. common intervention, Outcome 11 time walking (minutes per day); Interventions: exercise training with LAMA/LABA and behaviour modification vs. LAMA/LABA and behaviour modification.
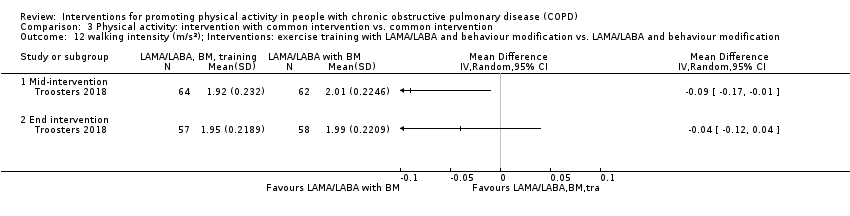
Comparison 3 Physical activity: intervention with common intervention vs. common intervention, Outcome 12 walking intensity (m/s2); Interventions: exercise training with LAMA/LABA and behaviour modification vs. LAMA/LABA and behaviour modification.
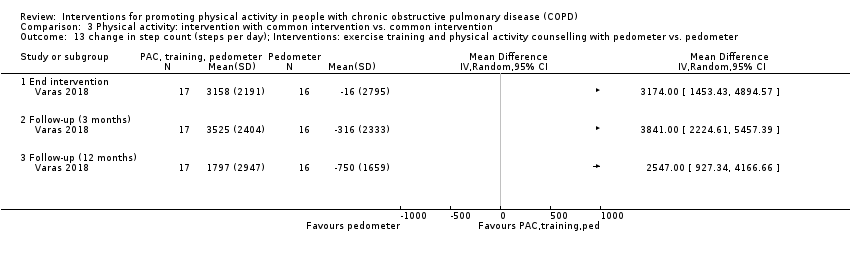
Comparison 3 Physical activity: intervention with common intervention vs. common intervention, Outcome 13 change in step count (steps per day); Interventions: exercise training and physical activity counselling with pedometer vs. pedometer.

Comparison 3 Physical activity: intervention with common intervention vs. common intervention, Outcome 14 change in step count (weekday, steps per day); Interventions: physical activity counselling with optional supervised exercise vs. optional supervised exercise.

Comparison 3 Physical activity: intervention with common intervention vs. common intervention, Outcome 15 METs; Interventions: physical activity counselling with optional supervised exercise vs. optional supervised exercise.
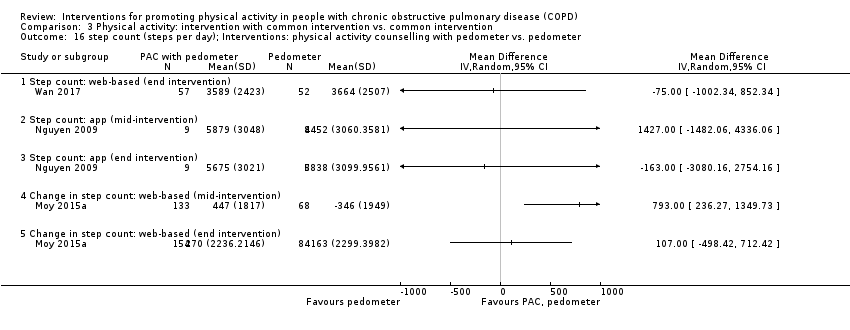
Comparison 3 Physical activity: intervention with common intervention vs. common intervention, Outcome 16 step count (steps per day); Interventions: physical activity counselling with pedometer vs. pedometer.

Comparison 3 Physical activity: intervention with common intervention vs. common intervention, Outcome 17 time active (minutes per day); Interventions: physical activity counselling (app) with pedometer vs. pedometer.

Comparison 3 Physical activity: intervention with common intervention vs. common intervention, Outcome 18 time inactive (minutes per day); Interventions: physical activity counselling (app) with pedometer vs. pedometer.

Comparison 3 Physical activity: intervention with common intervention vs. common intervention, Outcome 19 peak performance (steps per minute); Interventions: physical activity counselling (app) with pedometer vs. pedometer.
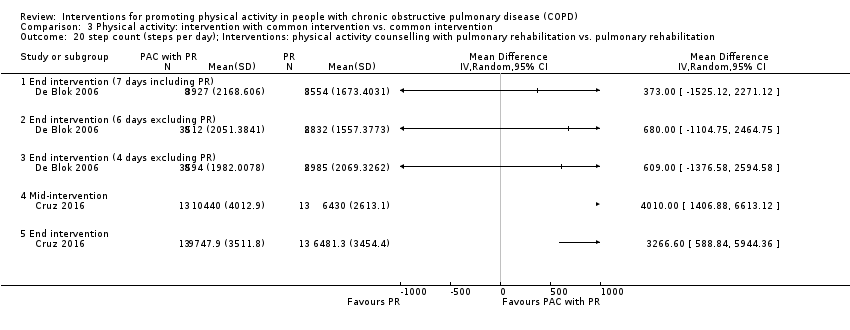
Comparison 3 Physical activity: intervention with common intervention vs. common intervention, Outcome 20 step count (steps per day); Interventions: physical activity counselling with pulmonary rehabilitation vs. pulmonary rehabilitation.
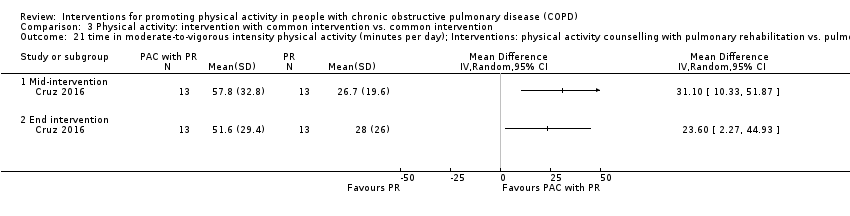
Comparison 3 Physical activity: intervention with common intervention vs. common intervention, Outcome 21 time in moderate‐to‐vigorous intensity physical activity (minutes per day); Interventions: physical activity counselling with pulmonary rehabilitation vs. pulmonary rehabilitation.
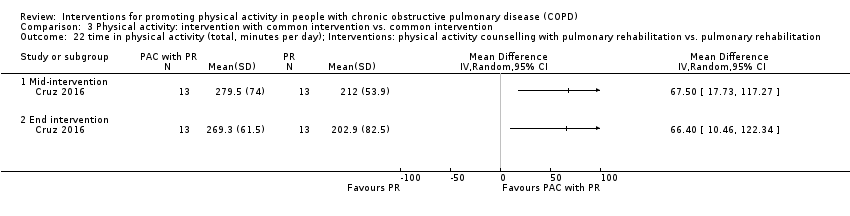
Comparison 3 Physical activity: intervention with common intervention vs. common intervention, Outcome 22 time in physical activity (total, minutes per day); Interventions: physical activity counselling with pulmonary rehabilitation vs. pulmonary rehabilitation.

Comparison 3 Physical activity: intervention with common intervention vs. common intervention, Outcome 23 time sedentary (minutes per day); Interventions: physical activity counselling with pulmonary rehabilitation vs. pulmonary rehabilitation.

Comparison 3 Physical activity: intervention with common intervention vs. common intervention, Outcome 24 change in step count (steps per day); Interventions: physical activity counselling with pulmonary rehabilitation vs. sham with pulmonary rehabilitation.

Comparison 3 Physical activity: intervention with common intervention vs. common intervention, Outcome 25 change in time in moderate‐to‐vigorous intensity physical activity (minutes per day); Interventions: physical activity counselling with pulmonary rehabilitation vs. sham with pulmonary rehabilitation.

Comparison 3 Physical activity: intervention with common intervention vs. common intervention, Outcome 26 change in time walking (minutes per day); Interventions: physical activity counselling with pulmonary rehabilitation vs. sham with pulmonary rehabilitation.
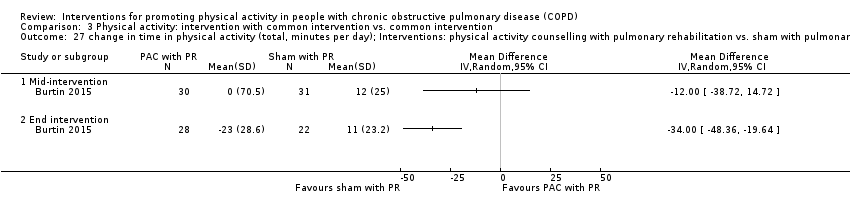
Comparison 3 Physical activity: intervention with common intervention vs. common intervention, Outcome 27 change in time in physical activity (total, minutes per day); Interventions: physical activity counselling with pulmonary rehabilitation vs. sham with pulmonary rehabilitation.
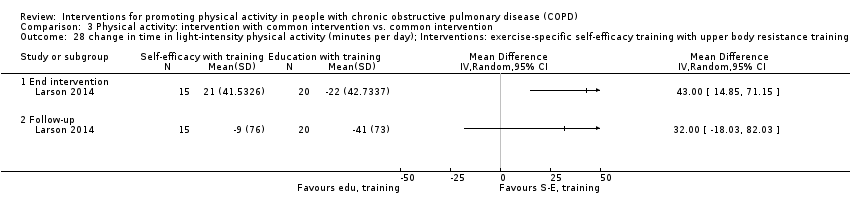
Comparison 3 Physical activity: intervention with common intervention vs. common intervention, Outcome 28 change in time in light‐intensity physical activity (minutes per day); Interventions: exercise‐specific self‐efficacy training with upper body resistance training vs. upper body resistance training.
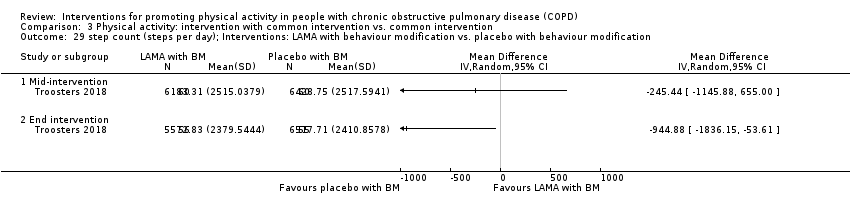
Comparison 3 Physical activity: intervention with common intervention vs. common intervention, Outcome 29 step count (steps per day); Interventions: LAMA with behaviour modification vs. placebo with behaviour modification.
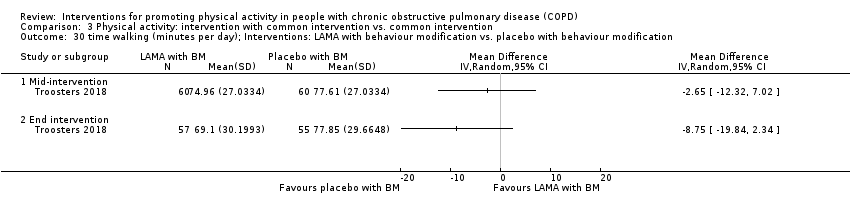
Comparison 3 Physical activity: intervention with common intervention vs. common intervention, Outcome 30 time walking (minutes per day); Interventions: LAMA with behaviour modification vs. placebo with behaviour modification.

Comparison 3 Physical activity: intervention with common intervention vs. common intervention, Outcome 31 walking intensity (m/s2); Interventions: LAMA with behaviour modification vs. placebo with behaviour modification.
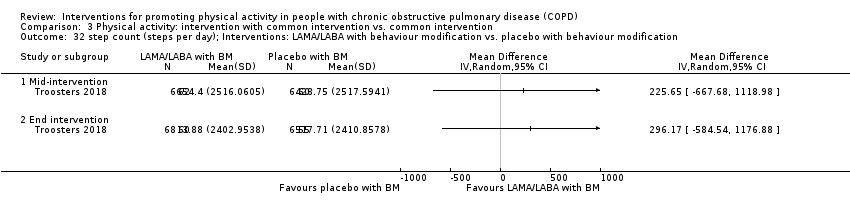
Comparison 3 Physical activity: intervention with common intervention vs. common intervention, Outcome 32 step count (steps per day); Interventions: LAMA/LABA with behaviour modification vs. placebo with behaviour modification.

Comparison 3 Physical activity: intervention with common intervention vs. common intervention, Outcome 33 time walking (minutes per day); Interventions: LAMA/LABA with behaviour modification vs. placebo with behaviour modification.
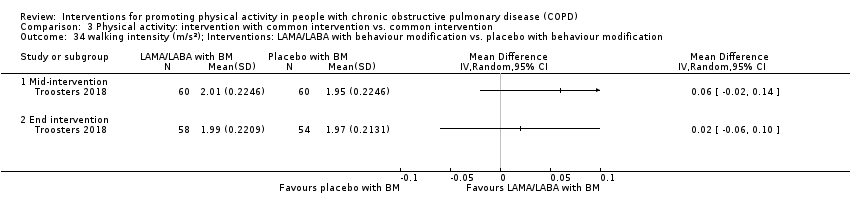
Comparison 3 Physical activity: intervention with common intervention vs. common intervention, Outcome 34 walking intensity (m/s2); Interventions: LAMA/LABA with behaviour modification vs. placebo with behaviour modification.
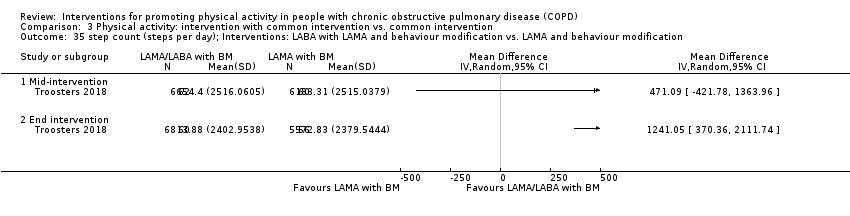
Comparison 3 Physical activity: intervention with common intervention vs. common intervention, Outcome 35 step count (steps per day); Interventions: LABA with LAMA and behaviour modification vs. LAMA and behaviour modification.

Comparison 3 Physical activity: intervention with common intervention vs. common intervention, Outcome 36 time walking (minutes per day); Interventions: LABA with LAMA and behaviour modification vs. LAMA and behaviour modification.

Comparison 3 Physical activity: intervention with common intervention vs. common intervention, Outcome 37 walking intensity (m/s2); Interventions: LABA with LAMA and behaviour modification vs. LAMA and behaviour modification.

Comparison 3 Physical activity: intervention with common intervention vs. common intervention, Outcome 38 change in step count (steps per day); Interventions: nutritional supplement with pulmonary rehabilitation vs. placebo with pulmonary rehabilitation.

Comparison 3 Physical activity: intervention with common intervention vs. common intervention, Outcome 39 change in step count (steps per day); Interventions: supplemental oxygen with pulmonary rehabilitation vs. sham with pulmonary rehabilitation.

Comparison 3 Physical activity: intervention with common intervention vs. common intervention, Outcome 40 change in time in moderate‐intensity physical activity (minutes per day); Interventions: supplemental oxygen with pulmonary rehabilitation vs. sham with pulmonary rehabilitation.
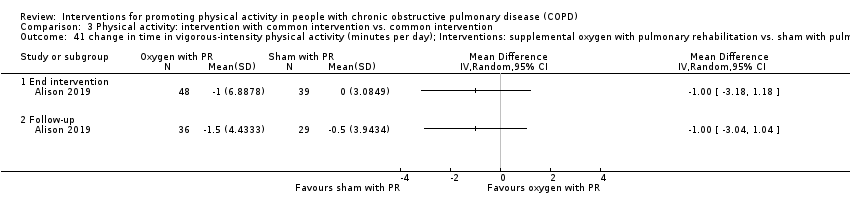
Comparison 3 Physical activity: intervention with common intervention vs. common intervention, Outcome 41 change in time in vigorous‐intensity physical activity (minutes per day); Interventions: supplemental oxygen with pulmonary rehabilitation vs. sham with pulmonary rehabilitation.

Comparison 3 Physical activity: intervention with common intervention vs. common intervention, Outcome 42 change in time in light‐intensity physical activity (minutes per day); Interventions: supplemental oxygen with pulmonary rehabilitation vs. sham with pulmonary rehabilitation.
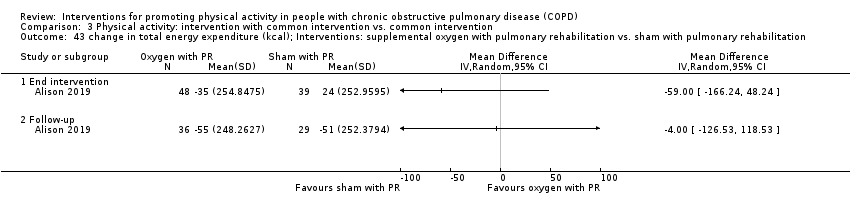
Comparison 3 Physical activity: intervention with common intervention vs. common intervention, Outcome 43 change in total energy expenditure (kcal); Interventions: supplemental oxygen with pulmonary rehabilitation vs. sham with pulmonary rehabilitation.

Comparison 3 Physical activity: intervention with common intervention vs. common intervention, Outcome 44 change in sedentary time (minutes per day); Interventions: supplemental oxygen with pulmonary rehabilitation vs. sham with pulmonary rehabilitation.

Comparison 4 Physical activity: intervention vs. intervention, Outcome 1 change in step count (steps per day); Interventions: home‐based pulmonary rehabilitation vs. centre‐based pulmonary rehabilitation.

Comparison 4 Physical activity: intervention vs. intervention, Outcome 2 change in time in moderate‐to‐vigorous intensity physical activity (minutes per day); Interventions: home‐based pulmonary rehabilitation vs. centre‐based pulmonary rehabilitation.

Comparison 4 Physical activity: intervention vs. intervention, Outcome 3 change in number of bouts of moderate‐to‐vigorous intensity physical activity; Interventions: home‐based pulmonary rehabilitation vs. centre‐based pulmonary rehabilitation.
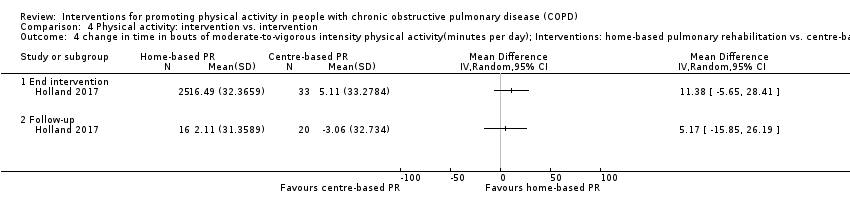
Comparison 4 Physical activity: intervention vs. intervention, Outcome 4 change in time in bouts of moderate‐to‐vigorous intensity physical activity(minutes per day); Interventions: home‐based pulmonary rehabilitation vs. centre‐based pulmonary rehabilitation.

Comparison 4 Physical activity: intervention vs. intervention, Outcome 5 change in sedentary time (minutes per day); Interventions: home‐based pulmonary rehabilitation vs. centre‐based pulmonary rehabilitation.
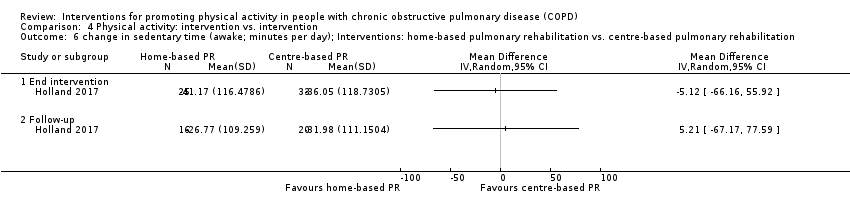
Comparison 4 Physical activity: intervention vs. intervention, Outcome 6 change in sedentary time (awake; minutes per day); Interventions: home‐based pulmonary rehabilitation vs. centre‐based pulmonary rehabilitation.

Comparison 4 Physical activity: intervention vs. intervention, Outcome 7 change in number of sedentary bouts; Interventions: home‐based pulmonary rehabilitation vs. centre‐based pulmonary rehabilitation.
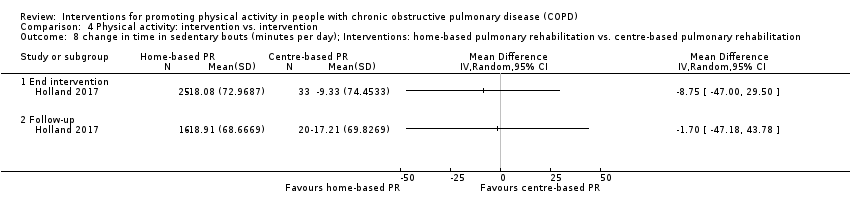
Comparison 4 Physical activity: intervention vs. intervention, Outcome 8 change in time in sedentary bouts (minutes per day); Interventions: home‐based pulmonary rehabilitation vs. centre‐based pulmonary rehabilitation.

Comparison 4 Physical activity: intervention vs. intervention, Outcome 9 change in METs; Interventions: home‐based pulmonary rehabilitation vs. centre‐based pulmonary rehabilitation.

Comparison 4 Physical activity: intervention vs. intervention, Outcome 10 change in total energy expenditure (kcal); Interventions: home‐based pulmonary rehabilitation vs. centre‐based pulmonary rehabilitation.

Comparison 4 Physical activity: intervention vs. intervention, Outcome 11 change in step count (steps per day); Interventions: water‐based exercise training vs. land‐based exercise training.

Comparison 4 Physical activity: intervention vs. intervention, Outcome 12 change in total energy expenditure (kcal); Interventions: water‐based exercise training vs. land‐based exercise training.

Comparison 4 Physical activity: intervention vs. intervention, Outcome 13 step count (steps per day); Interventions: Tai Chi vs. pulmonary rehabilitation.
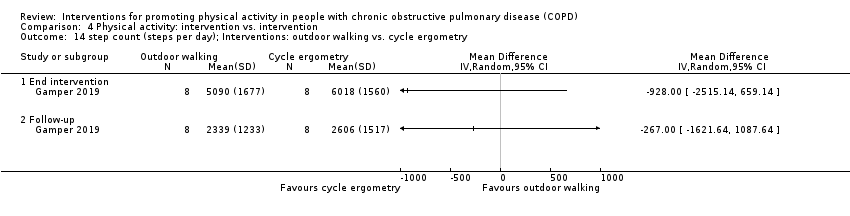
Comparison 4 Physical activity: intervention vs. intervention, Outcome 14 step count (steps per day); Interventions: outdoor walking vs. cycle ergometry.

Comparison 4 Physical activity: intervention vs. intervention, Outcome 15 step count (steps per day); Interventions: physical activity counselling vs. pulmonary rehabilitation.

Comparison 4 Physical activity: intervention vs. intervention, Outcome 16 total energy expenditure (kcal); Interventions: exercise training with tapered supervision vs. supervised exercise training.

Comparison 4 Physical activity: intervention vs. intervention, Outcome 17 mid day activity (vector magnitude units per minute); Interventions: supplemental oxygen (lightweight ambulatory) vs. supplemental oxygen (E‐cylinder).

Comparison 5 Health‐related quality of life: intervention vs. no intervention, Outcome 1 change in SGRQ total score; Intervention: pulmonary rehabilitation/exercise training.

Comparison 5 Health‐related quality of life: intervention vs. no intervention, Outcome 2 change in SGRQ domain scores. Intervention: pulmonary rehabilitation/exercise training (ground‐based walking).

Comparison 5 Health‐related quality of life: intervention vs. no intervention, Outcome 3 change in CRQ domain scores; Intervention: pulmonary rehabilitation/exercise training.
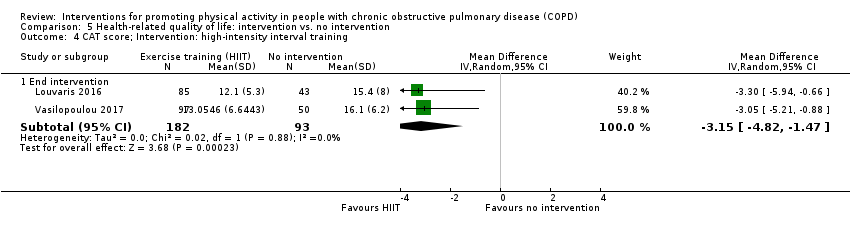
Comparison 5 Health‐related quality of life: intervention vs. no intervention, Outcome 4 CAT score; Intervention: high‐intensity interval training.
![Comparison 5 Health‐related quality of life: intervention vs. no intervention, Outcome 5 SGRQ domain scores (%change); Intervention: exercise training [inpatient].](/es/cdsr/doi/10.1002/14651858.CD012626.pub2/media/CDSR/CD012626/image_n/nCD012626-CMP-005-05.png)
Comparison 5 Health‐related quality of life: intervention vs. no intervention, Outcome 5 SGRQ domain scores (%change); Intervention: exercise training [inpatient].

Comparison 5 Health‐related quality of life: intervention vs. no intervention, Outcome 6 SGRQ domain scores; Intervention: physical activity counselling.
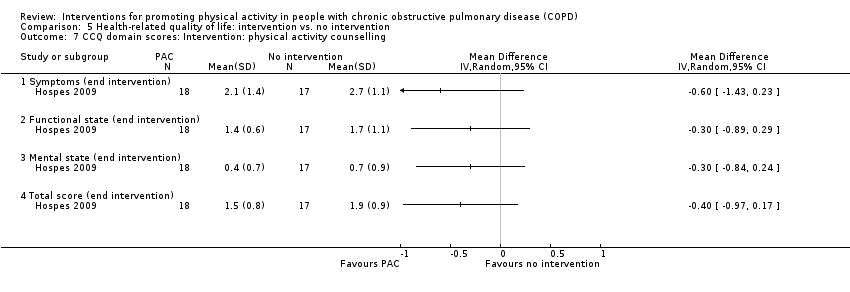
Comparison 5 Health‐related quality of life: intervention vs. no intervention, Outcome 7 CCQ domain scores: Intervention: physical activity counselling.
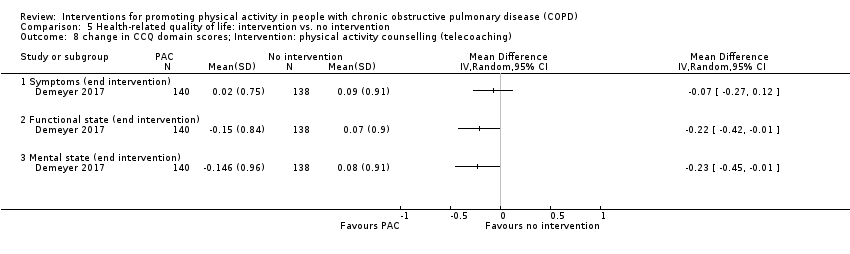
Comparison 5 Health‐related quality of life: intervention vs. no intervention, Outcome 8 change in CCQ domain scores; Intervention: physical activity counselling (telecoaching).

Comparison 5 Health‐related quality of life: intervention vs. no intervention, Outcome 9 change in CRQ domain and total scores; Intervention: physical activity counselling.

Comparison 5 Health‐related quality of life: intervention vs. no intervention, Outcome 10 change in SGRQ domain and total scores; Intervention: physical activity counselling.

Comparison 5 Health‐related quality of life: intervention vs. no intervention, Outcome 11 change in CRQ domain scores; Intervention: self‐management (SPACE).
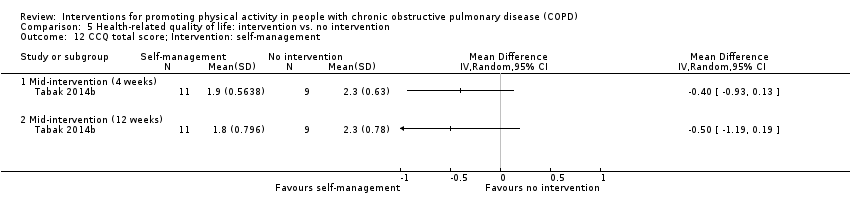
Comparison 5 Health‐related quality of life: intervention vs. no intervention, Outcome 12 CCQ total score; Intervention: self‐management.
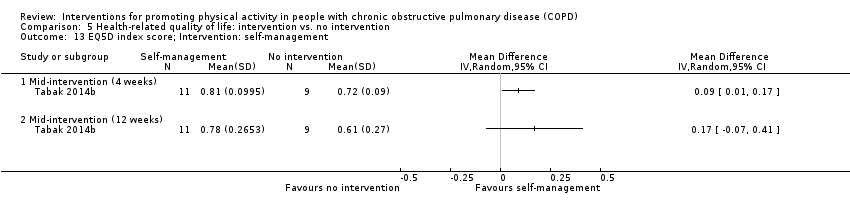
Comparison 5 Health‐related quality of life: intervention vs. no intervention, Outcome 13 EQ5D index score; Intervention: self‐management.

Comparison 5 Health‐related quality of life: intervention vs. no intervention, Outcome 14 EQ5D visual analogue scale score; Intervention: self‐management.
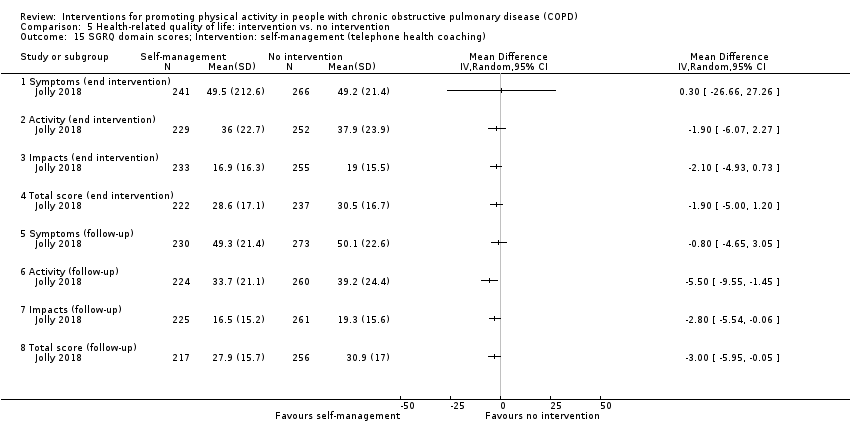
Comparison 5 Health‐related quality of life: intervention vs. no intervention, Outcome 15 SGRQ domain scores; Intervention: self‐management (telephone health coaching).
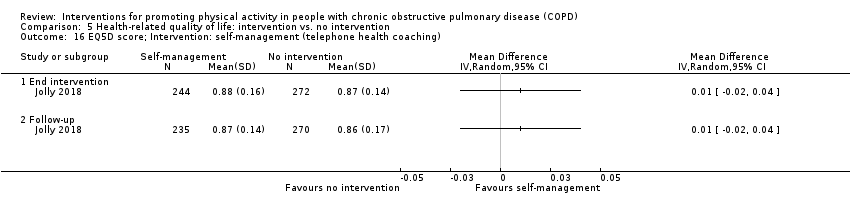
Comparison 5 Health‐related quality of life: intervention vs. no intervention, Outcome 16 EQ5D score; Intervention: self‐management (telephone health coaching).

Comparison 5 Health‐related quality of life: intervention vs. no intervention, Outcome 17 CRQ domain scores; Intervention: four‐wheeled walker.

Comparison 6 Health‐related quality of life: intervention vs. placebo/sham, Outcome 1 change in SF36 component scores; Intervention: singing.

Comparison 6 Health‐related quality of life: intervention vs. placebo/sham, Outcome 2 change in CRQ total score; Intervention: neuromuscular electrical stimulation.
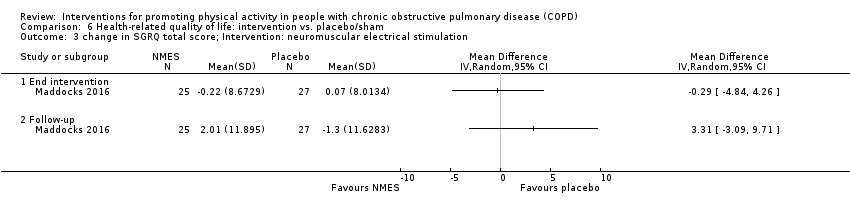
Comparison 6 Health‐related quality of life: intervention vs. placebo/sham, Outcome 3 change in SGRQ total score; Intervention: neuromuscular electrical stimulation.
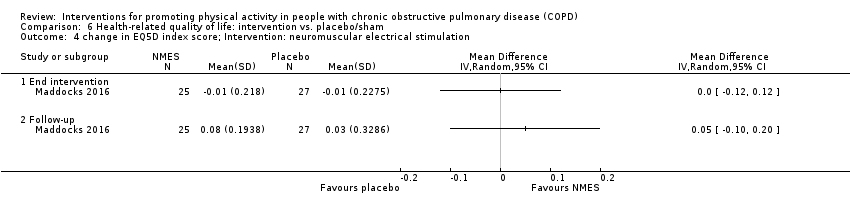
Comparison 6 Health‐related quality of life: intervention vs. placebo/sham, Outcome 4 change in EQ5D index score; Intervention: neuromuscular electrical stimulation.
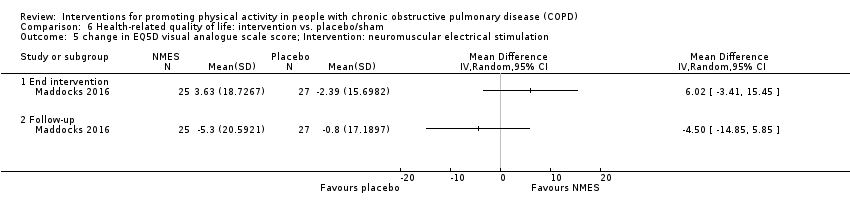
Comparison 6 Health‐related quality of life: intervention vs. placebo/sham, Outcome 5 change in EQ5D visual analogue scale score; Intervention: neuromuscular electrical stimulation.
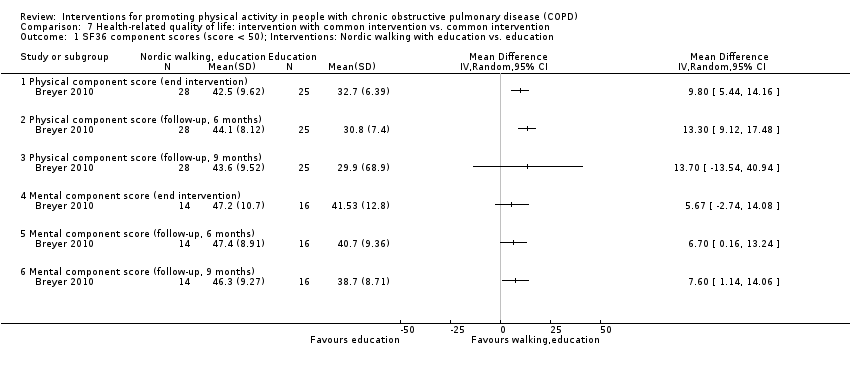
Comparison 7 Health‐related quality of life: intervention with common intervention vs. common intervention, Outcome 1 SF36 component scores (score < 50); Interventions: Nordic walking with education vs. education.
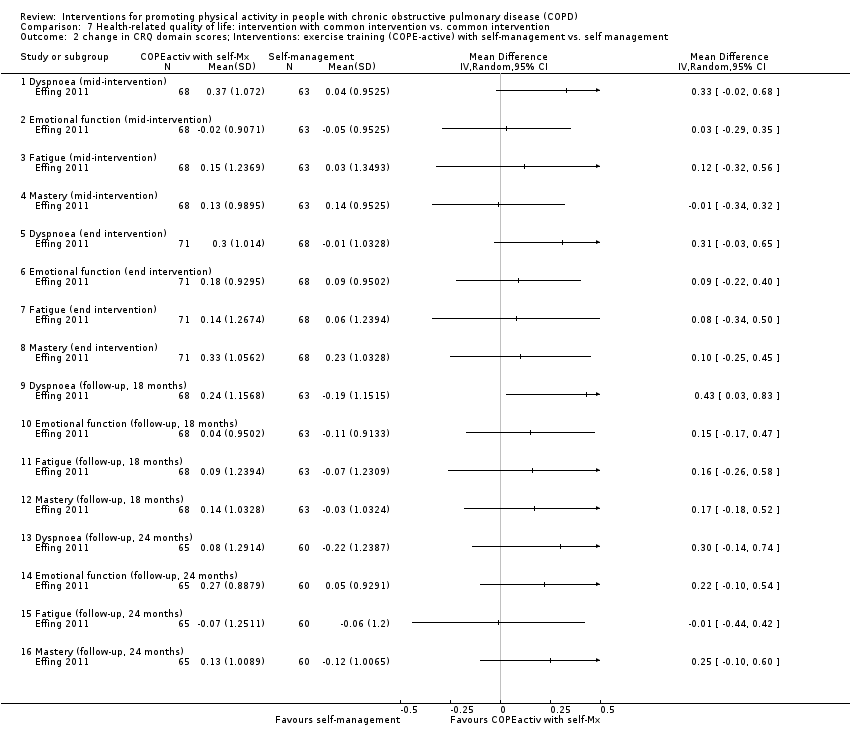
Comparison 7 Health‐related quality of life: intervention with common intervention vs. common intervention, Outcome 2 change in CRQ domain scores; Interventions: exercise training (COPE‐active) with self‐management vs. self management.

Comparison 7 Health‐related quality of life: intervention with common intervention vs. common intervention, Outcome 3 change in CCQ domain scores; Interventions: exercise training (COPE‐active) with self‐management vs. self management.

Comparison 7 Health‐related quality of life: intervention with common intervention vs. common intervention, Outcome 4 CRQ domain scores; Interventions: LAMA/LABA and exercise training with behaviour modification vs. placebo with behaviour modification.

Comparison 7 Health‐related quality of life: intervention with common intervention vs. common intervention, Outcome 5 CRQ domain scores; Interventions: exercise training and LABA with LAMA and behaviour modification vs. LAMA and behaviour modification.

Comparison 7 Health‐related quality of life: intervention with common intervention vs. common intervention, Outcome 6 CRQ domain scores; Interventions: exercise training with LAMA/LABA and behaviour modification vs. LAMA/LABA and behaviour modification.

Comparison 7 Health‐related quality of life: intervention with common intervention vs. common intervention, Outcome 7 change in SGRQ domain and total scores; Intervention: exercise training and physical activity counselling with pedometer vs. pedometer.

Comparison 7 Health‐related quality of life: intervention with common intervention vs. common intervention, Outcome 8 change in CRQ domain scores; Interventions: physical activity counselling (app) with optional supervised exercise vs. optional supervised exercise.

Comparison 7 Health‐related quality of life: intervention with common intervention vs. common intervention, Outcome 9 change in SGRQ total score; Interventions: physical activity counselling with pedometer vs. pedometer.

Comparison 7 Health‐related quality of life: intervention with common intervention vs. common intervention, Outcome 10 SGRQ total: Interventions: physical activity counselling (app) with pedometer vs. pedometer.
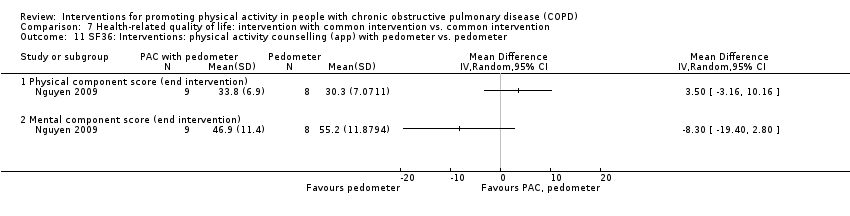
Comparison 7 Health‐related quality of life: intervention with common intervention vs. common intervention, Outcome 11 SF36: Interventions: physical activity counselling (app) with pedometer vs. pedometer.

Comparison 7 Health‐related quality of life: intervention with common intervention vs. common intervention, Outcome 12 change in SGRQ domain scores; Interventions: physical activity counselling (web‐based) with pedometer vs. pedometer.

Comparison 7 Health‐related quality of life: intervention with common intervention vs. common intervention, Outcome 13 SGRQ domain scores; Interventions: physical activity counselling with pulmonary rehabilitation vs. pulmonary rehabilitation.

Comparison 7 Health‐related quality of life: intervention with common intervention vs. common intervention, Outcome 14 RAND36 domain scores; Interventions: physical activity counselling with pulmonary rehabilitation vs. pulmonary rehabilitation.
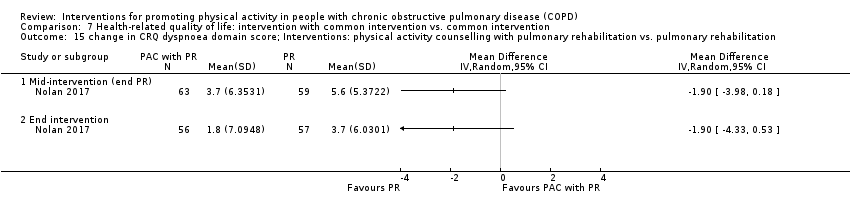
Comparison 7 Health‐related quality of life: intervention with common intervention vs. common intervention, Outcome 15 change in CRQ dyspnoea domain score; Interventions: physical activity counselling with pulmonary rehabilitation vs. pulmonary rehabilitation.
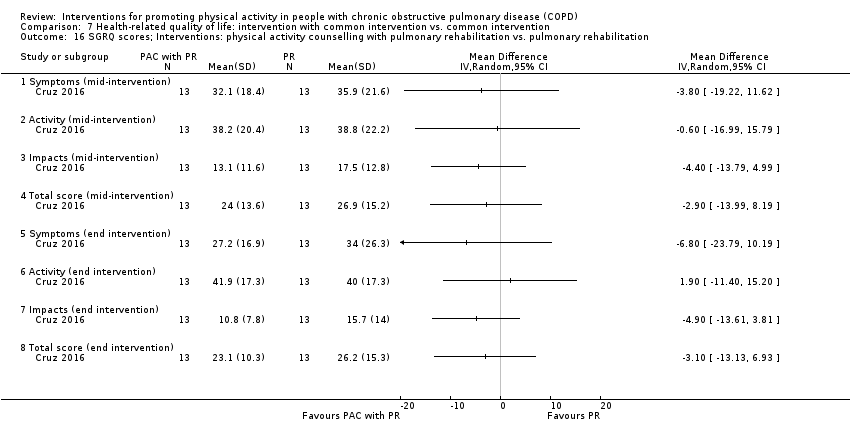
Comparison 7 Health‐related quality of life: intervention with common intervention vs. common intervention, Outcome 16 SGRQ scores; Interventions: physical activity counselling with pulmonary rehabilitation vs. pulmonary rehabilitation.
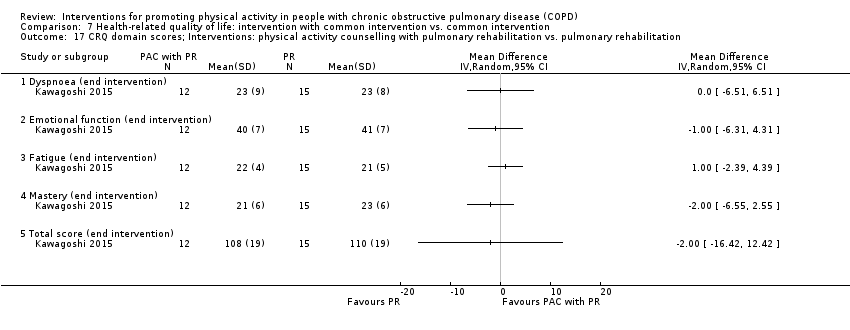
Comparison 7 Health‐related quality of life: intervention with common intervention vs. common intervention, Outcome 17 CRQ domain scores; Interventions: physical activity counselling with pulmonary rehabilitation vs. pulmonary rehabilitation.

Comparison 7 Health‐related quality of life: intervention with common intervention vs. common intervention, Outcome 18 change in CRQ total score; Interventions: physical activity counselling with pulmonary rehabilitation vs. sham intervention with pulmonary rehabilitation.
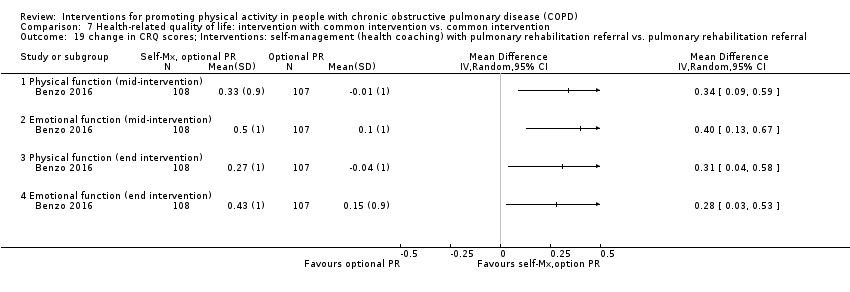
Comparison 7 Health‐related quality of life: intervention with common intervention vs. common intervention, Outcome 19 change in CRQ scores; Interventions: self‐management (health coaching) with pulmonary rehabilitation referral vs. pulmonary rehabilitation referral.

Comparison 7 Health‐related quality of life: intervention with common intervention vs. common intervention, Outcome 20 CRQ domain scores; Interventions: LAMA with behaviour modification vs. placebo with behaviour modification.
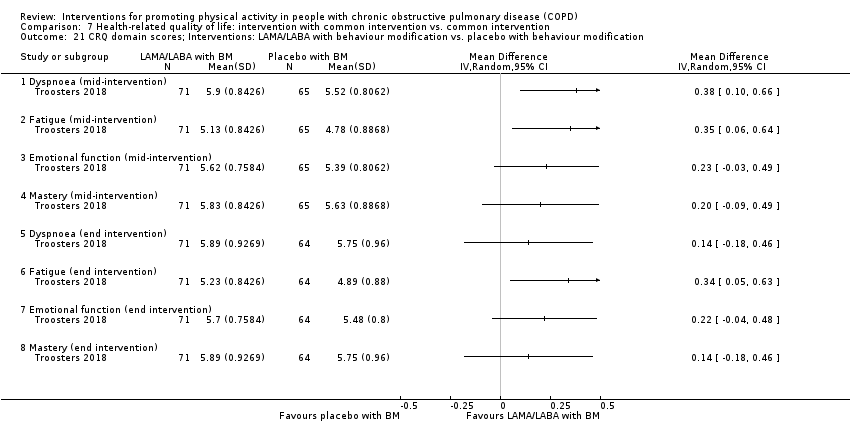
Comparison 7 Health‐related quality of life: intervention with common intervention vs. common intervention, Outcome 21 CRQ domain scores; Interventions: LAMA/LABA with behaviour modification vs. placebo with behaviour modification.

Comparison 7 Health‐related quality of life: intervention with common intervention vs. common intervention, Outcome 22 CRQ domain scores; Interventions: LABA with LAMA and behaviour modification vs. LAMA and behaviour modification.

Comparison 7 Health‐related quality of life: intervention with common intervention vs. common intervention, Outcome 23 change in SGRQ domain and total scores; Interventions: ACE inhibitor with pulmonary rehabilitation vs. placebo with pulmonary rehabilitation.

Comparison 7 Health‐related quality of life: intervention with common intervention vs. common intervention, Outcome 24 change in SGRQ total score; Interventions: nutritional supplement with pulmonary rehabilitation vs. placebo with pulmonary rehabilitation.

Comparison 7 Health‐related quality of life: intervention with common intervention vs. common intervention, Outcome 25 change in EQ5D; Interventions: nutritional supplement with pulmonary rehabilitation vs. placebo with pulmonary rehabilitation.

Comparison 7 Health‐related quality of life: intervention with common intervention vs. common intervention, Outcome 26 change in CRQ domain scores; Interventions: supplemental oxygen with pulmonary rehabilitation vs. sham intervention with pulmonary rehabilitation.
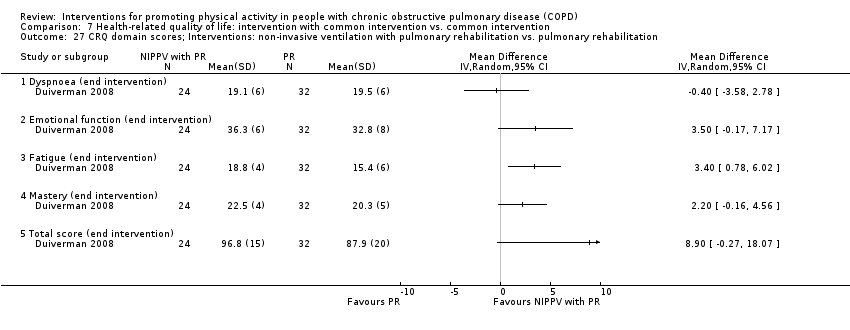
Comparison 7 Health‐related quality of life: intervention with common intervention vs. common intervention, Outcome 27 CRQ domain scores; Interventions: non‐invasive ventilation with pulmonary rehabilitation vs. pulmonary rehabilitation.
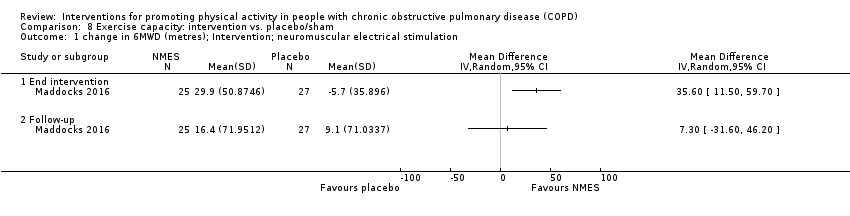
Comparison 8 Exercise capacity: intervention vs. placebo/sham, Outcome 1 change in 6MWD (metres); Intervention; neuromuscular electrical stimulation.
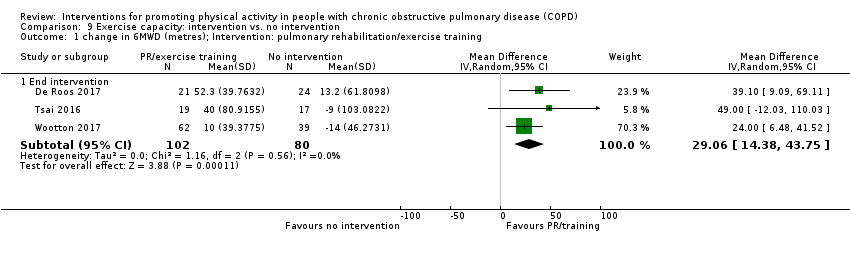
Comparison 9 Exercise capacity: intervention vs. no intervention, Outcome 1 change in 6MWD (metres); Intervention: pulmonary rehabilitation/exercise training.
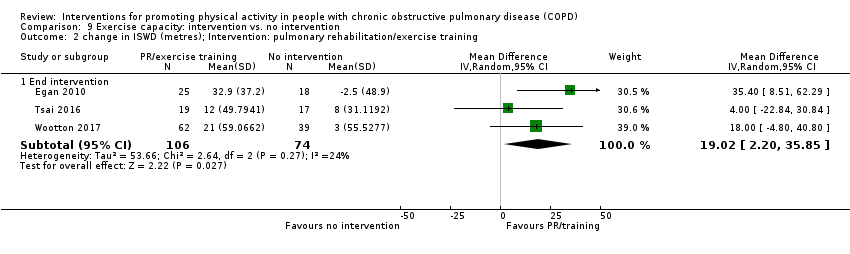
Comparison 9 Exercise capacity: intervention vs. no intervention, Outcome 2 change in ISWD (metres); Intervention: pulmonary rehabilitation/exercise training.

Comparison 9 Exercise capacity: intervention vs. no intervention, Outcome 3 change in ESWT (seconds); Intervention: pulmonary rehabilitation/exercise training.

Comparison 9 Exercise capacity: intervention vs. no intervention, Outcome 4 6MWD (metres); Intervention: high‐intensity interval training.

Comparison 9 Exercise capacity: intervention vs. no intervention, Outcome 5 work rate (watts); Intervention: high‐intensity interval training.
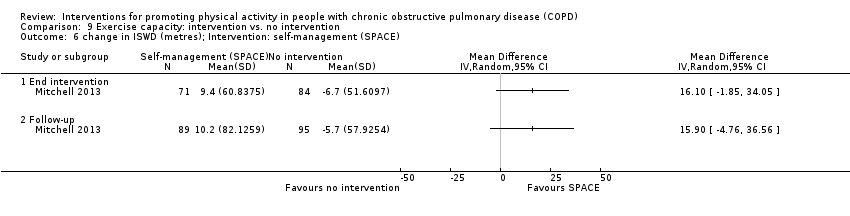
Comparison 9 Exercise capacity: intervention vs. no intervention, Outcome 6 change in ISWD (metres); Intervention: self‐management (SPACE).
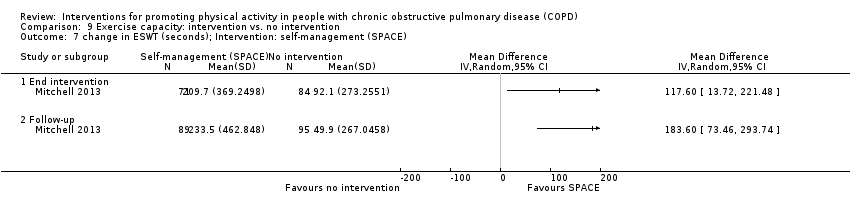
Comparison 9 Exercise capacity: intervention vs. no intervention, Outcome 7 change in ESWT (seconds); Intervention: self‐management (SPACE).
![Comparison 9 Exercise capacity: intervention vs. no intervention, Outcome 8 6MWD (metres); Intervention: exercise training [inpatient].](/es/cdsr/doi/10.1002/14651858.CD012626.pub2/media/CDSR/CD012626/image_n/nCD012626-CMP-009-08.png)
Comparison 9 Exercise capacity: intervention vs. no intervention, Outcome 8 6MWD (metres); Intervention: exercise training [inpatient].
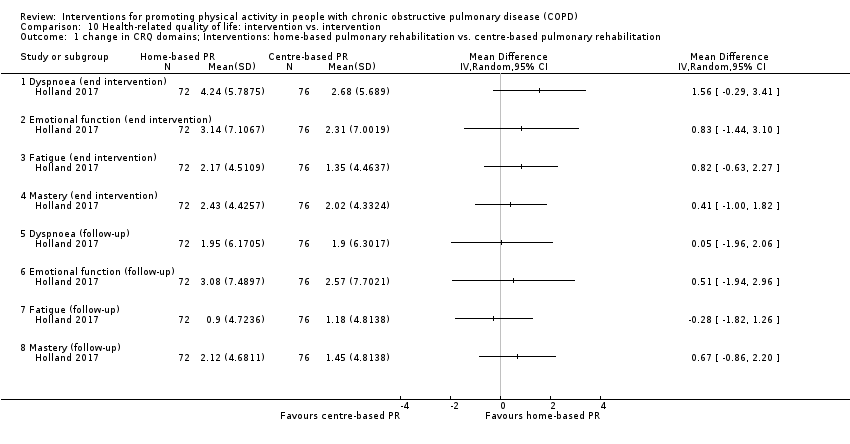
Comparison 10 Health‐related quality of life: intervention vs. intervention, Outcome 1 change in CRQ domains; Interventions: home‐based pulmonary rehabilitation vs. centre‐based pulmonary rehabilitation.

Comparison 10 Health‐related quality of life: intervention vs. intervention, Outcome 2 change in CRQ domains; Interventions: water‐based exercise training vs. land‐based exercise training.

Comparison 10 Health‐related quality of life: intervention vs. intervention, Outcome 3 SGRQ domain and total scores; Interventions: Tai Chi vs. pulmonary rehabilitation.
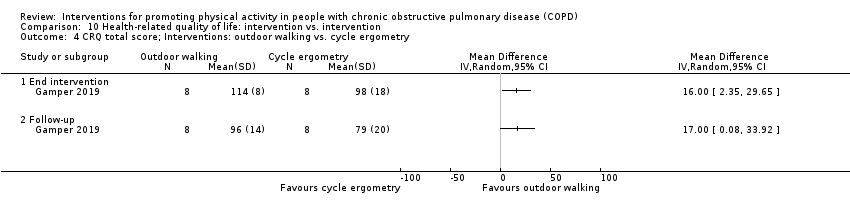
Comparison 10 Health‐related quality of life: intervention vs. intervention, Outcome 4 CRQ total score; Interventions: outdoor walking vs. cycle ergometry.

Comparison 10 Health‐related quality of life: intervention vs. intervention, Outcome 5 Maugeri Respiratory Failure questionnaire; Interventions: exercise training with tapered supervision vs. supervised exercise training.

Comparison 10 Health‐related quality of life: intervention vs. intervention, Outcome 6 SF36 domain scores; Interventions: self‐management vs. education and symptom monitoring.
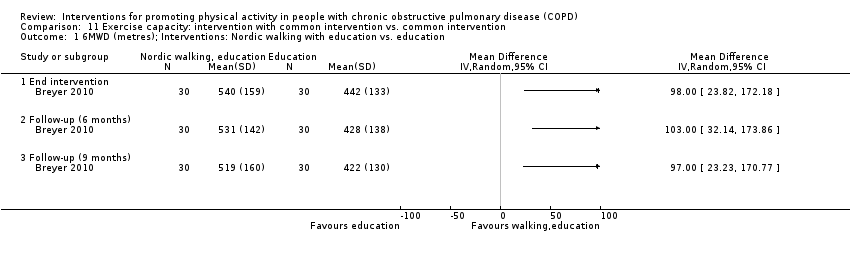
Comparison 11 Exercise capacity: intervention with common intervention vs. common intervention, Outcome 1 6MWD (metres); Interventions: Nordic walking with education vs. education.

Comparison 11 Exercise capacity: intervention with common intervention vs. common intervention, Outcome 2 change in ISWD (metres); Interventions: exercise training (COPE‐active) with self‐management vs. self management.

Comparison 11 Exercise capacity: intervention with common intervention vs. common intervention, Outcome 3 change in ESWT (seconds); Interventions: exercise training (COPE‐active) with self‐management vs. self management.
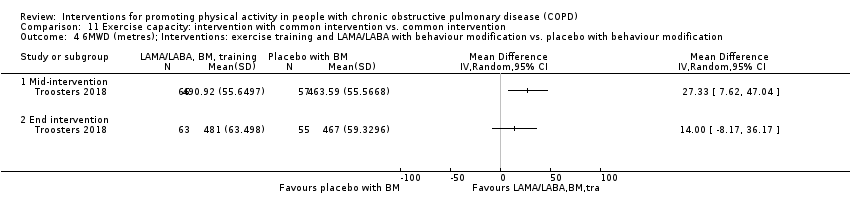
Comparison 11 Exercise capacity: intervention with common intervention vs. common intervention, Outcome 4 6MWD (metres); Interventions: exercise training and LAMA/LABA with behaviour modification vs. placebo with behaviour modification.

Comparison 11 Exercise capacity: intervention with common intervention vs. common intervention, Outcome 5 ESWT (seconds); Interventions: exercise training and LAMA/LABA with behaviour modification vs. placebo with behaviour modification.

Comparison 11 Exercise capacity: intervention with common intervention vs. common intervention, Outcome 6 6MWD (metres); Interventions: exercise training and LABA with LAMA and behaviour modification vs. LAMA and behaviour modification.

Comparison 11 Exercise capacity: intervention with common intervention vs. common intervention, Outcome 7 ESWT (seconds); Interventions: exercise training and LABA with LAMA and behaviour modification vs. LAMA and behaviour modification.

Comparison 11 Exercise capacity: intervention with common intervention vs. common intervention, Outcome 8 6MWD (metres); Interventions: exercise training with LAMA/LABA and behaviour modification vs. LAMA/LABA and behaviour modification.
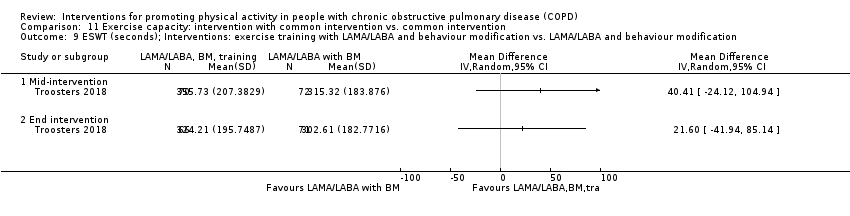
Comparison 11 Exercise capacity: intervention with common intervention vs. common intervention, Outcome 9 ESWT (seconds); Interventions: exercise training with LAMA/LABA and behaviour modification vs. LAMA/LABA and behaviour modification.

Comparison 11 Exercise capacity: intervention with common intervention vs. common intervention, Outcome 10 change in ESWT (seconds); Intervention: physical activity counselling and exercise training with pedometer vs. pedometer.

Comparison 11 Exercise capacity: intervention with common intervention vs. common intervention, Outcome 11 6MWD (metres); Interventions: physical activity counselling (app) with optional supervised exercise vs. optional supervised exercise.

Comparison 11 Exercise capacity: intervention with common intervention vs. common intervention, Outcome 12 6MWD (metres); Interventions: physical activity counselling (app) with pedometer vs. pedometer.

Comparison 11 Exercise capacity: intervention with common intervention vs. common intervention, Outcome 13 6MWD (metres); Interventions: physical activity counselling with pulmonary rehabilitation vs. pulmonary rehabilitation.

Comparison 11 Exercise capacity: intervention with common intervention vs. common intervention, Outcome 14 change in 6MWD (metres); Interventions: physical activity counselling with pulmonary rehabilitation vs. sham with pulmonary rehabilitation.

Comparison 11 Exercise capacity: intervention with common intervention vs. common intervention, Outcome 15 6MWD (metres); Interventions: LAMA with behaviour modification vs. placebo with behaviour modification.
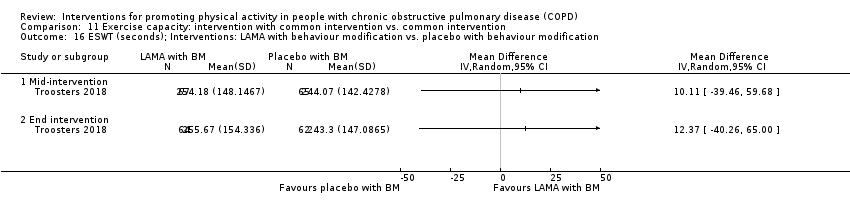
Comparison 11 Exercise capacity: intervention with common intervention vs. common intervention, Outcome 16 ESWT (seconds); Interventions: LAMA with behaviour modification vs. placebo with behaviour modification.

Comparison 11 Exercise capacity: intervention with common intervention vs. common intervention, Outcome 17 6MWD (metres); Interventions: LAMA/LABA with behaviour modification vs. placebo with behaviour modification.
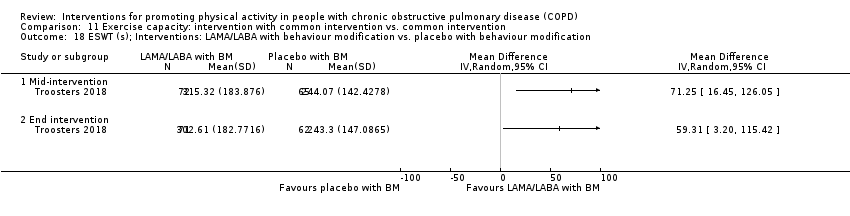
Comparison 11 Exercise capacity: intervention with common intervention vs. common intervention, Outcome 18 ESWT (s); Interventions: LAMA/LABA with behaviour modification vs. placebo with behaviour modification.
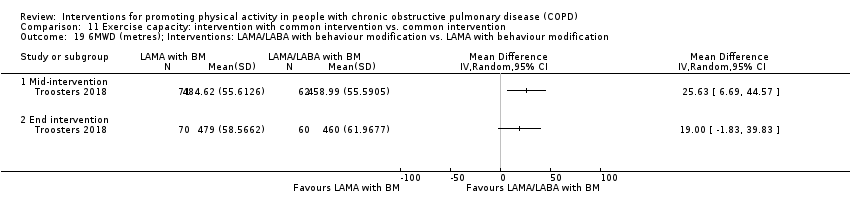
Comparison 11 Exercise capacity: intervention with common intervention vs. common intervention, Outcome 19 6MWD (metres); Interventions: LAMA/LABA with behaviour modification vs. LAMA with behaviour modification.
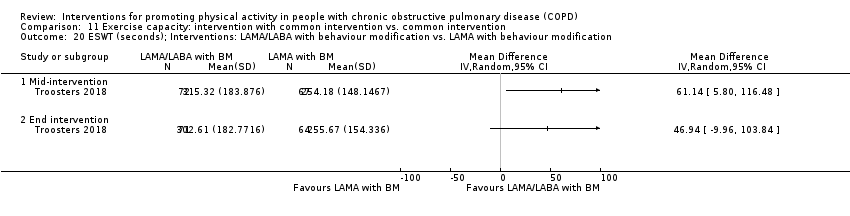
Comparison 11 Exercise capacity: intervention with common intervention vs. common intervention, Outcome 20 ESWT (seconds); Interventions: LAMA/LABA with behaviour modification vs. LAMA with behaviour modification.
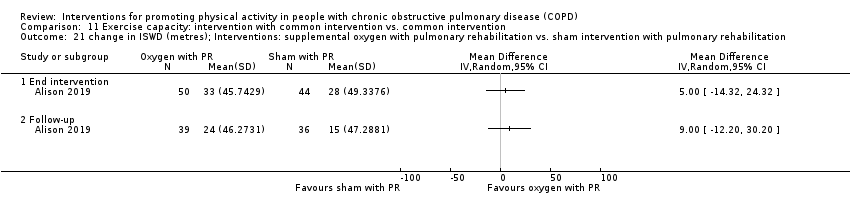
Comparison 11 Exercise capacity: intervention with common intervention vs. common intervention, Outcome 21 change in ISWD (metres); Interventions: supplemental oxygen with pulmonary rehabilitation vs. sham intervention with pulmonary rehabilitation.

Comparison 11 Exercise capacity: intervention with common intervention vs. common intervention, Outcome 22 change in ESWT (seconds); Interventions: supplemental oxygen with pulmonary rehabilitation vs. sham intervention with pulmonary rehabilitation.
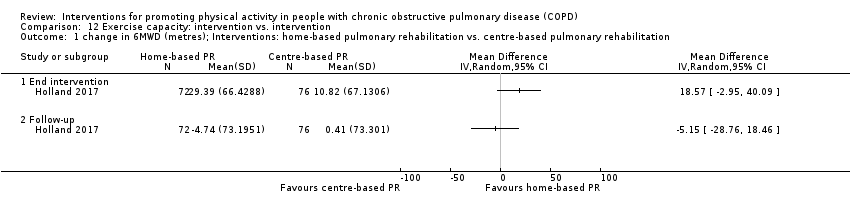
Comparison 12 Exercise capacity: intervention vs. intervention, Outcome 1 change in 6MWD (metres); Interventions: home‐based pulmonary rehabilitation vs. centre‐based pulmonary rehabilitation.

Comparison 12 Exercise capacity: intervention vs. intervention, Outcome 2 change in 6MWD (metres); Interventions: water‐based exercise training vs. land‐based exercise training.

Comparison 12 Exercise capacity: intervention vs. intervention, Outcome 3 change in ISWD (metres); Interventions: water‐based exercise training vs. land‐based exercise training.
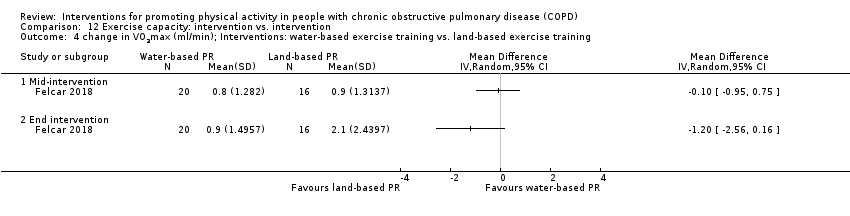
Comparison 12 Exercise capacity: intervention vs. intervention, Outcome 4 change in VO2max (ml/min); Interventions: water‐based exercise training vs. land‐based exercise training.
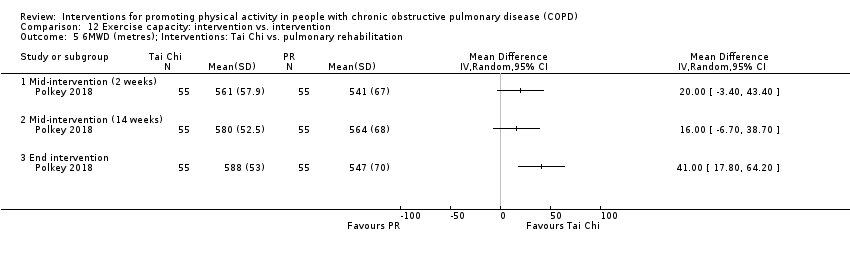
Comparison 12 Exercise capacity: intervention vs. intervention, Outcome 5 6MWD (metres); Interventions: Tai Chi vs. pulmonary rehabilitation.

Comparison 12 Exercise capacity: intervention vs. intervention, Outcome 6 6MWD (metres); Interventions: exercise training with tapered supervision vs. supervised exercise training.
| Population: people with COPD, clinical stability Intervention: pulmonary rehabilitation/exercise training Comparisons: intervention versus no intervention Outcome: time in physical activity (of at least moderate intensity) at end intervention | ||||||
| Interventions | Outcome | Illustrative comparative risks* [mean difference (95% CI) unless indicated] | Number of participants (studies) | Quality of the evidence | Comments | |
| Assumed risk | Corresponding risk | |||||
| No intervention | Pulmonary rehabilitation/exercise training | |||||
| Pulmonary rehabilitation vs. no intervention (8 to 10 weeks) | Time/change in time in MVPA | The mean change in time ranged from −1 to 6 minutes per day, mean time 27 minutes per day | The mean difference was 4 (−2 to 9) minutes per day | 190 participants (3 studies; Analysis 1.2) | ⊕⊕⊝⊝ | Baseline values: De Roos 2017 no intervention mean 11 (SD 10), pulmonary rehabilitation 12 (11); Wootton 2017 no intervention 46 (39), pulmonary rehabilitation 54 (43) |
| High‐intensity interval training vs. no intervention (8 to 12 weeks) | Time in MVPA | The mean time ranged from 12 to 14 minutes per day | The mean difference was 6 (4 to 8) minutes per day | 275 participants (2 studies; Analysis 1.9) | ⊕⊕⊕⊝ moderateb | ‐ |
| Maintenance (telerehabilitation) following high‐intensity interval training vs. no intervention (12 months) | Time in moderate intensity physical activity | The mean time was 11 minutes per day | The mean difference was 7 (4 to 10) minutes per day | 97 participants (1 study; Vasilopoulou 2017; Table 1) | ⊕⊕⊕⊝ moderateb | ‐ |
| Maintenance (centre‐based) following high intensity interval training vs. no intervention (12 months) | The mean difference was 11 (8 to 14) minutes per day | 100 participants (1 study; Vasilopoulou 2017; Table 1) | ||||
| *The basis for the assumed risk (e.g. the median control group risk across studies) is provided in footnotes. The corresponding risk (and its 95% confidence interval) is based on the assumed risk in the comparison group and the relative effect of the intervention (and its 95% CI). | ||||||
| GRADE Working Group grades of evidence | ||||||
| aDowngraded one level for high risk of performance bias. Downgraded one level for imprecision as CI does not exclude possibility of no effect. | ||||||
| Study | Comparison (setting, if known) Clinical stability unless indicated | Timepoint (end intervention unless indicated) | Outcome (minutes unless indicated) | Intervention group | Comparison group | Between‐group MD (95% CI) where available unless indicated | ||
| n | mean (95% CI) unless indicated | n | mean (95% CI) unless indicated | |||||
| Physical activity counselling vs. no intervention (primary care) | 12 weeks | ∆ step count (n) | 22 | median 537 (IQR −611 to 1740) | 18 | median 431 (IQR −899 to 749) | P = 0.48* | |
| ∆ "daily physical activity" (n) | median 1408 (IQR −2165 to 3304) | median 528 (IQR −966 to 2179) | P = 0.35* | |||||
| follow‐up (12 months post‐intervention) | ∆ step count (n) | 20 | median 157 (IQR −1679 to 994) | 18 | median 48 (IQR −1004 to 885) | P = 0.90* | ||
| ∆ "daily physical activity" (n) | median 353 (IQR −1518 to 3038) | median −576 (IQR −2517 to 1008) | P = 0.26* | |||||
| Physical activity counselling vs. no intervention (secondary care) | 12 weeks | ∆ step count (n) | 21 | median 1002 (IQR −612 to 3077) | 22 | median −814 (IQR −2827 to 1063) | P = 0.007* | |
| ∆ "daily physical activity" (n) | median 1575 (IQR −752 to 3864) | median −1041 (IQR −1971 to 1031) | P = 0.007* | |||||
| follow‐up (12 months post‐intervention) | ∆ step count (n) | 20 | median 1128 (IQR −1322 to 2707) | 19 | median −217 (IQR −1951 to 1147) | P = 0.15* | ||
| ∆ "daily physical activity" (n) | median 1798 (IQR −1994 to 3128) | median −718 (IQR −1812 to 512) | P = 0.11* | |||||
| Physical activity counselling with PR vs. PR | 12 weeks | ∆ step count (n) | 22 | median 547 (IQR 187 to 1323) | 15 | median −211 (IQR −1337 to 1038) | P = 0.03* | |
| ∆ "daily physical activity" (n) | median 1302 (IQR −173 to 1922) | median −849 (IQR −2223 to 961) | P = 0.03* | |||||
| follow‐up (12 months post‐intervention) | ∆ step count (n) | 10 | median −569 (IQR −2512 to 1551) | 13 | median −1137 (IQR −2376 to 1427) | P = 0.58* | ||
| ∆ "daily physical activity" (n) | median −213 (IQR −4525 to 2274) | median −1827 (IQR −3540 to 629) | P = 0.97* | |||||
| Physical activity counselling vs. no intervention (primary care) SUBGROUP: ≥ 10,000 steps per day (baseline) | 12 weeks | ∆ step count (n) | median 675 (IQR 4 to 1853) | median 342 (IQR −955 to 658) | P = 0.20* | |||
| ∆ "daily physical activity" (n) | median 1807 (IQR 164 to 3720) | median 519 (IQR −1089 to 1709] | P = 0.11* | |||||
| follow‐up (12 months post‐intervention) | ∆ step count (n) | median 201 (IQR −693 to 1170) | median 38 (IQR −1071 to 821) | P = 0.55* | ||||
| ∆ "daily physical activity" (n) | median 525 (IQR −545 to 3078) | median −726 (IQR −2954 to 711) | P = 0.06* | |||||
| Physical activity counselling vs. no intervention (secondary care) SUBGROUP: ≤ 10,000 steps per day (baseline) | 12 weeks | ∆ step count (n) | median 1289 (IQR −183 to 3107) | median 34 (IQR −1707 to 1095) | P = 0.02* | |||
| ∆ "daily physical activity" (n) | median 1763 (IQR −763 to 3913) | median −925 (IQR −1452 to 1052) | P = 0.03* | |||||
| follow‐up (12 months post‐intervention) | ∆ step count (n) | median 1436 (IQR −1492 to 2722) | median 0 (IQR −1825 to 1103) | P = 0.12* | ||||
| ∆ "daily physical activity" (n) | median 1928 (IQR −1140 to 3320) | median −526 (IQR −1657 to 435) | P = 0.078* | |||||
| Physical activity counselling with PR vs. PR SUBGROUP: ≤ 10,000 steps per day (baseline) | 12 weeks | ∆ step count (n) | median 547 (IQR 187 to 1323) | median −198 (IQR −1403 to 1051) | P = 0.04* | |||
| ∆ "daily physical activity" (n) | median 1302 (IQR −173 to 1922) | median −843 (IQR −1737 to 1329) | P = 0.052* | |||||
| follow‐up (12 months post intervention) | ∆ step count (n) | median −569 (IQR −1770 to 2170) | median −759 (IQR −2027 to 1641) | P = 0.78* | ||||
| ∆ "daily physical activity" (n) | median −213 (IQR −4525 to 2274) | median −644 (IQR −3706 to 844) | P = 0.91* | |||||
| LAMA vs. placebo | 3 weeks | ∆ step count (n) | 51 | median 69 (IQR −834 to 1262) | 53 | median 125 (IQR −1180 to 1249) | P = 0.73 | |
| ∆ MVPA time | median 1 (IQR −22 to 25) | median −6 (IQR −21 to 15) | P = 0.11 | |||||
| ∆ PAL | median 0.00 (IQR −0.08 to 0.09) | median −0.01 (IQR −0.09 to 0.09) | P = 0.95 | |||||
| ∆ active EE (kcal) | median 10 (−131 to 116) | median −44 (IQR −122 to 40) | P = 0.11 | |||||
| Physical activity counselling with pedometer vs. pedometer | 12 weeks | step count (n) | 49 | x | 50 | x | x | |
| Self‐management (health coaching) with PR referral vs. PR referral | 12 months | ∆ PAL | 108 | mean −0.10 | 106 | mean 0.01 | P = not significant* | |
| step count (n) | only baseline values reported | only baseline values reported | "We did not find a difference in any physical activity outcome between the intervention and control arms at any time point"* | |||||
| time sedentary | ||||||||
| LIPA time | ||||||||
| MPA time | ||||||||
| VPA time | ||||||||
| resting metabolic rate (calories per 24 hours) | ||||||||
| total EE (calories per 24 hours) | ||||||||
| Self‐management vs. education and symptom management | 16 weeks | activity time | 162 | mean 13 (SE 1) | 164 | mean 11 (SE 1) | P = 0.045* | |
| MPA time | mean 6 (SE 0.4) | mean 5.5 (SE 0.4) | 0.5 (−0.6 to 1.6) | |||||
| total EE ("caloric expenditure") | mean 3605 (SE 211) | mean 3113 (SE 212) | P = 0.022* | |||||
| Exercise training (whole‐body resistance training) vs. no intervention (inpatient) | 4‐week follow‐up | time lying | 15 | mean 224 (SD 131) | 14 | mean 203 (SD 140) | 21 (−78 to 120) | |
| time sitting | mean 287 (122) | mean 298 (SD 107) | −11 (−94 to 72) | |||||
| time standing | mean 168 (104) | mean 153 (SD 94) | 15 (−57 to 87) | |||||
| time walking | mean 31 (21) | mean 50 (SD 35) | −19 (−40 to 2) | |||||
| Nordic walking with education vs. education | 12 weeks | ∆ time sitting | 30 | mean −128 (SD 15) | 30 | "Controls did not show any significant change in | P = 0.014* | |
| ∆ time standing | mean 129 (SD 26) | x | ||||||
| ∆ time walking | mean 15 (SD 20) | P = 0.034* | ||||||
| follow‐up (3 months post‐intervention) | ∆ time sitting | mean −120 (SD 32) | P < 0.05* | |||||
| ∆ time standing | mean 133 (SD 14) | P < 0.05* | ||||||
| ∆ time walking | mean 13 (SD 2) | x | ||||||
| follow‐up (6 months post‐intervention) | time sitting | mean 233 (SD 172) | mean 342 (SD 126) | P < 0.01* | ||||
| time standing | mean 320 (SD 178) | mean 220 (SD 130) | P = 0.16 | |||||
| time walking | mean 56 (SD 38) | mean 32 (SD 25) | P < 0.01 | |||||
| Web‐based PR vs. centre‐based PR | 7 weeks | step count (n) | 20 | x | 34 | x | P = 0.37* | |
| "20 min bouts of purposeful activity" (n) | mean change 10% | x | P = 0.26* | |||||
| Inspiratory muscle training with PR vs. sham with PR | 12 weeks (total n = 150) | step count (n) | x | mean 3958 (SD 2253) | x | mean 4506 (SD 1899) | −206 (−923 to 512)* | |
| ACE inhibitor with PR vs. placebo with PR | 10 weeks | ∆ step count (n) | 18 | mean −382 (SD 2082) | 22 | mean 561 (SD 2528) | −943 (−2372 to 486) | |
| ∆ PAL | mean −0.06 (SD 0.16) | mean 0.04 (SD 0.15) | −0.10 (−0.20 to −0.00) | |||||
| Physical activity counselling vs. no intervention | 12 weeks | ∆ time walking | 140 | 7 (1 to 13) | 140 | −10 (−14 to −6) | 17 (10 to 24) | |
| ∆ intensity movement (m/s2) | 0.06 (0.02 to 0.10) | −0.03 (−0.06 to −0.00) | 0.09 (0.04 to 0.14) | |||||
| ∆ MVPA time | 8 (5 to 12) | −3 (−6 to 0.2) | 11 (7 to 15) | |||||
| Non‐invasive ventilation with PR vs. PR | 12 weeks | step count (n) | 24 | median 2799 (IQR 891 to 6135) | 32 | median 2093 (IQR 914 to 3155) | median 1269 (IQR 242 to 2296)* | |
| Water‐based exercise training vs. land‐based exercise training | 6 months | active (n) (> 7500 steps per day) | 20 | baseline 4 end intervention 10 | 16 | baseline 4 end intervention 5 | x | |
| Endobronchial valve surgery vs. no intervention | 6 months post‐surgery | ∆ step count (n) | 19 | 1252 (545 to 1960) | 24 | −148 (−512 to 216) | 1400 (655 to 2145) | |
| ∆ time walking (%) | 1 (0 to 2) | 0 (−1 to 0) | 1 (0 to 2) | |||||
| ∆ time sitting (%) | 0 (−3 to 3) | 2 (1 to 3) | −2 (−5 to 1) | |||||
| ∆ time inactive | −1 (−3 to 1) | 0 (−1 to 1) | −1 (−3 to 1) | |||||
| ∆ intensity movement (g) | 0.01 (0.00 to 0.01) | 0.00 (−0.01 to 0.00) | 0.01 (0.00 to 0.02) | |||||
| Physical activity counselling vs. no intervention | 4 weeks | ∆ step count (n) | 12 | 984 (217 to 1752) | 14 | 1013 (307 to 1719) | −29 (−969 to 911) | |
| ∆ time walking | 13 (3 to 23) | 13 (5 to 21) | 0 (−12 to 12) | |||||
| ∆ intensity movement (m/s2) | 0.06 (0.03 to 0.09) | 0.08 (−0.05 to 0.11) | −0.02 (−0.06 to 0.02) | |||||
| Self‐management vs. no intervention | 12 months | MVPA time a week | 179 | mean 347 (SD 277) | 232 | mean 316 (SD 256) | 12 (−21 to 45)* | |
| Self‐management (SPACE) vs. no intervention (post‐admission) | 7 days | ∆ step count (n) | 15 | −208 (−1146 to 730) | 10 | −518 (−2572 to 1536) | 310 (−1665 to 2285) | |
| ∆ time sedentary | −14 (−71 to 43) | −18 (−87 to 51) | 4 (−75 to 83) | |||||
| ∆time in "physical activity" | −1 (−14 to 12) | −16 (−66 to 34) | 15 (−30 to 60) | |||||
| ∆ MPA time | −1 (−14 to 12) | −14 (−61 to 33) | 13 (−30 to 56) | |||||
| ∆ VPA time | 0 (−1 to 1) | −2 (−61 to 2) | 2 (−1 to 5) | |||||
| ∆ total EE (kcal) | −128 (−236 to −20) | −98 (−292 to 96) | −30 (−225 to 165) | |||||
| ∆ active EE (kcal) | −12 (−77 to 53) | −97 (−310 to 116) | 85 (−108 to 278) | |||||
| Physical activity counselling with PR vs. PR | 12 months | ∆ time sitting | 12 | 59 (−6 to 124) | 15 | 6 (−44 to 56) | 53 (−21 to 127) | |
| ∆ time standing | 43 (24 to 60) | 31 (5 to 57) | 11 (−18 to 40) | |||||
| ∆ time walking | 51 (10 to 92) | 12 (−2 to 27) | 39 (1 to 78) | |||||
| ∆ time lying | −53 (−96 to −10) | −29 (−60 to 2) | −24 (−72 to 24) | |||||
| ∆ frequency postural changes: total (n) | 40 (−2 to 82) | 19 (−5 to 43) | 21 (−23 to 65) | |||||
| ∆ frequency postural changes: getting up (n) | 0 (−16 to 16) | 6 (−11 to 23) | −6 (−27 to 15) | |||||
| ∆ frequency postural changes: standing up (n) | 43 (5 to 81) | 14 (−5 to 33) | 29 (−9 to 67) | |||||
| Exercise‐specific self‐efficacy training with upper‐body resistance training vs. upper‐body resistance training | 4 months | time sedentary | 15 | mean 602 (SD 112) | 20 | mean 577 (SD 107) | 25 (−49 to 99) | |
| time sedentary (% monitored time) | mean 70 (SD 10) | mean 70 (SD 9) | 0 (−6 to 6) | |||||
| MVPA time | mean 6 (SD 6) | mean 4 (SD 3) | 2 (−1 to 5) | |||||
| Upper‐body resistance training with health education vs. health education | time sedentary | 20 | mean 577 (SD 107) | 14 | mean 634 (SD 114) | −57 (−133 to 19) | ||
| time sedentary (% monitored time) | mean 70 (SD 9) | mean 70 (SD 9) | −2 (−8 to 4) | |||||
| MVPA time | mean 4 (SD 3) | mean 3 (SD 2) | 1 (−1 to 3) | |||||
| Physical activity counselling with PR vs. PR | 12 weeks | ∆ step count (n) | 25 | x | 25 | x | MD 1319 (SE 571), P = 0.02* | |
| ∆ MVPA time | MD 8 (SE 4), P = 0.11* | |||||||
| 9 months (follow‐up) | ∆ step count (n) | MD 1348 (SE 628), P = 0.03* | ||||||
| ∆ MVPA time | MD 13 (SE 5), P = 0.02* | |||||||
| Singing vs. sham | 8 weeks | ∆ step count (n) | 13 | −763 (−1758 to 232) | 11 | 1011 (337 to 1685) | −1774 (−2848 to −700) | |
| ∆ time sedentary | −36 (−113 to 41) | −27 (−72 to 18) | −9 (−88 to 71) | |||||
| ∆ “physical activity duration” | −93 (−224 to 38) | 50 (22 to 77) | −142 (−263 to −22) | |||||
| ∆ "activity‐related" EE (kJ) | −144 (−408 to 119) | 229 (131 to 327) | −373 (−625 to −121) | |||||
| High‐intensity interval training vs. no intervention | 12 weeks | step count (n) | 85 | mean 5136 (SD 2866) | 43 | mean 3453 (SD 2493) | 1683 (721 to 2646) | |
| vector magnitude units (n) | mean 495 (SD 213) | mean 406 (SD 205) | 89 (13 to 165) | |||||
| "sedentarism" (%) (< 5000 steps per day) | baseline 69 end intervention 48 | baseline 68 end intervention 69 | x | |||||
| LAMA vs. placebo | 3 weeks | ∆ step count (n) | 14 | median 177 (IQR −222 to 1038) | 15 | median 86 (IQR −366 to 1000) | P = 0.63 | |
| ∆ MVPA time | median −2 (IQR −12 to 26] | median −4 (IQR −16 to 19) | P = 0.51 | |||||
| ∆ PAL | median 0.01 (IQR −0.03 to 0.07] | median 0.01 (IQR −0.06 to 0.04) | P = 0.71 | |||||
| ∆ active EE (kcal) | median 43 (IQR −25 to 153) | median 17 (IQR −69 to 50) | P = 0.51 | |||||
| Physical activity counselling with PR vs. PR | 12 weeks | ∆ step count (n) | 22 | mean 1251 (SD 2408) | 22 | mean −410 (SD 1118) | 1661 (552 to 2770) | |
| Pedometer with physical activity counselling vs. physical activity counselling | 12 weeks | ∆ step count (n) | 50 | mean 3080 (SD 3255) | 47 | mean 138 (SD 1950) | 2942 (1881 to 4003) | |
| Self‐management (SPACE) vs. no intervention | 6 weeks | ∆ step count (n) | 52 | 333 (−85 to 751) | 65 | −214 (−566 to 138) | 547 (12 to 1082) | |
| ∆ time sedentary | −10 (−53 to 33) | 13 (−21 to 47) | −23 (−77 to 31) | |||||
| ∆ total EE (kcal) | −4 (−105 to 97) | −20 (−83 to 43) | 16 (−100 to 132) | |||||
| time in bouts (data from graph) | median 142 (95% CI 91 to 190) | median 96 (95% CI 56 to 135) | P = 0.215* | |||||
| LAMA (aclidinium bromide) vs. LAMA (tiotropium) | 8 weeks | "physical activity with sedentary time" | 22 | x | 22 | x | P = 0.385* | |
| LAMA vs. placebo | 12 weeks | not defined | 123 | x | 125 | x | "increase of activity in tiotropium relative to placebo from 7.9% to 12.23%" "the majority of the mean values over time in the tiotropium group are larger than those in the placebo group" | |
| ICS (beclomethasone) with LABA (formoterol) vs. ICS (budesonide) with LABA (formoterol) | 16 weeks (4‐week run‐in, 12 week intervention) | step count (n) | 30 | mean 3826 (SD 2097) | 29 | mean 3510 (SD 2409) | 316 (−838 to 1470) | |
| Four‐wheeled walker vs. no intervention | 4 weeks | step count (n) | 8 | mean 6465 (SD 4541) minimum 3039, maximum 16,558 | 9 | mean 2384 (SD 1319) minimum 574, maximum 4453 | 4081 (818 to 7344) N.B. no baseline assessment; likely imbalance, data skewed | |
| Physical activity counselling with PR vs. PR | 8 weeks (mid‐intervention, post‐PR) | ∆ step count (n) (SenseWear) | 63 | median 272 (IQR −342 to 782) | 59 | median 155 (IQR −438 to 867) | P = 0.99* | |
| ∆ step count (n) (pedometer) | median 727 (IQR −1493 to 3119) | median 892 (IQR −1187 to 2534) | P = 0.55* | |||||
| ∆ MVPA time | median 11 (IQR −1 to 33) | median 11 (IQR −2 to 28) | P = 0.62* | |||||
| 6 months | ∆ step count (n) (SenseWear) | 56 | median −263 (IQR −778 to 197) | 57 | median −461 (IQR −1168 to −62) | P = 0.09* | ||
| ∆ step count (n) (pedometer) | median 116 (IQR −1698 to 3200) | median 481 (IQR −1931 to 1781) | P = 0.85* | |||||
| ∆ MVPA time | median 2 (IQR −12 to 25) | median 12 (IQR −7 to 31) | P = 0.16* | |||||
| ∆ LIPA time | 44 | median 13 (IQR −38 to 33) | 49 | median 0 (IQR −62 to 36) | P = 0.60* | |||
| ∆ time sedentary | median 2 (IQR −38 to 62) | median 22 (IQR −36 to 81) | P = 0.31 | |||||
| Physical activity counselling vs. PR | 12 weeks physical activity counselling, 6 weeks PR | ∆ MVPA time | 14 | 7 (−10 to 24) | 12 | 1 (−3 to 5) | 6 (−10 to 22) | |
| ∆ MVPA bouts (n) | 0.5 (0.2 to 1.1) | −0.03 (−0.1 to 0.05) | 0.5 (0.3 to 0.8) | |||||
| ∆ MVPA time in bouts | 9 (−4 to 22) | −0.4 (−1 to 1) | 10 (−2 to 21) | |||||
| Feedback and education vs. no intervention; Education vs. no intervention; Feedback with education vs. education (post‐admission) | 14 days | ∆ step count (n) | no group data presented | |||||
| "stationary" time | ||||||||
| "light activity" time | ||||||||
| MVPA time | ||||||||
| Enriched nutritional supplement with inpatient PR vs. nutritional supplement with inpatient PR | hospital discharge | ∆ step count | 24 | mean 1900 (SD 2110) | 21 | mean 1700 (SD 1694) | 200 (−913 to 1313) | |
| ∆ EE (kcal) | mean 1521 (SD 285) | mean 1441 (SD 235) | 80 (−72 to 232) | |||||
| Physical activity counselling vs. no intervention | 4 weeks (mid intervention) | % ∆ MPA time | 10 | mean 19 (SD 30) | 8 | mean −5 (SD 13) | 2 (4 to 45) | |
| 8 weeks | mean 20 (SD 29) | mean −12 (SD 22) | 32 (8 to 55) | |||||
| Exercise training (callisthenics) vs. exercise training (endurance and strength training) | 12 weeks (data from graph) | step count (n) | 20 | mean 4235 (SD 822) | 20 | mean 4198 (SD 680) | "There were no significant inter‐group differences in any variable"* | |
| time walking | mean 43 (SD 26) | mean 53 (SD 39) | ||||||
| time standing | mean 231 (SD 123) | mean 243 (SD 106) | ||||||
| time sitting | mean 334 (SD 126) | mean 318 (SD 108) | ||||||
| time lying | mean 115 (SD 89) | mean 100 (SD 78) | ||||||
| MVPA time | mean 55 (SD 15) | mean 75 (SD 19) | ||||||
| active EE (kcal) | mean 335 (SD 104) | mean 389 (SD 119) | ||||||
| total EE (kcal) | mean 1362 (SD 186) | mean 1318 (SD 113) | ||||||
| Physical activity counselling vs. no intervention | 8 weeks (total n = 28) | % ∆ MPA time | x | mean −9 (SD 24) | x | mean −21 (SD 21) | P = 0.116* | |
| Supplemental oxygen vs. placebo (air) | 8 weeks | % ∆ "domestic activity counts" | 10 | mean 7 (SD 54) | 10 | mean −8 (SD 19) | 15 (−21 to 51) | |
| Exercise training (eccentric cycle training) vs. exercise training (concentric cycle training) | 10 weeks | "physical activity levels" | 8 | x | 8 | x | "unchanged"* | |
| Aware of purpose of pedometer with PR vs. unaware of purpose of pedometer with PR | 7 days | step count (n) | 10 | mean 4098 | 9 | mean 3679 | MD 419 "no significant difference between groups"* | |
| Adherence intervention vs. PR | 6 months (follow‐up) | step count (n) | 32 | mean 5045 (SD 3147) | 31 | mean 5204 (SD 3261) | −159 (−1742 to 1424) | |
| peak performance | mean 56 (SD 19) | mean 56 (SD 19) | 0 (−9 to 9) | |||||
| time inactive (%) | mean 68 (SD 15) | mean 70 (SD 13) | −2 (−9 to 5) | |||||
| Physical activity counselling with optional supervised exercise vs. optional supervised exercise | 4 weeks | step count (n) | 13 | mean 5603 (SD 3475) | 16 | mean 4617 (SD 3460) | 986 (−1553 to 3525) | |
| Exercise training (progressive walking and functional‐resistance exercises) vs. no intervention (inpatient) | hospital discharge | step count (n) | 17 | median 4215 (IQR 2133 to 6693) | 17 | median 2198 (IQR 1242 to 4857) | P = 0.07** | |
| LAMA with behavioural management vs. placebo with behavioural management | 6 months | step count (n) | 221 | mean 6485 | 205 | mean 6122 | x | |
| MVPA time | mean 72 | mean 64 | MD 8 | |||||
| LIPA time | mean 111 (SD 82) | mean 101 (SD 80) | 10 (−6 to 26) | |||||
| inactive (%) (< 6000 steps per day) | mean 40 | mean 43 | OR 0.86 (95% CI 0.57 to 1.30) P = 0.477* | |||||
| PR (telerehabilitation) vs. no intervention | 8 weeks | ∆ PAL | 19 | −0.03 (−0.1 to 0.02) | 17 | −0.02 (−0.1 to 0.1) | 0.08 (−0.1 to 0.1) | |
| Maintenance (telerehabilitation) following HIIT vs. no intervention | 12 months (data from graph) | time sedentary | 47 | mean 584 (SD 98) | 50 | mean 615 (SD 76) | −31 (−66 to 4) | |
| LIPA time | mean 157 (SD 44) | mean 113 (SD 44) | 44 (27 to 62) | |||||
| MPA time | mean 18 (SD 6) | mean 11 (SD 7) | 7 (4 to 10) | |||||
| "lifestyle" physical activity time | mean 41 (SD 16) | mean 34 (SD 16) | 7 (1 to 13) | |||||
| Maintenance (centre‐based) following HIIT vs. no intervention | time sedentary | 50 | mean 551 (SD 83) | 50 | 615 (SD 76) | −64 (−95 to −33) | ||
| LIPA time | mean 159 (SD 43) | 113 (SD 44) | 46 (29 to 63) | |||||
| MPA time | mean 22 (SD 7) | 11 (SD 7) | 11 (8 to 14) | |||||
| "lifestyle" physical activity time | mean 52 (SD 17) | 34 (SD 16) | 18 (12 to 25) | |||||
| Maintenance (telerehabilitation) vs. maintenance (centre‐based) following HIIT | time sedentary | 47 | mean 584 (SD 98) | 50 | mean 551 (SD 83) | 33 (−3 to 69) | ||
| LIPA time | mean 157 (SD 44) | mean 159 (SD 43) | −2 (−19 to 15) | |||||
| MPA time | mean 18 (SD 6) | mean 22 (SD 7) | −4 (−7 to −1) | |||||
| "lifestyle" physical activity time | mean 41 (SD 16) | mean 52 (SD 17) | −11 (−18 to −4) | |||||
| LAMA/LABA vs. placebo | 4 weeks | inactive (%) (< 6000 steps per day) | 127 | mean 41 | 123 | mean 55 | OR 0.27 (95% CI 0.1 to 0.5)* | |
| Physical activity counselling vs. PR | 6 weeks | step count (n) | 18 | mean 6021 (SD 2549) | 18 | mean 6113 (SD 2403) | −92 (−1710 to 1526) | |
| Ground‐based walking vs. no intervention | 8 weeks | time sedentary (% awake time) | 62 | mean 69 (SD 10) | 39 | mean 68 (SD 10) | −2 (−6 to 2)* | |
| LIPA time (% awake time) | mean 25 (SD 7) | mean 25 (SD 7) | 1 (−2 to 4)* | |||||
| MPA time (% awake time) | mean 7 (SD 5) | mean 7 (SD 5) | 1 (−2 to 4)* | |||||
| VPA time (% awake time) | mean 0 (SD 0) | mean 0 (SD 0) | 0 (0 to 0)* | |||||
| Physical activity counselling with pedometer vs. no intervention (following ground‐based walking training) | 12 months | ∆ total EE (kcal) | 23 | −75 (−156 to 6) | 20 | −80 (−166 to 5) | 17 (−131 to 164)* | |
| ∆ step count (n) | −157 (−753 to 439) | −1051 (−1687 to −424) | −617 (−1669 to 453)* | |||||
| ∆ time sedentary | −9 (−34 to 17) | −13 (−40 to 14) | −8 (−50 to 33)* | |||||
| ∆ LIPA time | 8 (−19 to 35) | −16 (−44 to 13) | −27 (−70 to 14)* | |||||
| ∆ MPA time | −11 (−23 to 1) | −1 (−13 to 12) | 20 (−1 to 41)* | |||||
| ∆VPA time | 0 (−1 to 1) | 0 (−1 to 1) | 0 (0 to 1)* | |||||
| * from paper ACE: angiotensin‐converting enzyme; ∆ change from baseline; cpm: counts per minute; "daily physical activity": step count + metabolic equivalents; EE: energy expenditure; ICS: inhaled corticosteroid; LABA: long‐acting beta2 agonist; LAMA: long‐acting muscarinic antagonist; LIPA: light‐intensity physical activity; MD: mean difference; METs: metabolic equivalents; MPA: moderate‐intensity physical activity; MVPA: moderate‐to‐vigorous intensity physical activity; n: number of participants; OR: odds ratio; PAL: physical activity level; PR: pulmonary rehabilitation; SPACE: self‐management programme of activity, coping and education; SD: standard deviation; VPA: vigorous‐intensity physical activity | ||||||||
| Population: people with COPD, clinical stability Intervention: pulmonary rehabilitation/exercise training Comparisons: intervention vs. another intervention Outcome: time in physical activity (of at least moderate intensity) at end intervention | ||||||
| Interventions | Outcome | Illustrative comparative risks* [mean difference (95% CI) unless indicated] | No of participants | Quality of the evidence | Comments | |
| Assumed risk | Corresponding risk | |||||
| Comparator | Intervention of interest | |||||
| Home‐based pulmonary rehabilitation vs. centre‐based pulmonary rehabilitation (8 weeks) | Change in time in MVPA | The mean change in time in the centre‐based group was 5 minutes per day | The mean difference was 6 (−19 to 31) minutes per day | 58 participants (1 study; Analysis 4.2) | ⊕⊕⊝⊝ | Baseline values: centre‐based median 79 (IQR 24 to 136), home‐based median 68 (IQR 29 to 121) |
| Calisthenics vs. exercise training (12 weeks) | Time in MVPA | The mean time in the exercise training group was 75 minutes per day | "no significant inter‐group differences in any variable" | 40 participants (1 study; Probst 2011; Table 1) | ⊕⊕⊝⊝ | ‐ |
| Physical activity counselling vs. pulmonary rehabilitation (6 to 12 weeks) | Change in time in MVPA | The mean change in time in the pulmonary rehabilitation group was 1 (−3 to 5) minutes per day | The mean difference was 6 (−10 to 22) minutes per day | 26 participants (1 study; O'Neill 2018; Table 1) | ⊕⊕⊝⊝ | Baseline values: pulmonary rehabilitation mean 15 (SD 5), physical activity counselling mean 14 (SD 15) |
| Telerehabilitation maintenance programme vs. centre‐based maintenance programme (following high‐intensity interval training, 12 months) | Time in moderate‐intensity physical activity | The mean time in the centre‐based group was 22 minutes per day | The mean difference was −4 (−7 to −1) minutes per day | 97 participants (1 study; Vasilopoulou 2017; Table 1) | ⊕⊕⊕⊝ moderatec | ‐ |
| *The basis for the assumed risk (e.g. the median control group risk across studies) is provided in footnotes. The corresponding risk (and its 95% confidence interval) is based on the assumed risk in the comparison group and the relative effect of the intervention (and its 95% CI). | ||||||
| GRADE Working Group grades of evidence | ||||||
| aDowngraded one level for high risk of performance bias. Downgraded one level for imprecision as CI does not exclude possibility of no effect. bDowngraded one level for unclear risk of selection, performance, detection, attrition and other potential bias. Downgraded one level for imprecision as CI does not exclude possibility of no effect. | ||||||
| Population: people with COPD, clinical stability Intervention: physical activity counselling Comparisons: intervention vs. no intervention, intervention in addition to a standard intervention common to both groups Outcome: time in physical activity (of at least moderate intensity) at end intervention | ||||||
| Interventions | Outcome | Illustrative comparative risks* [mean difference (95% CI) unless indicated] | Number of participants (studies) | Quality of the evidence | Comments | |
| Assumed risk | Corresponding risk | |||||
| Comparator | Intervention of interest | |||||
| Comparison: intervention vs. no intervention | ||||||
| Physical activity counselling vs. no intervention (12 weeks) | Change in time in MVPA | The mean change in time was −3 (−0.6 to 0.2) minutes per day | The mean difference was 11 (7 to 15) minutes per day | 280 participants (1 study; Demeyer 2017; Table 1) | ⊕⊕⊕⊝ moderatea | Baseline values: no intervention median 15 (IQR 5 to 35), intervention median 14 (IQR 5 to 26) |
| Physical activity counselling vs. no intervention (following pulmonary rehabilitation, 12 months) | Change in time in moderate intensity physical activity | The mean change was −1 (−13 to 12) minutes per day | The mean difference was 20 (−1 to 41) minutes per day | 43 participants (1 study; Wootton 2017; Table 1) | ⊕⊕⊝⊝ | Baseline values: no intervention mean 51 (SD 49), intervention mean 59 (SD 52) |
| Comparison: intervention in addition to a standard intervention common to both groups | ||||||
| Physical activity counselling with pulmonary rehabilitation vs. pulmonary rehabilitation (6 months) | Time in MVPA | The mean time in the pulmonary rehabilitation group was 28 minutes per day | The mean difference was 24 (2 to 45) minutes per day | 26 participants (1 study; Analysis 3.21) | ⊕⊕⊕⊝ moderatec | P = 0.03 |
| Change in time in MVPA | The median change in time in the pulmonary rehabilitation group was 12 minutes per day | The median change in time was 2 (−12 to 25) minutes per day | 113 participants (1 study; Nolan 2017; Table 1) | ⊕⊕⊝⊝ | P = 0.16 Baseline values: no intervention median 47 (IQR 18 to 103), intervention median 45 (IQR 20 to 81) | |
| Physical activity counselling with pulmonary rehabilitation vs. sham intervention with pulmonary rehabilitation (6 months) | Change in time in MVPA | The mean change in time in the pulmonary rehabilitation group was 0 minutes per day | The mean difference was −6 (−16 to 3) minutes per day | 50 participants (1 study; Analysis 3.25) | ⊕⊝⊝⊝ | Baseline values: no intervention median 29 (IQR 17 to 44), intervention median 33 (IQR 16 to 47) |
| *The basis for the assumed risk (e.g. the median control group risk across studies) is provided in footnotes. The corresponding risk (and its 95% confidence interval) is based on the assumed risk in the comparison group and the relative effect of the intervention (and its 95% CI). | ||||||
| GRADE Working Group grades of evidence | ||||||
| aDowngraded one level for high risk of performance bias and detection bias. | ||||||
| Population: people with COPD, clinical stability Intervention: self‐management Comparisons: intervention vs. no intervention, intervention in addition to a standard intervention common to both groups, intervention vs. another intervention Outcome: time in physical activity (of at least moderate intensity) at end intervention | ||||||
| Interventions | Outcome | Illustrative comparative risks* [mean difference (95% CI) unless indicated] | Number of participants (studies) | Quality of the evidence | Comments | |
| Assumed risk | Corresponding risk | |||||
| Comparator | Intervention of interest | |||||
| Comparison: intervention vs. no intervention | ||||||
| Self‐management vs. no intervention (12 months) | Time in MVPA | The mean time was 316 minutes a week | The mean difference was 12 (−21 to 45) minutes a week | 411 participants (1 study; Jolly 2018; Table 1) | ⊕⊕⊝⊝ | P = 0.48 |
| Comparison: intervention in addition to a standard intervention common to both groups | ||||||
| Self‐efficacy training with upper limb exercise vs. education with upper limb exercise (16 weeks) | Time in moderate‐intensity physical activity | The mean time in the education and upper‐limb exercise group was 4 minutes per day | The mean difference was 2 (−1 to 5) minutes per day | 35 participants (1 study; Larson 2014; Table 1) | ⊕⊕⊝⊝ | ‐ |
| Comparison: intervention vs. another intervention | ||||||
| Self‐management vs. education and symptom monitoring (16 weeks) | Time in moderate‐intensity physical activity | The mean time in the self‐management group was 6 minutes per day | The mean difference was 1 (−1 to 2) minutes per day | 326 participants (1 study; Blumenthal 2014; Table 1) | ⊕⊕⊝⊝ | ‐ |
| *The basis for the assumed risk (e.g. the median control group risk across studies) is provided in footnotes. The corresponding risk (and its 95% confidence interval) is based on the assumed risk in the comparison group and the relative effect of the intervention (and its 95% CI). | ||||||
| GRADE Working Group grades of evidence | ||||||
| aDowngraded one level for high risk of performance bias. Downgraded one level for imprecision as CI does not exclude possibility of no effect. | ||||||
| Population: people with COPD, clinical stability Intervention: pharmacological interventions Comparisons: intervention vs. placebo, intervention in addition to a standard intervention common to both groups Outcome: time in physical activity (of at least moderate intensity) at end intervention | ||||||
| Interventions | Outcome | Illustrative comparative risks* [mean difference (95% CI) unless indicated] | Number of participants (studies) | Quality of the evidence | Comments | |
| Assumed risk | Corresponding risk | |||||
| Comparator | Intervention of interest | |||||
| Comparison: intervention vs. sham/placebo intervention | ||||||
| LAMA vs. placebo (3 weeks) | Change in time in MVPA | The median change in time was −6 minutes per day | The median change in time was −1 (IQR −17 to 24) minutes per day | 131 participants (2 studies; Beeh 2014; Magnussen 2017; Table 1) | ⊕⊕⊕⊝ moderatea | P = 0.07 Baseline values: Beeh 2014 placebo median 73 (IQR 38 to 135), LAMA median 74 (IQR 32 to 132) Magnussen 2017 placebo mean 88 (SD 65), intervention mean 57 (SD 32) |
| LAMA/LABA vs. placebo (3 to 4 weeks) | Change in time in MVPA | The mean change in time ranged from −16 to −1 minutes per day | The mean difference was 10 (4 to 15) minutes per day | 423 participants (2 studies; Analysis 2.3) | ⊕⊕⊕⊕ high | Baseline values: Watz 2016 placebo mean 130, LAMA/LABA mean 125 |
| Comparison: intervention in addition to a standard intervention common to both groups | ||||||
| LAMA with behaviour modification vs. placebo with behaviour modification (12 weeks to 6 months) | Time in MVPA | The mean time was 64 minutes per day | The mean difference was 8 minutes per day | 426 participants (1 study; Troosters 2014; Table 1) | ⊕⊕⊕⊝ moderateb | P = "not statistically significantly different" |
| *The basis for the assumed risk (e.g. the median control group risk across studies) is provided in footnotes. The corresponding risk (and its 95% confidence interval) is based on the assumed risk in the comparison group and the relative effect of the intervention (and its 95% CI). | ||||||
| GRADE Working Group grades of evidence | ||||||
| aDowngraded one level for imprecision as results do not exclude possibility of no effect. | ||||||
| Comparison | Description of intervention(s) | OUTCOMES | ||||
| Physical activity | Health‐related quality of life | Exercise capacity | Adherence | Adverse events | ||
| TYPE OF INTERVENTION: Pulmonary rehabilitation/exercise training | ||||||
| Clinically stable | ||||||
| Intervention vs. no intervention | Pulmonary rehabilitation vs. no intervention | Y | Y | Y | N | |
| Y | Y | N | N | |||
| Y | Y | Y | Y | |||
| Y | Y | Y | Y | |||
| High‐intensity interval training vs. no intervention | Y | Y | N | N | ||
| Y | Y | Y | Y | |||
| Maintenance (telerehabilitation) following high‐intensity interval training vs. no intervention | ||||||
| Maintenance (centre‐based) following high‐intensity interval training vs. no intervention | ||||||
| Intervention in addition to an intervention common to both groups | Nordic walking with education vs. education | Y | Y | Y | Y | |
| Structure exercise training (COPE‐active) with self‐management vs. self management | Y | Y | Y | Y | ||
| Upper limb exercises with education vs. education | N | N | N | N | ||
| Exercise training and LABA with LAMA and behavioural modification vs. LAMA and behavioural modification | Y | Y | Y | Y | ||
| Exercise training with LAMA/LABA and behavioural modification vs. LAMA/LABA and behavioural modification | ||||||
| Exercise training and LAMA/LABA with behavioural modification vs. placebo with behavioural modification | ||||||
| Exercise training and physical activity counselling with pedometer vs. pedometer | Y | Y | Y | N | ||
| Intervention vs. intervention | Web‐based pulmonary rehabilitation vs. centre‐based pulmonary rehabilitation | Y | Y | N | Y | |
| Exercise training (eccentric cycle training) vs. exercise training (concentric cycle training) | N | Y | N | N | ||
| Home‐based pulmonary rehabilitation vs. centre‐based pulmonary rehabilitation | Y | Y | Y | Y | ||
| Water‐based exercise training vs. land‐based exercise training | Y | Y | Y | Y | ||
| Tai Chi vs. pulmonary rehabilitation | Y | Y | Y | Y | ||
| Exercise training (callisthenics) vs. exercise training (endurance and strength training) | Y | Y | Y | N | ||
| Exercise training (outdoor walking) vs. exercise training (cycle ergometry) | Y | Y | N | Y | ||
| physical activity counselling vs. pulmonary rehabilitation | Y | Y | N | N | ||
| Y | Y | Y | Y | |||
| Exercise training with tapering supervision vs. supervised exercise training | Y | Y | Y | N | ||
| Adherence intervention vs. pulmonary rehabilitation | Y | Y | Y | N | ||
| Maintenance following high‐intensity interval training: telerehabilitation vs. centre‐based | Y | Y | Y | N | ||
| Acute | ||||||
| Intervention vs. no intervention | Exercise training vs. no intervention | N | Y | Y | N | |
| Y | Y | Y | Y | |||
| TYPE OF INTERVENTION: Physical activity counselling | ||||||
| Clinically stable | ||||||
| Intervention vs. no intervention | Physical activity counselling vs. no intervention | N | N | Y | N | |
| Y | Y | N | Y | |||
| Y | Y | N | Y | |||
| Y | Y | Y | Y | |||
| Y | Y | Y | Y | |||
| N | N | N | N | |||
| Y | Y | Y | Y | |||
| Intervention in addition to an intervention common to both groups | Physical activity counselling with optional supervised exercise vs. optional supervised exercise | Y | N | Y | N | |
| Y | Y | Y | N | |||
| Pedometer with physical activity counselling vs. physical activity counselling | Y | Y | Y | N | ||
| Physical activity counselling with pedometer vs. pedometer | Y | N | N | Y | ||
| N | Y | Y | Y | |||
| Y | Y | Y | Y | |||
| Y | N | Y | Y | |||
| Pedometer with pulmonary rehabilitation: aware vs. unaware of purpose of pedometer | N | N | N | N | ||
| Physical activity counselling with pulmonary rehabilitation vs. pulmonary rehabilitation | Y | Y | N | N | ||
| Y | Y | Y | N | |||
| Y | Y | N | N | |||
| Y | Y | Y | N | |||
| Y | Y | Y | Y | |||
| Y | Y | Y | Y | |||
| Y | Y | N | N | |||
| Physical activity counselling with pulmonary rehabilitation vs. sham intervention with pulmonary rehabilitation | Y | Y | Y | N | ||
| Acute | ||||||
| Intervention vs. no intervention | Physical activity counselling vs. no intervention | Y | Y | N | Y | |
| Feedback and education vs. no intervention | Y | N | Y | Y | ||
| Education vs. no intervention | ||||||
| Intervention in addition to an intervention common to both groups | Feedback with education vs. education | |||||
| TYPE OF INTERVENTION: Self‐management | ||||||
| Clinically stable | ||||||
| Intervention vs. no intervention | Self‐management vs. no intervention | Y | Y | N | Y | |
| Y | Y | Y | N | |||
| Y | N | Y | Y | |||
| Intervention vs. sham/placebo intervention | Self‐management (health mentoring) vs. sham | Y | N | Y | Y | |
| Intervention in addition to an intervention common to both groups | Self‐efficacy training with upper limb exercises vs. education with upper limb exercises | N | N | N | N | |
| Intervention vs. intervention | Self‐management (coping skills training) vs. education and symptom monitoring | Y | Y | Y | Y | |
| Acute | ||||||
| Intervention vs. no intervention | Self‐management (SPACE) vs. no intervention | N | Y | N | N | |
| Intervention in addition to an intervention common to both groups | Self‐management (health coaching) with pulmonary rehabilitation referral vs. pulmonary rehabilitation referral | Y | N | Y | Y | |
| TYPE OF INTERVENTION: Pharmacological treatments | ||||||
| Clinically stable | ||||||
| Intervention vs. sham/placebo intervention | LAMA vs. placebo | N | Y | N | Y | |
| Y | N | N | Y | |||
| Y | Y | N | Y | |||
| LAMA/LABA vs. placebo | N | N | Y | Y | ||
| N | Y | N | Y | |||
| Intervention in addition to an intervention common to both groups | LAMA with behavioural modification vs. placebo with behavioural modification | N | N | Y | Y | |
| Y | Y | Y | Y | |||
| LAMA/LABA with behavioural modification vs. placebo with behavioural modification | Y | Y | Y | Y | ||
| LABA with LAMA and behavioural modification vs. LAMA and behavioural modification | ||||||
| ACE inhibitor with pulmonary rehabilitation vs. placebo with pulmonary rehabilitation | Y | Y | Y | Y | ||
| Intervention vs. intervention | ICS and LABA vs. ICS and LABA | Y | N | N | Y | |
| LAMA vs. LAMA | Y | N | Y | Y | ||
| TYPE OF INTERVENTION: Nutritional supplementation | ||||||
| Clinically stable | ||||||
| Intervention vs. no intervention | Nutritional supplement vs. no intervention | N | N | Y | N | |
| Intervention vs. sham/placebo intervention | Nutritional supplement vs. placebo | Y | N | N | N | |
| Intervention in addition to an intervention common to both groups | Nutritional supplement with pulmonary rehabilitation vs. placebo with pulmonary rehabilitation | Y | Y | Y | Y | |
| Nutritional supplement with physical activity counselling vs. physical activity counselling | ||||||
| Acute | ||||||
| Intervention in addition to an intervention common to both groups | Enriched nutritional supplement with inpatient pulmonary rehabilitation vs. nutritional supplement with inpatient pulmonary rehabilitation | Y | N | N | N | |
| TYPE OF INTERVENTION: Supplemental oxygen | ||||||
| Clinically stable | ||||||
| Intervention vs. sham/placebo intervention | Supplemental oxygen vs. placebo (air) | Y | Y | Y | Y | |
| Intervention in addition to an intervention common to both groups | Supplemental oxygen with exercise training vs. sham with exercise training | Y | Y | Y | Y | |
| Intervention vs. intervention | Supplemental oxygen (lightweight ambulatory) vs. supplemental oxygen (E‐cylinder) | N | N | Y | Y | |
| TYPE OF INTERVENTION: Other interventions | ||||||
| Clinically stable | ||||||
| Intervention vs. no intervention | Four‐wheeled walker vs. no intervention | Y | N | N | N | |
| Endobronchial valve surgery vs. no intervention | Y | Y | N | Y | ||
| Intervention vs. sham/placebo intervention | Singing vs. sham | Y | Y | Y | N | |
| Neuromuscular electrical stimulation vs. placebo | Y | Y | Y | Y | ||
| Intervention in addition to an intervention common to both groups | Non‐invasive ventilation with pulmonary rehabilitation vs. pulmonary rehabilitation | Y | Y | Y | Y | |
| Inspiratory muscle training with pulmonary rehabilitation vs. sham with pulmonary rehabilitation | Y | Y | Y | N | ||
| ACE: angiotensin‐converting enzyme; ICS: inhaled corticosteroid; LABA: long‐acting beta2 agonist; LAMA: long‐acting muscarinic antagonist; SPACE: self‐management programme of activity, coping and education | ||||||
| Study | Comparison (setting, if known) Clinical stability unless indicated | Timepoint (end intervention unless indicated) | Outcome (score unless indicated) | Intervention group | Comparison group | Between‐group MD (95% CI) where available unless indicated | ||
| n | mean (95% CI) unless indicated | n | mean (95% CI) unless indicated | |||||
| Physical activity counselling vs. no intervention (primary care) | 12 weeks | ∆ CRQ total | 22 | median 2 (IQR −3 to 7) | 18 | median 5 (IQR −3 to 15) | P = 0.398* | |
| ∆ CCQ total | median −0.1 (IQR −0.4 to 0.1) | median −0.1 (IQR −0.4 to 0.3) | P = 0.606* | |||||
| follow‐up (12 months post‐intervention) | ∆ CRQ total | 20 | median 2 (IQR −3 to 14) | 18 | median 13 (IQR −1 to 15) | P = 0.278* | ||
| ∆ CCQ total | median −0.1 (IQR −0.5 to 0.3) | median −0.2 (IQR −0.5 to 0.1) | P = 0.536* | |||||
| Physical activity counselling vs. no intervention (secondary care) | 12 weeks | ∆ CRQ total | 21 | median 2 (IQR −6 to 11) | 22 | median −9 (IQR −14 to 1) | P = 0.006* | |
| ∆ CCQ total | median 0.0 (IQR −0.6 to 0.4) | median 0.1 (IQR −0.2 to 0.5) | P = 0.529* | |||||
| follow‐up (12 months post‐intervention) | ∆ CRQ total | 20 | median 6 (IQR −4 to 10) | 19 | median 1 (IQR −9 to 1) | P = 0.311* | ||
| ∆ CCQ total | median −0.1 (IQR −0.5 to 0.2) | median 0.2 (IQR −0.3 to 0.5) | P = 0.220* | |||||
| Physical activity counselling with PR vs. PR | 12 weeks | ∆ CRQ total | 22 | median 13 (IQR 3 to 20) | 15 | median 8 (IQR 2 to 21) | P = 0.910* | |
| ∆ CCQ total | median −1 (IQR −1 to 0.2) | median −0.2 (IQR −1 to 0.0) | P = 0.345* | |||||
| follow‐up (12 months post‐intervention) | ∆ CRQ total | 10 | median −7 (IQR −16 to 1) | 13 | median −5 (IQR −14 to 2) | P = 0.344* | ||
| ∆ CCQ total | median 0.4 (IQR 0.1 to 1) | median 0.3 (IQR −0.2 to 0.7) | P = 0.368* | |||||
| Urban Training™ vs. no intervention | 12 months | CCQ total | 132 | mean 1 (SD 1) | 148 | mean 1 (SD 1) | 0.1 (−0.3 to 0.1)* | |
| CAT | mean 11 (7) | mean 11 (7) | 0.1 (−1.1 to 1.2)* | |||||
| Physical activity counselling with pedometer vs. pedometer | 12 weeks | ∆ CAT | 49 | x | 50 | x | x | |
| ∆ SGRQ | ||||||||
| Self‐management vs. education and symptom monitoring | 16 weeks | PQLS | 162 | mean 83 (SE 1) | 164 | mean 81 (SE 1) | P = 0.04* | |
| SGRQ | mean 44 (SE 1) | mean 42 (SE 1) | P = 0.068* | |||||
| Web‐based PR vs. centre‐based PR | 7 weeks | ∆ CRQ dyspnoea domain | 22 | 0.7 (0.2 to 1.2) | 40 | 0.8 (0.8 to 0.8) | −0.1 (−0.7 to 0.5) | |
| Inspiratory muscle training with PR vs. sham with PR | 12 weeks (total n = 150) | CRQ dyspnoea domain | x | mean 20 (SD 6) | x | mean 19 (SD 7) | 0.4 (−1.1 to 2.0)* | |
| CRQ emotional function domain | mean 35 (SD 9) | mean 35 (SD 8) | −0.4 (−2.4 to 1.6)* | |||||
| CRQ mastery domain | mean 21 (SD 5) | mean 19 (SD 5) | 0.01 (−1.2 to 1.2)* | |||||
| CRQ fatigue domain | mean 19 (SD 5) | mean 18 (SD 5) | 0.4 (−0.8 to 1.6)* | |||||
| CRQ total | mean 94 (SD 23) | mean 92 (SD 22) | −1.0 (−5.2 to 3.9)* | |||||
| ACE inhibitor with PR vs. placebo with PR | 10 weeks | ∆ CAT | 31 | mean 1 (SD 4) | 34 | mean −1 (SD 3) | 2 (0 to 4) | |
| Nutritional supplementation vs. placebo | 12 weeks | SGRQ total | 44 | mean 69 (SD 10) | 44 | mean 73 (SD 7) | P < 0.001* | |
| Physical activity counselling vs. no intervention | 12 weeks | ∆ CAT** | 140 | 0 (−1 to 1) | 139 | 1 (0 to 2) | −1 (−2 to 1)** | |
| Non‐invasive ventilation with PR vs. PR | 12 weeks | MRF total (%) | 24 | mean 45 (SD 22) | 32 | mean 52 (SD 24) | −10 (−18 to 1)* | |
| MRF daily activities domain (%) | mean 53 (SD 29) | mean 57 (SD 27) | −5 (−17 to 6)* | |||||
| MRF cognition domain (%) | mean 28 (SD 25) | mean 41 (SD 38) | −22 (−35 to −9)* | |||||
| MRF invalidity domain (%) | mean 57 (SD 33) | mean 62 (SD 36) | −6 (−19 to 7)* | |||||
| SRI respiratory complaints domain (%) | mean 58 (SD 13) | mean 52 (SD 17) | 6 (−1 to 12)* | |||||
| SRI physical functioning domain (%) | mean 41 (SD 21) | mean 42 (SD 18) | −2 (−10 to 5)* | |||||
| SRI attendant symptoms and sleep domain (%) | mean 71 (SD 16) | mean 60 (SD 20) | 7 (−1 to 15)* | |||||
| SRI social relationships domain (%) | mean 65 (SD 13) | mean 66 (SD 14) | 1 (−6 to 8)* | |||||
| SRI anxiety domain (%) | mean 63 (SD 17) | mean 57 (SD 22) | 3 (−5 to 11)* | |||||
| SRI well‐being domain (%) | mean 68 (SD 14) | mean 59 (SD 19) | 4 (−3 to 11)* | |||||
| SRI social functioning domain (%) | mean 54 (SD 16) | mean 54 (SD 18) | 1 (−6 to 9)* | |||||
| SRI summary (%) | mean 60 (SD 11) | mean 56 (SD 15) | 3 (−2 to 8)* | |||||
| Endobronchial valve surgery vs. no intervention | 6 months post‐surgery | ∆ SGRQ total | 19 | mean −16 (SD 16) | 24 | mean −3 (SD 9) | MD −13 (SD 4), P = 0.0005* | |
| Physical activity counselling vs. no intervention | 4 weeks | ∆ CAT | 12 | median −3 (IQR −10 to 1) | 15 | median −5 (IQR −7 to 1) | P = 0.78 | |
| Physical activity counselling with PR vs. PR | 12 weeks | ∆ CRQ dyspnoea domain | 25 | x | 25 | x | MD 3 (SE 1), P = 0.04* | |
| 9 months (follow‐up) | MD 3 (SE 2), P = 0.08* | |||||||
| Singing vs. sham | 8 weeks | ∆ CAT | 13 | −1 (−6 to 4) | 11 | 1 (−3 to 5) | −2 (−7 to 4) | |
| High‐intensity interval training vs. no intervention | 12 weeks | CRQ total | 85 | mean 98.4 (SD 21.6) | 43 | mean 89.1 (SD 26.1) | 9.3 (0.3 to 18.4) | |
| CCQ total | mean 2 (SD 1) | mean 2 (SD 1) | −1 (−1 to −0) | |||||
| LAMA vs. placebo | 3 weeks | ∆ CAT | 15 | −2 (−4 to 0) | 15 | −1 (−2 to 1) | 1 (−1 to 4)** | |
| Physical activity counselling with PR vs. PR | 12 weeks | CAT | 22 | median 16 (IQR 8 to 20) | 22 | x | x | |
| Pedometer with physical activity counselling vs. physical activity counselling | 12 weeks | ∆ SGRQ total | 50 | −9 (−12 to −5) | 47 | −4 (−7 to −1) | −5 (−10 to −0.4) | |
| ∆ CAT | −4 (−5 to −2) | −1 (−3 to 1) | −3 (−5 to −1) | |||||
| LAMA (aclidinium bromide) vs. LAMA (tiotropium) | 8 weeks | SGRQ activity domain | 22 | x | 22 | x | P < 0.05* | |
| LAMA vs. placebo | 12 weeks | CRQ | 123 | x | 125 | x | "no significant differences between treatments and the improvement was less than 0.5" | |
| ICS (beclomethasone) with LABA (formoterol) vs. ICS (budesonide) with LABA (formoterol) | 16 weeks (4‐week run‐in, 12‐week intervention) | ∆ CCQ | 30 | mean 0.1 (SD 0.5) | 29 | mean 0.1 (SD 0.5) | 0.01 (−0.24 to 0.26) | |
| Physical activity counselling with PR vs. PR | 8 weeks (mid‐intervention, post‐PR) | ∆ CRQ fatigue domain | 63 | median 2.0 (IQR 0 to 5.0) | 59 | median 4.0 (IQR 2.0 to 6.0) | P = 0.008* | |
| ∆ CRQ emotional function domain | 3.1 (1.9 to 4.4) | 5.3 (3.3 to 7.3) | −2.2 (−4.5 to 0.1) | |||||
| ∆ CRQ mastery domain | 1.8 (1.0 to 2.7) | 3.4 (2.1 to 4.7) | −1.6 (−3.1 to −0.1) | |||||
| ∆ CRQ total | median 11 (IQR 3 to 20) | median 20 (IQR 8 to 27) | P = 0.008* | |||||
| 6 months | ∆ CRQ fatigue domain | 56 | 1 (−0.3 to 2) | 57 | 2 (0.7 to 3.4) | −1.0 (−2.8 to 0.8) | ||
| ∆ CRQ emotion domain | median 0.5 (IQR −3 to 4) | 2 (−1 to 6) | P = 0.12* | |||||
| ∆ CRQ mastery | median 0.5 (IQR −1 to 3) | 2 (−2 to 5) | P = 0.29* | |||||
| ∆ CRQ total | median 3 (IQR −8 to 16) | 10 (−2 to 19) | P = 0.07* | |||||
| Physical activity counselling vs. PR | 12 weeks physical activity counselling, 6 weeks PR | ∆ CAT | 17 | 0.6 (95% CI −3.3 to 4.6) | 19 | −0.4 (−3.5 to 2.7) | 1.1 (−3.6 to 5.7) | |
| ∆ EQ5D index | 18 | −0.0 (95% CI −0.1 to 0.1) | 0.1 (0.0 to 0.2) | −0.10 (−0.22 to 0.01) | ||||
| ∆ EQ5D visual analogue scale | 2.6 (95% CI −14.9 to 20.1) | 13.3 (−0.9 to 27.4) | −10.7 (−31.7 to 10.3) | |||||
| Feedback and education vs. no intervention | 14 days | CAT | 8 | 22 (5) | 6 | 24 (11) | −2 (−12 to 7) | |
| Education vs. no intervention | 3 | 23 (14) | 6 | 24 (11) | −1 (−19 to 17) | |||
| Feedback with education vs. education | 8 | 22 (5) | 3 | 23 (14) | −1 (−17 to 15) | |||
| Enriched nutritional supplement with inpatient PR vs. nutritional supplement with inpatient PR | hospital discharge | CAT | 24 | median 10 (range 2 to 27) | 21 | 10 (3 to 28) | P = 0.75* | |
| Exercise training (callisthenics) vs. exercise training (endurance and strength training) | 12 weeks | SGRQ | 20 | mean 47 (SD 12) | 20 | mean 39 (SD 21) | P = 0.37* | |
| Supplemental oxygen vs. placebo (air) | 8 weeks | CRQ dyspnoea domain | 10 | median 2.2 (IQR 1.8 to 3) | 10 | median 2.5 (IQR 1.5 to 3.2) | P > 0.05* | |
| CRQ emotional function domain | median 4.8 (IQR 3.2 to 5.7) | median 3.8 (IQR 2.6 to 5.6) | ||||||
| CRQ mastery domain | median 5.1 (IQR 3.2 to 5.9) | median 3.6 (IQR 2.3 to 5.0) | ||||||
| CRQ fatigue domain | median 3.4 (IQR 2.8 to 4.8) | median 3.3 (IQR 1.8 to 4.3) | ||||||
| SF36 | x | x | "no significant changes in the SF36"* | |||||
| Self‐management (health mentoring) vs. sham | 6 months (mid‐intervention)** | SGRQ total | 59 | median 39 (IQR 23 to 54) | 81 | median 37 (IQR 29 to 58) | P = 0.439* | |
| SGRQ symptoms domain | median 54 (IQR 32 to 79) | median 51 (IQR 37 to 72) | P = 0.226* | |||||
| SGRQ activities domain | median 54 (IQR 31 to 79) | median 55 (IQR 42 to 73) | P = 0.901* | |||||
| SGRQ impacts domain | median 26 (IQR 14 to 43) | median 27 (IQR 12 to 44) | P = 0.188* | |||||
| SF36 physical function domain | median 39 (IQR 30 to 47) | 82 | median 36 (IQR 26 to 47) | P = 0.212* | ||||
| SF36 role physical domain | median 46 (IQR 40 to 53) | median 46 (IQR 39 to 53) | P = 0.166* | |||||
| SF36 bodily pain domain | median 52 (IQR 38 to 63) | median 51 (IQR 38 to 63) | P = 0.205* | |||||
| SF36 general health domain | median 37 (IQR 30 to 44) | median 37 (IQR 29 to 46) | P = 0.696* | |||||
| SF36 vitality domain | median 47 (IQR 41 to 53) | median 47 (IQR 41 to 53) | P = 0.586* | |||||
| SF36 social functioning domain | median 52 (IQR 41 to 57) | median 52 (IQR 41 to 57) | P = 0.137* | |||||
| SF36 role emotional domain | median 47 (IQR 40to 55) | median 47 (IQR 40 to 55) | P = 0.088* | |||||
| SF36 mental health domain | median 50 (IQR 41 to 58) | median 50 (IQR 41 to 58) | P = 0.808* | |||||
| SF36 physical component | median 41 (IQR 33 to 48) | median 38 (IQR 32 to 47) | P = 0.917* | |||||
| SF36 mental component | median 52 (IQR 43 to 58) | median 50 (IQR 40 to 58) | P = 0.222* | |||||
| 12 months** | SGRQ total | 65 | median 42 (IQR 27 to 56) | 79 | median 41 (IQR 26 to 52) | P = 0.484* | ||
| SGRQ symptoms domain | median 57 (IQR 33 to 71) | median 47 (IQR 35 to 69) | P = 0.253* | |||||
| SGRQ activity domain | median 60 (IQR 42 to 73) | median 55 (IQR 42 to 70) | P = 0.468* | |||||
| SGRQ impacts domain | median 30 (IQR 13 to 40) | median 26 (IQR 14 to 41) | P = 0.669* | |||||
| SF36 physical function domain | 63 | median 36 (IQR 28 to 45) | median 36 (IQR 30 to 45) | P = 0.599* | ||||
| SF36 role physical domain | median 44 (IQR 39 to 51) | median 46 (IQR 40 to 53) | P = 0.354* | |||||
| SF36 bodily pain domain | median 52 (IQR 42 to 63) | median 47 (IQR 38 to 63) | P = 0.392* | |||||
| SF36 general health domain | median 36 (IQR 31 to 46) | median 38 (IQR 31 to 46) | P = 0.476* | |||||
| SF36 vitality domain | median 47 (IQR 38 to 56) | median 50 (IQR 44 to 56) | P = 0.560* | |||||
| SF36 social functioning domain | median 52 (IQR 41 to 57) | median 52 (IQR 41 to 57) | P = 0.812* | |||||
| SF36 role emotional domain | median 53 (IQR 37 to 55) | median 50 (IQR 40 to 55) | P = 0.993* | |||||
| SF36 mental health domain | median 50 (IQR 44 to 58) | median 50 (IQR 41 to 58) | P = 0.690* | |||||
| SF36 physical component | median 40 (IQR 29 to 47) | median 39 (IQR 32 to 46) | P = 0.998* | |||||
| SF36 mental component | median 52 (IQR 44 to 60) | median 52 (IQR 42 to 59) | P = 0.941* | |||||
| Adherence intervention vs. PR | 6 months (follow‐up) | SF36 physical component | 32 | mean 31 (SD 8) | 31 | mean 31 (SD 10) | 0 (−4 to 5) | |
| SF36 mental component | mean 52 (SD 12) | mean 52 (SD 10) | 0 (−6 to 6) | |||||
| CCQ | mean 3 (SD 1) | mean 3 (SD 1) | 0.1 (−0.5 to 0.7) | |||||
| Physical activity counselling with optional supervised exercise vs. optional supervised exercise | 4 weeks | ∆ CCQ total | 14 | −0.3 (−0.6 to −0.01) | 15 | 0 (−0.3 to 0.3) | −0.3 (−0.7 to 0.1)* | |
| PR (telerehabilitation) vs. no intervention | 8 weeks | ∆ CAT | 19 | −1 (−4 to 2) | 17 | 3 (1 to 5) | −3 (−7 to 0)* | |
| Maintenance (telerehabilitation) vs. no intervention | 12 months | SGRQ total | 47 | mean 38 (SD 21) | 50 | mean 50 (SD 18) | −12 (−19 to −4) | |
| CAT | mean 13 (SD 7) | mean 21 (SD 7) | −8 (−11 to −5) | |||||
| Maintenance (centre‐based) vs. no intervention | SGRQ total | 50 | mean 34 (SD 17) | 50 | mean 50 (SD 18) | −16 (−23 to −10) | ||
| CAT | mean 12 (SD 6) | mean 21 (SD 7) | −9 (−12 to −7) | |||||
| Maintenance (telerehabilitation) vs. maintenance (centre‐based) | SGRQ total | 47 | mean 38 (SD 21) | 50 | mean 34 (SD 17) | 5 (−3 to 12) | ||
| CAT | mean 13 (SD 7) | mean 12 (SD 6) | 1 (−2 to 4) | |||||
| Physical activity counselling vs. PR | 6 weeks | CAT | 18 | mean 11 (SD 5) | 18 | mean 9 (SD 3) | 2 (−1 to 4) | |
| * from paper ACE: angiotensin‐converting enzyme; CAT: COPD assessment test; ∆: change from baseline; CCQ: clinical COPD questionnaire; CRQ: chronic respiratory disease questionnaire; EQ5D: EuroQol 5 dimensions questionnaire; ICS: inhaled corticosteroid; IQR: interquartile range; LAMA: long‐acting muscarinic antagonist; MRF: Maugeri respiratory failure questionnaire; MD: mean differences; n: number of participants; PQLS: pulmonary‐specific quality of life scale; RAND36: Dutch translation of SF36 questionnaire; SF36: Medical Outcomes Survey 36‐item short‐form health survey questionnaire; SGRQ: St George's respiratory questionnaire; SRI: severe respiratory insufficiency questionnaire | ||||||||
| Study | Comparison (setting, if known) Clinical stability unless indicated | Time point (end intervention unless indicated) | Outcome | Intervention group | Comparison group | Between‐group MD (95% CI) where available unless indicated | ||
| n | mean (95% CI) unless indicated | n | mean (95% CI) unless indicated | |||||
| Physical activity counselling vs. no intervention (primary care) | 12 weeks | ∆ 6MWD (m) | 22 | median 10 (IQR −7 to 38) | 18 | median 3 (IQR −18 to 22) | P = 0.291* | |
| follow‐up (12 months post‐intervention) | 20 | median 20 (IQR 8 to 54) | 18 | median 13 (IQR −2 to 38) | P = 0.313* | |||
| Physical activity counselling vs. no intervention (secondary care) | 12 weeks | 21 | median 23 (IQR 0 to 51) | 22 | median 4 (IQR −32 to 27) | P = 0.049* | ||
| follow‐up (12 months post intervention) | 20 | median 25 (IQR 4 to 52) | 19 | median 17 (IQR −9 to 57) | P = 0.555* | |||
| Physical activity counselling with PR vs. PR | 12 weeks | 22 | median 17 (IQR −27 to 42) | 15 | median 25 (IQR −15 to 60) | P = 0.605* | ||
| follow‐up (12 months post intervention) | 10 | median 7 (IQR −32 to 51) | 13 | median 10 (IQR −15 to 87) | P = 0.503* | |||
| Urban Training™ vs. no intervention | 12 months | 6MWD (m) | 132 | 488 (106) | 148 | 493 (90) | −2 (−11 to 8)* | |
| LAMA vs. placebo | 3 weeks | ∆ endurance time (sec)** | 54 | median 26 (IQR −106 to 117) | 54 | median −16 (IQR −109 to 18) | P = 0.093* | |
| Self‐management vs. education and symptom monitoring | 16 weeks | 6MWD (m) | 162 | mean 361 (SE 3) | 164 | mean 351 (SE 3) | P = 0.03* | |
| Web‐based PR vs. centre‐based PR | 7 weeks | ∆ ESWT (sec) | 22 | 189 (95 to 283) | 40 | 185 (105 to 264) | 5 (−112 to 121) | |
| Inspiratory muscle training with PR vs. sham with PR | 12 weeks | 6MWD (m) n = 169 | x | mean 388 (SD 113) | x | mean 407 (SD 105) | 1 (−13 to 15)* | |
| endurance time (sec) n = 139 | mean 496 (SD 309) | mean 466 (SD 292) | 98 (17 to 179)* | |||||
| peak work rate (W) n = 92 | mean 64 (SD 26) | mean 59 (SD 22) | 5.2 (−0.4 to 10.8)* | |||||
| VO2peak (mL/min) n = 92 | mean 1048 (SD 313) | mean 966 (SD 323) | 0.01 (−0.1 to 0.1)* | |||||
| VEpeak (L/min) n = 92 | mean 37 (SD 11) | mean 39 (SD 15) | −1 (−3 to 2)* | |||||
| ACE inhibitor with PR vs. placebo with PR | 10 weeks | ∆ peak work rate (W) | 31 | 1 (−2 to 4) | 34 | 9 (5 to 13) | −8 (−13 to −3) | |
| ∆ VO2peak (mL/min/kg) | 0.3 (−0.4 to 1.1) | 1.4 (0.8 to 2.0) | −1.0 (−2.0 to −0.1) | |||||
| ∆ VE/VCO2 slope | −0.9 (−2.1 to 0.4) | −1.3 (−3.2 to 0.7) | 0.4 (−2.0 to 2.8) | |||||
| ∆ oxygen uptake efficiency slope (ml/min) | 29 (−109 to 167) | 151 (40 to 261) | −122 (−292 to 49) | |||||
| Physical activity counselling with PR vs. PR | 9 weeks | 2‐min step test (n steps) | 8 | 57 (32 to 82) | 8 | 55 (37 to 73) | 2 (−24 to 28) | |
| Physical activity counselling vs. no intervention | 12 weeks | ∆ 6MWD (m) | 131 | mean 12 (SD 44) | 136 | mean −1 (SD 44) | 13 (2 to 23) | |
| Non‐invasive ventilation with PR vs. PR | 12 weeks | ESWT (sec) | 24 | median 475 (IQR 295 to 1010) | 32 | 449 (213 to 1042) | 103 (−69 to 276)* | |
| 6MWD (m) | mean 340 (SD 119) | mean 325 (SD 108) | 2 (−19 to 23)* | |||||
| VO2peak (mL/min/kg) | mean 9.8 (SD 2.9) | mean 9.5 (SD 3.0) | 0.3 (−0.9 to 1.4)* | |||||
| Exercise training (outdoor walking) vs. exercise training (cycle ergometry) | 3 weeks | 6MWD (m) | 8 | mean 285 (SD 72) | 8 | mean 440 (SD 49) | −155 (−215 to −95) | |
| Endobronchial valve surgery vs. no intervention | 6 months post‐surgery | ∆ 6MWD (m) | 19 | mean 84 (SD 62) | 24 | mean −20 (SD 35) | MD 104 (SD 165)* | |
| Physical activity counselling vs. no intervention | 4 weeks | ∆ 6MWD (m) | 12 | mean 67 (SD 84) | 15 | mean 64 (SD 59) | 3 (−53 to 59) | |
| Physical activity counselling vs. no intervention | 12 weeks | 6MWD (m) | 18 | mean 387 (SD 47) | 17 | mean 361 (SD SD 67) | 26 (−12 to 64) | |
| Self‐management vs. no intervention (post‐admission) | 7 days | ∆ ISWD (m) | 15 | mean 46 (SD 32) | 10 | mean 44 (SD SD 99) | 2 (−62 to 66) | |
| ∆ ESWT (sec) | mean 369 (SD 355) | mean 290 (SD SD 379) | 80 (−216 to 375) | |||||
| Physical activity counselling with PR vs. PR | 12 months | 6MWD (m) | 12 | mean 445 (SD 138) | 15 | mean 467 (SD SD 151) | −22 (−131 to 87) | |
| Physical activity counselling with PR vs. PR | 12 weeks | ∆ 6MWD (m) | 25 | x | 25 | x | MD 8 (SE 14), P = 0.59* | |
| ∆ endurance time (sec) | MD −80 (SE 71), P = 0.26* | |||||||
| 9 months (follow‐up) | ∆ 6MWD (m) | MD 2 (SE 16), P = 0.90* | ||||||
| ∆ endurance time (sec) | MD 153 (SE 79), P = 0.06* | |||||||
| Singing vs. sham | 8 weeks | ∆ ISWD (m) | 13 | −7 (−35 to 21) | 11 | 15 (−11 to 40) | −22 (−56 to 12) | |
| High‐intensity interval training vs. no intervention | 12 weeks | VO2peak (mL/min/kg) | 85 | mean 17.8 (SD 4) | 43 | mean 15.5 (SD 4.1) | 2.3 (0.8 to 3.8) | |
| Physical activity counselling with PR vs. PR | 12 weeks | ∆ESWT (sec) | 22 | 99 (37 to 161) | 22 | 3 (−34 to 40) | 96 (28 to 164) | |
| Pedometer with PAI vs. PAI | 12 weeks | ∆6MWD (m) | 50 | mean 12 (SD 35) | 47 | mean −1 (SD 24) | 13 (1 to 25) | |
| LAMA vs. placebo | 12 weeks | 6MWD (m) | 123 | x | 125 | x | "trend favouring tiotropium" | |
| Physical activity counselling with pedometer vs. pedometer | 6 months | peak work rate (W) | 9 | mean 49 (SD 24) | 8 | mean 49 (SD 28) | 0 (−25 to 25) | |
| Pedometer with PR vs. PR | 8 weeks (mid‐intervention, post‐PR) | ∆ ISWD (m) | 63 | median 60 (IQR 20 to 90) | 59 | median 50 (IQR 10 to 90) | P = 0.83* | |
| 6 months | 56 | median 30 (IQR 0 to 70) | 57 | median 10 (IQR −30 to 70) | P = 0.25* | |||
| Physical activity counselling vs. PR | 12 weeks physical activity counselling, 6 weeks PR | ∆ ISWD (m) | 16 | −12 (−60 to 36) | 17 | −8 (−44 to 28) | −4 (−60 to 51) | |
| Exercise training (callisthenics) vs. exercise training (endurance and strength training) | 12 weeks | peak work load (W) | 20 | mean 30 (SD 30) | 20 | mean 48 (SD 30) | P = 0.04* | |
| endurance time (min) | mean 8 (SD 7) | mean 17 (SD 24) | P = 0.08* | |||||
| 6MWD (m) | mean 424 (SD 114) | mean 483 (SD 89) | P = 0.30* | |||||
| Supplemental oxygen vs. placebo (air) | 8 weeks | ISWD (m) | 10 | mean 251 (SD 136) | 10 | mean 211 (SD 99) | 40 (−64 to 144) | |
| ESWT (sec) | mean 340 (SD 336) | mean 170 (SD 98) | 170 (−47 to 387) | |||||
| Exercise training (eccentric cycle training) vs. exercise training (concentric cycle training) | 10 weeks | ∆ peak work rate (W) | 8 | 9 (3 to 15) | 8 | 12 (5 to 19) | −3 (−11 to 5) | |
| Adherence intervention vs. PR | 6 months (follow‐up) | 6MWD (m) | 32 | mean 320 (SD 134) | 31 | mean 315 (SD 116) | 5 (−57 to 67) | |
| Self‐management vs. no intervention | 12 weeks (mid‐intervention) | 6MWD (m) | 11 | mean 412 (SE 39) | 9 | mean 312 (SE 44) | 100 (−15 to 215) | |
| Exercise training (progressive walking and functional‐resistance exercises) vs. no intervention (inpatient) | hospital discharge | 2‐min walk distance (m) | 16 | mean 162 (SD 38) | 16 | mean 146 (SD 4) | 13 (3 to 23)* | |
| Nutritional supplementation with PR vs. placebo with PR | 4 months (end intervention) | 6MWD (m) | 38 | mean 500 (SD 111) | 35 | mean 492 (SD 101) | MD −4 (SD 12)* | |
| endurance time (sec) | mean 467 (SD 339) | mean 482 (SD 372) | MD −110 (SD 70)* | |||||
| 12 months (end maintenance) | ∆ endurance time (sec) | 32 | mean 107 (SD 63) | 29 | mean 200 (SD 65) | MD −93 (SD 90)* | ||
| Maintenance (telerehabilitation) vs. no intervention | 12 months | 6MWD (m) | 47 | mean 420 (SD 75) | 50 | mean 340 (SD 110) | 80 (43 to 118) | |
| peak work rate (W) | mean 76 (SD 35) | mean 58 (SD 24) | 18 (6 to 30) | |||||
| Maintenance (centre‐based) vs. no intervention | 6MWD (m) | 50 | mean 428 (SD 63) | 50 | mean 340 (SD 110) | 88 (52 to 123) | ||
| peak work rate (W) | mean 79 (SD 31) | mean 58 (SD 24) | 21 (10 to 32) | |||||
| Maintenance (telerehabilitation) vs. maintenance (centre‐based) | 6MWD (m) | 47 | mean 420 (SD 75) | 50 | mean 428 (SD 63) | −7 (−35 to 20) | ||
| peak work rate (W) | mean 76 (SD 35) | mean 79 (SD 31) | −3 (−16 to 10) | |||||
| Physical activity counselling with pedometer vs. pedometer | 12 weeks | ∆ 6MWD (m) | 57 | mean −1 (SD 56) | 52 | mean 4 (SD 47) | P = 0.72* | |
| LAMA/LABA vs. placebo | 8 weeks (4 weeks medication only, 4 weeks medication and behavioural intervention) | endurance time (sec) | 127 | 51 (15 to 86) | 123 | −5 (−40 to 31) | LSMD 55 (95% CI 6 to 105)* | |
| Physical activity counselling vs. PR | 6 weeks | 6MWD (m) | 18 | mean 242 (SD 79) | 18 | mean 267 (SD 47) | −25 (−68 to 18) | |
| Physical activity counselling with pedometer vs. no intervention (following ground‐based walking training) | 12 months | ∆ 6MWD (m) | 35 | −23 (−41 to −5) | 36 | −39 (−59 to −18) | −16 (−46 to 15)* | |
| ∆ ISWD (m) | 28 | −37 (−60 to −14) | −8 (−34 to 17) | 23 (−13 to 60)* | ||||
| ∆ ESWT (sec) | 29 | −110 (−232 to 12) | −168 (−303 to −33) | −54 (−245 to 137)* | ||||
| * from paper ACE: angiotensin‐converting enzyme; ∆: change from baseline; ESWT: time walked during an endurance shuttle walk test; ISWD: distance walked during an incremental shuttle walk test; IQR: interquartile range; LSMD: least squares mean difference; m: metres; D: mean difference; n: number of participants; sec: seconds; SPACE: self‐management programme of activity, coping and education; 6MWD distance walked on six‐minute walk test; SD: standard deviation; VO2peak: peak oxygen uptake | ||||||||
| Study | Comparison (setting); Clinical stability unless indicated | Data regarding adherence |
| Supplemental oxygen with exercise training vs. sham with exercise training | Attended ≥ 16 sessions; oxygen 48 participants; sham 41 participants | |
| Urban Training™ vs. no intervention | Urban training (132 participants)
| |
| Self‐management (health coaching) with PR referral vs. PR referral | Attendance at PR:
85% of participants completed self‐management intervention (≥ 15 of 21 calls) | |
| Self‐management (coping skills training) vs. education and symptom monitoring | Both groups: median number of completed sessions 14 (100%) | |
| Exercise training (whole‐body resistance training) vs. no intervention (inpatient) | Attendance: 5.6 sessions (95%); Intensity (weight load): increase 9.7% | |
| Exercise training (Nordic walking) with education vs. education | "All patients achieved the preset goal for maximum heart rate to ensure training efficiency (> 75% of the initial maximum heart rate)… none of the patients had any difficulties in performing Nordic Walking adequately" | |
| Physical activity counselling with PR vs. sham with PR | PR: "did not systematically record adherence"; Physical activity counselling/sham (8 scheduled sessions): 82% attendance | |
| Supplemental oxygen (lightweight ambulatory) vs. supplemental oxygen (E‐cylinder) | Oxygen use: lightweight ambulatory 8.9 (4.8) hours per day; E‐cylinder 16.9 (3.9) hours per day | |
| Inspiratory muscle training with PR vs. sham with PR | Completed prescribed sessions of inspiratory muscle training: inspiratory muscle training 79 (4)%; PR 81 (4)% Intensity (inspiratory muscle training load relative to baseline Pimax): 47 (2)% Week 1; 84 (4)% Week 12 | |
| Physical activity counselling with PR vs. PR | "All participants received allocated intervention" | |
| ACE inhibitor with PR vs. placebo with PR |
| |
| Physical activity counselling with PR vs. PR | Physical activity counselling: individual exercise counselling 4 sessions attended, diary‐recorded daily step counts 96% | |
| Exercise training vs. no intervention | Exercise training attendance 18.2 (1.1) of 20 scheduled sessions, home‐based walking 8.6 (0.4) sessions | |
| Physical activity counselling vs. no intervention | PAC median 6 (IQR 4 to 9) contacts (range 0 to 25) | |
| Non‐invasive ventilation with PR vs. PR | PR
NIPPV
| |
| Exercise training (COPE‐active) with self‐management vs. self management | COPE‐active 56 (73%) participants completed (not defined) | |
| Water‐based exercise training vs. land‐based exercise training | "All studied patients completed 60 sessions" | |
| Nutritional supplement vs. no intervention | Adherence: nutritional supplement 95 (6)% Month 1; 89 (14)% Month 3 | |
| Home‐based PR vs. centre‐based PR |
| |
| Self‐management vs. no intervention | Self‐management 999 (86%) of 1156 calls, participated in all 4 scheduled calls 218 (75%) of 289 participants | |
| Physical activity counselling with PR vs. PR | Days of home‐based PR: 239 (25) days a year, 65 (7)%, 4 days a week Days of pedometer wear: 293 (49) days a year, 80 (13)% | |
| Singing vs. sham | Attendance: singing 14.5 of 16 scheduled sessions; sham 7 of 8 scheduled sessions | |
| NMES vs. placebo | Intervention: 42 sessions (1260 minutes)
| |
| Pedometer with physical activity counselling vs. physical activity counselling | Physical activity counselling and pedometer strong correlations between diary and device memory step count (r2 Month 1 0.996, Month 2 0.999, Month 3 0.975) "suggesting a high degree of compliance with the program." | |
| Physical activity counselling with pedometer vs. pedometer | Valid step‐count data
Physical activity counselling with pedometer:
| |
| LAMA (aclidinium bromide) vs. LAMA (tiotropium) | Adherence (both groups) "estimated to be 100% during study period" | |
| Physical activity counselling with pedometer vs. pedometer | Exercise and symptom data submitted: PAC with pedometer 87%; pedometer 66% | |
| Physical activity counselling with PR vs. PR | Physical activity counselling with PR (revised step‐count goal, 5% increments, 8 possible occasions) did not occur 5 (10) occasions | |
| Physical activity counselling vs.PR |
Attended 75% sessions: 100%; mean 11.8 (SD 0.6) of 12 planned consultations
Attended 75% sessions: 70% (9 of 13 participants); mean 10.5 (SD 1.2) of 12 planned classes | |
| Feedback and education vs. no intervention; Education vs. no intervention; Feedback with education vs. education (post‐admission) | Intervention delivery: feedback and education 21 (95%) sessions ; education 1 session not delivered | |
| Tai Chi vs. PR | "Both groups had high compliance in terms of attendance rate (present days/total expected days)" Tai Chi 91 (1)%; PR 87 (2)% | |
| Physical activity counselling vs. no intervention | Days accessed website: Physical activity counselling 87 (15)% | |
| Exercise training (callisthenics) vs. exercise training (endurance and strength training) | Attendance (32 planned sessions): callisthenics 19 (61%) sessions; endurance and strength training 20 (63%) sessions | |
| Exercise training with tapered supervision vs. supervised exercise training | Attendance: exercise training with tapered supervision 100%; supervised exercise training 87% | |
| Supplemental oxygen vs. placebo (air) | Number of cylinders used: oxygen 20.2 (13.7); placebo 10.7 (4.9); P < 0.002 | |
| Self‐management (health mentoring) vs. sham | Attendance: phone contacts median 9.5 of 16 planned sessions (range 1 to 21) | |
| Adherence intervention vs. PR | Attended ≥ 80% sessions: Adherence intervention: 80% (37 of 46 allocated participants); PR: 57% (25 of 44 allocated participants) | |
| Physical activity counselling with optional supervised exercise vs. optional supervised exercise | Physical activity counselling activity coach: 86% "complied" [time activity coach was worn], wear time 17.5 (2.2) days (109% of prescribed), 588 (101) min per day Physical activity counselling diary: 1 participant "complied" (completed diary every day), 1 participant did not use the web portal, 1 participant used web portal for 4 days; completed 17.3 (7.8) times a patient (58% of prescribed) | |
| Self‐management vs. no intervention | Web portal: 86% of days Triage diary: most used module (median 83%) Exercise: 127 exercise schemes performed of 569 schemes prescribed (median 21%) Activity coach‐module: used for 299 days (132 days in monitoring mode, 167 days in feedback mode), "rarely used outside of the measurement weeks" | |
| Physical activity counselling and exercise training with pedometer vs. pedometer | "2 (participants) were excluded for non‐compliance during the intervention phase" Author correspondence states "non‐compliance of the program was established previously, before starting the study, by considering none achieving the individual target of steps/week for three consecutive weeks" | |
| Maintenance (telerehabilitation) vs. no intervention; Maintenance (centre‐based) vs. no intervention; Maintenance (telerehabilitation) vs. maintenance (centre‐based) following high‐intensity interval training | "Adherence to the home‐based maintenance tele‐rehabilitation and hospital‐based, outpatient, maintenance programmes were assessed by the adherence rate (actual number of sessions/total expected number of session×100). Adherence to measurements of vital signs, home exercises, responses to questionnaires and daily steps were recorded for each participant by the number of registrations entered divided by the number of those recommended." "Overall compliance rate" (twice‐weekly supervised exercise training sessions): telerehabilitation 93.5%; centre‐based 91% | |
| Physical activity counselling with optional supervised exercise vs. optional supervised exercise | App accessed: PAC with optional supervised exercise 89 (19)% days, accessed app and personal physical activity goal obtained 34 (16)% days | |
| Physical activity counselling with pedometer vs. pedometer | Pedometer
Website use: Physical activity counselling and pedometer > 4 logins a month "suggests good adherence to the requested weekly logins" (data not shown) | |
| LAMA/LABA vs. placebo | Combined treatment periods 1 and 2: LAMA/LABA 99.5%; placebo 99.6% | |
| Exercise training (ground‐based walking) vs. no intervention | Attendance: 18 (6) of 24 scheduled sessions; Progression (duration): 76 (84%) participants | |
| Physical activity counselling with pedometer vs. no intervention (following ground‐based walking) | % Adherence (number of walks reported divided by the number of prescribed walks) Physical activity counselling: 8 months mean 52 (SD 17); 14 months 52 (55) No intervention: 8 months mean 92 (SD 38); 14 months 77 (54) | |
| Data are mean or mean (SD) unless indicated | ||
| Study | Comparison (setting), if known] Clinical stability unless indicated | Data regarding adverse events |
| Supplemental oxygen with exercise training vs. sham with exercise training | AE: incidence and severity similar in both groups
| |
| Physical activity counselling vs. no intervention (primary care, secondary care); Physical activity counselling with PR vs. PR | Monitoring for AEs described, no results presented: "WA had full access to all the data in the study and takes responsibility for the integrity of the data and the accuracy of the data analysis, including and especially any AEs" | |
| Urban Training™ vs. no intervention | Participants experiencing any AE: Urban Training 99 (77%) of 128 participants; no intervention 103 (73%) of 142 participants; P = 0.363
| |
| LAMA vs. placebo | SAEs: none; AEs leading to discontinuation: LAMA 4 events in 57 participants; placebo 1 event in 53 participants | |
| Physical activity counselling with pedometer vs. pedometer | "No withdrawals due to AEs" | |
| Self‐management (health coaching) with PR referral vs. PR referral | "Reasons for not completing the intervention were death during the study period (n = 3)" (108 participants) | |
| Self‐management (coping‐skills training) vs. education and symptom monitoring | Education and symptom monitoring: 3 participants died during the intervention period | |
| Exercise training (whole‐body resistance training) vs. no intervention (inpatient) | "No patients exhibited clinical deterioration except oxygen desaturation (oxygen saturation by pulse oximeter <88%) and increased dyspnoea, which were reversed with oxygen or increasing supplemental oxygen" | |
| Nordic walking with education vs. education | "No (serious) AEs were reported" | |
| Supplemental oxygen (lightweight ambulatory) vs. supplemental oxygen (E‐cylinder) | AEs: lightweight ambulatory 1 death (sudden) in 11 participants; E‐cylinder 1 death (congestive heart failure) in 11 participants | |
| Web‐based PR vs. centre‐based PR | Monitoring for AEs described, no results presented: "Any SAEs were reported to the sponsor. A SAE was defined as an acute exacerbation of their COPD that resulted in a hospital admission" | |
| ACE inhibitor with PR vs. placebo with PR | AECOPD or AE: no difference between groups
| |
| Physical activity counselling vs. no intervention | Respiratory AEs (≥ 1 AECOPD): physical activity counselling 43 (27%) of 159 participants; no intervention 48 (30%) of 159 participants; P = 0.54; 5 participants required hospitalisation Musculoskeletal AEs (back pain, knee pain, rib fracture): physical activity counselling 11 events; no intervention 2 events; P = 0.01; none caused study discontinuation 8 other AEs (not study‐related: cardiovascular problems, melanoma, urinary problems, gastrointestinal problems) | |
| Non‐invasive ventilation with PR vs. PR | Respiratory AEs: Non‐invasive ventilation 1 death ("progressive respiratory failure due to COPD exacerbation") in 24 participants Musculoskeletal AEs: Non‐invasive ventilation 1 withdrawal ("rheumatic complaints") | |
| Exercise training (COPE‐active) with self‐management vs. self management | AEs: none reported | |
| Water‐based exercise training vs. land‐based exercise training | Participant discontinuations due to "health problems"
| |
| Exercise training (outdoor walking) vs. exercise training (cycle ergometry) | During rehabilitation: no AE During follow‐up: ergometry 3 participants AECOPD Walking: unable to use HR monitor as planned, required chest strap; difficult for 70% of participants; resolved using modified Borg scale to guide training intensity | |
| Endobronchial valve surgery vs. no intervention | AEs: endobronchial valve surgery 1 death, 8 valves removed in 19 participants | |
| Home‐based PR vs. centre‐based PR | AEs: none | |
| Physical activity counselling vs. no intervention | Respiratory AEs
| |
| Physical activity counselling vs. no intervention | AEs: no intervention 1 death in 17 participants | |
| Self‐management vs. no intervention | SAEs: self‐management 24 of 179 participants; no intervention 20 of 232 participants
| |
| Physical activity counselling with PR vs. PR | AEs: Physical activity counselling with PR 1 death in 12 participants; PR 1 death in 15 participants | |
| NMES vs. placebo | Similar between groups; AE: NMES 5 (20%) participants; placebo 9 (33%) participants
| |
| LAMA vs. placebo | SAEs: none; AEs: were all "mild or moderate", not study‐related, no withdrawals | |
| Self‐management (SPACE) vs. no intervention | AEs: SPACE five participants with comorbidities, one participant with "worsening of COPD" in 89 participants; no intervention five participants with comorbidities, one death in 95 participants | |
| Physical activity counselling with pedometer vs. pedometer | Musculoskeletal AEs ("mild / minor"):
Deaths:
Four‐month data
12‐month data "no differences between groups with respect to pulmonary, cardiac or other adverse events"
| |
| LAMA (aclidinium bromide) vs. LAMA (tiotropium) | AEs: aclidinium bromide 9 events in 22 participants; tiotropium 7 events in 22 participants | |
| LAMA vs. placebo | “No relevant issues concerning safety were found” Any AE: LAMA 44 (36%) participants, placebo 56 (44%) participants
Most were mild (72 participants, 29%) or moderate (47 participants, 19%) Concerning drug‐related AEs: LAMA 1 (1%) participant; placebo 4 participants SAE: 5 participants (2%) in screening period, 1 died
| |
| ICS (beclomethasone) with LABA (formoterol) vs. ICS (budesonide) with LABA (formoterol) | TEAEs: beclomethasone with formoterol 18 events in 10 participants (33%); budesonide with formoterol 32 events in 15 participants (52%), 1 AECOPD (only severe event) Adverse drug reactions: beclomethasone with formoterol 5 events in 3 participants (10%); budesonide with formoterol 3 events in 3 participants (10%) AEs leading to study discontinuation: beclomethasone with formoterol 3 events in 3 participants (10%); budesonide with formoterol 5 events in 3 participants (10%) "No relevant differences between groups were observed in the proportion of patients with TEAEs, SAEs, adverse drug reactions, severe AEs and AEs leading to discontinuation" | |
| Physical activity counselling with pedometer vs. pedometer | AEs: Physical activity counselling with pedometer "greater number (of AEs)... two falls and three AECOPD" (9 participants) | |
| Physical activity counselling with PR vs. PR |
| |
| Physical activity counselling vs. PR | Study‐related and unexpected AEs; no withdrawals
| |
| Feedback and education vs. no intervention; Education vs. no intervention; Feedback with education vs. education (post‐admission) | Hospital admissions (at least 1 overnight stay, not study‐related): education 2 admissions in 6 participants (1 respiratory, 1 non‐respiratory) Hospital re‐admissions for AECOPD (not considered AE, withdrawn from study): education and feedback 3 admissions in 8 participants; no intervention 1 admission in 6 participants No deaths | |
| Tai Chi vs. PR | AEs: "No difference in AEs was observed between the groups" (undefined); Tai Chi 2 events in 60 participants; PR 2 events in 60 participants Reasons for hospitalisation (SAE) P = 0.769
| |
| Supplemental oxygen vs. placebo (air) | AEs: 1 death during walking test at baseline assessment | |
| Self‐management (health mentoring) vs. sham | AEs: self‐management 2 deaths in 47 participants; sham 2 deaths in 73 participants Respiratory AEs (at least 1 admission for COPD): self‐management 11 (12.2%) participants; sham 5 (5.4%) participants; P = 0.11 | |
| LAMA (tiotropium) with behavioural management vs. placebo with behavioural management | "No SAEs were considered related to study drug and patients recovered from all events"; no deaths TEAEs
| |
| LAMA vs. placebo; LAMA/LABA vs. placebo; LAMA/LABA and exercise training vs. placebo; LAMA/LABA vs. LAMA; LAMA/LABA and exercise training vs. LAMA; LAMA/LABA and exercise training vs. LAMA/LABA N.B. all groups received behavioural modification | Any AE: placebo 46 events in 60 participants; LAMA 51 events in 76 participants; LAMA/LABA 44 events in 76 participants; LAMA/LABA and exercise training 49 events in 76 participants TEAE: placebo 4 events; LAMA 6 events; LAMA/LABA 3 events; LAMA/LABA and exercise training 2 events Severe AE: placebo 5 events; LAMA 10 events; LAMA/LABA 3 events LAMA/LABA and exercise training 8 events "Specific AEs with incidence > 2%"
| |
| Maintenance (telerehabilitation) vs. no intervention; Maintenance (centre‐based) vs. no intervention; Maintenance (telerehabilitation) vs. maintenance (centre‐based) | AEs: none reported | |
| Physical activity counselling with pedometer vs. pedometer | SAEs (not study‐related: abdominal pain, anxiety, mental health crisis, headache, congestion, ear pain, rash, skin abscess, kidney problems, toe fracture, car accident): Physical activity counselling with pedometer 14 events in 9 of 57 participants; pedometer 10 events in 8 of 52 participants; P = 0.54 Respiratory AEs: Physical activity counselling with pedometer 15 events in 13 participants; pedometer 9 events in 8 participants; P = 0.29 | |
| LAMA/LABA vs. placebo | All TEAEs: LAMA/LABA 73 events in 44 of 193 participants (4 participants discontinued); placebo 48 events in 43 of 188 participants (2 participants discontinued) Suspected‐related TEAEs: LAMA/LABA 12 events in 11 participants; placebo 4 events in 4 participants
Serious TEAEs: LAMA/LABA 4 participants, 1 death (not study‐related: suspected myocardial infarction); placebo 2 participants | |
| LAMA/LABA vs. placebo | TEAEs: LAMA/LABA 42.5%, placebo 45.1% SAEs leading to discontinuation: LAMA/LABA 1.5%, placebo 2.3% AEs leading to discontinuation: LAMA/LABA 3%, placebo 4.5% Events reported by > 5% of participants: nasopharyngitis (LAMA/LABA 10.4%; placebo 9.8%), headache (LAMA/LABA 3.0%; placebo 9.0%) | |
| Exercise training (ground‐based walking) vs. no intervention | AEs: none reported | |
| Physical activity counselling with pedometer vs. no intervention (following ground‐based walking) | "No AEs were reported during the study" | |
| ACE: angiotensin‐converting enzyme; AE: adverse event; AECOPD: acute exacerbation of COPD; COPD: chronic obstructive pulmonary disease; ICS: inhaled corticosteroid; LABA: long‐acting beta2‐agonist; LAMA: long‐acting muscarinic antagonist; n: number; NMES: neuromuscular electrical stimulation; OR: odds ratio; PR: pulmonary rehabilitation; SAE: serious adverse event; SPACE: self‐management programme of activity, coping and education; TEAE: treatment‐emergent adverse event | ||
| Outcome or subgroup title | No. of studies | No. of participants | Statistical method | Effect size |
| 1 change in step count (steps per day); Intervention: pulmonary rehabilitation/exercise training Show forest plot | 3 | Mean Difference (IV, Random, 95% CI) | Subtotals only | |
| 1.1 End intervention | 3 | 180 | Mean Difference (IV, Random, 95% CI) | 208.24 [‐164.91, 581.39] |
| 2 time/change in time in moderate‐to‐vigorous intensity physical activity (minutes per day); Intervention: pulmonary rehabilitation/exercise training Show forest plot | 3 | Mean Difference (IV, Random, 95% CI) | Subtotals only | |
| 2.1 End intervention | 3 | 190 | Mean Difference (IV, Random, 95% CI) | 3.62 [‐1.90, 9.14] |
| 3 change in time in light‐intensity physical activity (minutes per day); Intervention: pulmonary rehabilitation/exercise training Show forest plot | 3 | Mean Difference (IV, Random, 95% CI) | Subtotals only | |
| 3.1 End intervention | 3 | 182 | Mean Difference (IV, Random, 95% CI) | ‐1.87 [‐28.35, 24.61] |
| 4 change in total energy expenditure (kcal); Intervention: pulmonary rehabilitation/exercise training Show forest plot | 2 | Mean Difference (IV, Random, 95% CI) | Subtotals only | |
| 4.1 End intervention | 2 | 144 | Mean Difference (IV, Random, 95% CI) | ‐41.54 [‐89.97, 6.90] |
| 5 change in time in physical activity (total; minutes per day); Intervention: pulmonary rehabilitation/exercise training Show forest plot | 2 | Mean Difference (IV, Random, 95% CI) | Subtotals only | |
| 5.1 End intervention | 2 | 88 | Mean Difference (IV, Random, 95% CI) | 23.01 [6.12, 39.90] |
| 6 change in sedentary time (minutes per day); Intervention: pulmonary rehabilitation/exercise training Show forest plot | 2 | Mean Difference (IV, Random, 95% CI) | Subtotals only | |
| 6.1 End intervention | 2 | 137 | Mean Difference (IV, Random, 95% CI) | 16.56 [‐27.06, 60.18] |
| 7 time in "lifestyle" physical activity (minutes per day); Intervention: high‐intensity interval training Show forest plot | 2 | Mean Difference (IV, Random, 95% CI) | Subtotals only | |
| 7.1 End intervention | 2 | 275 | Mean Difference (IV, Random, 95% CI) | 9.40 [3.87, 14.93] |
| 8 time in light‐intensity physical activity (minutes per day); Intervention: high‐intensity interval training Show forest plot | 2 | Mean Difference (IV, Random, 95% CI) | Subtotals only | |
| 8.1 End intervention | 2 | 275 | Mean Difference (IV, Random, 95% CI) | 28.12 [15.64, 40.60] |
| 9 time in moderate‐to‐vigorous intensity physical activity (minutes per day); Intervention: high‐intensity interval training Show forest plot | 2 | Mean Difference (IV, Random, 95% CI) | Subtotals only | |
| 9.1 End intervention | 2 | 275 | Mean Difference (IV, Random, 95% CI) | 6.24 [4.00, 8.48] |
| 10 sedentary time (minutes per day); Intervention: high‐intensity interval training Show forest plot | 2 | Mean Difference (IV, Random, 95% CI) | Subtotals only | |
| 10.1 End intervention | 2 | 275 | Mean Difference (IV, Random, 95% CI) | ‐34.25 [‐55.90, ‐12.60] |
| 11 step count (steps per day); Intervention: physical activity counselling Show forest plot | 3 | Mean Difference (IV, Fixed, 95% CI) | Totals not selected | |
| 11.1 Step count: in‐person (end intervention) | 1 | Mean Difference (IV, Fixed, 95% CI) | 0.0 [0.0, 0.0] | |
| 11.2 Change in step count: telecoaching (end intervention) | 1 | Mean Difference (IV, Fixed, 95% CI) | 0.0 [0.0, 0.0] | |
| 11.3 Step count: 'Urban Training' (end intervention) | 1 | Mean Difference (IV, Fixed, 95% CI) | 0.0 [0.0, 0.0] | |
| 12 "IMA" (counts per minute); Intervention: self‐management Show forest plot | 1 | Mean Difference (IV, Random, 95% CI) | Totals not selected | |
| 12.1 Mid‐intervention (4 weeks) | 1 | Mean Difference (IV, Random, 95% CI) | 0.0 [0.0, 0.0] | |
| 12.2 Mid‐intervention (12 weeks) | 1 | Mean Difference (IV, Random, 95% CI) | 0.0 [0.0, 0.0] | |
| 13 physical activity level; Intervention: nutritional supplement Show forest plot | 1 | Mean Difference (IV, Random, 95% CI) | Totals not selected | |
| 13.1 Mid‐intervention | 1 | Mean Difference (IV, Random, 95% CI) | 0.0 [0.0, 0.0] | |
| 13.2 End intervention | 1 | Mean Difference (IV, Random, 95% CI) | 0.0 [0.0, 0.0] | |
| 14 total energy expenditure (MJ); Intervention: nutritional supplement Show forest plot | 1 | Mean Difference (IV, Random, 95% CI) | Totals not selected | |
| 14.1 Mid‐intervention | 1 | Mean Difference (IV, Random, 95% CI) | 0.0 [0.0, 0.0] | |
| 14.2 End intervention | 1 | Mean Difference (IV, Random, 95% CI) | 0.0 [0.0, 0.0] | |
| 15 subgroup analysis (supervised vs. unsupervised); change in step count (steps per day); Intervention: pulmonary rehabilitation/exercise training Show forest plot | 3 | Mean Difference (IV, Random, 95% CI) | Subtotals only | |
| 15.1 Supervised pulmonary rehabilitation/exercise training | 2 | 144 | Mean Difference (IV, Random, 95% CI) | 68.86 [‐386.29, 524.01] |
| 15.2 Unsupervised pulmonary rehabilitation/exercise training | 1 | 36 | Mean Difference (IV, Random, 95% CI) | 494.0 [‐157.70, 1145.70] |
| 16 supgroup analysis (supervised vs. unsupervised); change in time in light‐intensity physical activity (minutes per day); Intervention: pulmonary rehabilitation/exercise training Show forest plot | 3 | Mean Difference (IV, Random, 95% CI) | Subtotals only | |
| 16.1 Supervised pulmonary rehabilitation/exercise training | 2 | 146 | Mean Difference (IV, Random, 95% CI) | 9.87 [‐9.22, 28.96] |
| 16.2 Unupervised pulmonary rehabilitation/exercise training | 1 | 36 | Mean Difference (IV, Random, 95% CI) | ‐44.0 [‐87.04, ‐0.96] |
| 17 subgroup analysis (supervised vs. unsupervised); change in total energy expenditure (kcal); Intervention: pulmonary rehabilitation/exercise training Show forest plot | 2 | Mean Difference (IV, Random, 95% CI) | Totals not selected | |
| 17.1 Supervised pulmonary rehabilitation/exercise training | 1 | Mean Difference (IV, Random, 95% CI) | 0.0 [0.0, 0.0] | |
| 17.2 Unsupervised pulmonary rehabilitation/exercise training | 1 | Mean Difference (IV, Random, 95% CI) | 0.0 [0.0, 0.0] | |
| 18 subgroup analysis (supervised vs. unsupervised); change in sedentary time (minutes per day); Intervention: pulmonary rehabilitation/exercise training Show forest plot | 2 | Mean Difference (IV, Random, 95% CI) | Totals not selected | |
| 18.1 Supervised pulmonary rehabilitation/exercise training | 1 | Mean Difference (IV, Random, 95% CI) | 0.0 [0.0, 0.0] | |
| 18.2 Unsupervised pulmonary rehabilitation/exercise training | 1 | Mean Difference (IV, Random, 95% CI) | 0.0 [0.0, 0.0] | |
| Outcome or subgroup title | No. of studies | No. of participants | Statistical method | Effect size |
| 1 step count (steps per day); Intervention: self‐management (health mentoring) Show forest plot | 1 | Mean Difference (IV, Random, 95% CI) | Totals not selected | |
| 1.1 Mid‐intervention | 1 | Mean Difference (IV, Random, 95% CI) | 0.0 [0.0, 0.0] | |
| 1.2 End intervention | 1 | Mean Difference (IV, Random, 95% CI) | 0.0 [0.0, 0.0] | |
| 2 change in step count (steps per day); Intervention: LAMA/LABA Show forest plot | 2 | Mean Difference (IV, Random, 95% CI) | Subtotals only | |
| 2.1 End intervention | 2 | 426 | Mean Difference (IV, Random, 95% CI) | 531.30 [167.10, 895.49] |
| 3 change in time in moderate‐to‐vigorous intensity physical activity (minutes per day): Intervention: LAMA/LABA Show forest plot | 2 | Mean Difference (IV, Random, 95% CI) | Subtotals only | |
| 3.1 End intervention | 2 | 423 | Mean Difference (IV, Random, 95% CI) | 9.74 [4.23, 15.24] |
| 4 change in active energy expenditure (kcal); Intervention: LAMA/LABA Show forest plot | 2 | Mean Difference (IV, Random, 95% CI) | Subtotals only | |
| 4.1 End intervention | 2 | 423 | Mean Difference (IV, Random, 95% CI) | 43.89 [17.92, 69.86] |
| 5 step count (steps per day); Intervention: nutritional supplement Show forest plot | 1 | Mean Difference (IV, Random, 95% CI) | Totals not selected | |
| 5.1 Mid‐intervention | 1 | Mean Difference (IV, Random, 95% CI) | 0.0 [0.0, 0.0] | |
| 5.2 End intervention | 1 | Mean Difference (IV, Random, 95% CI) | 0.0 [0.0, 0.0] | |
| 6 energy expenditure for ambulation (kcal/step/FFM kg); Intervention: nutritional supplement Show forest plot | 1 | Mean Difference (IV, Random, 95% CI) | Totals not selected | |
| 6.1 Mid‐intervention | 1 | Mean Difference (IV, Random, 95% CI) | 0.0 [0.0, 0.0] | |
| 6.2 End intervention | 1 | Mean Difference (IV, Random, 95% CI) | 0.0 [0.0, 0.0] | |
| 7 change in step count (steps per day); Intervention: neuromuscular electrical stimulation Show forest plot | 1 | Mean Difference (IV, Random, 95% CI) | Totals not selected | |
| 7.1 End intervention | 1 | Mean Difference (IV, Random, 95% CI) | 0.0 [0.0, 0.0] | |
| 7.2 Follow‐up | 1 | Mean Difference (IV, Random, 95% CI) | 0.0 [0.0, 0.0] | |
| 8 change in up/down transitions (number); Intervention: neuromuscular electrical stimulation Show forest plot | 1 | Mean Difference (IV, Random, 95% CI) | Totals not selected | |
| 8.1 End intervention | 1 | Mean Difference (IV, Random, 95% CI) | 0.0 [0.0, 0.0] | |
| 8.2 Follow‐up | 1 | Mean Difference (IV, Random, 95% CI) | 0.0 [0.0, 0.0] | |
| 9 change in time upright (hours); Intervention: neuromuscular electrical stimulation Show forest plot | 1 | Mean Difference (IV, Random, 95% CI) | Totals not selected | |
| 9.1 End intervention | 1 | Mean Difference (IV, Random, 95% CI) | 0.0 [0.0, 0.0] | |
| 9.2 Follow‐up | 1 | Mean Difference (IV, Random, 95% CI) | 0.0 [0.0, 0.0] | |
| Outcome or subgroup title | No. of studies | No. of participants | Statistical method | Effect size |
| 1 movement intensity (m/s2); Interventions: nordic walking with education vs. education Show forest plot | 1 | Mean Difference (IV, Random, 95% CI) | Totals not selected | |
| 1.1 End intervention | 1 | Mean Difference (IV, Random, 95% CI) | 0.0 [0.0, 0.0] | |
| 1.2 Follow‐up (6 months) | 1 | Mean Difference (IV, Random, 95% CI) | 0.0 [0.0, 0.0] | |
| 1.3 Follow‐up (9 months) | 1 | Mean Difference (IV, Random, 95% CI) | 0.0 [0.0, 0.0] | |
| 2 change in step count (steps per day); Interventions: exercise training (COPE‐active) with self‐management vs. self management Show forest plot | 1 | Mean Difference (IV, Random, 95% CI) | Totals not selected | |
| 2.1 Mid‐intervention | 1 | Mean Difference (IV, Random, 95% CI) | 0.0 [0.0, 0.0] | |
| 2.2 End intervention | 1 | Mean Difference (IV, Random, 95% CI) | 0.0 [0.0, 0.0] | |
| 2.3 Follow‐up (18 months) | 1 | Mean Difference (IV, Random, 95% CI) | 0.0 [0.0, 0.0] | |
| 2.4 Follow‐up (24 months) | 1 | Mean Difference (IV, Random, 95% CI) | 0.0 [0.0, 0.0] | |
| 3 change in time in light‐intensity physical activity (minutes per day); Interventions: upper body resistance training with health education vs. health education Show forest plot | 1 | Mean Difference (IV, Random, 95% CI) | Totals not selected | |
| 3.1 End intervention | 1 | Mean Difference (IV, Random, 95% CI) | 0.0 [0.0, 0.0] | |
| 3.2 Follow‐up | 1 | Mean Difference (IV, Random, 95% CI) | 0.0 [0.0, 0.0] | |
| 4 step count (steps per day); Interventions: LAMA/LABA and exercise training with behaviour modification vs. placebo with behaviour modification Show forest plot | 1 | Mean Difference (IV, Random, 95% CI) | Totals not selected | |
| 4.1 Mid‐intervention | 1 | Mean Difference (IV, Random, 95% CI) | 0.0 [0.0, 0.0] | |
| 4.2 End intervention | 1 | Mean Difference (IV, Random, 95% CI) | 0.0 [0.0, 0.0] | |
| 5 time walking (minutes per day); Interventions: LAMA/LABA and exercise training with behaviour modification vs. placebo with behaviour modification Show forest plot | 1 | Mean Difference (IV, Random, 95% CI) | Totals not selected | |
| 5.1 Mid‐intervention | 1 | Mean Difference (IV, Random, 95% CI) | 0.0 [0.0, 0.0] | |
| 5.2 End intervention | 1 | Mean Difference (IV, Random, 95% CI) | 0.0 [0.0, 0.0] | |
| 6 walking intensity (m/s2); Interventions: LAMA/LABA and exercise training with behaviour modification vs. placebo with behaviour modification Show forest plot | 1 | Mean Difference (IV, Random, 95% CI) | Totals not selected | |
| 6.1 Mid‐intervention | 1 | Mean Difference (IV, Random, 95% CI) | 0.0 [0.0, 0.0] | |
| 6.2 End intervention | 1 | Mean Difference (IV, Random, 95% CI) | 0.0 [0.0, 0.0] | |
| 7 step count (steps per day); Interventions: exercise training and LABA with LAMA and behaviour modification vs. LAMA and behaviour modification Show forest plot | 1 | Mean Difference (IV, Random, 95% CI) | Totals not selected | |
| 7.1 Mid‐intervention | 1 | Mean Difference (IV, Random, 95% CI) | 0.0 [0.0, 0.0] | |
| 7.2 End intervention | 1 | Mean Difference (IV, Random, 95% CI) | 0.0 [0.0, 0.0] | |
| 8 time walking (minutes per day); Interventions: exercise training and LABA with LAMA and behaviour modification vs. LAMA and behaviour modification Show forest plot | 1 | Mean Difference (IV, Random, 95% CI) | Totals not selected | |
| 8.1 Mid‐intervention | 1 | Mean Difference (IV, Random, 95% CI) | 0.0 [0.0, 0.0] | |
| 8.2 End intervention | 1 | Mean Difference (IV, Random, 95% CI) | 0.0 [0.0, 0.0] | |
| 9 walking intensity (m/s2); Interventions: exercise training and LABA with LAMA and behaviour modification vs. LAMA and behaviour modification Show forest plot | 1 | Mean Difference (IV, Random, 95% CI) | Totals not selected | |
| 9.1 Mid‐intervention | 1 | Mean Difference (IV, Random, 95% CI) | 0.0 [0.0, 0.0] | |
| 9.2 End intervention | 1 | Mean Difference (IV, Random, 95% CI) | 0.0 [0.0, 0.0] | |
| 10 step count (steps per day); Interventions: exercise training with LAMA/LABA and behaviour modification vs. LAMA/LABA and behaviour modification Show forest plot | 1 | Mean Difference (IV, Random, 95% CI) | Totals not selected | |
| 10.1 Mid‐intervention | 1 | Mean Difference (IV, Random, 95% CI) | 0.0 [0.0, 0.0] | |
| 10.2 End intervention | 1 | Mean Difference (IV, Random, 95% CI) | 0.0 [0.0, 0.0] | |
| 11 time walking (minutes per day); Interventions: exercise training with LAMA/LABA and behaviour modification vs. LAMA/LABA and behaviour modification Show forest plot | 1 | Mean Difference (IV, Random, 95% CI) | Totals not selected | |
| 11.1 Mid‐intervention | 1 | Mean Difference (IV, Random, 95% CI) | 0.0 [0.0, 0.0] | |
| 11.2 End intervention | 1 | Mean Difference (IV, Random, 95% CI) | 0.0 [0.0, 0.0] | |
| 12 walking intensity (m/s2); Interventions: exercise training with LAMA/LABA and behaviour modification vs. LAMA/LABA and behaviour modification Show forest plot | 1 | Mean Difference (IV, Random, 95% CI) | Totals not selected | |
| 12.1 Mid‐intervention | 1 | Mean Difference (IV, Random, 95% CI) | 0.0 [0.0, 0.0] | |
| 12.2 End intervention | 1 | Mean Difference (IV, Random, 95% CI) | 0.0 [0.0, 0.0] | |
| 13 change in step count (steps per day); Interventions: exercise training and physical activity counselling with pedometer vs. pedometer Show forest plot | 1 | Mean Difference (IV, Random, 95% CI) | Totals not selected | |
| 13.1 End intervention | 1 | Mean Difference (IV, Random, 95% CI) | 0.0 [0.0, 0.0] | |
| 13.2 Follow‐up (3 months) | 1 | Mean Difference (IV, Random, 95% CI) | 0.0 [0.0, 0.0] | |
| 13.3 Follow‐up (12 months) | 1 | Mean Difference (IV, Random, 95% CI) | 0.0 [0.0, 0.0] | |
| 14 change in step count (weekday, steps per day); Interventions: physical activity counselling with optional supervised exercise vs. optional supervised exercise Show forest plot | 1 | Mean Difference (IV, Random, 95% CI) | Totals not selected | |
| 14.1 Mid‐intervention | 1 | Mean Difference (IV, Random, 95% CI) | 0.0 [0.0, 0.0] | |
| 14.2 End intervention | 1 | Mean Difference (IV, Random, 95% CI) | 0.0 [0.0, 0.0] | |
| 14.3 Follow‐up | 1 | Mean Difference (IV, Random, 95% CI) | 0.0 [0.0, 0.0] | |
| 15 METs; Interventions: physical activity counselling with optional supervised exercise vs. optional supervised exercise Show forest plot | 1 | Mean Difference (IV, Random, 95% CI) | Totals not selected | |
| 15.1 Mid‐intervention | 1 | Mean Difference (IV, Random, 95% CI) | 0.0 [0.0, 0.0] | |
| 15.2 End intervention | 1 | Mean Difference (IV, Random, 95% CI) | 0.0 [0.0, 0.0] | |
| 15.3 Follow‐up | 1 | Mean Difference (IV, Random, 95% CI) | 0.0 [0.0, 0.0] | |
| 16 step count (steps per day); Interventions: physical activity counselling with pedometer vs. pedometer Show forest plot | 3 | Mean Difference (IV, Random, 95% CI) | Totals not selected | |
| 16.1 Step count: web‐based (end intervention) | 1 | Mean Difference (IV, Random, 95% CI) | 0.0 [0.0, 0.0] | |
| 16.2 Step count: app (mid‐intervention) | 1 | Mean Difference (IV, Random, 95% CI) | 0.0 [0.0, 0.0] | |
| 16.3 Step count: app (end intervention) | 1 | Mean Difference (IV, Random, 95% CI) | 0.0 [0.0, 0.0] | |
| 16.4 Change in step count: web‐based (mid‐intervention) | 1 | Mean Difference (IV, Random, 95% CI) | 0.0 [0.0, 0.0] | |
| 16.5 Change in step count: web‐based (end intervention) | 1 | Mean Difference (IV, Random, 95% CI) | 0.0 [0.0, 0.0] | |
| 17 time active (minutes per day); Interventions: physical activity counselling (app) with pedometer vs. pedometer Show forest plot | 1 | Mean Difference (IV, Random, 95% CI) | Totals not selected | |
| 17.1 Mid‐intervention | 1 | Mean Difference (IV, Random, 95% CI) | 0.0 [0.0, 0.0] | |
| 17.2 End intervention | 1 | Mean Difference (IV, Random, 95% CI) | 0.0 [0.0, 0.0] | |
| 18 time inactive (minutes per day); Interventions: physical activity counselling (app) with pedometer vs. pedometer Show forest plot | 1 | Mean Difference (IV, Random, 95% CI) | Totals not selected | |
| 18.1 Mid‐intervention | 1 | Mean Difference (IV, Random, 95% CI) | 0.0 [0.0, 0.0] | |
| 18.2 End intervention | 1 | Mean Difference (IV, Random, 95% CI) | 0.0 [0.0, 0.0] | |
| 19 peak performance (steps per minute); Interventions: physical activity counselling (app) with pedometer vs. pedometer Show forest plot | 1 | Mean Difference (IV, Random, 95% CI) | Totals not selected | |
| 19.1 Mid‐intervention | 1 | Mean Difference (IV, Random, 95% CI) | 0.0 [0.0, 0.0] | |
| 19.2 End intervention | 1 | Mean Difference (IV, Random, 95% CI) | 0.0 [0.0, 0.0] | |
| 20 step count (steps per day); Interventions: physical activity counselling with pulmonary rehabilitation vs. pulmonary rehabilitation Show forest plot | 2 | Mean Difference (IV, Random, 95% CI) | Totals not selected | |
| 20.1 End intervention (7 days including PR) | 1 | Mean Difference (IV, Random, 95% CI) | 0.0 [0.0, 0.0] | |
| 20.2 End intervention (6 days excluding PR) | 1 | Mean Difference (IV, Random, 95% CI) | 0.0 [0.0, 0.0] | |
| 20.3 End intervention (4 days excluding PR) | 1 | Mean Difference (IV, Random, 95% CI) | 0.0 [0.0, 0.0] | |
| 20.4 Mid‐intervention | 1 | Mean Difference (IV, Random, 95% CI) | 0.0 [0.0, 0.0] | |
| 20.5 End intervention | 1 | Mean Difference (IV, Random, 95% CI) | 0.0 [0.0, 0.0] | |
| 21 time in moderate‐to‐vigorous intensity physical activity (minutes per day); Interventions: physical activity counselling with pulmonary rehabilitation vs. pulmonary rehabilitation Show forest plot | 1 | Mean Difference (IV, Random, 95% CI) | Totals not selected | |
| 21.1 Mid‐intervention | 1 | Mean Difference (IV, Random, 95% CI) | 0.0 [0.0, 0.0] | |
| 21.2 End intervention | 1 | Mean Difference (IV, Random, 95% CI) | 0.0 [0.0, 0.0] | |
| 22 time in physical activity (total, minutes per day); Interventions: physical activity counselling with pulmonary rehabilitation vs. pulmonary rehabilitation Show forest plot | 1 | Mean Difference (IV, Random, 95% CI) | Totals not selected | |
| 22.1 Mid‐intervention | 1 | Mean Difference (IV, Random, 95% CI) | 0.0 [0.0, 0.0] | |
| 22.2 End intervention | 1 | Mean Difference (IV, Random, 95% CI) | 0.0 [0.0, 0.0] | |
| 23 time sedentary (minutes per day); Interventions: physical activity counselling with pulmonary rehabilitation vs. pulmonary rehabilitation Show forest plot | 1 | Mean Difference (IV, Random, 95% CI) | Totals not selected | |
| 23.1 Mid‐intervention | 1 | Mean Difference (IV, Random, 95% CI) | 0.0 [0.0, 0.0] | |
| 23.2 End intervention | 1 | Mean Difference (IV, Random, 95% CI) | 0.0 [0.0, 0.0] | |
| 24 change in step count (steps per day); Interventions: physical activity counselling with pulmonary rehabilitation vs. sham with pulmonary rehabilitation Show forest plot | 1 | Mean Difference (IV, Random, 95% CI) | Totals not selected | |
| 24.1 Mid‐intervention | 1 | Mean Difference (IV, Random, 95% CI) | 0.0 [0.0, 0.0] | |
| 24.2 End intervention | 1 | Mean Difference (IV, Random, 95% CI) | 0.0 [0.0, 0.0] | |
| 25 change in time in moderate‐to‐vigorous intensity physical activity (minutes per day); Interventions: physical activity counselling with pulmonary rehabilitation vs. sham with pulmonary rehabilitation Show forest plot | 1 | Mean Difference (IV, Random, 95% CI) | Totals not selected | |
| 25.1 Mid‐intervention | 1 | Mean Difference (IV, Random, 95% CI) | 0.0 [0.0, 0.0] | |
| 25.2 End intervention | 1 | Mean Difference (IV, Random, 95% CI) | 0.0 [0.0, 0.0] | |
| 26 change in time walking (minutes per day); Interventions: physical activity counselling with pulmonary rehabilitation vs. sham with pulmonary rehabilitation Show forest plot | 1 | Mean Difference (IV, Random, 95% CI) | Totals not selected | |
| 26.1 Mid‐intervention | 1 | Mean Difference (IV, Random, 95% CI) | 0.0 [0.0, 0.0] | |
| 26.2 End intervention | 1 | Mean Difference (IV, Random, 95% CI) | 0.0 [0.0, 0.0] | |
| 27 change in time in physical activity (total, minutes per day); Interventions: physical activity counselling with pulmonary rehabilitation vs. sham with pulmonary rehabilitation Show forest plot | 1 | Mean Difference (IV, Random, 95% CI) | Totals not selected | |
| 27.1 Mid‐intervention | 1 | Mean Difference (IV, Random, 95% CI) | 0.0 [0.0, 0.0] | |
| 27.2 End intervention | 1 | Mean Difference (IV, Random, 95% CI) | 0.0 [0.0, 0.0] | |
| 28 change in time in light‐intensity physical activity (minutes per day); Interventions: exercise‐specific self‐efficacy training with upper body resistance training vs. upper body resistance training Show forest plot | 1 | Mean Difference (IV, Random, 95% CI) | Totals not selected | |
| 28.1 End intervention | 1 | Mean Difference (IV, Random, 95% CI) | 0.0 [0.0, 0.0] | |
| 28.2 Follow‐up | 1 | Mean Difference (IV, Random, 95% CI) | 0.0 [0.0, 0.0] | |
| 29 step count (steps per day); Interventions: LAMA with behaviour modification vs. placebo with behaviour modification Show forest plot | 1 | Mean Difference (IV, Random, 95% CI) | Totals not selected | |
| 29.1 Mid‐intervention | 1 | Mean Difference (IV, Random, 95% CI) | 0.0 [0.0, 0.0] | |
| 29.2 End intervention | 1 | Mean Difference (IV, Random, 95% CI) | 0.0 [0.0, 0.0] | |
| 30 time walking (minutes per day); Interventions: LAMA with behaviour modification vs. placebo with behaviour modification Show forest plot | 1 | Mean Difference (IV, Random, 95% CI) | Totals not selected | |
| 30.1 Mid‐intervention | 1 | Mean Difference (IV, Random, 95% CI) | 0.0 [0.0, 0.0] | |
| 30.2 End intervention | 1 | Mean Difference (IV, Random, 95% CI) | 0.0 [0.0, 0.0] | |
| 31 walking intensity (m/s2); Interventions: LAMA with behaviour modification vs. placebo with behaviour modification Show forest plot | 1 | Mean Difference (IV, Random, 95% CI) | Totals not selected | |
| 31.1 Mid‐intervention | 1 | Mean Difference (IV, Random, 95% CI) | 0.0 [0.0, 0.0] | |
| 31.2 End intervention | 1 | Mean Difference (IV, Random, 95% CI) | 0.0 [0.0, 0.0] | |
| 32 step count (steps per day); Interventions: LAMA/LABA with behaviour modification vs. placebo with behaviour modification Show forest plot | 1 | Mean Difference (IV, Random, 95% CI) | Totals not selected | |
| 32.1 Mid‐intervention | 1 | Mean Difference (IV, Random, 95% CI) | 0.0 [0.0, 0.0] | |
| 32.2 End intervention | 1 | Mean Difference (IV, Random, 95% CI) | 0.0 [0.0, 0.0] | |
| 33 time walking (minutes per day); Interventions: LAMA/LABA with behaviour modification vs. placebo with behaviour modification Show forest plot | 1 | Mean Difference (IV, Random, 95% CI) | Totals not selected | |
| 33.1 Mid‐intervention | 1 | Mean Difference (IV, Random, 95% CI) | 0.0 [0.0, 0.0] | |
| 33.2 End intervention | 1 | Mean Difference (IV, Random, 95% CI) | 0.0 [0.0, 0.0] | |
| 34 walking intensity (m/s2); Interventions: LAMA/LABA with behaviour modification vs. placebo with behaviour modification Show forest plot | 1 | Mean Difference (IV, Random, 95% CI) | Totals not selected | |
| 34.1 Mid‐intervention | 1 | Mean Difference (IV, Random, 95% CI) | 0.0 [0.0, 0.0] | |
| 34.2 End intervention | 1 | Mean Difference (IV, Random, 95% CI) | 0.0 [0.0, 0.0] | |
| 35 step count (steps per day); Interventions: LABA with LAMA and behaviour modification vs. LAMA and behaviour modification Show forest plot | 1 | Mean Difference (IV, Random, 95% CI) | Totals not selected | |
| 35.1 Mid‐intervention | 1 | Mean Difference (IV, Random, 95% CI) | 0.0 [0.0, 0.0] | |
| 35.2 End intervention | 1 | Mean Difference (IV, Random, 95% CI) | 0.0 [0.0, 0.0] | |
| 36 time walking (minutes per day); Interventions: LABA with LAMA and behaviour modification vs. LAMA and behaviour modification Show forest plot | 1 | Mean Difference (IV, Random, 95% CI) | Totals not selected | |
| 36.1 Mid‐intervention | 1 | Mean Difference (IV, Random, 95% CI) | 0.0 [0.0, 0.0] | |
| 36.2 End intervention | 1 | Mean Difference (IV, Random, 95% CI) | 0.0 [0.0, 0.0] | |
| 37 walking intensity (m/s2); Interventions: LABA with LAMA and behaviour modification vs. LAMA and behaviour modification Show forest plot | 1 | Mean Difference (IV, Random, 95% CI) | Totals not selected | |
| 37.1 Mid‐intervention | 1 | Mean Difference (IV, Random, 95% CI) | 0.0 [0.0, 0.0] | |
| 37.2 End intervention | 1 | Mean Difference (IV, Random, 95% CI) | 0.0 [0.0, 0.0] | |
| 38 change in step count (steps per day); Interventions: nutritional supplement with pulmonary rehabilitation vs. placebo with pulmonary rehabilitation Show forest plot | 1 | Mean Difference (IV, Random, 95% CI) | Totals not selected | |
| 38.1 End intervention (stage 1) | 1 | Mean Difference (IV, Random, 95% CI) | 0.0 [0.0, 0.0] | |
| 38.2 End intervention (stage 2) | 1 | Mean Difference (IV, Random, 95% CI) | 0.0 [0.0, 0.0] | |
| 38.3 Follow‐up | 1 | Mean Difference (IV, Random, 95% CI) | 0.0 [0.0, 0.0] | |
| 39 change in step count (steps per day); Interventions: supplemental oxygen with pulmonary rehabilitation vs. sham with pulmonary rehabilitation Show forest plot | 1 | Mean Difference (IV, Random, 95% CI) | Totals not selected | |
| 39.1 End intervention | 1 | Mean Difference (IV, Random, 95% CI) | 0.0 [0.0, 0.0] | |
| 39.2 Follow‐up | 1 | Mean Difference (IV, Random, 95% CI) | 0.0 [0.0, 0.0] | |
| 40 change in time in moderate‐intensity physical activity (minutes per day); Interventions: supplemental oxygen with pulmonary rehabilitation vs. sham with pulmonary rehabilitation Show forest plot | 1 | Mean Difference (IV, Random, 95% CI) | Totals not selected | |
| 40.1 End intervention | 1 | Mean Difference (IV, Random, 95% CI) | 0.0 [0.0, 0.0] | |
| 40.2 Follow‐up | 1 | Mean Difference (IV, Random, 95% CI) | 0.0 [0.0, 0.0] | |
| 41 change in time in vigorous‐intensity physical activity (minutes per day); Interventions: supplemental oxygen with pulmonary rehabilitation vs. sham with pulmonary rehabilitation Show forest plot | 1 | Mean Difference (IV, Random, 95% CI) | Totals not selected | |
| 41.1 End intervention | 1 | Mean Difference (IV, Random, 95% CI) | 0.0 [0.0, 0.0] | |
| 41.2 Follow‐up | 1 | Mean Difference (IV, Random, 95% CI) | 0.0 [0.0, 0.0] | |
| 42 change in time in light‐intensity physical activity (minutes per day); Interventions: supplemental oxygen with pulmonary rehabilitation vs. sham with pulmonary rehabilitation Show forest plot | 1 | Mean Difference (IV, Random, 95% CI) | Totals not selected | |
| 42.1 End intervention | 1 | Mean Difference (IV, Random, 95% CI) | 0.0 [0.0, 0.0] | |
| 42.2 Follow‐up | 1 | Mean Difference (IV, Random, 95% CI) | 0.0 [0.0, 0.0] | |
| 43 change in total energy expenditure (kcal); Interventions: supplemental oxygen with pulmonary rehabilitation vs. sham with pulmonary rehabilitation Show forest plot | 1 | Mean Difference (IV, Random, 95% CI) | Totals not selected | |
| 43.1 End intervention | 1 | Mean Difference (IV, Random, 95% CI) | 0.0 [0.0, 0.0] | |
| 43.2 Follow‐up | 1 | Mean Difference (IV, Random, 95% CI) | 0.0 [0.0, 0.0] | |
| 44 change in sedentary time (minutes per day); Interventions: supplemental oxygen with pulmonary rehabilitation vs. sham with pulmonary rehabilitation Show forest plot | 1 | Mean Difference (IV, Random, 95% CI) | Totals not selected | |
| 44.1 End intervention | 1 | Mean Difference (IV, Random, 95% CI) | 0.0 [0.0, 0.0] | |
| 44.2 Follow‐up | 1 | Mean Difference (IV, Random, 95% CI) | 0.0 [0.0, 0.0] | |
| Outcome or subgroup title | No. of studies | No. of participants | Statistical method | Effect size |
| 1 change in step count (steps per day); Interventions: home‐based pulmonary rehabilitation vs. centre‐based pulmonary rehabilitation Show forest plot | 1 | Mean Difference (IV, Random, 95% CI) | Totals not selected | |
| 1.1 End intervention | 1 | Mean Difference (IV, Random, 95% CI) | 0.0 [0.0, 0.0] | |
| 1.2 Follow‐up | 1 | Mean Difference (IV, Random, 95% CI) | 0.0 [0.0, 0.0] | |
| 2 change in time in moderate‐to‐vigorous intensity physical activity (minutes per day); Interventions: home‐based pulmonary rehabilitation vs. centre‐based pulmonary rehabilitation Show forest plot | 1 | Mean Difference (IV, Random, 95% CI) | Totals not selected | |
| 2.1 End intervention | 1 | Mean Difference (IV, Random, 95% CI) | 0.0 [0.0, 0.0] | |
| 2.2 Follow‐up | 1 | Mean Difference (IV, Random, 95% CI) | 0.0 [0.0, 0.0] | |
| 3 change in number of bouts of moderate‐to‐vigorous intensity physical activity; Interventions: home‐based pulmonary rehabilitation vs. centre‐based pulmonary rehabilitation Show forest plot | 1 | Mean Difference (IV, Random, 95% CI) | Totals not selected | |
| 3.1 End intervention | 1 | Mean Difference (IV, Random, 95% CI) | 0.0 [0.0, 0.0] | |
| 3.2 Follow‐up | 1 | Mean Difference (IV, Random, 95% CI) | 0.0 [0.0, 0.0] | |
| 4 change in time in bouts of moderate‐to‐vigorous intensity physical activity(minutes per day); Interventions: home‐based pulmonary rehabilitation vs. centre‐based pulmonary rehabilitation Show forest plot | 1 | Mean Difference (IV, Random, 95% CI) | Totals not selected | |
| 4.1 End intervention | 1 | Mean Difference (IV, Random, 95% CI) | 0.0 [0.0, 0.0] | |
| 4.2 Follow‐up | 1 | Mean Difference (IV, Random, 95% CI) | 0.0 [0.0, 0.0] | |
| 5 change in sedentary time (minutes per day); Interventions: home‐based pulmonary rehabilitation vs. centre‐based pulmonary rehabilitation Show forest plot | 1 | Mean Difference (IV, Random, 95% CI) | Totals not selected | |
| 5.1 End intervention | 1 | Mean Difference (IV, Random, 95% CI) | 0.0 [0.0, 0.0] | |
| 5.2 Follow‐up | 1 | Mean Difference (IV, Random, 95% CI) | 0.0 [0.0, 0.0] | |
| 6 change in sedentary time (awake; minutes per day); Interventions: home‐based pulmonary rehabilitation vs. centre‐based pulmonary rehabilitation Show forest plot | 1 | Mean Difference (IV, Random, 95% CI) | Totals not selected | |
| 6.1 End intervention | 1 | Mean Difference (IV, Random, 95% CI) | 0.0 [0.0, 0.0] | |
| 6.2 Follow‐up | 1 | Mean Difference (IV, Random, 95% CI) | 0.0 [0.0, 0.0] | |
| 7 change in number of sedentary bouts; Interventions: home‐based pulmonary rehabilitation vs. centre‐based pulmonary rehabilitation Show forest plot | 1 | Mean Difference (IV, Random, 95% CI) | Totals not selected | |
| 7.1 End intervention | 1 | Mean Difference (IV, Random, 95% CI) | 0.0 [0.0, 0.0] | |
| 7.2 Follow‐up | 1 | Mean Difference (IV, Random, 95% CI) | 0.0 [0.0, 0.0] | |
| 8 change in time in sedentary bouts (minutes per day); Interventions: home‐based pulmonary rehabilitation vs. centre‐based pulmonary rehabilitation Show forest plot | 1 | Mean Difference (IV, Random, 95% CI) | Totals not selected | |
| 8.1 End intervention | 1 | Mean Difference (IV, Random, 95% CI) | 0.0 [0.0, 0.0] | |
| 8.2 Follow‐up | 1 | Mean Difference (IV, Random, 95% CI) | 0.0 [0.0, 0.0] | |
| 9 change in METs; Interventions: home‐based pulmonary rehabilitation vs. centre‐based pulmonary rehabilitation Show forest plot | 1 | Mean Difference (IV, Random, 95% CI) | Totals not selected | |
| 9.1 End intervention | 1 | Mean Difference (IV, Random, 95% CI) | 0.0 [0.0, 0.0] | |
| 9.2 Follow‐up | 1 | Mean Difference (IV, Random, 95% CI) | 0.0 [0.0, 0.0] | |
| 10 change in total energy expenditure (kcal); Interventions: home‐based pulmonary rehabilitation vs. centre‐based pulmonary rehabilitation Show forest plot | 1 | Mean Difference (IV, Random, 95% CI) | Totals not selected | |
| 10.1 End intervention | 1 | Mean Difference (IV, Random, 95% CI) | 0.0 [0.0, 0.0] | |
| 10.2 Follow‐up | 1 | Mean Difference (IV, Random, 95% CI) | 0.0 [0.0, 0.0] | |
| 11 change in step count (steps per day); Interventions: water‐based exercise training vs. land‐based exercise training Show forest plot | 1 | Mean Difference (IV, Random, 95% CI) | Totals not selected | |
| 11.1 Mid‐intervention | 1 | Mean Difference (IV, Random, 95% CI) | 0.0 [0.0, 0.0] | |
| 11.2 End intervention | 1 | Mean Difference (IV, Random, 95% CI) | 0.0 [0.0, 0.0] | |
| 12 change in total energy expenditure (kcal); Interventions: water‐based exercise training vs. land‐based exercise training Show forest plot | 1 | Mean Difference (IV, Random, 95% CI) | Totals not selected | |
| 12.1 Mid‐intervention | 1 | Mean Difference (IV, Random, 95% CI) | 0.0 [0.0, 0.0] | |
| 12.2 End intervention | 1 | Mean Difference (IV, Random, 95% CI) | 0.0 [0.0, 0.0] | |
| 13 step count (steps per day); Interventions: Tai Chi vs. pulmonary rehabilitation Show forest plot | 1 | Mean Difference (IV, Random, 95% CI) | Totals not selected | |
| 13.1 Mid‐intervention (6 weeks) | 1 | Mean Difference (IV, Random, 95% CI) | 0.0 [0.0, 0.0] | |
| 13.2 Mid‐intervention (22 weeks) | 1 | Mean Difference (IV, Random, 95% CI) | 0.0 [0.0, 0.0] | |
| 14 step count (steps per day); Interventions: outdoor walking vs. cycle ergometry Show forest plot | 1 | Mean Difference (IV, Random, 95% CI) | Totals not selected | |
| 14.1 End intervention | 1 | Mean Difference (IV, Random, 95% CI) | 0.0 [0.0, 0.0] | |
| 14.2 Follow‐up | 1 | Mean Difference (IV, Random, 95% CI) | 0.0 [0.0, 0.0] | |
| 15 step count (steps per day); Interventions: physical activity counselling vs. pulmonary rehabilitation Show forest plot | 1 | Mean Difference (IV, Random, 95% CI) | Totals not selected | |
| 15.1 End intervention | 1 | Mean Difference (IV, Random, 95% CI) | 0.0 [0.0, 0.0] | |
| 15.2 Follow‐up | 1 | Mean Difference (IV, Random, 95% CI) | 0.0 [0.0, 0.0] | |
| 16 total energy expenditure (kcal); Interventions: exercise training with tapered supervision vs. supervised exercise training Show forest plot | 1 | Mean Difference (IV, Fixed, 95% CI) | Totals not selected | |
| 16.1 End intervention | 1 | Mean Difference (IV, Fixed, 95% CI) | 0.0 [0.0, 0.0] | |
| 16.2 Follow‐up | 1 | Mean Difference (IV, Fixed, 95% CI) | 0.0 [0.0, 0.0] | |
| 17 mid day activity (vector magnitude units per minute); Interventions: supplemental oxygen (lightweight ambulatory) vs. supplemental oxygen (E‐cylinder) Show forest plot | 1 | Mean Difference (IV, Random, 95% CI) | Totals not selected | |
| 17.1 Mid‐intervention | 1 | Mean Difference (IV, Random, 95% CI) | 0.0 [0.0, 0.0] | |
| 17.2 End intervention | 1 | Mean Difference (IV, Random, 95% CI) | 0.0 [0.0, 0.0] | |
| Outcome or subgroup title | No. of studies | No. of participants | Statistical method | Effect size |
| 1 change in SGRQ total score; Intervention: pulmonary rehabilitation/exercise training Show forest plot | 2 | Mean Difference (IV, Random, 95% CI) | Subtotals only | |
| 1.1 End intervention | 2 | 144 | Mean Difference (IV, Random, 95% CI) | ‐8.79 [‐14.08, ‐3.51] |
| 2 change in SGRQ domain scores. Intervention: pulmonary rehabilitation/exercise training (ground‐based walking) Show forest plot | 1 | Mean Difference (IV, Random, 95% CI) | Totals not selected | |
| 2.1 Symptoms (end intervention) | 1 | Mean Difference (IV, Random, 95% CI) | 0.0 [0.0, 0.0] | |
| 2.2 Activity (end intervention) | 1 | Mean Difference (IV, Random, 95% CI) | 0.0 [0.0, 0.0] | |
| 2.3 Impacts (end intervention) | 1 | Mean Difference (IV, Random, 95% CI) | 0.0 [0.0, 0.0] | |
| 3 change in CRQ domain scores; Intervention: pulmonary rehabilitation/exercise training Show forest plot | 3 | Mean Difference (IV, Random, 95% CI) | Subtotals only | |
| 3.1 Dyspnoea (end intervention) | 3 | 182 | Mean Difference (IV, Random, 95% CI) | 1.69 [0.02, 3.36] |
| 3.2 Emotional function (end intervention) | 3 | 182 | Mean Difference (IV, Random, 95% CI) | 2.41 [0.48, 4.35] |
| 3.3 Fatigue (end intervention) | 3 | 182 | Mean Difference (IV, Random, 95% CI) | 1.34 [‐0.16, 2.83] |
| 3.4 Mastery (end intervention) | 3 | 182 | Mean Difference (IV, Random, 95% CI) | 0.61 [‐0.47, 1.69] |
| 3.5 Total score (end intervention) | 3 | 182 | Mean Difference (IV, Random, 95% CI) | 6.70 [2.55, 10.86] |
| 4 CAT score; Intervention: high‐intensity interval training Show forest plot | 2 | Mean Difference (IV, Random, 95% CI) | Subtotals only | |
| 4.1 End intervention | 2 | 275 | Mean Difference (IV, Random, 95% CI) | ‐3.15 [‐4.82, ‐1.47] |
| 5 SGRQ domain scores (%change); Intervention: exercise training [inpatient] Show forest plot | 1 | Mean Difference (IV, Random, 95% CI) | Totals not selected | |
| 5.1 Symptoms (end intervention) | 1 | Mean Difference (IV, Random, 95% CI) | 0.0 [0.0, 0.0] | |
| 5.2 Activity (end intervention) | 1 | Mean Difference (IV, Random, 95% CI) | 0.0 [0.0, 0.0] | |
| 5.3 Impacts (end intervention) | 1 | Mean Difference (IV, Random, 95% CI) | 0.0 [0.0, 0.0] | |
| 5.4 Total score (end intervention) | 1 | Mean Difference (IV, Random, 95% CI) | 0.0 [0.0, 0.0] | |
| 5.5 Symptoms (follow‐up) | 1 | Mean Difference (IV, Random, 95% CI) | 0.0 [0.0, 0.0] | |
| 5.6 Activity (follow‐up) | 1 | Mean Difference (IV, Random, 95% CI) | 0.0 [0.0, 0.0] | |
| 5.7 Impacts (follow‐up) | 1 | Mean Difference (IV, Random, 95% CI) | 0.0 [0.0, 0.0] | |
| 5.8 Total score (follow‐up) | 1 | Mean Difference (IV, Random, 95% CI) | 0.0 [0.0, 0.0] | |
| 6 SGRQ domain scores; Intervention: physical activity counselling Show forest plot | 1 | Mean Difference (IV, Random, 95% CI) | Totals not selected | |
| 6.1 Symptoms (end intervention) | 1 | Mean Difference (IV, Random, 95% CI) | 0.0 [0.0, 0.0] | |
| 6.2 Activity (end intervention) | 1 | Mean Difference (IV, Random, 95% CI) | 0.0 [0.0, 0.0] | |
| 6.3 Impacts (end intervention) | 1 | Mean Difference (IV, Random, 95% CI) | 0.0 [0.0, 0.0] | |
| 6.4 Total score (end intervention) | 1 | Mean Difference (IV, Random, 95% CI) | 0.0 [0.0, 0.0] | |
| 7 CCQ domain scores: Intervention: physical activity counselling Show forest plot | 1 | Mean Difference (IV, Random, 95% CI) | Totals not selected | |
| 7.1 Symptoms (end intervention) | 1 | Mean Difference (IV, Random, 95% CI) | 0.0 [0.0, 0.0] | |
| 7.2 Functional state (end intervention) | 1 | Mean Difference (IV, Random, 95% CI) | 0.0 [0.0, 0.0] | |
| 7.3 Mental state (end intervention) | 1 | Mean Difference (IV, Random, 95% CI) | 0.0 [0.0, 0.0] | |
| 7.4 Total score (end intervention) | 1 | Mean Difference (IV, Random, 95% CI) | 0.0 [0.0, 0.0] | |
| 8 change in CCQ domain scores; Intervention: physical activity counselling (telecoaching) Show forest plot | 1 | Mean Difference (IV, Random, 95% CI) | Totals not selected | |
| 8.1 Symptoms (end intervention) | 1 | Mean Difference (IV, Random, 95% CI) | 0.0 [0.0, 0.0] | |
| 8.2 Functional state (end intervention) | 1 | Mean Difference (IV, Random, 95% CI) | 0.0 [0.0, 0.0] | |
| 8.3 Mental state (end intervention) | 1 | Mean Difference (IV, Random, 95% CI) | 0.0 [0.0, 0.0] | |
| 9 change in CRQ domain and total scores; Intervention: physical activity counselling Show forest plot | 1 | Mean Difference (IV, Random, 95% CI) | Totals not selected | |
| 9.1 Emotional function (end intervention) | 1 | Mean Difference (IV, Random, 95% CI) | 0.0 [0.0, 0.0] | |
| 9.2 Dyspnoea (end intervention) | 1 | Mean Difference (IV, Random, 95% CI) | 0.0 [0.0, 0.0] | |
| 9.3 Fatigue (end intervention) | 1 | Mean Difference (IV, Random, 95% CI) | 0.0 [0.0, 0.0] | |
| 9.4 Mastery (end intervention) | 1 | Mean Difference (IV, Random, 95% CI) | 0.0 [0.0, 0.0] | |
| 9.5 Total (end intervention) | 1 | Mean Difference (IV, Random, 95% CI) | 0.0 [0.0, 0.0] | |
| 10 change in SGRQ domain and total scores; Intervention: physical activity counselling Show forest plot | 1 | Mean Difference (IV, Random, 95% CI) | Totals not selected | |
| 10.1 Symptoms (end intervention) | 1 | Mean Difference (IV, Random, 95% CI) | 0.0 [0.0, 0.0] | |
| 10.2 Activity (end intervention) | 1 | Mean Difference (IV, Random, 95% CI) | 0.0 [0.0, 0.0] | |
| 10.3 Impacts (end intervention) | 1 | Mean Difference (IV, Random, 95% CI) | 0.0 [0.0, 0.0] | |
| 10.4 Total (end intervention) | 1 | Mean Difference (IV, Random, 95% CI) | 0.0 [0.0, 0.0] | |
| 11 change in CRQ domain scores; Intervention: self‐management (SPACE) Show forest plot | 1 | Mean Difference (IV, Random, 95% CI) | Totals not selected | |
| 11.1 Dyspnoea (end intervention) | 1 | Mean Difference (IV, Random, 95% CI) | 0.0 [0.0, 0.0] | |
| 11.2 Emotional function (end intervention) | 1 | Mean Difference (IV, Random, 95% CI) | 0.0 [0.0, 0.0] | |
| 11.3 Fatigue (end intervention) | 1 | Mean Difference (IV, Random, 95% CI) | 0.0 [0.0, 0.0] | |
| 11.4 Mastery (end intervention) | 1 | Mean Difference (IV, Random, 95% CI) | 0.0 [0.0, 0.0] | |
| 11.5 Dyspnoea (follow‐up) | 1 | Mean Difference (IV, Random, 95% CI) | 0.0 [0.0, 0.0] | |
| 11.6 Emotional domain (follow‐up) | 1 | Mean Difference (IV, Random, 95% CI) | 0.0 [0.0, 0.0] | |
| 11.7 Fatigue (follow‐up) | 1 | Mean Difference (IV, Random, 95% CI) | 0.0 [0.0, 0.0] | |
| 11.8 Mastery (follow‐up) | 1 | Mean Difference (IV, Random, 95% CI) | 0.0 [0.0, 0.0] | |
| 12 CCQ total score; Intervention: self‐management Show forest plot | 1 | Mean Difference (IV, Random, 95% CI) | Totals not selected | |
| 12.1 Mid‐intervention (4 weeks) | 1 | Mean Difference (IV, Random, 95% CI) | 0.0 [0.0, 0.0] | |
| 12.2 Mid‐intervention (12 weeks) | 1 | Mean Difference (IV, Random, 95% CI) | 0.0 [0.0, 0.0] | |
| 13 EQ5D index score; Intervention: self‐management Show forest plot | 1 | Mean Difference (IV, Random, 95% CI) | Totals not selected | |
| 13.1 Mid‐intervention (4 weeks) | 1 | Mean Difference (IV, Random, 95% CI) | 0.0 [0.0, 0.0] | |
| 13.2 Mid‐intervention (12 weeks) | 1 | Mean Difference (IV, Random, 95% CI) | 0.0 [0.0, 0.0] | |
| 14 EQ5D visual analogue scale score; Intervention: self‐management Show forest plot | 1 | Mean Difference (IV, Random, 95% CI) | Totals not selected | |
| 14.1 Mid‐intervention (4 weeks) | 1 | Mean Difference (IV, Random, 95% CI) | 0.0 [0.0, 0.0] | |
| 14.2 Mid‐intervention (12 weeks) | 1 | Mean Difference (IV, Random, 95% CI) | 0.0 [0.0, 0.0] | |
| 15 SGRQ domain scores; Intervention: self‐management (telephone health coaching) Show forest plot | 1 | Mean Difference (IV, Random, 95% CI) | Totals not selected | |
| 15.1 Symptoms (end intervention) | 1 | Mean Difference (IV, Random, 95% CI) | 0.0 [0.0, 0.0] | |
| 15.2 Activity (end intervention) | 1 | Mean Difference (IV, Random, 95% CI) | 0.0 [0.0, 0.0] | |
| 15.3 Impacts (end intervention) | 1 | Mean Difference (IV, Random, 95% CI) | 0.0 [0.0, 0.0] | |
| 15.4 Total score (end intervention) | 1 | Mean Difference (IV, Random, 95% CI) | 0.0 [0.0, 0.0] | |
| 15.5 Symptoms (follow‐up) | 1 | Mean Difference (IV, Random, 95% CI) | 0.0 [0.0, 0.0] | |
| 15.6 Activity (follow‐up) | 1 | Mean Difference (IV, Random, 95% CI) | 0.0 [0.0, 0.0] | |
| 15.7 Impacts (follow‐up) | 1 | Mean Difference (IV, Random, 95% CI) | 0.0 [0.0, 0.0] | |
| 15.8 Total score (follow‐up) | 1 | Mean Difference (IV, Random, 95% CI) | 0.0 [0.0, 0.0] | |
| 16 EQ5D score; Intervention: self‐management (telephone health coaching) Show forest plot | 1 | Mean Difference (IV, Random, 95% CI) | Totals not selected | |
| 16.1 End intervention | 1 | Mean Difference (IV, Random, 95% CI) | 0.0 [0.0, 0.0] | |
| 16.2 Follow‐up | 1 | Mean Difference (IV, Random, 95% CI) | 0.0 [0.0, 0.0] | |
| 17 CRQ domain scores; Intervention: four‐wheeled walker Show forest plot | 1 | Mean Difference (IV, Random, 95% CI) | Totals not selected | |
| 17.1 Dyspnoea (end intervention) | 1 | Mean Difference (IV, Random, 95% CI) | 0.0 [0.0, 0.0] | |
| 17.2 Emotional function (end intervention) | 1 | Mean Difference (IV, Random, 95% CI) | 0.0 [0.0, 0.0] | |
| 17.3 Fatigue (end intervention) | 1 | Mean Difference (IV, Random, 95% CI) | 0.0 [0.0, 0.0] | |
| 17.4 Mastery (end intervention) | 1 | Mean Difference (IV, Random, 95% CI) | 0.0 [0.0, 0.0] | |
| Outcome or subgroup title | No. of studies | No. of participants | Statistical method | Effect size |
| 1 change in SF36 component scores; Intervention: singing Show forest plot | 1 | Mean Difference (IV, Random, 95% CI) | Totals not selected | |
| 1.1 Physical component (end intervention) | 1 | Mean Difference (IV, Random, 95% CI) | 0.0 [0.0, 0.0] | |
| 1.2 Mental component (end intervention) | 1 | Mean Difference (IV, Random, 95% CI) | 0.0 [0.0, 0.0] | |
| 2 change in CRQ total score; Intervention: neuromuscular electrical stimulation Show forest plot | 1 | Mean Difference (IV, Random, 95% CI) | Totals not selected | |
| 2.1 End intervention | 1 | Mean Difference (IV, Random, 95% CI) | 0.0 [0.0, 0.0] | |
| 2.2 Follow‐up | 1 | Mean Difference (IV, Random, 95% CI) | 0.0 [0.0, 0.0] | |
| 3 change in SGRQ total score; Intervention: neuromuscular electrical stimulation Show forest plot | 1 | Mean Difference (IV, Random, 95% CI) | Totals not selected | |
| 3.1 End intervention | 1 | Mean Difference (IV, Random, 95% CI) | 0.0 [0.0, 0.0] | |
| 3.2 Follow‐up | 1 | Mean Difference (IV, Random, 95% CI) | 0.0 [0.0, 0.0] | |
| 4 change in EQ5D index score; Intervention: neuromuscular electrical stimulation Show forest plot | 1 | Mean Difference (IV, Random, 95% CI) | Totals not selected | |
| 4.1 End intervention | 1 | Mean Difference (IV, Random, 95% CI) | 0.0 [0.0, 0.0] | |
| 4.2 Follow‐up | 1 | Mean Difference (IV, Random, 95% CI) | 0.0 [0.0, 0.0] | |
| 5 change in EQ5D visual analogue scale score; Intervention: neuromuscular electrical stimulation Show forest plot | 1 | Mean Difference (IV, Random, 95% CI) | Totals not selected | |
| 5.1 End intervention | 1 | Mean Difference (IV, Random, 95% CI) | 0.0 [0.0, 0.0] | |
| 5.2 Follow‐up | 1 | Mean Difference (IV, Random, 95% CI) | 0.0 [0.0, 0.0] | |
| Outcome or subgroup title | No. of studies | No. of participants | Statistical method | Effect size |
| 1 SF36 component scores (score < 50); Interventions: Nordic walking with education vs. education Show forest plot | 1 | Mean Difference (IV, Random, 95% CI) | Totals not selected | |
| 1.1 Physical component score (end intervention) | 1 | Mean Difference (IV, Random, 95% CI) | 0.0 [0.0, 0.0] | |
| 1.2 Physical component score (follow‐up, 6 months) | 1 | Mean Difference (IV, Random, 95% CI) | 0.0 [0.0, 0.0] | |
| 1.3 Physical component score (follow‐up, 9 months) | 1 | Mean Difference (IV, Random, 95% CI) | 0.0 [0.0, 0.0] | |
| 1.4 Mental component score (end intervention) | 1 | Mean Difference (IV, Random, 95% CI) | 0.0 [0.0, 0.0] | |
| 1.5 Mental component score (follow‐up, 6 months) | 1 | Mean Difference (IV, Random, 95% CI) | 0.0 [0.0, 0.0] | |
| 1.6 Mental component score (follow‐up, 9 months) | 1 | Mean Difference (IV, Random, 95% CI) | 0.0 [0.0, 0.0] | |
| 2 change in CRQ domain scores; Interventions: exercise training (COPE‐active) with self‐management vs. self management Show forest plot | 1 | Mean Difference (IV, Random, 95% CI) | Totals not selected | |
| 2.1 Dyspnoea (mid‐intervention) | 1 | Mean Difference (IV, Random, 95% CI) | 0.0 [0.0, 0.0] | |
| 2.2 Emotional function (mid‐intervention) | 1 | Mean Difference (IV, Random, 95% CI) | 0.0 [0.0, 0.0] | |
| 2.3 Fatigue (mid‐intervention) | 1 | Mean Difference (IV, Random, 95% CI) | 0.0 [0.0, 0.0] | |
| 2.4 Mastery (mid‐intervention) | 1 | Mean Difference (IV, Random, 95% CI) | 0.0 [0.0, 0.0] | |
| 2.5 Dyspnoea (end intervention) | 1 | Mean Difference (IV, Random, 95% CI) | 0.0 [0.0, 0.0] | |
| 2.6 Emotional function (end intervention) | 1 | Mean Difference (IV, Random, 95% CI) | 0.0 [0.0, 0.0] | |
| 2.7 Fatigue (end intervention) | 1 | Mean Difference (IV, Random, 95% CI) | 0.0 [0.0, 0.0] | |
| 2.8 Mastery (end intervention) | 1 | Mean Difference (IV, Random, 95% CI) | 0.0 [0.0, 0.0] | |
| 2.9 Dyspnoea (follow‐up, 18 months) | 1 | Mean Difference (IV, Random, 95% CI) | 0.0 [0.0, 0.0] | |
| 2.10 Emotional function (follow‐up, 18 months) | 1 | Mean Difference (IV, Random, 95% CI) | 0.0 [0.0, 0.0] | |
| 2.11 Fatigue (follow‐up, 18 months) | 1 | Mean Difference (IV, Random, 95% CI) | 0.0 [0.0, 0.0] | |
| 2.12 Mastery (follow‐up, 18 months) | 1 | Mean Difference (IV, Random, 95% CI) | 0.0 [0.0, 0.0] | |
| 2.13 Dyspnoea (follow‐up, 24 months) | 1 | Mean Difference (IV, Random, 95% CI) | 0.0 [0.0, 0.0] | |
| 2.14 Emotional function (follow‐up, 24 months) | 1 | Mean Difference (IV, Random, 95% CI) | 0.0 [0.0, 0.0] | |
| 2.15 Fatigue (follow‐up, 24 months) | 1 | Mean Difference (IV, Random, 95% CI) | 0.0 [0.0, 0.0] | |
| 2.16 Mastery (follow‐up, 24 months) | 1 | Mean Difference (IV, Random, 95% CI) | 0.0 [0.0, 0.0] | |
| 3 change in CCQ domain scores; Interventions: exercise training (COPE‐active) with self‐management vs. self management Show forest plot | 1 | Mean Difference (IV, Random, 95% CI) | Totals not selected | |
| 3.1 Symptoms (mid‐intervention) | 1 | Mean Difference (IV, Random, 95% CI) | 0.0 [0.0, 0.0] | |
| 3.2 Functional state (mid‐intervention) | 1 | Mean Difference (IV, Random, 95% CI) | 0.0 [0.0, 0.0] | |
| 3.3 Mental state (mid‐intervention) | 1 | Mean Difference (IV, Random, 95% CI) | 0.0 [0.0, 0.0] | |
| 3.4 Total (mid‐intervention) | 1 | Mean Difference (IV, Random, 95% CI) | 0.0 [0.0, 0.0] | |
| 3.5 Symptoms (end intervention) | 1 | Mean Difference (IV, Random, 95% CI) | 0.0 [0.0, 0.0] | |
| 3.6 Functional state (end intervention) | 1 | Mean Difference (IV, Random, 95% CI) | 0.0 [0.0, 0.0] | |
| 3.7 Mental state (end intervention) | 1 | Mean Difference (IV, Random, 95% CI) | 0.0 [0.0, 0.0] | |
| 3.8 Total (end intervention) | 1 | Mean Difference (IV, Random, 95% CI) | 0.0 [0.0, 0.0] | |
| 3.9 Symptoms (follow‐up, 18 months) | 1 | Mean Difference (IV, Random, 95% CI) | 0.0 [0.0, 0.0] | |
| 3.10 Functional state (follow‐up, 18 months) | 1 | Mean Difference (IV, Random, 95% CI) | 0.0 [0.0, 0.0] | |
| 3.11 Mental state (follow‐up, 18 months) | 1 | Mean Difference (IV, Random, 95% CI) | 0.0 [0.0, 0.0] | |
| 3.12 Total (follow‐up, 18 months) | 1 | Mean Difference (IV, Random, 95% CI) | 0.0 [0.0, 0.0] | |
| 3.13 Symptoms (follow‐up, 24 months) | 1 | Mean Difference (IV, Random, 95% CI) | 0.0 [0.0, 0.0] | |
| 3.14 Functional state (follow‐up, 24 months) | 1 | Mean Difference (IV, Random, 95% CI) | 0.0 [0.0, 0.0] | |
| 3.15 Mental state (follow‐up, 24 months) | 1 | Mean Difference (IV, Random, 95% CI) | 0.0 [0.0, 0.0] | |
| 3.16 Total (follow‐up, 24 months) | 1 | Mean Difference (IV, Random, 95% CI) | 0.0 [0.0, 0.0] | |
| 4 CRQ domain scores; Interventions: LAMA/LABA and exercise training with behaviour modification vs. placebo with behaviour modification Show forest plot | 1 | Mean Difference (IV, Random, 95% CI) | Totals not selected | |
| 4.1 Dyspnoea (mid‐intervention) | 1 | Mean Difference (IV, Random, 95% CI) | 0.0 [0.0, 0.0] | |
| 4.2 Fatigue (mid‐intervention) | 1 | Mean Difference (IV, Random, 95% CI) | 0.0 [0.0, 0.0] | |
| 4.3 Emotional function (mid‐intervention) | 1 | Mean Difference (IV, Random, 95% CI) | 0.0 [0.0, 0.0] | |
| 4.4 Mastery (mid‐intervention) | 1 | Mean Difference (IV, Random, 95% CI) | 0.0 [0.0, 0.0] | |
| 4.5 Dyspnoea (end intervention) | 1 | Mean Difference (IV, Random, 95% CI) | 0.0 [0.0, 0.0] | |
| 4.6 Fatigue (end intervention) | 1 | Mean Difference (IV, Random, 95% CI) | 0.0 [0.0, 0.0] | |
| 4.7 Emotional function (end intervention) | 1 | Mean Difference (IV, Random, 95% CI) | 0.0 [0.0, 0.0] | |
| 4.8 Mastery (end intervention) | 1 | Mean Difference (IV, Random, 95% CI) | 0.0 [0.0, 0.0] | |
| 5 CRQ domain scores; Interventions: exercise training and LABA with LAMA and behaviour modification vs. LAMA and behaviour modification Show forest plot | 1 | Mean Difference (IV, Random, 95% CI) | Totals not selected | |
| 5.1 Dyspnoea (mid‐intervention) | 1 | Mean Difference (IV, Random, 95% CI) | 0.0 [0.0, 0.0] | |
| 5.2 Fatigue (mid‐intervention) | 1 | Mean Difference (IV, Random, 95% CI) | 0.0 [0.0, 0.0] | |
| 5.3 Emotional function (mid‐intervention) | 1 | Mean Difference (IV, Random, 95% CI) | 0.0 [0.0, 0.0] | |
| 5.4 Mastery (mid‐intervention) | 1 | Mean Difference (IV, Random, 95% CI) | 0.0 [0.0, 0.0] | |
| 5.5 Dyspnoea (end intervention) | 1 | Mean Difference (IV, Random, 95% CI) | 0.0 [0.0, 0.0] | |
| 5.6 Fatigue (end intervention) | 1 | Mean Difference (IV, Random, 95% CI) | 0.0 [0.0, 0.0] | |
| 5.7 Emotional function (end intervention) | 1 | Mean Difference (IV, Random, 95% CI) | 0.0 [0.0, 0.0] | |
| 5.8 Mastery (end intervention) | 1 | Mean Difference (IV, Random, 95% CI) | 0.0 [0.0, 0.0] | |
| 6 CRQ domain scores; Interventions: exercise training with LAMA/LABA and behaviour modification vs. LAMA/LABA and behaviour modification Show forest plot | 1 | Mean Difference (IV, Random, 95% CI) | Totals not selected | |
| 6.1 Dyspnoea (mid‐intervention) | 1 | Mean Difference (IV, Random, 95% CI) | 0.0 [0.0, 0.0] | |
| 6.2 Fatigue (mid‐intervention) | 1 | Mean Difference (IV, Random, 95% CI) | 0.0 [0.0, 0.0] | |
| 6.3 Emotional function (mid‐intervention) | 1 | Mean Difference (IV, Random, 95% CI) | 0.0 [0.0, 0.0] | |
| 6.4 Mastery (mid‐intervention) | 1 | Mean Difference (IV, Random, 95% CI) | 0.0 [0.0, 0.0] | |
| 6.5 Dyspnoea (end intervention) | 1 | Mean Difference (IV, Random, 95% CI) | 0.0 [0.0, 0.0] | |
| 6.6 Fatigue (end intervention) | 1 | Mean Difference (IV, Random, 95% CI) | 0.0 [0.0, 0.0] | |
| 6.7 Emotional function (end intervention) | 1 | Mean Difference (IV, Random, 95% CI) | 0.0 [0.0, 0.0] | |
| 6.8 Mastery (end intervention) | 1 | Mean Difference (IV, Random, 95% CI) | 0.0 [0.0, 0.0] | |
| 7 change in SGRQ domain and total scores; Intervention: exercise training and physical activity counselling with pedometer vs. pedometer Show forest plot | 1 | Mean Difference (IV, Random, 95% CI) | Totals not selected | |
| 7.1 Symptoms (end intervention) | 1 | Mean Difference (IV, Random, 95% CI) | 0.0 [0.0, 0.0] | |
| 7.2 Activity (end intervention) | 1 | Mean Difference (IV, Random, 95% CI) | 0.0 [0.0, 0.0] | |
| 7.3 Impacts (end intervention) | 1 | Mean Difference (IV, Random, 95% CI) | 0.0 [0.0, 0.0] | |
| 7.4 Total (end intervention) | 1 | Mean Difference (IV, Random, 95% CI) | 0.0 [0.0, 0.0] | |
| 7.5 Symptoms (follow‐up, 3 months) | 1 | Mean Difference (IV, Random, 95% CI) | 0.0 [0.0, 0.0] | |
| 7.6 Activity (follow‐up, 3 months) | 1 | Mean Difference (IV, Random, 95% CI) | 0.0 [0.0, 0.0] | |
| 7.7 Impacts (follow‐up, 3 months) | 1 | Mean Difference (IV, Random, 95% CI) | 0.0 [0.0, 0.0] | |
| 7.8 Total (follow‐up, 3 months) | 1 | Mean Difference (IV, Random, 95% CI) | 0.0 [0.0, 0.0] | |
| 7.9 Symptoms (follow‐up, 12 months) | 1 | Mean Difference (IV, Random, 95% CI) | 0.0 [0.0, 0.0] | |
| 7.10 Activity (follow‐up, 12 months) | 1 | Mean Difference (IV, Random, 95% CI) | 0.0 [0.0, 0.0] | |
| 7.11 Impacts (follow‐up, 12 months) | 1 | Mean Difference (IV, Random, 95% CI) | 0.0 [0.0, 0.0] | |
| 7.12 Total (follow‐up, 12 months) | 1 | Mean Difference (IV, Random, 95% CI) | 0.0 [0.0, 0.0] | |
| 8 change in CRQ domain scores; Interventions: physical activity counselling (app) with optional supervised exercise vs. optional supervised exercise Show forest plot | 1 | Mean Difference (IV, Random, 95% CI) | Totals not selected | |
| 8.1 Dyspnoea (12 weeks, mid‐intervention) | 1 | Mean Difference (IV, Random, 95% CI) | 0.0 [0.0, 0.0] | |
| 8.2 Emotional function (12 weeks, mid‐intervention) | 1 | Mean Difference (IV, Random, 95% CI) | 0.0 [0.0, 0.0] | |
| 8.3 Fatigue (12 weeks, mid‐intervention) | 1 | Mean Difference (IV, Random, 95% CI) | 0.0 [0.0, 0.0] | |
| 8.4 Mastery (12 weeks, mid‐intervention) | 1 | Mean Difference (IV, Random, 95% CI) | 0.0 [0.0, 0.0] | |
| 8.5 Dyspnoea (6 months, mid‐intervention) | 1 | Mean Difference (IV, Random, 95% CI) | 0.0 [0.0, 0.0] | |
| 8.6 Emotional function (6 months, mid‐intervention) | 1 | Mean Difference (IV, Random, 95% CI) | 0.0 [0.0, 0.0] | |
| 8.7 Fatigue (6 months, mid‐intervention) | 1 | Mean Difference (IV, Random, 95% CI) | 0.0 [0.0, 0.0] | |
| 8.8 Mastery (6 months, mid‐intervention) | 1 | Mean Difference (IV, Random, 95% CI) | 0.0 [0.0, 0.0] | |
| 8.9 Dyspnoea (end intervention) | 1 | Mean Difference (IV, Random, 95% CI) | 0.0 [0.0, 0.0] | |
| 8.10 Emotional function (end intervention) | 1 | Mean Difference (IV, Random, 95% CI) | 0.0 [0.0, 0.0] | |
| 8.11 Fatigue (end intervention) | 1 | Mean Difference (IV, Random, 95% CI) | 0.0 [0.0, 0.0] | |
| 8.12 Mastery (end intervention) | 1 | Mean Difference (IV, Random, 95% CI) | 0.0 [0.0, 0.0] | |
| 9 change in SGRQ total score; Interventions: physical activity counselling with pedometer vs. pedometer Show forest plot | 2 | Mean Difference (IV, Random, 95% CI) | Totals not selected | |
| 9.1 web‐based (12 weeks, end intervention) | 1 | Mean Difference (IV, Random, 95% CI) | 0.0 [0.0, 0.0] | |
| 9.2 web‐based (mid‐intervention) | 1 | Mean Difference (IV, Random, 95% CI) | 0.0 [0.0, 0.0] | |
| 9.3 web‐based (12 months, end intervention) | 1 | Mean Difference (IV, Random, 95% CI) | 0.0 [0.0, 0.0] | |
| 10 SGRQ total: Interventions: physical activity counselling (app) with pedometer vs. pedometer Show forest plot | 1 | Mean Difference (IV, Random, 95% CI) | Totals not selected | |
| 10.1 Mid‐intervention | 1 | Mean Difference (IV, Random, 95% CI) | 0.0 [0.0, 0.0] | |
| 10.2 End intervention | 1 | Mean Difference (IV, Random, 95% CI) | 0.0 [0.0, 0.0] | |
| 11 SF36: Interventions: physical activity counselling (app) with pedometer vs. pedometer Show forest plot | 1 | Mean Difference (IV, Random, 95% CI) | Totals not selected | |
| 11.1 Physical component score (end intervention) | 1 | Mean Difference (IV, Random, 95% CI) | 0.0 [0.0, 0.0] | |
| 11.2 Mental component score (end intervention) | 1 | Mean Difference (IV, Random, 95% CI) | 0.0 [0.0, 0.0] | |
| 12 change in SGRQ domain scores; Interventions: physical activity counselling (web‐based) with pedometer vs. pedometer Show forest plot | 1 | Mean Difference (IV, Random, 95% CI) | Totals not selected | |
| 12.1 Symptoms (mid‐intervention) | 1 | Mean Difference (IV, Random, 95% CI) | 0.0 [0.0, 0.0] | |
| 12.2 Impacts (mid‐intervention) | 1 | Mean Difference (IV, Random, 95% CI) | 0.0 [0.0, 0.0] | |
| 12.3 Activities (mid‐intervention) | 1 | Mean Difference (IV, Random, 95% CI) | 0.0 [0.0, 0.0] | |
| 12.4 Symptoms (end intervention) | 1 | Mean Difference (IV, Random, 95% CI) | 0.0 [0.0, 0.0] | |
| 12.5 Impacts (end intervention) | 1 | Mean Difference (IV, Random, 95% CI) | 0.0 [0.0, 0.0] | |
| 12.6 Activities (end intervention) | 1 | Mean Difference (IV, Random, 95% CI) | 0.0 [0.0, 0.0] | |
| 13 SGRQ domain scores; Interventions: physical activity counselling with pulmonary rehabilitation vs. pulmonary rehabilitation Show forest plot | 1 | Mean Difference (IV, Random, 95% CI) | Totals not selected | |
| 13.1 Symptoms (end intervention) | 1 | Mean Difference (IV, Random, 95% CI) | 0.0 [0.0, 0.0] | |
| 13.2 Activity (end intervention) | 1 | Mean Difference (IV, Random, 95% CI) | 0.0 [0.0, 0.0] | |
| 13.3 Impacts (end intervention) | 1 | Mean Difference (IV, Random, 95% CI) | 0.0 [0.0, 0.0] | |
| 14 RAND36 domain scores; Interventions: physical activity counselling with pulmonary rehabilitation vs. pulmonary rehabilitation Show forest plot | 1 | Mean Difference (IV, Random, 95% CI) | Totals not selected | |
| 14.1 Physical function (end intervention) | 1 | Mean Difference (IV, Random, 95% CI) | 0.0 [0.0, 0.0] | |
| 14.2 Vitality (end intervention) | 1 | Mean Difference (IV, Random, 95% CI) | 0.0 [0.0, 0.0] | |
| 14.3 Bodily pain (end intervention) | 1 | Mean Difference (IV, Random, 95% CI) | 0.0 [0.0, 0.0] | |
| 14.4 General health perception (end intervention) | 1 | Mean Difference (IV, Random, 95% CI) | 0.0 [0.0, 0.0] | |
| 14.5 Health status (end intervention) | 1 | Mean Difference (IV, Random, 95% CI) | 0.0 [0.0, 0.0] | |
| 15 change in CRQ dyspnoea domain score; Interventions: physical activity counselling with pulmonary rehabilitation vs. pulmonary rehabilitation Show forest plot | 1 | Mean Difference (IV, Random, 95% CI) | Totals not selected | |
| 15.1 Mid‐intervention (end PR) | 1 | Mean Difference (IV, Random, 95% CI) | 0.0 [0.0, 0.0] | |
| 15.2 End intervention | 1 | Mean Difference (IV, Random, 95% CI) | 0.0 [0.0, 0.0] | |
| 16 SGRQ scores; Interventions: physical activity counselling with pulmonary rehabilitation vs. pulmonary rehabilitation Show forest plot | 1 | Mean Difference (IV, Random, 95% CI) | Totals not selected | |
| 16.1 Symptoms (mid‐intervention) | 1 | Mean Difference (IV, Random, 95% CI) | 0.0 [0.0, 0.0] | |
| 16.2 Activity (mid‐intervention) | 1 | Mean Difference (IV, Random, 95% CI) | 0.0 [0.0, 0.0] | |
| 16.3 Impacts (mid‐intervention) | 1 | Mean Difference (IV, Random, 95% CI) | 0.0 [0.0, 0.0] | |
| 16.4 Total score (mid‐intervention) | 1 | Mean Difference (IV, Random, 95% CI) | 0.0 [0.0, 0.0] | |
| 16.5 Symptoms (end intervention) | 1 | Mean Difference (IV, Random, 95% CI) | 0.0 [0.0, 0.0] | |
| 16.6 Activity (end intervention) | 1 | Mean Difference (IV, Random, 95% CI) | 0.0 [0.0, 0.0] | |
| 16.7 Impacts (end intervention) | 1 | Mean Difference (IV, Random, 95% CI) | 0.0 [0.0, 0.0] | |
| 16.8 Total score (end intervention) | 1 | Mean Difference (IV, Random, 95% CI) | 0.0 [0.0, 0.0] | |
| 17 CRQ domain scores; Interventions: physical activity counselling with pulmonary rehabilitation vs. pulmonary rehabilitation Show forest plot | 1 | Mean Difference (IV, Random, 95% CI) | Totals not selected | |
| 17.1 Dyspnoea (end intervention) | 1 | Mean Difference (IV, Random, 95% CI) | 0.0 [0.0, 0.0] | |
| 17.2 Emotional function (end intervention) | 1 | Mean Difference (IV, Random, 95% CI) | 0.0 [0.0, 0.0] | |
| 17.3 Fatigue (end intervention) | 1 | Mean Difference (IV, Random, 95% CI) | 0.0 [0.0, 0.0] | |
| 17.4 Mastery (end intervention) | 1 | Mean Difference (IV, Random, 95% CI) | 0.0 [0.0, 0.0] | |
| 17.5 Total score (end intervention) | 1 | Mean Difference (IV, Random, 95% CI) | 0.0 [0.0, 0.0] | |
| 18 change in CRQ total score; Interventions: physical activity counselling with pulmonary rehabilitation vs. sham intervention with pulmonary rehabilitation Show forest plot | 1 | Mean Difference (IV, Random, 95% CI) | Totals not selected | |
| 18.1 Mid‐intervention | 1 | Mean Difference (IV, Random, 95% CI) | 0.0 [0.0, 0.0] | |
| 18.2 End intervention | 1 | Mean Difference (IV, Random, 95% CI) | 0.0 [0.0, 0.0] | |
| 19 change in CRQ scores; Interventions: self‐management (health coaching) with pulmonary rehabilitation referral vs. pulmonary rehabilitation referral Show forest plot | 1 | Mean Difference (IV, Random, 95% CI) | Totals not selected | |
| 19.1 Physical function (mid‐intervention) | 1 | Mean Difference (IV, Random, 95% CI) | 0.0 [0.0, 0.0] | |
| 19.2 Emotional function (mid‐intervention) | 1 | Mean Difference (IV, Random, 95% CI) | 0.0 [0.0, 0.0] | |
| 19.3 Physical function (end intervention) | 1 | Mean Difference (IV, Random, 95% CI) | 0.0 [0.0, 0.0] | |
| 19.4 Emotional function (end intervention) | 1 | Mean Difference (IV, Random, 95% CI) | 0.0 [0.0, 0.0] | |
| 20 CRQ domain scores; Interventions: LAMA with behaviour modification vs. placebo with behaviour modification Show forest plot | 1 | Mean Difference (IV, Random, 95% CI) | Totals not selected | |
| 20.1 Dyspnoea (mid‐intervention) | 1 | Mean Difference (IV, Random, 95% CI) | 0.0 [0.0, 0.0] | |
| 20.2 Fatigue (mid‐intervention) | 1 | Mean Difference (IV, Random, 95% CI) | 0.0 [0.0, 0.0] | |
| 20.3 Emotional function (mid‐intervention) | 1 | Mean Difference (IV, Random, 95% CI) | 0.0 [0.0, 0.0] | |
| 20.4 Mastery (mid‐intervention) | 1 | Mean Difference (IV, Random, 95% CI) | 0.0 [0.0, 0.0] | |
| 20.5 Dyspnoea (end intervention) | 1 | Mean Difference (IV, Random, 95% CI) | 0.0 [0.0, 0.0] | |
| 20.6 Fatigue (end intervention) | 1 | Mean Difference (IV, Random, 95% CI) | 0.0 [0.0, 0.0] | |
| 20.7 Emotional function (end intervention) | 1 | Mean Difference (IV, Random, 95% CI) | 0.0 [0.0, 0.0] | |
| 20.8 Mastery (end intervention) | 1 | Mean Difference (IV, Random, 95% CI) | 0.0 [0.0, 0.0] | |
| 21 CRQ domain scores; Interventions: LAMA/LABA with behaviour modification vs. placebo with behaviour modification Show forest plot | 1 | Mean Difference (IV, Random, 95% CI) | Totals not selected | |
| 21.1 Dyspnoea (mid‐intervention) | 1 | Mean Difference (IV, Random, 95% CI) | 0.0 [0.0, 0.0] | |
| 21.2 Fatigue (mid‐intervention) | 1 | Mean Difference (IV, Random, 95% CI) | 0.0 [0.0, 0.0] | |
| 21.3 Emotional function (mid‐intervention) | 1 | Mean Difference (IV, Random, 95% CI) | 0.0 [0.0, 0.0] | |
| 21.4 Mastery (mid‐intervention) | 1 | Mean Difference (IV, Random, 95% CI) | 0.0 [0.0, 0.0] | |
| 21.5 Dyspnoea (end intervention) | 1 | Mean Difference (IV, Random, 95% CI) | 0.0 [0.0, 0.0] | |
| 21.6 Fatigue (end intervention) | 1 | Mean Difference (IV, Random, 95% CI) | 0.0 [0.0, 0.0] | |
| 21.7 Emotional function (end intervention) | 1 | Mean Difference (IV, Random, 95% CI) | 0.0 [0.0, 0.0] | |
| 21.8 Mastery (end intervention) | 1 | Mean Difference (IV, Random, 95% CI) | 0.0 [0.0, 0.0] | |
| 22 CRQ domain scores; Interventions: LABA with LAMA and behaviour modification vs. LAMA and behaviour modification Show forest plot | 1 | Mean Difference (IV, Random, 95% CI) | Totals not selected | |
| 22.1 Dyspnoea (mid‐intervention) | 1 | Mean Difference (IV, Random, 95% CI) | 0.0 [0.0, 0.0] | |
| 22.2 Fatigue (mid‐intervention) | 1 | Mean Difference (IV, Random, 95% CI) | 0.0 [0.0, 0.0] | |
| 22.3 Emotional function (mid‐intervention) | 1 | Mean Difference (IV, Random, 95% CI) | 0.0 [0.0, 0.0] | |
| 22.4 Mastery (mid‐intervention) | 1 | Mean Difference (IV, Random, 95% CI) | 0.0 [0.0, 0.0] | |
| 22.5 Dyspnoea (end intervention) | 1 | Mean Difference (IV, Random, 95% CI) | 0.0 [0.0, 0.0] | |
| 22.6 Fatigue (end intervention) | 1 | Mean Difference (IV, Random, 95% CI) | 0.0 [0.0, 0.0] | |
| 22.7 Emotional function (end intervention) | 1 | Mean Difference (IV, Random, 95% CI) | 0.0 [0.0, 0.0] | |
| 22.8 Mastery (end intervention) | 1 | Mean Difference (IV, Random, 95% CI) | 0.0 [0.0, 0.0] | |
| 23 change in SGRQ domain and total scores; Interventions: ACE inhibitor with pulmonary rehabilitation vs. placebo with pulmonary rehabilitation Show forest plot | 1 | Mean Difference (IV, Fixed, 95% CI) | Totals not selected | |
| 23.1 Symptoms (end intervention) | 1 | Mean Difference (IV, Fixed, 95% CI) | 0.0 [0.0, 0.0] | |
| 23.2 Activity (end intervention) | 1 | Mean Difference (IV, Fixed, 95% CI) | 0.0 [0.0, 0.0] | |
| 23.3 Impacts (end intervention) | 1 | Mean Difference (IV, Fixed, 95% CI) | 0.0 [0.0, 0.0] | |
| 23.4 Total (end intervention) | 1 | Mean Difference (IV, Fixed, 95% CI) | 0.0 [0.0, 0.0] | |
| 24 change in SGRQ total score; Interventions: nutritional supplement with pulmonary rehabilitation vs. placebo with pulmonary rehabilitation Show forest plot | 1 | Mean Difference (IV, Random, 95% CI) | Totals not selected | |
| 24.1 End intervention (stage 2) | 1 | Mean Difference (IV, Random, 95% CI) | 0.0 [0.0, 0.0] | |
| 24.2 Follow‐up | 1 | Mean Difference (IV, Random, 95% CI) | 0.0 [0.0, 0.0] | |
| 25 change in EQ5D; Interventions: nutritional supplement with pulmonary rehabilitation vs. placebo with pulmonary rehabilitation Show forest plot | 1 | Mean Difference (IV, Random, 95% CI) | Totals not selected | |
| 25.1 End intervention (stage 2) | 1 | Mean Difference (IV, Random, 95% CI) | 0.0 [0.0, 0.0] | |
| 25.2 Follow‐up | 1 | Mean Difference (IV, Random, 95% CI) | 0.0 [0.0, 0.0] | |
| 26 change in CRQ domain scores; Interventions: supplemental oxygen with pulmonary rehabilitation vs. sham intervention with pulmonary rehabilitation Show forest plot | 1 | Mean Difference (IV, Random, 95% CI) | Totals not selected | |
| 26.1 Dyspnoea (end intervention) | 1 | Mean Difference (IV, Random, 95% CI) | 0.0 [0.0, 0.0] | |
| 26.2 Emotional function (end intervention) | 1 | Mean Difference (IV, Random, 95% CI) | 0.0 [0.0, 0.0] | |
| 26.3 Fatigue (end intervention) | 1 | Mean Difference (IV, Random, 95% CI) | 0.0 [0.0, 0.0] | |
| 26.4 Mastery (end intervention) | 1 | Mean Difference (IV, Random, 95% CI) | 0.0 [0.0, 0.0] | |
| 26.5 Total score (end intervention) | 1 | Mean Difference (IV, Random, 95% CI) | 0.0 [0.0, 0.0] | |
| 26.6 Dyspnoea (follow‐up) | 1 | Mean Difference (IV, Random, 95% CI) | 0.0 [0.0, 0.0] | |
| 26.7 Emotional function (follow‐up) | 1 | Mean Difference (IV, Random, 95% CI) | 0.0 [0.0, 0.0] | |
| 26.8 Fatigue (follow‐up) | 1 | Mean Difference (IV, Random, 95% CI) | 0.0 [0.0, 0.0] | |
| 26.9 Mastery (follow‐up) | 1 | Mean Difference (IV, Random, 95% CI) | 0.0 [0.0, 0.0] | |
| 26.10 Total score (follow‐up) | 1 | Mean Difference (IV, Random, 95% CI) | 0.0 [0.0, 0.0] | |
| 27 CRQ domain scores; Interventions: non‐invasive ventilation with pulmonary rehabilitation vs. pulmonary rehabilitation Show forest plot | 1 | Mean Difference (IV, Random, 95% CI) | Totals not selected | |
| 27.1 Dyspnoea (end intervention) | 1 | Mean Difference (IV, Random, 95% CI) | 0.0 [0.0, 0.0] | |
| 27.2 Emotional function (end intervention) | 1 | Mean Difference (IV, Random, 95% CI) | 0.0 [0.0, 0.0] | |
| 27.3 Fatigue (end intervention) | 1 | Mean Difference (IV, Random, 95% CI) | 0.0 [0.0, 0.0] | |
| 27.4 Mastery (end intervention) | 1 | Mean Difference (IV, Random, 95% CI) | 0.0 [0.0, 0.0] | |
| 27.5 Total score (end intervention) | 1 | Mean Difference (IV, Random, 95% CI) | 0.0 [0.0, 0.0] | |
| Outcome or subgroup title | No. of studies | No. of participants | Statistical method | Effect size |
| 1 change in 6MWD (metres); Intervention; neuromuscular electrical stimulation Show forest plot | 1 | Mean Difference (IV, Random, 95% CI) | Totals not selected | |
| 1.1 End intervention | 1 | Mean Difference (IV, Random, 95% CI) | 0.0 [0.0, 0.0] | |
| 1.2 Follow‐up | 1 | Mean Difference (IV, Random, 95% CI) | 0.0 [0.0, 0.0] | |
| Outcome or subgroup title | No. of studies | No. of participants | Statistical method | Effect size |
| 1 change in 6MWD (metres); Intervention: pulmonary rehabilitation/exercise training Show forest plot | 3 | Mean Difference (IV, Random, 95% CI) | Subtotals only | |
| 1.1 End intervention | 3 | 182 | Mean Difference (IV, Random, 95% CI) | 29.06 [14.38, 43.75] |
| 2 change in ISWD (metres); Intervention: pulmonary rehabilitation/exercise training Show forest plot | 3 | Mean Difference (IV, Random, 95% CI) | Subtotals only | |
| 2.1 End intervention | 3 | 180 | Mean Difference (IV, Random, 95% CI) | 19.02 [2.20, 35.85] |
| 3 change in ESWT (seconds); Intervention: pulmonary rehabilitation/exercise training Show forest plot | 2 | Mean Difference (IV, Random, 95% CI) | Subtotals only | |
| 3.1 End intervention | 2 | 137 | Mean Difference (IV, Random, 95% CI) | 237.87 [147.59, 328.16] |
| 4 6MWD (metres); Intervention: high‐intensity interval training Show forest plot | 2 | Mean Difference (IV, Random, 95% CI) | Subtotals only | |
| 4.1 End intervention | 2 | 275 | Mean Difference (IV, Random, 95% CI) | 46.55 [24.66, 68.45] |
| 5 work rate (watts); Intervention: high‐intensity interval training Show forest plot | 2 | Mean Difference (IV, Random, 95% CI) | Subtotals only | |
| 5.1 End intervention | 2 | 275 | Mean Difference (IV, Random, 95% CI) | 15.47 [8.76, 22.17] |
| 6 change in ISWD (metres); Intervention: self‐management (SPACE) Show forest plot | 1 | Mean Difference (IV, Random, 95% CI) | Totals not selected | |
| 6.1 End intervention | 1 | Mean Difference (IV, Random, 95% CI) | 0.0 [0.0, 0.0] | |
| 6.2 Follow‐up | 1 | Mean Difference (IV, Random, 95% CI) | 0.0 [0.0, 0.0] | |
| 7 change in ESWT (seconds); Intervention: self‐management (SPACE) Show forest plot | 1 | Mean Difference (IV, Random, 95% CI) | Totals not selected | |
| 7.1 End intervention | 1 | Mean Difference (IV, Random, 95% CI) | 0.0 [0.0, 0.0] | |
| 7.2 Follow‐up | 1 | Mean Difference (IV, Random, 95% CI) | 0.0 [0.0, 0.0] | |
| 8 6MWD (metres); Intervention: exercise training [inpatient] Show forest plot | 1 | Mean Difference (IV, Random, 95% CI) | Totals not selected | |
| 8.1 End intervention | 1 | Mean Difference (IV, Random, 95% CI) | 0.0 [0.0, 0.0] | |
| 8.2 Follow‐up | 1 | Mean Difference (IV, Random, 95% CI) | 0.0 [0.0, 0.0] | |
| Outcome or subgroup title | No. of studies | No. of participants | Statistical method | Effect size |
| 1 change in CRQ domains; Interventions: home‐based pulmonary rehabilitation vs. centre‐based pulmonary rehabilitation Show forest plot | 1 | Mean Difference (IV, Random, 95% CI) | Totals not selected | |
| 1.1 Dyspnoea (end intervention) | 1 | Mean Difference (IV, Random, 95% CI) | 0.0 [0.0, 0.0] | |
| 1.2 Emotional function (end intervention) | 1 | Mean Difference (IV, Random, 95% CI) | 0.0 [0.0, 0.0] | |
| 1.3 Fatigue (end intervention) | 1 | Mean Difference (IV, Random, 95% CI) | 0.0 [0.0, 0.0] | |
| 1.4 Mastery (end intervention) | 1 | Mean Difference (IV, Random, 95% CI) | 0.0 [0.0, 0.0] | |
| 1.5 Dyspnoea (follow‐up) | 1 | Mean Difference (IV, Random, 95% CI) | 0.0 [0.0, 0.0] | |
| 1.6 Emotional function (follow‐up) | 1 | Mean Difference (IV, Random, 95% CI) | 0.0 [0.0, 0.0] | |
| 1.7 Fatigue (follow‐up) | 1 | Mean Difference (IV, Random, 95% CI) | 0.0 [0.0, 0.0] | |
| 1.8 Mastery (follow‐up) | 1 | Mean Difference (IV, Random, 95% CI) | 0.0 [0.0, 0.0] | |
| 2 change in CRQ domains; Interventions: water‐based exercise training vs. land‐based exercise training Show forest plot | 1 | Mean Difference (IV, Random, 95% CI) | Totals not selected | |
| 2.1 Dyspnoea (mid‐intervention) | 1 | Mean Difference (IV, Random, 95% CI) | 0.0 [0.0, 0.0] | |
| 2.2 Emotional function (mid‐intervention) | 1 | Mean Difference (IV, Random, 95% CI) | 0.0 [0.0, 0.0] | |
| 2.3 Fatigue (mid‐intervention) | 1 | Mean Difference (IV, Random, 95% CI) | 0.0 [0.0, 0.0] | |
| 2.4 Mastery (mid‐intervention) | 1 | Mean Difference (IV, Random, 95% CI) | 0.0 [0.0, 0.0] | |
| 2.5 Total score (mid‐intervention) | 1 | Mean Difference (IV, Random, 95% CI) | 0.0 [0.0, 0.0] | |
| 2.6 Dyspnoea (end intervention) | 1 | Mean Difference (IV, Random, 95% CI) | 0.0 [0.0, 0.0] | |
| 2.7 Emotional function (end intervention) | 1 | Mean Difference (IV, Random, 95% CI) | 0.0 [0.0, 0.0] | |
| 2.8 Fatigue (end intervention) | 1 | Mean Difference (IV, Random, 95% CI) | 0.0 [0.0, 0.0] | |
| 2.9 Mastery (end intervention) | 1 | Mean Difference (IV, Random, 95% CI) | 0.0 [0.0, 0.0] | |
| 2.10 Total score (end intervention) | 1 | Mean Difference (IV, Random, 95% CI) | 0.0 [0.0, 0.0] | |
| 3 SGRQ domain and total scores; Interventions: Tai Chi vs. pulmonary rehabilitation Show forest plot | 1 | Mean Difference (IV, Random, 95% CI) | Totals not selected | |
| 3.1 Symptoms (mid‐intervention, 2 weeks) | 1 | Mean Difference (IV, Random, 95% CI) | 0.0 [0.0, 0.0] | |
| 3.2 Activity (mid‐intervention, 2 weeks) | 1 | Mean Difference (IV, Random, 95% CI) | 0.0 [0.0, 0.0] | |
| 3.3 Impacts (mid‐intervention, 2 weeks) | 1 | Mean Difference (IV, Random, 95% CI) | 0.0 [0.0, 0.0] | |
| 3.4 Total (mid‐intervention, 2 weeks) | 1 | Mean Difference (IV, Random, 95% CI) | 0.0 [0.0, 0.0] | |
| 3.5 Symptoms (mid‐intervention, 14 weeks) | 1 | Mean Difference (IV, Random, 95% CI) | 0.0 [0.0, 0.0] | |
| 3.6 Activity (mid‐intervention, 14 weeks) | 1 | Mean Difference (IV, Random, 95% CI) | 0.0 [0.0, 0.0] | |
| 3.7 Impacts (mid‐intervention, 14 weeks) | 1 | Mean Difference (IV, Random, 95% CI) | 0.0 [0.0, 0.0] | |
| 3.8 Total (mid‐intervention, 14 weeks) | 1 | Mean Difference (IV, Random, 95% CI) | 0.0 [0.0, 0.0] | |
| 3.9 Symptoms (end intervention) | 1 | Mean Difference (IV, Random, 95% CI) | 0.0 [0.0, 0.0] | |
| 3.10 Activity (end intervention) | 1 | Mean Difference (IV, Random, 95% CI) | 0.0 [0.0, 0.0] | |
| 3.11 Impacts (end intervention) | 1 | Mean Difference (IV, Random, 95% CI) | 0.0 [0.0, 0.0] | |
| 3.12 Total (end intervention) | 1 | Mean Difference (IV, Random, 95% CI) | 0.0 [0.0, 0.0] | |
| 4 CRQ total score; Interventions: outdoor walking vs. cycle ergometry Show forest plot | 1 | Mean Difference (IV, Random, 95% CI) | Totals not selected | |
| 4.1 End intervention | 1 | Mean Difference (IV, Random, 95% CI) | 0.0 [0.0, 0.0] | |
| 4.2 Follow‐up | 1 | Mean Difference (IV, Random, 95% CI) | 0.0 [0.0, 0.0] | |
| 5 Maugeri Respiratory Failure questionnaire; Interventions: exercise training with tapered supervision vs. supervised exercise training Show forest plot | 1 | Mean Difference (IV, Fixed, 95% CI) | Totals not selected | |
| 5.1 End intervention | 1 | Mean Difference (IV, Fixed, 95% CI) | 0.0 [0.0, 0.0] | |
| 5.2 Follow‐up | 1 | Mean Difference (IV, Fixed, 95% CI) | 0.0 [0.0, 0.0] | |
| 6 SF36 domain scores; Interventions: self‐management vs. education and symptom monitoring Show forest plot | 1 | Mean Difference (IV, Random, 95% CI) | Totals not selected | |
| 6.1 Mental health (end intervention) | 1 | Mean Difference (IV, Random, 95% CI) | 0.0 [0.0, 0.0] | |
| 6.2 Role emotional (end intervention) | 1 | Mean Difference (IV, Random, 95% CI) | 0.0 [0.0, 0.0] | |
| 6.3 Vitality (end intervention) | 1 | Mean Difference (IV, Random, 95% CI) | 0.0 [0.0, 0.0] | |
| 6.4 Social functioning (end intervention) | 1 | Mean Difference (IV, Random, 95% CI) | 0.0 [0.0, 0.0] | |
| 6.5 Pain (end intervention) | 1 | Mean Difference (IV, Random, 95% CI) | 0.0 [0.0, 0.0] | |
| 6.6 Role physical (end intervention) | 1 | Mean Difference (IV, Random, 95% CI) | 0.0 [0.0, 0.0] | |
| 6.7 General health (end intervention) | 1 | Mean Difference (IV, Random, 95% CI) | 0.0 [0.0, 0.0] | |
| 6.8 Physical functioning (end intervention) | 1 | Mean Difference (IV, Random, 95% CI) | 0.0 [0.0, 0.0] | |
| Outcome or subgroup title | No. of studies | No. of participants | Statistical method | Effect size |
| 1 6MWD (metres); Interventions: Nordic walking with education vs. education Show forest plot | 1 | Mean Difference (IV, Random, 95% CI) | Totals not selected | |
| 1.1 End intervention | 1 | Mean Difference (IV, Random, 95% CI) | 0.0 [0.0, 0.0] | |
| 1.2 Follow‐up (6 months) | 1 | Mean Difference (IV, Random, 95% CI) | 0.0 [0.0, 0.0] | |
| 1.3 Follow‐up (9 months) | 1 | Mean Difference (IV, Random, 95% CI) | 0.0 [0.0, 0.0] | |
| 2 change in ISWD (metres); Interventions: exercise training (COPE‐active) with self‐management vs. self management Show forest plot | 1 | Mean Difference (IV, Random, 95% CI) | Totals not selected | |
| 2.1 Mid‐intervention | 1 | Mean Difference (IV, Random, 95% CI) | 0.0 [0.0, 0.0] | |
| 2.2 End intervention | 1 | Mean Difference (IV, Random, 95% CI) | 0.0 [0.0, 0.0] | |
| 2.3 Follow‐up (18 months) | 1 | Mean Difference (IV, Random, 95% CI) | 0.0 [0.0, 0.0] | |
| 2.4 Follow‐up (24 months) | 1 | Mean Difference (IV, Random, 95% CI) | 0.0 [0.0, 0.0] | |
| 3 change in ESWT (seconds); Interventions: exercise training (COPE‐active) with self‐management vs. self management Show forest plot | 1 | Mean Difference (IV, Random, 95% CI) | Totals not selected | |
| 3.1 Mid‐intervention | 1 | Mean Difference (IV, Random, 95% CI) | 0.0 [0.0, 0.0] | |
| 3.2 End intervention | 1 | Mean Difference (IV, Random, 95% CI) | 0.0 [0.0, 0.0] | |
| 3.3 Follow‐up (18 months) | 1 | Mean Difference (IV, Random, 95% CI) | 0.0 [0.0, 0.0] | |
| 3.4 Follow‐up (24 months) | 1 | Mean Difference (IV, Random, 95% CI) | 0.0 [0.0, 0.0] | |
| 4 6MWD (metres); Interventions: exercise training and LAMA/LABA with behaviour modification vs. placebo with behaviour modification Show forest plot | 1 | Mean Difference (IV, Random, 95% CI) | Totals not selected | |
| 4.1 Mid‐intervention | 1 | Mean Difference (IV, Random, 95% CI) | 0.0 [0.0, 0.0] | |
| 4.2 End intervention | 1 | Mean Difference (IV, Random, 95% CI) | 0.0 [0.0, 0.0] | |
| 5 ESWT (seconds); Interventions: exercise training and LAMA/LABA with behaviour modification vs. placebo with behaviour modification Show forest plot | 1 | Mean Difference (IV, Random, 95% CI) | Totals not selected | |
| 5.1 Mid‐intervention | 1 | Mean Difference (IV, Random, 95% CI) | 0.0 [0.0, 0.0] | |
| 5.2 End intervention | 1 | Mean Difference (IV, Random, 95% CI) | 0.0 [0.0, 0.0] | |
| 6 6MWD (metres); Interventions: exercise training and LABA with LAMA and behaviour modification vs. LAMA and behaviour modification Show forest plot | 1 | Mean Difference (IV, Random, 95% CI) | Totals not selected | |
| 6.1 Mid‐intervention | 1 | Mean Difference (IV, Random, 95% CI) | 0.0 [0.0, 0.0] | |
| 6.2 End intervention | 1 | Mean Difference (IV, Random, 95% CI) | 0.0 [0.0, 0.0] | |
| 7 ESWT (seconds); Interventions: exercise training and LABA with LAMA and behaviour modification vs. LAMA and behaviour modification Show forest plot | 1 | Mean Difference (IV, Random, 95% CI) | Totals not selected | |
| 7.1 Mid‐intervention | 1 | Mean Difference (IV, Random, 95% CI) | 0.0 [0.0, 0.0] | |
| 7.2 End intervention | 1 | Mean Difference (IV, Random, 95% CI) | 0.0 [0.0, 0.0] | |
| 8 6MWD (metres); Interventions: exercise training with LAMA/LABA and behaviour modification vs. LAMA/LABA and behaviour modification Show forest plot | 1 | Mean Difference (IV, Random, 95% CI) | Totals not selected | |
| 8.1 Mid‐intervention | 1 | Mean Difference (IV, Random, 95% CI) | 0.0 [0.0, 0.0] | |
| 8.2 End intervention | 1 | Mean Difference (IV, Random, 95% CI) | 0.0 [0.0, 0.0] | |
| 9 ESWT (seconds); Interventions: exercise training with LAMA/LABA and behaviour modification vs. LAMA/LABA and behaviour modification Show forest plot | 1 | Mean Difference (IV, Random, 95% CI) | Totals not selected | |
| 9.1 Mid‐intervention | 1 | Mean Difference (IV, Random, 95% CI) | 0.0 [0.0, 0.0] | |
| 9.2 End intervention | 1 | Mean Difference (IV, Random, 95% CI) | 0.0 [0.0, 0.0] | |
| 10 change in ESWT (seconds); Intervention: physical activity counselling and exercise training with pedometer vs. pedometer Show forest plot | 1 | Mean Difference (IV, Random, 95% CI) | Totals not selected | |
| 10.1 End intervention | 1 | Mean Difference (IV, Random, 95% CI) | 0.0 [0.0, 0.0] | |
| 10.2 Follow‐up (3 months) | 1 | Mean Difference (IV, Random, 95% CI) | 0.0 [0.0, 0.0] | |
| 10.3 Follow‐up (12 months) | 1 | Mean Difference (IV, Random, 95% CI) | 0.0 [0.0, 0.0] | |
| 11 6MWD (metres); Interventions: physical activity counselling (app) with optional supervised exercise vs. optional supervised exercise Show forest plot | 1 | Mean Difference (IV, Random, 95% CI) | Totals not selected | |
| 11.1 Mid‐intervention (12 weeks) | 1 | Mean Difference (IV, Random, 95% CI) | 0.0 [0.0, 0.0] | |
| 11.2 Mid‐intervention (6 months) | 1 | Mean Difference (IV, Random, 95% CI) | 0.0 [0.0, 0.0] | |
| 11.3 End intervention | 1 | Mean Difference (IV, Random, 95% CI) | 0.0 [0.0, 0.0] | |
| 12 6MWD (metres); Interventions: physical activity counselling (app) with pedometer vs. pedometer Show forest plot | 1 | Mean Difference (IV, Random, 95% CI) | Totals not selected | |
| 12.1 Mid‐intervention | 1 | Mean Difference (IV, Random, 95% CI) | 0.0 [0.0, 0.0] | |
| 12.2 End intervention | 1 | Mean Difference (IV, Random, 95% CI) | 0.0 [0.0, 0.0] | |
| 13 6MWD (metres); Interventions: physical activity counselling with pulmonary rehabilitation vs. pulmonary rehabilitation Show forest plot | 1 | Mean Difference (IV, Random, 95% CI) | Totals not selected | |
| 13.1 Mid‐intervention | 1 | Mean Difference (IV, Random, 95% CI) | 0.0 [0.0, 0.0] | |
| 13.2 End intervention | 1 | Mean Difference (IV, Random, 95% CI) | 0.0 [0.0, 0.0] | |
| 14 change in 6MWD (metres); Interventions: physical activity counselling with pulmonary rehabilitation vs. sham with pulmonary rehabilitation Show forest plot | 1 | Mean Difference (IV, Random, 95% CI) | Totals not selected | |
| 14.1 Mid‐intervention | 1 | Mean Difference (IV, Random, 95% CI) | 0.0 [0.0, 0.0] | |
| 14.2 End intervention | 1 | Mean Difference (IV, Random, 95% CI) | 0.0 [0.0, 0.0] | |
| 15 6MWD (metres); Interventions: LAMA with behaviour modification vs. placebo with behaviour modification Show forest plot | 1 | Mean Difference (IV, Random, 95% CI) | Totals not selected | |
| 15.1 Mid‐intervention | 1 | Mean Difference (IV, Random, 95% CI) | 0.0 [0.0, 0.0] | |
| 15.2 End intervention | 1 | Mean Difference (IV, Random, 95% CI) | 0.0 [0.0, 0.0] | |
| 16 ESWT (seconds); Interventions: LAMA with behaviour modification vs. placebo with behaviour modification Show forest plot | 1 | Mean Difference (IV, Random, 95% CI) | Totals not selected | |
| 16.1 Mid‐intervention | 1 | Mean Difference (IV, Random, 95% CI) | 0.0 [0.0, 0.0] | |
| 16.2 End intervention | 1 | Mean Difference (IV, Random, 95% CI) | 0.0 [0.0, 0.0] | |
| 17 6MWD (metres); Interventions: LAMA/LABA with behaviour modification vs. placebo with behaviour modification Show forest plot | 1 | Mean Difference (IV, Random, 95% CI) | Totals not selected | |
| 17.1 Mid‐intervention | 1 | Mean Difference (IV, Random, 95% CI) | 0.0 [0.0, 0.0] | |
| 17.2 End intervention | 1 | Mean Difference (IV, Random, 95% CI) | 0.0 [0.0, 0.0] | |
| 18 ESWT (s); Interventions: LAMA/LABA with behaviour modification vs. placebo with behaviour modification Show forest plot | 1 | Mean Difference (IV, Random, 95% CI) | Totals not selected | |
| 18.1 Mid‐intervention | 1 | Mean Difference (IV, Random, 95% CI) | 0.0 [0.0, 0.0] | |
| 18.2 End intervention | 1 | Mean Difference (IV, Random, 95% CI) | 0.0 [0.0, 0.0] | |
| 19 6MWD (metres); Interventions: LAMA/LABA with behaviour modification vs. LAMA with behaviour modification Show forest plot | 1 | Mean Difference (IV, Random, 95% CI) | Totals not selected | |
| 19.1 Mid‐intervention | 1 | Mean Difference (IV, Random, 95% CI) | 0.0 [0.0, 0.0] | |
| 19.2 End intervention | 1 | Mean Difference (IV, Random, 95% CI) | 0.0 [0.0, 0.0] | |
| 20 ESWT (seconds); Interventions: LAMA/LABA with behaviour modification vs. LAMA with behaviour modification Show forest plot | 1 | Mean Difference (IV, Random, 95% CI) | Totals not selected | |
| 20.1 Mid‐intervention | 1 | Mean Difference (IV, Random, 95% CI) | 0.0 [0.0, 0.0] | |
| 20.2 End intervention | 1 | Mean Difference (IV, Random, 95% CI) | 0.0 [0.0, 0.0] | |
| 21 change in ISWD (metres); Interventions: supplemental oxygen with pulmonary rehabilitation vs. sham intervention with pulmonary rehabilitation Show forest plot | 1 | Mean Difference (IV, Random, 95% CI) | Totals not selected | |
| 21.1 End intervention | 1 | Mean Difference (IV, Random, 95% CI) | 0.0 [0.0, 0.0] | |
| 21.2 Follow‐up | 1 | Mean Difference (IV, Random, 95% CI) | 0.0 [0.0, 0.0] | |
| 22 change in ESWT (seconds); Interventions: supplemental oxygen with pulmonary rehabilitation vs. sham intervention with pulmonary rehabilitation Show forest plot | 1 | Mean Difference (IV, Random, 95% CI) | Totals not selected | |
| 22.1 End intervention | 1 | Mean Difference (IV, Random, 95% CI) | 0.0 [0.0, 0.0] | |
| 22.2 Follow‐up | 1 | Mean Difference (IV, Random, 95% CI) | 0.0 [0.0, 0.0] | |
| Outcome or subgroup title | No. of studies | No. of participants | Statistical method | Effect size |
| 1 change in 6MWD (metres); Interventions: home‐based pulmonary rehabilitation vs. centre‐based pulmonary rehabilitation Show forest plot | 1 | Mean Difference (IV, Random, 95% CI) | Totals not selected | |
| 1.1 End intervention | 1 | Mean Difference (IV, Random, 95% CI) | 0.0 [0.0, 0.0] | |
| 1.2 Follow‐up | 1 | Mean Difference (IV, Random, 95% CI) | 0.0 [0.0, 0.0] | |
| 2 change in 6MWD (metres); Interventions: water‐based exercise training vs. land‐based exercise training Show forest plot | 1 | Mean Difference (IV, Random, 95% CI) | Totals not selected | |
| 2.1 Mid‐intervention | 1 | Mean Difference (IV, Random, 95% CI) | 0.0 [0.0, 0.0] | |
| 2.2 End intervention | 1 | Mean Difference (IV, Random, 95% CI) | 0.0 [0.0, 0.0] | |
| 3 change in ISWD (metres); Interventions: water‐based exercise training vs. land‐based exercise training Show forest plot | 1 | Mean Difference (IV, Random, 95% CI) | Totals not selected | |
| 3.1 Mid‐intervention | 1 | Mean Difference (IV, Random, 95% CI) | 0.0 [0.0, 0.0] | |
| 3.2 End intervention | 1 | Mean Difference (IV, Random, 95% CI) | 0.0 [0.0, 0.0] | |
| 4 change in VO2max (ml/min); Interventions: water‐based exercise training vs. land‐based exercise training Show forest plot | 1 | Mean Difference (IV, Random, 95% CI) | Totals not selected | |
| 4.1 Mid‐intervention | 1 | Mean Difference (IV, Random, 95% CI) | 0.0 [0.0, 0.0] | |
| 4.2 End intervention | 1 | Mean Difference (IV, Random, 95% CI) | 0.0 [0.0, 0.0] | |
| 5 6MWD (metres); Interventions: Tai Chi vs. pulmonary rehabilitation Show forest plot | 1 | Mean Difference (IV, Random, 95% CI) | Totals not selected | |
| 5.1 Mid‐intervention (2 weeks) | 1 | Mean Difference (IV, Random, 95% CI) | 0.0 [0.0, 0.0] | |
| 5.2 Mid‐intervention (14 weeks) | 1 | Mean Difference (IV, Random, 95% CI) | 0.0 [0.0, 0.0] | |
| 5.3 End intervention | 1 | Mean Difference (IV, Random, 95% CI) | 0.0 [0.0, 0.0] | |
| 6 6MWD (metres); Interventions: exercise training with tapered supervision vs. supervised exercise training Show forest plot | 1 | Mean Difference (IV, Fixed, 95% CI) | Totals not selected | |
| 6.1 End intervention | 1 | Mean Difference (IV, Fixed, 95% CI) | 0.0 [0.0, 0.0] | |
| 6.2 Follow‐up | 1 | Mean Difference (IV, Fixed, 95% CI) | 0.0 [0.0, 0.0] | |