Silodosina para el tratamiento de los síntomas urinarios bajos compatibles con hiperplasia prostática benigna
Información
- DOI:
- https://doi.org/10.1002/14651858.CD012615.pub2Copiar DOI

- Base de datos:
-
- Cochrane Database of Systematic Reviews
- Versión publicada:
-
- 22 noviembre 2017see what's new
- Tipo:
-
- Intervention
- Etapa:
-
- Review
- Grupo Editorial Cochrane:
-
Grupo Cochrane de Urología
- Copyright:
-
- Copyright © 2017 The Cochrane Collaboration. Published by John Wiley & Sons, Ltd.
Cifras del artículo
Altmetric:
Citado por:
Autores
Contributions of authors
JH Jung (JHJ): conception and study design, drafting the protocol, searching for trials, study selection, extracting data, assessing risk of bias, performing data analysis, interpretation of data, and drafting the review.
J Kim (JK): drafting the protocol, searching for trials, study selection, extracting data, assessing risk of bias, performing data analysis, and drafting the review.
R MacDonald (RM): study design, drafting the protocol, providing clinical and methodological advices on the review, and final approval.
B Reddy (BR): providing clinical and methodological advice on the review, and drafting the review.
MH Kim (MHK): creating search strategies, drafting the protocol, and searching for trials.
P Dahm (PD): conception and study design, providing clinical and methodological advice on the review, and final approval.
Sources of support
Internal sources
-
Yonsei University Wonju College of Medicine, Korea, South.
-
Minneapolis VA Medical Center, Minneapolis, Minnesota, USA.
-
University of Minnesota, Minneapolis, Minnesota, USA.
External sources
-
No sources of support provided, Other.
Declarations of interest
JHJ: none known
JK: none known
RM: none known
BR: none known
MHK: none known
PD: PD serves as Co‐ordinating Editor of Cochrane Urology. However, he was not involved in the editorial processing or decision‐making for this review. Other editors of Cochrane Urology managed the editorial process, including final sign‐off for this review.
Acknowledgements
We acknowledge the support received from the authors of included studies, Christopher R. Chapple, Gyung‐woo Jung, Leonard S. Marks, Satabdi Pande, Hideki Takeshita, Kenya Yamaguchi, Tomonori Yamanishi, and Teruhiko Yokoyama by providing additional data. We are very grateful to Christopher Filson, Herney Andrés García‐Perdomo, Hong Wook Kim, Stavros Gravas, and Valter Silva for having served as peer reviewers. We thank Cochrane Urology and our contact editors Mari Imamura and Muhammad Imran Omar for supporting this review.
Version history
| Published | Title | Stage | Authors | Version |
| 2017 Nov 22 | Silodosin for the treatment of lower urinary tract symptoms in men with benign prostatic hyperplasia | Review | Jae Hung Jung, Jiye Kim, Roderick MacDonald, Balaji Reddy, Myung Ha Kim, Philipp Dahm | |
| 2017 Mar 28 | Silodosin for the treatment of lower urinary tract symptoms in men with benign prostatic hyperplasia | Protocol | Jae Hung Jung, Roderick MacDonald, Jiye Kim, Myung Ha Kim, Philipp Dahm | |
Differences between protocol and review
This review was based on a published protocol with differences as described here.
-
Types of studies: we included parallel, randomized trials as well as cross‐over designs. We revised the 'Types of studies' and 'Unit of analysis issues' section accordingly.
-
Types of participants: we redefined the type of participants as adult men aged 40 years and over. Given that alpha‐blockers are used to treat patients with all degrees of LUTS, we deleted the IPSS criterion under ‘Types of participants’.
-
Types of outcome measures: we renamed primary and secondary outcomes and added details in 'method and timing of outcome measurement' for all outcomes.
-
Assessment of risk of bias in included studies: we added details with regards to assessing risk of bias. We considered all outcomes susceptible to performance bias and assessed them in one group. We redefined subjective and objective outcomes for detection bias.
-
Subgroup and sensitivity analysis: we planned to perform subgroup and sensitivity analyses limited to the primary outcomes.
-
Appendix: we have summarized the search strategy for each database in Appendix 1.
Notes
We have based parts of the Methods section of this protocol on a standard template developed by the Cochrane Metabolic and Endocrine Disorders Group, which has been modified and adapted for use by Cochrane Urology.
Keywords
MeSH
Medical Subject Headings (MeSH) Keywords
- Adrenergic alpha‐1 Receptor Antagonists [*therapeutic use];
- Indoles [*therapeutic use];
- Lower Urinary Tract Symptoms [*drug therapy, etiology];
- Naphthalenes [therapeutic use];
- Piperazines [therapeutic use];
- Prostatic Hyperplasia [*complications];
- Quinazolines [therapeutic use];
- Randomized Controlled Trials as Topic;
- Urological Agents [*therapeutic use];
Medical Subject Headings Check Words
Aged; Humans; Male;
PICO
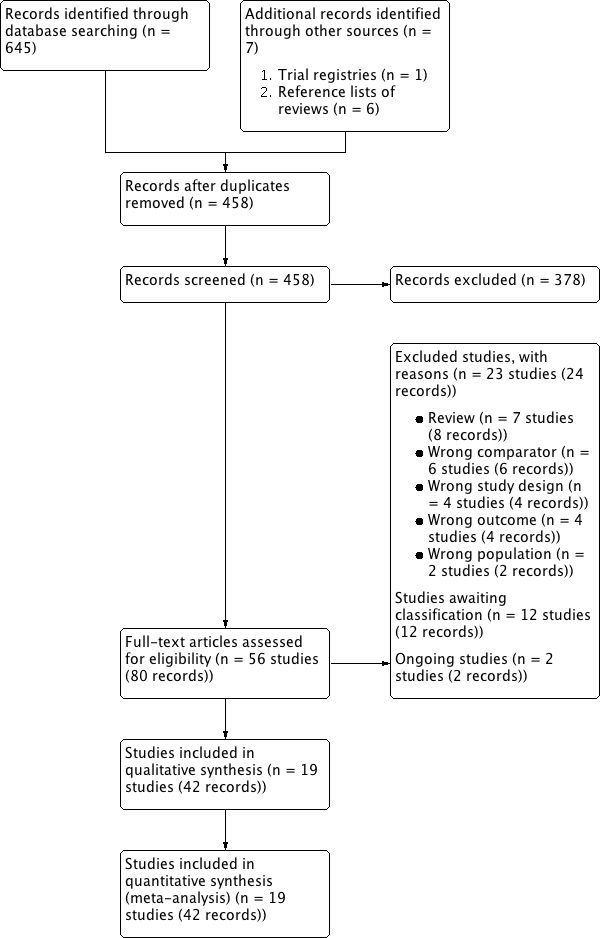

Risk of bias graph: review authors' judgements about each risk of bias item presented as percentages across all included studies

Risk of bias summary: review authors' judgements about each risk of bias item for each included study

Comparison 1 Silodosin versus placebo, Outcome 1 Urologic symptom scores (short term).

Comparison 1 Silodosin versus placebo, Outcome 2 Quality of life (short term).

Comparison 1 Silodosin versus placebo, Outcome 3 Treatment withdrawal due to any reason (short term).

Comparison 1 Silodosin versus placebo, Outcome 4 Treatment withdrawal due to adverse events (short term).

Comparison 1 Silodosin versus placebo, Outcome 5 Cardiovascular adverse events (short term).

Comparison 1 Silodosin versus placebo, Outcome 6 Sexual adverse events (short term).

Comparison 2 Silodosin versus tamsulosin, Outcome 1 Urologic symptom scores (short term).

Comparison 2 Silodosin versus tamsulosin, Outcome 2 Quality of life (short term).
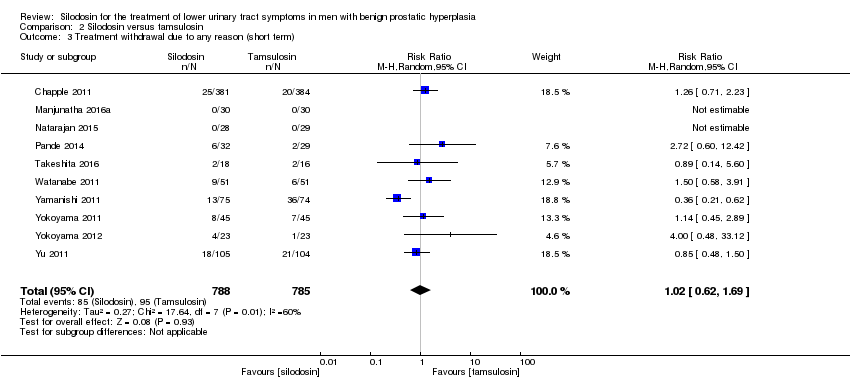
Comparison 2 Silodosin versus tamsulosin, Outcome 3 Treatment withdrawal due to any reason (short term).

Comparison 2 Silodosin versus tamsulosin, Outcome 4 Treatment withdrawal due to adverse events (short term).

Comparison 2 Silodosin versus tamsulosin, Outcome 5 Cardiovascular adverse events (short term).
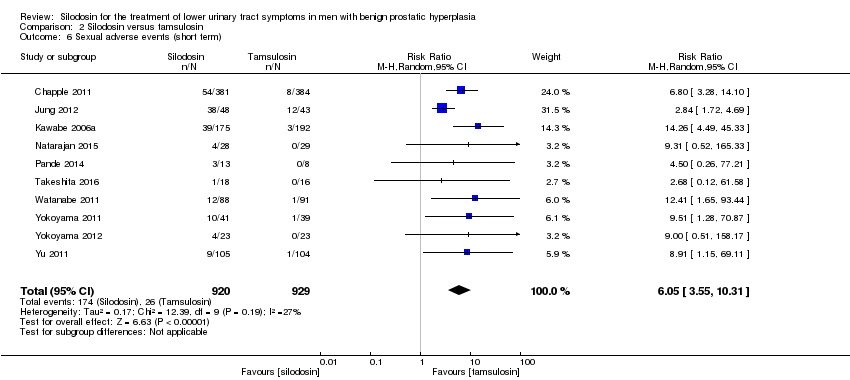
Comparison 2 Silodosin versus tamsulosin, Outcome 6 Sexual adverse events (short term).

Comparison 3 Silodosin versus naftopidil, Outcome 1 Urologic symptom scores (short term).
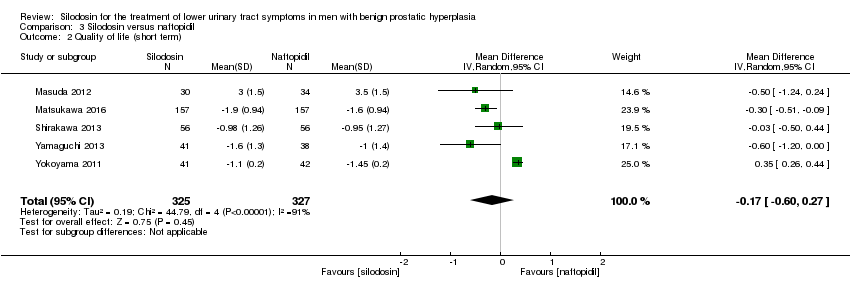
Comparison 3 Silodosin versus naftopidil, Outcome 2 Quality of life (short term).

Comparison 3 Silodosin versus naftopidil, Outcome 3 Treatment withdrawal due to any reason (short term).

Comparison 3 Silodosin versus naftopidil, Outcome 4 Treatment withdrawal due to adverse events (short term).
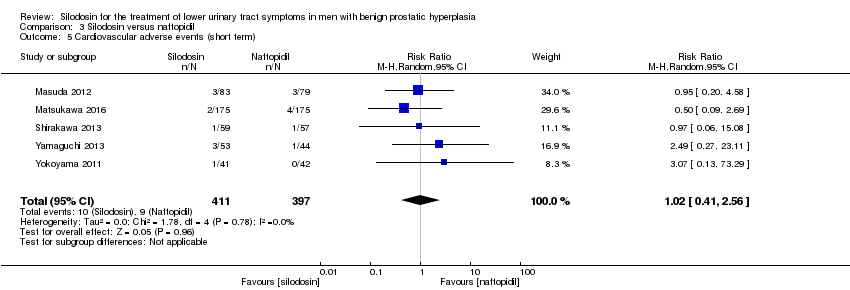
Comparison 3 Silodosin versus naftopidil, Outcome 5 Cardiovascular adverse events (short term).

Comparison 3 Silodosin versus naftopidil, Outcome 6 Sexual adverse events (short term).

Comparison 4 Silodosin versus alfuzosin, Outcome 1 Urologic symptom scores (short term).

Comparison 4 Silodosin versus alfuzosin, Outcome 2 Quality of life (short term).

Comparison 4 Silodosin versus alfuzosin, Outcome 3 Cardiovascular adverse events (short term).

Comparison 4 Silodosin versus alfuzosin, Outcome 4 Sexual adverse events (short term).
| Silodosin compared to placebo for the treatment of lower urinary tract symptoms in men with benign prostatic hyperplasia (short term) | |||||
| Participants: men with lower urinary tract symptoms suggesting benign prostatic hyperplasia Setting: likely outpatients Intervention: silodosin Comparator: placebo | |||||
| Outcomes | № of participants | Quality of the evidence | Relative effect | Anticipated absolute effects* (95% CI) | |
| Risk with placebo | Risk difference with silodosin | ||||
| Urologic symptom scores | 1743 | ⊕⊕⊝⊝ | ‐ | The mean change of urologic symptom scores ranged from ‐5.30 to ‐3.50 | MD 2.65 lower |
| QoL | 820 | ⊕⊕⊕⊝ | ‐ | The mean change of QoL ranged from ‐1.10 to ‐0.80 | MD 0.42 lower |
| Treatment withdrawal due to any reason | 1703 | ⊕⊕⊝⊝ | RR 1.08 | Study population | |
| 83 per 1000 | 7 more per 1000 | ||||
| Cardiovascular adverse events | 1967 | ⊕⊝⊝⊝ | RR 1.28 | Study population | |
| 42 per 1000 | 12 more per 1000 | ||||
| Assumed baseline riske | |||||
| 61 per 1000 | 17 more per 1000 | ||||
| Sexual adverse events | 1967 | ⊕⊕⊝⊝ | RR 26.07 | Study population | |
| 7 per 1000 | 180 more per 1000 | ||||
| *The risk in the intervention group (and its 95% confidence interval) is based on the assumed risk in the comparison group and the relative effect of the intervention (and its 95% CI). | |||||
| GRADE Working Group grades of evidence | |||||
| aDowngraded by one level for study limitations: unclear or high risk of bias for one or more domains among the included studies. | |||||
| Silodosin compared to tamsulosin for the treatment of lower urinary tract symptoms in men with benign prostatic hyperplasia (short term) | |||||
| Participants: men with lower urinary tract symptoms suggesting benign prostatic hyperplasia Setting: likely outpatients Intervention: silodosin Comparator: tamsulosin | |||||
| Outcomes | № of participants | Quality of the evidence | Relative effect | Anticipated absolute effects* (95% CI) | |
| Risk with tamsulosin | Risk difference with silodosin | ||||
| Urologic symptom scores | 1708 | ⊕⊕⊝⊝ | ‐ | The mean change of urologic symptom scores ranged from ‐15.60 to ‐4.60 | MD 0.04 lower |
| QoL | 1707 | ⊕⊕⊝⊝ | ‐ | The mean change of QoL ranged from ‐3.60 to ‐0.90 | MD 0.15 lower |
| Treatment withdrawal due to any reason | 1573 | ⊕⊝⊝⊝ | RR 1.02 | Study population | |
| 121 per 1000 | 2 fewer per 1000 | ||||
| Cardiovascular adverse events | 1955 | ⊕⊕⊝⊝ | RR 0.77 | Study population | |
| 63 per 1000 | 14 fewer per 1000 | ||||
| Sexual adverse events | 1849 | ⊕⊕⊕⊝ | RR 6.05 | Study population | |
| 28 per 1000 | 141 more per 1000 | ||||
| *The risk in the intervention group (and its 95% confidence interval) is based on the assumed risk in the comparison group and the relative effect of the intervention (and its 95% CI). | |||||
| GRADE Working Group grades of evidence | |||||
| aDowngraded by one level for study limitations: unclear or high risk of bias for one or more domains among the included studies. | |||||
| Silodosin compared to naftopidil for the treatment of lower urinary tract symptoms in men with benign prostatic hyperplasia (short term) | |||||
| Participants: men with lower urinary tract symptoms suggesting benign prostatic hyperplasia Setting: likely outpatients Intervention: silodosin Comparator: naftopidil | |||||
| Outcomes | № of participants | Quality of the evidence | Relative effect | Anticipated absolute effects* (95% CI) | |
| Risk with naftopidil | Risk difference with silodosin | ||||
| Urologic symptom scores | 652 | ⊕⊕⊝⊝ | ‐ | The mean change of urologic symptom scores ranged from ‐7.52 to ‐3.56 | MD 0.85 lower |
| QoL | 652 | ⊕⊕⊝⊝ | ‐ | The mean change of QoL ranged from ‐1.60 to ‐0.95 | MD 0.17 lower |
| Treatment withdrawal due to any reason | 659 | ⊕⊕⊝⊝ | RR 1.25 | Study population | |
| 102 per 1000 | 25 more per 1000 | ||||
| Cardiovascular adverse events | 808 | ⊕⊕⊝⊝ | RR 1.02 | Study population | |
| 23 per 1000 | 0 more per 1000 | ||||
| Sexual adverse events | 405 | ⊕⊕⊕⊝ | RR 5.93 | Study population | |
| 15 per 1000 | 74 more per 1000 | ||||
| *The risk in the intervention group (and its 95% confidence interval) is based on the assumed risk in the comparison group and the relative effect of the intervention (and its 95% CI). | |||||
| GRADE Working Group grades of evidence | |||||
| aDowngraded by one level for study limitations: unclear or high risk of bias for one or more domains among the included studies. | |||||
| Silodosin compared to alfuzosin for the treatment of lower urinary tract symptoms in men with benign prostatic hyperplasia (short term) | |||||
| Participants: men with lower urinary tract symptoms suggesting benign prostatic hyperplasia Setting: likely outpatients Intervention: silodosin Comparator: alfuzosin | |||||
| Outcomes | № of participants | Quality of the evidence | Relative effect | Anticipated absolute effects* (95% CI) | |
| Risk with alfuzosin | Risk difference with silodosin | ||||
| Urologic symptom scores | 60 | ⊕⊕⊝⊝ | ‐ | The mean change of urologic symptom scores was ‐16.93 | MD 3.83 higher |
| QoL | 60 | ⊕⊕⊕⊝ | ‐ | The mean change of QoL was ‐4.27 | MD 0.14 higher |
| Treatment withdrawal due to any reason | 60 | ⊕⊕⊝⊝ | Not estimable | Study population | |
| ‐ | ‐ | ||||
| Cardiovascular adverse events | 60 | ⊕⊕⊝⊝ | RR 0.67 | Study population | |
| 500 per 1000 | 165 fewer per 1000 | ||||
| Assumed baseline riskd | |||||
| 44 per 1000 | 15 fewer per 1000 | ||||
| Sexual adverse events | 95 | ⊕⊕⊝⊝ | RR 37.21 | Study population | |
| 21 per 1000 | 770 more per 1000 | ||||
| Assumed baseline riskd | |||||
| 6 per 1000 | 217 more per 1000 | ||||
| *The risk in the intervention group (and its 95% confidence interval) is based on the assumed risk in the comparison group and the relative effect of the intervention (and its 95% CI). | |||||
| GRADE Working Group grades of evidence | |||||
| aDowngraded by one level for study limitations: unclear or high risk of bias for one or more domains in the included study. | |||||
| Study name | Trial | Country | Setting | Description of participants | Intervention(s) | Duration of | Age | Prostate volume | IPSS |
| 2006‐2007 | Europe | 72 hospital clinics and inpatient units in 11 countries | Men ≥ 50 years with LUTS (defined by a stable IPSS total score ≥ 13 points), bladder outlet obstruction (defined by a Qmax between 4 and 15 mL/s, with a minimum voided volume of ≥ 125 mL) | Silodosin 8 mg once daily | 12 weeks | 65.8 ± 7.70 | NR | 19.1 ± 4.2 | |
| Tamsulosin 0.4 mg once daily | 65.9 ± 7.41 | 18.9 ± 4.3 | |||||||
| Placebo once daily | 66.0 ± 7.37 | 19.3 ± 4.3 | |||||||
| NR | South Korea | NR | Sexually active men with BPH | Silodosin 8 mg once daily | 4 weeks | NR | NR | NR | |
| Tamsulosin 0.2 mg once daily | |||||||||
| Alfuzosin 10 mg once daily | |||||||||
| NR | Japan | 88 centers/outpatient | Men ≥ 50 years with LUTS (IPSS of ≥ 8, an associated QoL score of ≥ 3) and prostate volume of ≥ 20 mL | Silodosin 4 mg twice daily | 12 weeks | 65.4 ± 7.0 | 36.0 ± 16.9 | 17.1 ± 5.7 | |
| Tamsulosin 0.2 mg once daily | 65.6 ± 7.0 | 35.7 ± 14.4 | 17.0 ± 5.7 | ||||||
| Placebo twice daily | 65.0 ± 6.9 | 35.2 ± 16.0 | 17.1 ± 6.1 | ||||||
| 2013‐2014 | India | Tertiary care hospital | Men ≥ 45 years with symptomatic BPH with LUTS (IPSS of ≥ 8, QoL of ≥ 3, and Qmax of < 15 mL/s, but > 4 mL/s with a voided volume of > 100 mL) | Silodosin 8 mg once daily | 12 weeks | 64.00 ± 11.14 | 40.57 ± 16.45 | 15.93 ± 6.03 | |
| Tamsulosin 0.4 mg once daily | 63.60 ± 9.05 | 40.33 ± 21.55 | 21.63 ± 7.63 | ||||||
| Alfuzosin 10 mg once daily | 63.43 ± 8.91 | 44.43 ± 27.72 | 19.2 ± 9.6 | ||||||
| 2005‐2006 | USA | Multicenter | Men ≥ 50 years with IPSS ≥ 13, Qmax 4 mL/s‐15 mL/s and a PVR < 250 mL | Silodosin 8 mg once daily | 12 weeks | 64.6 ± 8.1 | NR | 21.3 ± 5.1 | |
| Placebo once daily | 64.7 ± 8.1 | 21.3 ± 4.9 | |||||||
| 2009‐2011 | Japan | NR | Men ≥ 50 years with prostate estimated volume of > 20 mL, IPSS ≥ 8, QoL score ≥ 3 points | Silodosin 2 mg‐4 mg twice/d for 2 weeks, followed by 4 mg twice/d for 4 weeks | 6 weeks (before cross‐over)/total 12 weeks | 66.5 ± 5.6 | 38.8 ± 13.1 | 18.6 ± 5.5 | |
| Naftopidil 50 mg‐75 mg once/d for 2 weeks, followed by 75 mg once/d for 4 weeks | 68.5 ± 5.7 | 45.7 ± 17.8 | 17.6 ± 5.0 | ||||||
| 2012‐2013 | Japan | 52 urologists participated at a total of 44 investigational sites/outpatients | Men with LUTS (IPSS ≥ 8, IPSS QoL score 3) and prostate volume ≥ 20 mL | Silodosin 4 mg/d for 4 weeks, followed by 8 mg/d for 8 weeks | 12 weeks | 70.6 ± 7.8 | 39.6 ± 16.7 | 18.8 ± 6.2 | |
| Naftopidil 50 mg/d for 4 weeks, followed by 75 mg/d for 8 weeks | 70.3 ± 7.8 | 38.6 ± 14.8 | 18.9 ± 6.1 | ||||||
| 2006‐2007 | Japan | Multicenter | Men with IPSS ≥ 8 points; QoL score ≥ 3 points; prostate volume measured by ultrasonographic method ≥ 20 mL; void volume ≥ 100 mL; and maximal urinary flow rate (Qmax) < 15 mL/s | Silodosin 4 mg twice daily | 4 weeks (before cross‐over)/total 8 weeks | 68.2 ± 8.6 | 41.3 ± 25.3 | 16.6 ± 5.2 | |
| Tamsulosin 0.2 mg once daily | 70.1 ± 8.9 | 37.8 ± 16.3 | 18.2 ± 5.8 | ||||||
| 2013‐2015 | India | Tertiary hospital | Men > 50 years with bothersome LUTS from BPH and IPSS > 7 | Silodosin 8 mg once daily | 12 weeks | 61 ‐ 62 | NR | NR | |
| Tamsulosin 0.4 mg once daily | |||||||||
| 2009 | NR | NR | Men ≥ 50 years, with symptoms of moderate‐severe BPH and nocturia (≥ 2 episodes/night) | Silodosin 8 mg daily | 12 weeks | 64.6 ± 8.03 | NR | NR | |
| Placebo once daily | 64.2 ± 8.92 | ||||||||
| 2012‐2013 | India | Tertiary care hospital/ outpatient | Men > 50 years with bothersome LUTS from BPH and IPSS > 7 | Silodosin 8 mg once daily | 12 weeks | 61.4 ± 7.88 | 42.0 ± 19.96 | 18.4 ± 3.32 | |
| Tamsulosin 0.4 mg once daily | 62.6 ± 7.55 | 35.6 ± 9.56 | 18.4 ± 3.94 | ||||||
| 2007‐2011 | Japan | Kobe University School or other collaborating institutions | Men with LUTS (total IPSS ≥ 8, QoL index ≥ 3) and prostate volume ≥ 20 mL | Silodosin 4 mg twice daily | 8 weeks | 70.98 ± 6.69 | 38.24 ± 12.94 | 17.53 ± 5.4 | |
| Naftopidil 50 mg once daily | 70.50 ± 6.58 | 39.39 ± 25.96 | 17.56 ± 6.7 | ||||||
| 2011‐2014 | Japan | Four community‐based hospitals | Men aged ≥ 50 years with LUTS/BPH, an IPSS of ≥ 8, QoL score of ≥ 3, and ultrasound‐estimated prostatic volume of ≥ 20 mL | Silodosin 4 mg once daily | 4 weeks (before cross‐over)/total 8 weeks | 69.6 ± 5.4 | 38.7 ± 11.6 | 17.1 ± 7.3 | |
| Tamsulosin 0.2 mg once daily | 69.4 ± 7.0 | 47.3 ± 30.4 | 15.2 ± 7.0 | ||||||
| 2008‐2009 | Japan | Three institutions | Men with LUTS associated with BPH and had an IPSS ≥ 8 and an IPSS‐QoL score ≥ 2 | Silodosin 4 mg twice daily | 4 weeks (before cross‐over)/total 8 weeks | 69.3 ± 8.3 | 36.6 ± 18.3 | 16.4 ± 5.0 | |
| Tamsulosin 0.2 mg once daily | 69.9 ± 8.4 | 35.1 ± 13.0 | 18.1 ± 6.2 | ||||||
| 2007‐2010 | Japan | Nihon University School of Medicine | Men with BPH, ≥ 50 years with significant LUTS (IPSS ≥ 8, QoL score ≥ 3) | Silodosin 8 mg/ day | 12 weeks | 69.3 ± 7.8 | 33.2 ± 21.2 | 16.9 ± 5.5 | |
| Naftopidil 75 mg/ day | 70.0 ± 7.0 | 39.5 ± 18.0 | 18.9 ± 7.0 | ||||||
| NR | NR | NR | Men with LUTS (IPSS total score ≥ 8, Qmax < 15 mL/s) and prostate volume > 20 mL | Silodosin 4 mg twice daily | 12 months | 71.3 ± 8.2 | 42.0 ± 23.7 | 18.8 ± 7.3 | |
| Tamsulosin 0.2 ‐ 0.4 mg daily | 72.2 ± 7.6 | 41.2 ± 23.0 | 17.8 ± 6.4 | ||||||
| NR | Japan | Kawasaki Medical School | Men aged 50–‐80 years and with IPSS ≥ 8 | Silodosin 4 mg twice daily | 12 weeks | 70.2 ± 0.9 | 33.3 ± 2.3 | 18.7 ± 0.7 | |
| Tamsulosin 0.2 mg once daily | 71.5 ± 1.1 | 32.5 ± 2.0 | 18.0 ± 1.1 | ||||||
| Naftopidil 50 mg once daily | 69.1 ± 1.2 | 35.0 ± 3.1 | 17.4 ± 0.8 | ||||||
| 2008‐2010 | Japan | Single center | Men aged 50 years who had a total IPSS ≥ 8 and a QoL index ≥ 3 | Silodosin 4 mg twice daily | 3 months (before cross‐over)/1 month wash‐out/3 months (after cross‐over)/total 7 months | 68.9 ± 5.6 | 35.0 ± 18.4 | 19.3 ± 4.9 | |
| Tamsulosin 0.2 mg once daily | 70.0 ± 6.8 | 36.1 ± 15.5 | 21.1 ± 6.8 | ||||||
| 2007‐2008 | Taiwan | Nine medical centers | Men aged ≥ 40 years with an IPSS of ≥ 13 and prostate volume of ≥ 20 mL | Silodosin 4 mg twice daily | 12 weeks | 67.5 ± 9.3 | 44.8 ± 24.2 | 19.3 ± 4.5 | |
| Tamsulosin 0.2 mg and one placebo | 65.0 ± 8.8 | 38.2 ± 16.7 | 19.8 ± 4.5 | ||||||
| BPH: benign prostatic hyperplasia; IPSS: International Prostate Symptom Score; LUTS: lower urinary tract symptoms; NR: not reported; PVR: postvoid residual; Qmax: maximum flow rate; QoL: quality of life | |||||||||
| Study name | Intervention(s) and comparator(s) | Screened/eligible (N) | randomized (N) | Analysed (N) | Finishing trial (N (%)) |
| Silodosin 8 mg | 1228/955 | 381 | 346 | 356 (93.4) | |
| Tamsulosin 0.4 mg | 384 | 347 | 364 (94.7) | ||
| Placebo | 190 | 168 | 172 (90.5) | ||
| Total | 955 | 861 | 892 (93.4) | ||
| Silodosin 8 mg | NR/138 | 48 | 48 | 48 (100.0) | |
| Tamsulosin 0.2 mg | 43 | 43 | 43 (100.0) | ||
| Alfuzosin 10 mg | 47 | 47 | 47 (100.0) | ||
| Total | 138 | 138 | 138 (100.0) | ||
| Silodosin 8 mg | NR/457 | 176 | 175 | 175 (99.4) | |
| Tamsulosin 0.2 mg | 192 | 192 | 192 (100.0) | ||
| Placebo | 89 | 89 | 89 (100.0) | ||
| Total | 457 | 456 | 456 (99.7) | ||
| Silodosin 8 mg | NR/90 | 30 | 30 | 30 (100.0) | |
| Tamsulosin 0.4 mg | 30 | 30 | 30 (100.0) | ||
| Alfuzosin 10 mg | 30 | 30 | 30 (100.0) | ||
| Total | 90 | 90 | 90 (100.0) | ||
| Silodosin 8 mg | 2849/923 | 466 | 466 | 413 (88.6) | |
| Placebo | 457 | 457 | 419 (91.6) | ||
| Total | 923 | 923 | 832 (90.1) | ||
| Silodosin 4 mg or 8 mg | NR/92 | 44 | 30/83a | 30 (68.1) | |
| Naftopidil 50 mg or 75 mg | 48 | 34/79a | 34 (70.8) | ||
| Total | 92 | 64/162a | 64 (69.5) | ||
| Silodosin 4 mg followed by 8 mg | NR/350 | 175 | 157 | 157 (89.7) | |
| Naftopidil 50 mg followed by 75 mg | 175 | 157 | 157 (89.7) | ||
| Total | 350 | 314 | 314 (89.7) | ||
| Silodosin 8 mg | NR/97 | 46 | 34 | 34 (73.9) | |
| Tamsulosin 0.2 mg | 51 | 31 | 31 (60.7) | ||
| Total | 97 | 65 | 65 (67.0) | ||
| Silodosin 8 mg | NR/57 | 28 | NR | NR | |
| Tamsulosin 0.4 mg | 29 | NR | NR | ||
| Total | 57 | NR | NR | ||
| Silodosin 8 mg | 215/209 | 111 | 111 | 97 (87.3) | |
| Placebo | 98 | 98 | 89 (90.8) | ||
| Total | 209 | 209 | 186 (88.9) | ||
| Silodosin 8 mg | 102/61 | 32 | 26 | 26 (81.2) | |
| Tamsulosin 0.4 mg | 29 | 27 | 27 (93.1) | ||
| Total | 61 | 53 | 53 (86.8) | ||
| Silodosin 8 mg | NR/121 | 61 | 56/59a | 56 (91.8) | |
| Naftopidil 50 mg | 60 | 56/57a | 56 (93.3) | ||
| Total | 121 | 112/116a | 112 (92.5) | ||
| Silodosin 4 mg | NR/34 | 18 | 16 | 16 (88.8) | |
| Tamsulosin 0.2 mg | 16 | 14 | 14 (87.5) | ||
| Total | 34 | 30 | 30 (88.2) | ||
| Silodosin 4 mg | NR/102 | 51 | 42/88a | 42 (82.3) | |
| Tamsulosin 0.2 mg | 51 | 42/91a | 42 (82.3) | ||
| Total | 102 | 84/179a | 42 (82.3) | ||
| Silodosin 8 mg | 109/109 | 58 | 53 | 53 (91.3) | |
| Naftopidil 75 mg | 51 | 44 | 44 (86.2) | ||
| Total | 109 | 97 | 97 (88.9) | ||
| Silodosin 8 mg | NR/149 | 75 | NR | NR | |
| Tamsulosin 0.2 ‐ 0.4 mg | 74 | NR | NR | ||
| Total | 149 | NR | NR | ||
| Silodosin 8 mg | 136/136 | 45 | 41 | 41 (91.1) | |
| Tamsulosin 0.2 mg | 45 | 39 | 39 (86.6) | ||
| Naftopidil 50 mg | 46 | 42 | 42 (91.3) | ||
| Total | 136 | 122 | 122 (89.7) | ||
| Silodosin 8 mg | NR/46 | 23 | 23 | 23 (100.0) | |
| Tamsulosin 0.2 mg | 23 | 23 | 23 (100.0) | ||
| Total | 46 | 46 | 46 (100.0) | ||
| Silodosin 8 mg | NR/209 | 105 | 87 | 87 (82.8) | |
| Tamsulosin 0.2 mg | 104 | 83 | 83 (79.8) | ||
| Total | 209 | 170 | 170 (81.3) | ||
| Grand total | Interventions: silodosin | 1955 | 1684b | ||
| Compartors: placebo | 834 | 769 (92.2) | |||
| Compartors: tamsulosin | 1049 | 888b | |||
| Compartors: naftopidil | 380 | 333 (87.6) | |||
| Comparator: alfuzosin | 77 | 77 (100.0) | |||
| Overall | 4295 | 3751b | |||
| N: number; NR: not reported a Efficacy analysis/safety analysis. | |||||
| Outcome or subgroup title | No. of studies | No. of participants | Statistical method | Effect size |
| 1 Urologic symptom scores (short term) Show forest plot | 3 | 1743 | Mean Difference (IV, Random, 95% CI) | ‐2.65 [‐3.23, ‐2.08] |
| 2 Quality of life (short term) Show forest plot | 2 | 820 | Mean Difference (IV, Random, 95% CI) | ‐0.42 [‐0.71, ‐0.13] |
| 3 Treatment withdrawal due to any reason (short term) Show forest plot | 3 | 1703 | Risk Ratio (M‐H, Random, 95% CI) | 1.08 [0.70, 1.66] |
| 4 Treatment withdrawal due to adverse events (short term) Show forest plot | 4 | 1967 | Risk Ratio (M‐H, Random, 95% CI) | 2.29 [1.41, 3.72] |
| 5 Cardiovascular adverse events (short term) Show forest plot | 4 | 1967 | Risk Ratio (M‐H, Random, 95% CI) | 1.28 [0.67, 2.45] |
| 6 Sexual adverse events (short term) Show forest plot | 4 | 1967 | Risk Ratio (M‐H, Random, 95% CI) | 26.07 [12.36, 54.97] |
| Outcome or subgroup title | No. of studies | No. of participants | Statistical method | Effect size |
| 1 Urologic symptom scores (short term) Show forest plot | 10 | 1708 | Mean Difference (IV, Random, 95% CI) | ‐0.04 [‐1.31, 1.24] |
| 2 Quality of life (short term) Show forest plot | 10 | 1707 | Mean Difference (IV, Random, 95% CI) | ‐0.15 [‐0.53, 0.22] |
| 3 Treatment withdrawal due to any reason (short term) Show forest plot | 10 | 1573 | Risk Ratio (M‐H, Random, 95% CI) | 1.02 [0.62, 1.69] |
| 4 Treatment withdrawal due to adverse events (short term) Show forest plot | 9 | 1572 | Risk Ratio (M‐H, Random, 95% CI) | 1.96 [1.12, 3.44] |
| 5 Cardiovascular adverse events (short term) Show forest plot | 11 | 1955 | Risk Ratio (M‐H, Random, 95% CI) | 0.77 [0.53, 1.12] |
| 6 Sexual adverse events (short term) Show forest plot | 10 | 1849 | Risk Ratio (M‐H, Random, 95% CI) | 6.05 [3.55, 10.31] |
| Outcome or subgroup title | No. of studies | No. of participants | Statistical method | Effect size |
| 1 Urologic symptom scores (short term) Show forest plot | 5 | 652 | Mean Difference (IV, Random, 95% CI) | ‐0.85 [‐2.57, 0.87] |
| 2 Quality of life (short term) Show forest plot | 5 | 652 | Mean Difference (IV, Random, 95% CI) | ‐0.17 [‐0.60, 0.27] |
| 3 Treatment withdrawal due to any reason (short term) Show forest plot | 4 | 659 | Risk Ratio (M‐H, Random, 95% CI) | 1.25 [0.81, 1.93] |
| 4 Treatment withdrawal due to adverse events (short term) Show forest plot | 5 | 738 | Risk Ratio (M‐H, Random, 95% CI) | 1.38 [0.66, 2.89] |
| 5 Cardiovascular adverse events (short term) Show forest plot | 5 | 808 | Risk Ratio (M‐H, Random, 95% CI) | 1.02 [0.41, 2.56] |
| 6 Sexual adverse events (short term) Show forest plot | 4 | 405 | Risk Ratio (M‐H, Random, 95% CI) | 5.93 [2.16, 16.29] |
| Outcome or subgroup title | No. of studies | No. of participants | Statistical method | Effect size |
| 1 Urologic symptom scores (short term) Show forest plot | 1 | 60 | Mean Difference (IV, Random, 95% CI) | 3.83 [0.12, 7.54] |
| 2 Quality of life (short term) Show forest plot | 1 | 60 | Mean Difference (IV, Random, 95% CI) | 0.14 [‐0.46, 0.74] |
| 3 Cardiovascular adverse events (short term) Show forest plot | 1 | 60 | Risk Ratio (M‐H, Random, 95% CI) | 0.67 [0.36, 1.24] |
| 4 Sexual adverse events (short term) Show forest plot | 1 | 95 | Risk Ratio (M‐H, Random, 95% CI) | 37.21 [5.32, 260.07] |