Silodosina para el tratamiento de los síntomas urinarios bajos compatibles con hiperplasia prostática benigna
Resumen
Antecedentes
Diversos alfabloqueantes son usados para tratar los síntomas urinarios bajos (SUB) en pacientes con hiperplasia prostática benigna (HPB). La silodosina es un nuevo alfabloqueante más selectivo, específico de las vías urinarias bajas, que puede tener menos efectos secundarios en comparación con otros alfabloqueantes.
Objetivos
Evaluar los efectos de la silodosina para el tratamiento de los SUB en pacientes con HPB.
Métodos de búsqueda
Se realizó una búsqueda exhaustiva utilizando múltiples bases de datos (Cochrane Library, MEDLINE, EMBASE, Scopus, Google Scholar y Web of Science), registros de ensayos, otras fuentes de literatura gris y actas de congresos sin restricciones en el idioma de publicación o el estado de publicación hasta el 13 de junio de 2017.
Criterios de selección
Se incluyeron todos los ensayos controlados aleatorios paralelos. También se incluyeron diseños cruzados.
Obtención y análisis de los datos
Dos autores de la revisión de forma independiente clasificaron los estudios y extrajeron los datos de los estudios incluidos. Se realizaron análisis estadísticos utilizando un modelo de efectos aleatorios y se interpretaron de acuerdo con el Manual Cochrane para Revisiones Sistemáticas de Intervenciones (Cochrane Handbook for Systematic Reviews of Interventions). La calidad de la evidencia se calificó según el enfoque GRADE.
Resultados principales
Se incluyeron 19 estudios únicos con 4295 participantes asignados al azar a cuatro comparaciones para el seguimiento a corto plazo. La media de edad, volumen prostático y la International Prostate Symptom Score fueron de 66,5 años, 38,2 ml y 19,1; respectivamente.
Silodosina versus placebo
Sobre la base de cuatro estudios con un total de 1968 participantes aleatorios, la silodosina puede reducir las puntuaciones de los síntomas urológicos en un número significativo de pacientes (diferencia de medias [DM] ‐2,65; intervalo de confianza [IC] del 95%: ‐3,23 a ‐2,08; evidencia de baja calidad). La silodosina puede no llevar a una reducción clínicamente importante de la calidad de vida (DM ‐0,42; IC del 95%: ‐0,71 a ‐0,13; evidencia de calidad moderada). Puede no aumentar las tasas de retiro del tratamiento por cualquier motivo (riesgo relativo [RR] 1,08; IC del 95%: 0,70 a 1,66; evidencia de baja calidad). No hay seguridad acerca del efecto de la silodosina sobre los efectos adversos cardiovasculares (RR 1,28; IC del 95%: 0,67 a 2,45; evidencia de muy baja calidad). La silodosina puede aumentar los efectos adversos sexuales (RR 26,07; IC del 95%: 12,36 a 54,97; evidencia de calidad moderada); esto daría lugar a 180 efectos adversos sexuales más por cada 1000 pacientes (IC del 95%: 82 más a 388 más).
Silodosina versus tamsulosina
Sobre la base de 13 estudios con un total de 2129 participantes aleatorios, la silodosina puede dar lugar a poca o ninguna diferencia en las puntuaciones de los síntomas urológicos (DM ‐0,04; IC del 95%: ‐1,31 a 1,24; evidencia de baja calidad) y en la calidad de vida (DM ‐0,15; IC del 95%: ‐0,53 a 0,22; evidencia de baja calidad). No hay seguridad acerca de los retiros del tratamiento por cualquier motivo (RR 1,02; IC del 95%: 0,62 a 1,69; evidencia de muy baja calidad). La silodosina puede resultar en poca o ninguna diferencia en los efectos adversos cardiovasculares (RR 0,77; IC del 95%: 0,53 a 1,12; evidencia de baja calidad). La silodosina puede aumentar los efectos adversos sexuales (RR 6,05; IC del 95%: 3,55 a 10,31; evidencia de calidad moderada); esto daría lugar a 141 efectos adversos sexuales más por cada 1000 pacientes (IC del 95%: 71 más a 261 más).
Silodosina versus naftopidil
Sobre la base de cinco estudios con un total de 763 participantes aleatorios, la silodosina puede dar lugar a poca o ninguna diferencia en las puntuaciones de los síntomas urológicos (DM ‐0,85; IC del 95%: ‐2,57 a 0,87; evidencia de baja calidad), la calidad de vida (DM ‐0,17; IC del 95%: ‐0,60 a 0,27; evidencia de baja calidad), el retiro del tratamiento por cualquier motivo (RR 1,25; IC del 95%: 0,81 a 1,93; evidencia de baja calidad) y los efectos adversos cardiovasculares (RR 1,02; IC del 95%: 0,41 a 2,56; evidencia de baja calidad). La silodosina puede aumentar los efectos adversos sexuales (RR 5,93; IC del 95%: 2,16 a 16,29; evidencia de calidad moderada); esto daría lugar a 74 efectos adversos sexuales más por cada 1000 pacientes (IC del 95%: 17 más a 231 más).
Silodosina versus alfuzosina
Sobre la base de dos estudios con un total de 155 participantes aleatorios, la silodosina puede o no dar lugar a un aumento clínicamente importante de las puntuaciones de los síntomas urológicos (DM 3,83; IC del 95%: 0,12 a 7,54; evidencia de baja calidad). La silodosina puede resultar en poca o ninguna diferencia en la calidad de vida (DM 0,14; IC del 95%: ‐0,46 a 0,74; evidencia de calidad moderada). No se encontró ningún efecto del retiro del tratamiento por cualquier motivo. La silodosina puede no reducir los efectos adversos cardiovasculares (RR 0,67; IC del 95%: 0,36 a 1,24; evidencia de baja calidad) pero puede aumentar los efectos adversos sexuales (RR 37,21; IC del 95%: 5,32 a 260,07; evidencia de calidad moderada); esto daría lugar a 217 efectos adversos sexuales más por cada 1000 pacientes (IC del 95%: 26 más a 1000 más).
Conclusiones de los autores
La silodosina puede reducir las puntuaciones de los síntomas urológicos en un número significativo de pacientes en comparación con el placebo. La calidad de vida y los retiros del tratamiento por cualquier motivo parecen similares. La eficacia parece similar al de otros alfabloqueantes (tamsulosina, naftopidil y alfuzosina) aunque puede aumentar la tasa de efectos secundarios sexuales. Se disminuyó la confianza en las estimaciones del efecto debido a limitaciones, incongruencia e imprecisión de los estudios.
PICOs
Resumen en términos sencillos
Silodosina para el tratamiento de los síntomas urinarios bajos compatibles con hiperplasia prostática benigna
Pregunta de la revisión
¿Mejora la silodosina los síntomas urinarios molestos en los pacientes con próstata agrandada?
Antecedentes
El aumento de volumen prostático es común en hombres a medida que envejecen y puede causar dificultades en la micción como un chorro miccional débil, que obliga a levantarse de noche, y la sensación de que la vejiga no se vacía completamente. La silodosina es un medicamento más nuevo que puede ayudar con estos síntomas y causar menos efectos indeseables. Se realizó esta revisión para comparar la silodosina con un placebo (fármaco inactivo) y otros fármacos.
Características de los estudios
Se incluyeron 19 estudios con 4295 hombres. La edad promedio de los participantes fue 66,5 años. Todos los estudios incorporaron a hombres de más de 40 años e informaron que, en promedio, estos pacientes tenían un grado moderado de síntomas urinarios molestos.
Resultados clave
La silodosina puede mejorar los síntomas urinarios en comparación con el placebo. Puede tener efectos equivalentes sobre los síntomas urinarios, la calidad de vida, la interrupción del tratamiento por cualquier motivo y los efectos indeseables en comparación con otros fármacos. Sin embargo, puede aumentar los efectos secundarios sexuales en comparación con un placebo y otros fármacos.
Calidad de la evidencia
La calidad de la evidencia para este resultado se consideró baja. Lo anterior significa que el efecto verdadero puede ser significativamente diferente de lo que muestra esta revisión.
Conclusiones de los autores
Summary of findings
| Silodosin compared to placebo for the treatment of lower urinary tract symptoms in men with benign prostatic hyperplasia (short term) | |||||
| Participants: men with lower urinary tract symptoms suggesting benign prostatic hyperplasia Setting: likely outpatients Intervention: silodosin Comparator: placebo | |||||
| Outcomes | № of participants | Quality of the evidence | Relative effect | Anticipated absolute effects* (95% CI) | |
| Risk with placebo | Risk difference with silodosin | ||||
| Urologic symptom scores | 1743 | ⊕⊕⊝⊝ | ‐ | The mean change of urologic symptom scores ranged from ‐5.30 to ‐3.50 | MD 2.65 lower |
| QoL | 820 | ⊕⊕⊕⊝ | ‐ | The mean change of QoL ranged from ‐1.10 to ‐0.80 | MD 0.42 lower |
| Treatment withdrawal due to any reason | 1703 | ⊕⊕⊝⊝ | RR 1.08 | Study population | |
| 83 per 1000 | 7 more per 1000 | ||||
| Cardiovascular adverse events | 1967 | ⊕⊝⊝⊝ | RR 1.28 | Study population | |
| 42 per 1000 | 12 more per 1000 | ||||
| Assumed baseline riske | |||||
| 61 per 1000 | 17 more per 1000 | ||||
| Sexual adverse events | 1967 | ⊕⊕⊝⊝ | RR 26.07 | Study population | |
| 7 per 1000 | 180 more per 1000 | ||||
| *The risk in the intervention group (and its 95% confidence interval) is based on the assumed risk in the comparison group and the relative effect of the intervention (and its 95% CI). | |||||
| GRADE Working Group grades of evidence | |||||
| aDowngraded by one level for study limitations: unclear or high risk of bias for one or more domains among the included studies. | |||||
| Silodosin compared to tamsulosin for the treatment of lower urinary tract symptoms in men with benign prostatic hyperplasia (short term) | |||||
| Participants: men with lower urinary tract symptoms suggesting benign prostatic hyperplasia Setting: likely outpatients Intervention: silodosin Comparator: tamsulosin | |||||
| Outcomes | № of participants | Quality of the evidence | Relative effect | Anticipated absolute effects* (95% CI) | |
| Risk with tamsulosin | Risk difference with silodosin | ||||
| Urologic symptom scores | 1708 | ⊕⊕⊝⊝ | ‐ | The mean change of urologic symptom scores ranged from ‐15.60 to ‐4.60 | MD 0.04 lower |
| QoL | 1707 | ⊕⊕⊝⊝ | ‐ | The mean change of QoL ranged from ‐3.60 to ‐0.90 | MD 0.15 lower |
| Treatment withdrawal due to any reason | 1573 | ⊕⊝⊝⊝ | RR 1.02 | Study population | |
| 121 per 1000 | 2 fewer per 1000 | ||||
| Cardiovascular adverse events | 1955 | ⊕⊕⊝⊝ | RR 0.77 | Study population | |
| 63 per 1000 | 14 fewer per 1000 | ||||
| Sexual adverse events | 1849 | ⊕⊕⊕⊝ | RR 6.05 | Study population | |
| 28 per 1000 | 141 more per 1000 | ||||
| *The risk in the intervention group (and its 95% confidence interval) is based on the assumed risk in the comparison group and the relative effect of the intervention (and its 95% CI). | |||||
| GRADE Working Group grades of evidence | |||||
| aDowngraded by one level for study limitations: unclear or high risk of bias for one or more domains among the included studies. | |||||
| Silodosin compared to naftopidil for the treatment of lower urinary tract symptoms in men with benign prostatic hyperplasia (short term) | |||||
| Participants: men with lower urinary tract symptoms suggesting benign prostatic hyperplasia Setting: likely outpatients Intervention: silodosin Comparator: naftopidil | |||||
| Outcomes | № of participants | Quality of the evidence | Relative effect | Anticipated absolute effects* (95% CI) | |
| Risk with naftopidil | Risk difference with silodosin | ||||
| Urologic symptom scores | 652 | ⊕⊕⊝⊝ | ‐ | The mean change of urologic symptom scores ranged from ‐7.52 to ‐3.56 | MD 0.85 lower |
| QoL | 652 | ⊕⊕⊝⊝ | ‐ | The mean change of QoL ranged from ‐1.60 to ‐0.95 | MD 0.17 lower |
| Treatment withdrawal due to any reason | 659 | ⊕⊕⊝⊝ | RR 1.25 | Study population | |
| 102 per 1000 | 25 more per 1000 | ||||
| Cardiovascular adverse events | 808 | ⊕⊕⊝⊝ | RR 1.02 | Study population | |
| 23 per 1000 | 0 more per 1000 | ||||
| Sexual adverse events | 405 | ⊕⊕⊕⊝ | RR 5.93 | Study population | |
| 15 per 1000 | 74 more per 1000 | ||||
| *The risk in the intervention group (and its 95% confidence interval) is based on the assumed risk in the comparison group and the relative effect of the intervention (and its 95% CI). | |||||
| GRADE Working Group grades of evidence | |||||
| aDowngraded by one level for study limitations: unclear or high risk of bias for one or more domains among the included studies. | |||||
| Silodosin compared to alfuzosin for the treatment of lower urinary tract symptoms in men with benign prostatic hyperplasia (short term) | |||||
| Participants: men with lower urinary tract symptoms suggesting benign prostatic hyperplasia Setting: likely outpatients Intervention: silodosin Comparator: alfuzosin | |||||
| Outcomes | № of participants | Quality of the evidence | Relative effect | Anticipated absolute effects* (95% CI) | |
| Risk with alfuzosin | Risk difference with silodosin | ||||
| Urologic symptom scores | 60 | ⊕⊕⊝⊝ | ‐ | The mean change of urologic symptom scores was ‐16.93 | MD 3.83 higher |
| QoL | 60 | ⊕⊕⊕⊝ | ‐ | The mean change of QoL was ‐4.27 | MD 0.14 higher |
| Treatment withdrawal due to any reason | 60 | ⊕⊕⊝⊝ | Not estimable | Study population | |
| ‐ | ‐ | ||||
| Cardiovascular adverse events | 60 | ⊕⊕⊝⊝ | RR 0.67 | Study population | |
| 500 per 1000 | 165 fewer per 1000 | ||||
| Assumed baseline riskd | |||||
| 44 per 1000 | 15 fewer per 1000 | ||||
| Sexual adverse events | 95 | ⊕⊕⊝⊝ | RR 37.21 | Study population | |
| 21 per 1000 | 770 more per 1000 | ||||
| Assumed baseline riskd | |||||
| 6 per 1000 | 217 more per 1000 | ||||
| *The risk in the intervention group (and its 95% confidence interval) is based on the assumed risk in the comparison group and the relative effect of the intervention (and its 95% CI). | |||||
| GRADE Working Group grades of evidence | |||||
| aDowngraded by one level for study limitations: unclear or high risk of bias for one or more domains in the included study. | |||||
Antecedentes
Descripción de la afección
La hiperplasia prostática benigna (HPB) se caracteriza por un proceso proliferativo no regulado del tejido conjuntivo, músculo liso y epitelio glandular en el interior de la próstata, y es una de las afecciones más frecuentes en los hombres mayores (Roehrborn 2008). La prevalencia de la HPB aumenta de manera significativa con el aumento de la edad. En estudios de autopsias se ha observado una prevalencia histológica de un 40% y un 70% en el sexto y octavo decenios de la vida, respectivamente (Barry 1997; Egan 2016; Roehrborn 2008). La HPB puede causar síntomas urinarios bajos (SUB) molestos, como los trastornos del almacenamiento (como urgencia urinaria diurna y nicturia) o de la micción (como dificultad para iniciar la micción, chorro urinario débil, esfuerzo miccional y micción prolongada) o ambos (AUA Practice Guidelines Committee 2003; EAU 2017; McVary 2011). Los SUB secundarios a la HPB (SUB/HPB) pueden repercutir negativamente en la salud pública y reducir la calidad de vida porque la HPB puede progresar con el transcurso del tiempo y causar graves consecuencias, como retención urinaria aguda (RUA), infección urinaria y deterioro de las vías urinarias altas (Crawford 2006; Kozminski 2015; Martin 2014). En 2000, el costo del tratamiento directo para SUB/HPB en los EE.UU. fue de más de mil millones de dólares estadounidenses. Sobre la base de los datos del Hospital Episode Statistics del Reino Unido, SUB/HPB es la quinta enfermedad más costosa y cuesta 1160 millones de libras esterlinas por año (Cornu 2010).
Diagnóstico
La evaluación inicial de SUB/HPB incluye el interrogatorio del paciente, la revisión de los fármacos actuales, la exploración física incluido tacto rectal, análisis de orina, registro de frecuencia y volumen y cuestionarios de síntomas validados como la International Prostate Symptom Score (IPSS) y el BPH Impact Index (BII) (EAU 2017; Juliao 2012; McVary 2011). El cuestionario IPSS está compuesto de tres dominios relacionados con los síntomas de almacenamiento (frecuencia, urgencia y nicturia); cuatro dominios relacionados con los síntomas miccionales (dificultad para iniciar la micción, chorro débil, intermitencia y evacuación incompleta); y un dominio de calidad de vida (AUA Practice Guidelines Committee 2003; Barry 1992). Siete dominios de síntomas usan una escala de seis puntos que varía de 0 (ninguno) a 5 (5 o más) (Barry 1992). Al dominio de calidad de vida se le asigna una puntuación de 1 a 6 (ordinal; intervalo de 0 a 6: 0 = muy complacido, 1 = complacido, 2 = en su mayoría satisfecho, 3 = contradictorio, 4 = en su mayoría insatisfecho, 5 = infeliz, 6 = muy mal) (AUA Practice Guidelines Committee 2003; Barry 1992).
De manera simultánea con el IPSS, el BII se desarrolló para evaluar el efecto de SUB/HPB sobre la salud de los pacientes. El cuestionario BII está compuesto de cuatro ítems: malestar físico (0 = ninguno, 1 = poco, 2 = bastante, 3 = mucho); preocupación (0 = ninguna, 1 = poca, 2 = bastante, 3= mucha); molestia (0 = ninguna, 1 = poca, 2 = bastante, 3 = mucha); interferencia en las actividades cotidianas (0 = nunca, 1= a veces, 2 = bastante, 3 = casi siempre, 4 = todo el tiempo) (Barry 1995). Además, la medición de la velocidad de flujo máxima (Qmax) y el residuo posmiccional (RPM) son pruebas no invasivas ampliamente usadas para evaluar el funcionamiento compartido entre la vejiga y la próstata (EAU 2017; McVary 2011). Aunque no se han determinado los umbrales de diagnóstico de Qmax y RPM, el Qmax bajo y el RPM grande se han asociado con un mayor riesgo de deterioro de los síntomas (Crawford 2006; Kozminski 2015). Otros exámenes optativos son los estudios por imágenes de las vías urinarias y la próstata, la evaluación urodinámica de la función vesical y la cistoscopia para predecir la respuesta al tratamiento médico o determinar la necesidad de tratamiento invasivo y, en consecuencia, el mejor abordaje (EAU 2017; McVary 2011).
Tratamiento
Las decisiones terapéuticas se basan en los síntomas y el grado de molestia (EAU 2017; McVary 2011). La conducta expectante es una estrategia terapéutica razonable para los hombres con SUB leves (IPSS: 0 a 7) o los que no perciben los síntomas como especialmente molestos (Netto 1999). Las intervenciones del estilo de vida como la modificación de la ingestión de líquidos o la higiene pueden usarse como tratamientos conservadores en los hombres con SUB leves (Yap 2009). En pacientes con SUB molestos, moderados (IPSS: 8 a 19) a severos (IPSS: 20 a 35), los tratamientos quirúrgicos y médicos son la opción terapéutica, y la elección del tratamiento depende de ciertos factores como la gravedad de la enfermedad, el riesgo de evolución, la preferencia del paciente y la morbilidad (EAU 2017; McVary 2011).
Recientemente, se ha dilucidado el componente dinámico de la HPB, con un énfasis en los síntomas en lugar del aumento de volumen prostático, que ha llevado a un cambio de la cirugía al tratamiento médico (Yoo 2012). Los bloqueadores de los receptores alfa (BA), que reducen el tono del músculo liso de la próstata y del cuello vesical, con o sin inhibidores de la 5 alfa reductasa (I‐5AR), que reducen el volumen prostático a través de la inducción de atrofia epitelial, son un tratamiento establecido en SUB/HPB y han sido ampliamente usados como tratamiento de primera línea durante decenios (McConnell 2003; Milani 2005; Yoo 2012). Sobre todo los BA, que pueden disminuir el tono de músculo liso de la próstata y cuello vesical, se han considerado la farmacoterapia fundamental para los pacientes con HPB (Cornu 2010; Milani 2005; Yoo 2012). En revisiones sistemáticas previas, se ha indicado que los BA pueden reducir típicamente la IPSS en un 20% a un 50% y aumentar el Qmax en un 15% a un 45% (MacDonald 2005; Wilt 2006). Los BA son la categoría más comúnmente prescrita de fármacos y representan cerca de un 70% de todos los fármacos prescritos en 2008 (Cornu 2010). Los efectos adversos de los BA incluyen: hipotensión postural, mareos, cefalea, astenia, síncope, edema periférico y eyaculación retrógrada, que hacen que cerca de un 4% a un 10% de los hombres dejen el tratamiento (Djavan 1999; Gacci 2014; MacDonald 2005; Schulman 2003; Wilt 2006).
Se han usado otros tratamientos médicos, como los anticolinérgicos y la desmopresina, con los BA, según los síntomas principales de los pacientes (Brasure 2016; Dahm 2016; EAU 2017). Alternativamente, un inhibidor de la fosfodiesterasa tipo 5, tadalafil (5 mg una vez al día), se ha autorizado para el tratamiento de los SUB masculinos en los últimos años, y se han propuesto diversos extractos vegetales para el tratamiento de SUB masculinos (EAU 2017; Keehn 2016; Oelke 2012). En pacientes con SUB/HPB con escasa respuesta al tratamiento conservador/médico o en los casos de indicaciones clínicas absolutas (p.ej. RUA, infección urinaria recurrente, cálculos o divertículos vesicales, hematuria o insuficiencia renal), deben considerarse las técnicas quirúrgicas (EAU 2017; McVary 2011). La resección transuretral de la próstata (RTUP) se considera el procedimiento quirúrgico estándar para el tratamiento de los SUB/HPB (EAU 2017; Juliao 2012; McVary 2011). Recientemente, las terapias con láser mínimamente invasivas, como la resección de la próstata con láser de holmio y la vaporización fotoselectiva fueron introducidas como opciones terapéuticas de la RTUP (Nair 2016).
Descripción de la intervención
La silodosina es un nuevo subtipo selectivo de BA que se aprobó en Japón en 2006 y más recientemente en los EE.UU. y Europa (Kawabe 2006a; Yoshida 2007). Un ensayo inicial aleatorio, controlado con placebo, que se realizó en Japón mostró una mayor reducción de la IPSS después del tratamiento de 12 semanas en comparación con tamsulosina (un BA bien establecido para los SUB) y un placebo. Además, se halló un beneficio clínico de la IPSS en el grupo de silodosina sobre el placebo de la primera semana en adelante (Kawabe 2006a). No hubo diferencias significativas de la incidencia de los efectos adversos cardiovasculares entre los grupos de silodosina y tamsulosina. La eyaculación anormal fue más frecuente en el grupo de silodosina que en el grupo de tamsulosina (22,3% versus 1,6%) pero sólo cinco hombres (2,9%) interrumpieron el tratamiento por esta razón (Kawabe 2006a).
De qué manera podría funcionar la intervención
Los receptores adrenérgicos A1a son una clase de receptores acoplados a la proteína G que consta de tres subtipos homólogos: A1a, A1b y A1d. El subtipo receptor A1a predomina en la próstata, el cuello vesical y la uretra humanas (Minneman 1994; Schilit 2009). Por otro lado, los subtipos de receptores A1b se expresan principalmente en la vasculatura periférica y son importantes en la regulación de la presión arterial. El receptor A1d se expresa en el músculo detrusor de la vejiga y la región sacra de la médula espinal (Minneman 1994; Schilit 2009). En el estudio in vitro inicial, se mostró que la silodosina tuvo un alto cociente de unión (162:1) a los receptores A1a versus A1b, que pueden ser más específicos de las vías urinarias inferiores, y por lo tanto pueden inducir un efecto terapéutico sin efectos secundarios cardiovasculares, como mareos, cefalea e hipotensión ortostática relacionada a la vasodilatación, en comparación con otros BA, que no tienen ninguna selectividad específica para los diferentes subtipos de receptores adrenérgicos (alfuzosina, doxazosina, terazosina) o una selectividad limitada para el receptor A1a (tamsulosina) (Osman 2012; Schilit 2009; Yoshida 2007).
Por qué es importante realizar esta revisión
No está claro si la alta afinidad de la silodosina para el receptor adrenérgico A1a se traduce en más beneficios y menos efectos adversos clínicos en la práctica clínica (Cui 2012; Novara 2013). Aunque hay revisiones sistemáticas que comparan silodosina con otros agentes usados para tratar a los pacientes con SUB/HPB, ninguno hasta el presente ha usado la misma metodología rigurosa que las revisiones Cochrane, que incluyen el enfoque GRADE (Cui 2012; Fusco 2016; Novara 2013). En esta época, con la disponibilidad de numerosos BA para tratar SUB/HPB, los resultados de esta revisión Cochrane serán relevantes para los elaboradores de políticas, los profesionales de la salud y los pacientes.
Objetivos
Evaluar los efectos de la silodosina para el tratamiento de los SUB en pacientes con HPB.
Métodos
Criterios de inclusión de estudios para esta revisión
Tipos de estudios
Se incluyeron ensayos controlados aleatorios y paralelos de forma independiente del estado o el idioma de la publicación. También se incluyeron diseños cruzados.
Tipos de participantes
Se incorporaron pacientes adultos (a partir de los 40 años) con SUB/HPB. La limitación de edad se basó en la observación de que la prevalencia de la HPB aumenta en los hombres de mediana edad y mayores (Barry 1997; Egan 2016) y es poco frecuente en los hombres más jóvenes.
Se excluyeron los ensayos de pacientes con vejiga neurogénica conocida por lesiones de la médula espinal, esclerosis múltiple o enfermedades del sistema nervioso central, y los pacientes que ya han sido tratados con cirugía para la HPB. Se incluyeron estudios en los que sólo un subconjunto de participantes era relevante para esta revisión.
Tipos de intervenciones
Se programó investigar las siguientes comparaciones de la intervención experimental versus la intervención de comparación. Las intervenciones concomitantes debían ser las mismas en los grupos intervención y comparador para establecer comparaciones justas.
Intervenciones experimentales
-
Silodosina
-
Silodosina + cualquier 5‐IRA (si estaban disponibles)
La silodosina 8 mg/día es la dosificación clínicamente recomendada en Japón, Europa y los EE.UU. (Chapple 2011; Kawabe 2006a; Marks 2009). Un estudio reciente informó que la silodosina 4 mg/día fue también útil en pacientes japoneses con HPB para mejorar el cumplimiento del tratamiento (Seki 2015). Se incluyeron ensayos con una dosificación de silodosina de 8 mg/día (4 mg dos veces al día o 8 mg una vez al día) y 4 mg/día.
Intervenciones de comparación
-
Placebo
-
Otros BA
-
Otros BA + cualquier 5‐IRA (si estaban disponibles)
Comparaciones
-
Silodosina versus placebo
-
Silodosina versus otros BA
-
Silodosina + cualquier 5‐IRA versus otros BA + cualquier 5‐IRA (si estaban disponibles)
Tipos de medida de resultado
No se usó la medición de los resultados evaluados en esta revisión como criterio de elegibilidad.
Resultados primarios
-
Puntuaciones de los síntomas urológicos
-
Calidad de vida
-
Retiros del tratamiento por cualquier motivo
Resultados secundarios
-
Retiros del tratamiento debido a efectos adversos
-
RUA
-
Cirugía para SUB/HPB
-
Efectos adversos cardiovasculares
-
Efectos adversos sexuales
Método y momento adecuado de la medición de los resultados
-
Puntuaciones de los síntomas urológicos: valor final o cambio desde el inicio evaluados con una escala validada (como IPSS)
-
Calidad de vida: valor final o cambio desde el inicio evaluados con una escala validada (como las puntuaciones BII o IPSS‐calidad de vida)
-
Retiros del tratamiento por cualquier motivo: definidos como la interrupción del tratamiento por cualquier causa en cualquier momento después de que los participantes se asignaran al azar a grupos de intervención/comparadores
-
Retiros del tratamiento debido a efectos adversos: definidos como la interrupción del tratamientos por un evento adverso en cualquier momento después de que los participantes se asignaran al azar a grupos de intervención/comparadores
-
RUA: eventos que requirieron la colocación de una sonda después de la intervención
-
Cirugía para SUB/HPB: eventos que requirieron otras modalidades de tratamiento quirúrgico (p.ej. RTUP) después de la intervención
-
Efectos adversos cardiovasculares: como mareos, cefalea, hipotensión ortostática y síncope
-
Efectos adversos sexuales: como eyaculación retrógrada, aneyaculación y disminución de la libido
Se usó la diferencia clínicamente importante en los resultados de revisión para valorar la calidad de la evidencia en las tablas de "Resumen de resultados" (Jaeschke 1989; Johnston 2013). Cuando la diferencia de medias (DM) o el cociente de riesgos (CR) es igual o más grande que la diferencia mínima importante clínicamente (DMCI), se supondría que muchos pacientes pueden haber obtenido una mejoría clínicamente significativa con el tratamiento; cuando la DM es de al menos la mitad de la DMCI pero menor que la DMCI, un número apreciable de pacientes puede haber obtenido una mejoría clínicamente significativa; y cuando la DM es menos de la mitad de la DMCI, es poco probable que un número apreciable de pacientes haya logrado una mejoría clínicamente significativa (Johnston 2010). Se consideró que la DMCI en la puntuación IPSS y BII era de 3 y 0,5 puntos, respectivamente (Barry 1995). No se encontró información publicada sobre una DMCI para la pregunta IPSS‐calidad de vida. Se usó una DMCI de 1 para evaluar la eficacia y la efectividad comparativa (Brasure 2016). No se establecieron umbrales para los retiros del tratamiento por los efectos adversos, la RUA, la cirugía para SUB/HPB, los efectos adversos cardiovasculares ni los efectos adversos sexuales. Se consideraron las diferencias clínicamente importantes de todos los resultados enumerados anteriormente como un aumento del riesgo relativo de al menos un 25% (Guyatt 2011a).
Se consideraron los resultados medidos hasta 12 meses inclusive tras de la asignación al azar como corto plazo y después de los 12 meses como largo plazo.
-
Hasta 12 meses (corto plazo)
-
Más de 12 meses (largo plazo)
Resultados principales de la tabla "Resumen de los hallazgos"
Se presenta una tabla de "Resumen de los hallazgos" que informa los siguientes resultados enumerados según la prioridad.
-
Puntuaciones de los síntomas urológicos
-
Calidad de vida
-
Retiros del tratamiento por cualquier motivo
-
Efectos adversos cardiovasculares
-
Efectos adversos sexuales
Results
Description of studies
Results of the search
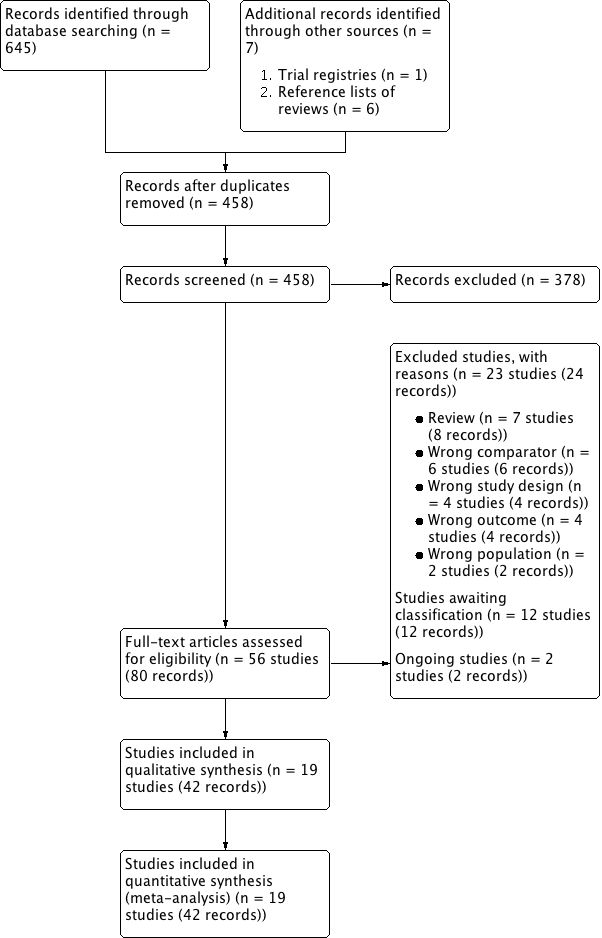
We identified 645 records through electronic database searching, including 52 records in trials registers. We found no records in the grey literature repository nor through handsearching abstract proceedings of relevant meetings from the last three years. We identified further six records through other sources by searching the reference lists of reviews (Alcántara Montero 2016; Brasure 2016) and one additional protocol for Takeshita 2016. After removal of duplicates, we screened the titles and abstracts of 458 records, and excluded 378 records. We screened 80 full‐text articles, and excluded 23 studies (24 records) that did not meet the inclusion criteria or were not relevant to the question under trial. Two studies are ongoing and 12 studies are awaiting classification. We included a total of 19 studies (42 records) in the review. The flow of literature through the assessment process is shown in the PRISMA flowchart (Figure 1).
Flow diagram
Included studies
Details of included studies are presented elsewhere (see Characteristics of included studies; Table 1; Table 2).
| Study name | Trial | Country | Setting | Description of participants | Intervention(s) | Duration of | Age | Prostate volume | IPSS |
| 2006‐2007 | Europe | 72 hospital clinics and inpatient units in 11 countries | Men ≥ 50 years with LUTS (defined by a stable IPSS total score ≥ 13 points), bladder outlet obstruction (defined by a Qmax between 4 and 15 mL/s, with a minimum voided volume of ≥ 125 mL) | Silodosin 8 mg once daily | 12 weeks | 65.8 ± 7.70 | NR | 19.1 ± 4.2 | |
| Tamsulosin 0.4 mg once daily | 65.9 ± 7.41 | 18.9 ± 4.3 | |||||||
| Placebo once daily | 66.0 ± 7.37 | 19.3 ± 4.3 | |||||||
| NR | South Korea | NR | Sexually active men with BPH | Silodosin 8 mg once daily | 4 weeks | NR | NR | NR | |
| Tamsulosin 0.2 mg once daily | |||||||||
| Alfuzosin 10 mg once daily | |||||||||
| NR | Japan | 88 centers/outpatient | Men ≥ 50 years with LUTS (IPSS of ≥ 8, an associated QoL score of ≥ 3) and prostate volume of ≥ 20 mL | Silodosin 4 mg twice daily | 12 weeks | 65.4 ± 7.0 | 36.0 ± 16.9 | 17.1 ± 5.7 | |
| Tamsulosin 0.2 mg once daily | 65.6 ± 7.0 | 35.7 ± 14.4 | 17.0 ± 5.7 | ||||||
| Placebo twice daily | 65.0 ± 6.9 | 35.2 ± 16.0 | 17.1 ± 6.1 | ||||||
| 2013‐2014 | India | Tertiary care hospital | Men ≥ 45 years with symptomatic BPH with LUTS (IPSS of ≥ 8, QoL of ≥ 3, and Qmax of < 15 mL/s, but > 4 mL/s with a voided volume of > 100 mL) | Silodosin 8 mg once daily | 12 weeks | 64.00 ± 11.14 | 40.57 ± 16.45 | 15.93 ± 6.03 | |
| Tamsulosin 0.4 mg once daily | 63.60 ± 9.05 | 40.33 ± 21.55 | 21.63 ± 7.63 | ||||||
| Alfuzosin 10 mg once daily | 63.43 ± 8.91 | 44.43 ± 27.72 | 19.2 ± 9.6 | ||||||
| 2005‐2006 | USA | Multicenter | Men ≥ 50 years with IPSS ≥ 13, Qmax 4 mL/s‐15 mL/s and a PVR < 250 mL | Silodosin 8 mg once daily | 12 weeks | 64.6 ± 8.1 | NR | 21.3 ± 5.1 | |
| Placebo once daily | 64.7 ± 8.1 | 21.3 ± 4.9 | |||||||
| 2009‐2011 | Japan | NR | Men ≥ 50 years with prostate estimated volume of > 20 mL, IPSS ≥ 8, QoL score ≥ 3 points | Silodosin 2 mg‐4 mg twice/d for 2 weeks, followed by 4 mg twice/d for 4 weeks | 6 weeks (before cross‐over)/total 12 weeks | 66.5 ± 5.6 | 38.8 ± 13.1 | 18.6 ± 5.5 | |
| Naftopidil 50 mg‐75 mg once/d for 2 weeks, followed by 75 mg once/d for 4 weeks | 68.5 ± 5.7 | 45.7 ± 17.8 | 17.6 ± 5.0 | ||||||
| 2012‐2013 | Japan | 52 urologists participated at a total of 44 investigational sites/outpatients | Men with LUTS (IPSS ≥ 8, IPSS QoL score 3) and prostate volume ≥ 20 mL | Silodosin 4 mg/d for 4 weeks, followed by 8 mg/d for 8 weeks | 12 weeks | 70.6 ± 7.8 | 39.6 ± 16.7 | 18.8 ± 6.2 | |
| Naftopidil 50 mg/d for 4 weeks, followed by 75 mg/d for 8 weeks | 70.3 ± 7.8 | 38.6 ± 14.8 | 18.9 ± 6.1 | ||||||
| 2006‐2007 | Japan | Multicenter | Men with IPSS ≥ 8 points; QoL score ≥ 3 points; prostate volume measured by ultrasonographic method ≥ 20 mL; void volume ≥ 100 mL; and maximal urinary flow rate (Qmax) < 15 mL/s | Silodosin 4 mg twice daily | 4 weeks (before cross‐over)/total 8 weeks | 68.2 ± 8.6 | 41.3 ± 25.3 | 16.6 ± 5.2 | |
| Tamsulosin 0.2 mg once daily | 70.1 ± 8.9 | 37.8 ± 16.3 | 18.2 ± 5.8 | ||||||
| 2013‐2015 | India | Tertiary hospital | Men > 50 years with bothersome LUTS from BPH and IPSS > 7 | Silodosin 8 mg once daily | 12 weeks | 61 ‐ 62 | NR | NR | |
| Tamsulosin 0.4 mg once daily | |||||||||
| 2009 | NR | NR | Men ≥ 50 years, with symptoms of moderate‐severe BPH and nocturia (≥ 2 episodes/night) | Silodosin 8 mg daily | 12 weeks | 64.6 ± 8.03 | NR | NR | |
| Placebo once daily | 64.2 ± 8.92 | ||||||||
| 2012‐2013 | India | Tertiary care hospital/ outpatient | Men > 50 years with bothersome LUTS from BPH and IPSS > 7 | Silodosin 8 mg once daily | 12 weeks | 61.4 ± 7.88 | 42.0 ± 19.96 | 18.4 ± 3.32 | |
| Tamsulosin 0.4 mg once daily | 62.6 ± 7.55 | 35.6 ± 9.56 | 18.4 ± 3.94 | ||||||
| 2007‐2011 | Japan | Kobe University School or other collaborating institutions | Men with LUTS (total IPSS ≥ 8, QoL index ≥ 3) and prostate volume ≥ 20 mL | Silodosin 4 mg twice daily | 8 weeks | 70.98 ± 6.69 | 38.24 ± 12.94 | 17.53 ± 5.4 | |
| Naftopidil 50 mg once daily | 70.50 ± 6.58 | 39.39 ± 25.96 | 17.56 ± 6.7 | ||||||
| 2011‐2014 | Japan | Four community‐based hospitals | Men aged ≥ 50 years with LUTS/BPH, an IPSS of ≥ 8, QoL score of ≥ 3, and ultrasound‐estimated prostatic volume of ≥ 20 mL | Silodosin 4 mg once daily | 4 weeks (before cross‐over)/total 8 weeks | 69.6 ± 5.4 | 38.7 ± 11.6 | 17.1 ± 7.3 | |
| Tamsulosin 0.2 mg once daily | 69.4 ± 7.0 | 47.3 ± 30.4 | 15.2 ± 7.0 | ||||||
| 2008‐2009 | Japan | Three institutions | Men with LUTS associated with BPH and had an IPSS ≥ 8 and an IPSS‐QoL score ≥ 2 | Silodosin 4 mg twice daily | 4 weeks (before cross‐over)/total 8 weeks | 69.3 ± 8.3 | 36.6 ± 18.3 | 16.4 ± 5.0 | |
| Tamsulosin 0.2 mg once daily | 69.9 ± 8.4 | 35.1 ± 13.0 | 18.1 ± 6.2 | ||||||
| 2007‐2010 | Japan | Nihon University School of Medicine | Men with BPH, ≥ 50 years with significant LUTS (IPSS ≥ 8, QoL score ≥ 3) | Silodosin 8 mg/ day | 12 weeks | 69.3 ± 7.8 | 33.2 ± 21.2 | 16.9 ± 5.5 | |
| Naftopidil 75 mg/ day | 70.0 ± 7.0 | 39.5 ± 18.0 | 18.9 ± 7.0 | ||||||
| NR | NR | NR | Men with LUTS (IPSS total score ≥ 8, Qmax < 15 mL/s) and prostate volume > 20 mL | Silodosin 4 mg twice daily | 12 months | 71.3 ± 8.2 | 42.0 ± 23.7 | 18.8 ± 7.3 | |
| Tamsulosin 0.2 ‐ 0.4 mg daily | 72.2 ± 7.6 | 41.2 ± 23.0 | 17.8 ± 6.4 | ||||||
| NR | Japan | Kawasaki Medical School | Men aged 50–‐80 years and with IPSS ≥ 8 | Silodosin 4 mg twice daily | 12 weeks | 70.2 ± 0.9 | 33.3 ± 2.3 | 18.7 ± 0.7 | |
| Tamsulosin 0.2 mg once daily | 71.5 ± 1.1 | 32.5 ± 2.0 | 18.0 ± 1.1 | ||||||
| Naftopidil 50 mg once daily | 69.1 ± 1.2 | 35.0 ± 3.1 | 17.4 ± 0.8 | ||||||
| 2008‐2010 | Japan | Single center | Men aged 50 years who had a total IPSS ≥ 8 and a QoL index ≥ 3 | Silodosin 4 mg twice daily | 3 months (before cross‐over)/1 month wash‐out/3 months (after cross‐over)/total 7 months | 68.9 ± 5.6 | 35.0 ± 18.4 | 19.3 ± 4.9 | |
| Tamsulosin 0.2 mg once daily | 70.0 ± 6.8 | 36.1 ± 15.5 | 21.1 ± 6.8 | ||||||
| 2007‐2008 | Taiwan | Nine medical centers | Men aged ≥ 40 years with an IPSS of ≥ 13 and prostate volume of ≥ 20 mL | Silodosin 4 mg twice daily | 12 weeks | 67.5 ± 9.3 | 44.8 ± 24.2 | 19.3 ± 4.5 | |
| Tamsulosin 0.2 mg and one placebo | 65.0 ± 8.8 | 38.2 ± 16.7 | 19.8 ± 4.5 |
BPH: benign prostatic hyperplasia; IPSS: International Prostate Symptom Score; LUTS: lower urinary tract symptoms; NR: not reported; PVR: postvoid residual; Qmax: maximum flow rate; QoL: quality of life
| Study name | Intervention(s) and comparator(s) | Screened/eligible (N) | randomized (N) | Analysed (N) | Finishing trial (N (%)) |
| Silodosin 8 mg | 1228/955 | 381 | 346 | 356 (93.4) | |
| Tamsulosin 0.4 mg | 384 | 347 | 364 (94.7) | ||
| Placebo | 190 | 168 | 172 (90.5) | ||
| Total | 955 | 861 | 892 (93.4) | ||
| Silodosin 8 mg | NR/138 | 48 | 48 | 48 (100.0) | |
| Tamsulosin 0.2 mg | 43 | 43 | 43 (100.0) | ||
| Alfuzosin 10 mg | 47 | 47 | 47 (100.0) | ||
| Total | 138 | 138 | 138 (100.0) | ||
| Silodosin 8 mg | NR/457 | 176 | 175 | 175 (99.4) | |
| Tamsulosin 0.2 mg | 192 | 192 | 192 (100.0) | ||
| Placebo | 89 | 89 | 89 (100.0) | ||
| Total | 457 | 456 | 456 (99.7) | ||
| Silodosin 8 mg | NR/90 | 30 | 30 | 30 (100.0) | |
| Tamsulosin 0.4 mg | 30 | 30 | 30 (100.0) | ||
| Alfuzosin 10 mg | 30 | 30 | 30 (100.0) | ||
| Total | 90 | 90 | 90 (100.0) | ||
| Silodosin 8 mg | 2849/923 | 466 | 466 | 413 (88.6) | |
| Placebo | 457 | 457 | 419 (91.6) | ||
| Total | 923 | 923 | 832 (90.1) | ||
| Silodosin 4 mg or 8 mg | NR/92 | 44 | 30/83a | 30 (68.1) | |
| Naftopidil 50 mg or 75 mg | 48 | 34/79a | 34 (70.8) | ||
| Total | 92 | 64/162a | 64 (69.5) | ||
| Silodosin 4 mg followed by 8 mg | NR/350 | 175 | 157 | 157 (89.7) | |
| Naftopidil 50 mg followed by 75 mg | 175 | 157 | 157 (89.7) | ||
| Total | 350 | 314 | 314 (89.7) | ||
| Silodosin 8 mg | NR/97 | 46 | 34 | 34 (73.9) | |
| Tamsulosin 0.2 mg | 51 | 31 | 31 (60.7) | ||
| Total | 97 | 65 | 65 (67.0) | ||
| Silodosin 8 mg | NR/57 | 28 | NR | NR | |
| Tamsulosin 0.4 mg | 29 | NR | NR | ||
| Total | 57 | NR | NR | ||
| Silodosin 8 mg | 215/209 | 111 | 111 | 97 (87.3) | |
| Placebo | 98 | 98 | 89 (90.8) | ||
| Total | 209 | 209 | 186 (88.9) | ||
| Silodosin 8 mg | 102/61 | 32 | 26 | 26 (81.2) | |
| Tamsulosin 0.4 mg | 29 | 27 | 27 (93.1) | ||
| Total | 61 | 53 | 53 (86.8) | ||
| Silodosin 8 mg | NR/121 | 61 | 56/59a | 56 (91.8) | |
| Naftopidil 50 mg | 60 | 56/57a | 56 (93.3) | ||
| Total | 121 | 112/116a | 112 (92.5) | ||
| Silodosin 4 mg | NR/34 | 18 | 16 | 16 (88.8) | |
| Tamsulosin 0.2 mg | 16 | 14 | 14 (87.5) | ||
| Total | 34 | 30 | 30 (88.2) | ||
| Silodosin 4 mg | NR/102 | 51 | 42/88a | 42 (82.3) | |
| Tamsulosin 0.2 mg | 51 | 42/91a | 42 (82.3) | ||
| Total | 102 | 84/179a | 42 (82.3) | ||
| Silodosin 8 mg | 109/109 | 58 | 53 | 53 (91.3) | |
| Naftopidil 75 mg | 51 | 44 | 44 (86.2) | ||
| Total | 109 | 97 | 97 (88.9) | ||
| Silodosin 8 mg | NR/149 | 75 | NR | NR | |
| Tamsulosin 0.2 ‐ 0.4 mg | 74 | NR | NR | ||
| Total | 149 | NR | NR | ||
| Silodosin 8 mg | 136/136 | 45 | 41 | 41 (91.1) | |
| Tamsulosin 0.2 mg | 45 | 39 | 39 (86.6) | ||
| Naftopidil 50 mg | 46 | 42 | 42 (91.3) | ||
| Total | 136 | 122 | 122 (89.7) | ||
| Silodosin 8 mg | NR/46 | 23 | 23 | 23 (100.0) | |
| Tamsulosin 0.2 mg | 23 | 23 | 23 (100.0) | ||
| Total | 46 | 46 | 46 (100.0) | ||
| Silodosin 8 mg | NR/209 | 105 | 87 | 87 (82.8) | |
| Tamsulosin 0.2 mg | 104 | 83 | 83 (79.8) | ||
| Total | 209 | 170 | 170 (81.3) | ||
| Grand total | Interventions: silodosin | 1955 | 1684b | ||
| Compartors: placebo | 834 | 769 (92.2) | |||
| Compartors: tamsulosin | 1049 | 888b | |||
| Compartors: naftopidil | 380 | 333 (87.6) | |||
| Comparator: alfuzosin | 77 | 77 (100.0) | |||
| Overall | 4295 | 3751b | |||
N: number; NR: not reported
a Efficacy analysis/safety analysis.
b The number of participants who finished trials were not reported in two included studies (Natarajan 2015; Yamanishi 2011).
Source of data
We included 16 published studies, two abstract proceedings (Jung 2012; Yamanishi 2011), and one record (NCT00793819) from a trials register. Of 16 published studies, we found two studies (Pande 2014; Yokoyama 2011) by searching the reference lists of an existing review (Brasure 2016) and the remaining studies were identified through our electronic database search. Eighteen studies were published in English and one was published in Japanese (Masuda 2012), which was translated into English using Google translator. We attempted to contact all corresponding authors of included trials to obtain additional information on study methodology and results, and received replies from nine (Chapple 2011; Jung 2012; Masuda 2012; Pande 2014; Takeshita 2016; Yamaguchi 2013; Yamanishi 2011; Yokoyama 2011; Yokoyama 2012; see Appendix 2).
Study design and settings
We included 14 parallel, randomized controlled trials (Chapple 2011; Jung 2012; Kawabe 2006a; Manjunatha 2016a; Marks 2009; Matsukawa 2016; Natarajan 2015; NCT00793819; Pande 2014; Shirakawa 2013; Yamaguchi 2013; Yamanishi 2011; Yokoyama 2011; Yu 2011) and five cross‐over trials (Masuda 2012; Miyakita 2010; Takeshita 2016; Watanabe 2011; Yokoyama 2012). Five of 19 studies were reported as 'double‐blinded'. The participants and investigators were blinded in three studies (Marks 2009; NCT00793819; Yu 2011) and participants and personnel were blinded in one study (Chapple 2011). One study was reported to be 'double‐blinded' but it was not clear who was blinded (Kawabe 2006a). Four studies were open‐label trials (Jung 2012; Manjunatha 2016a; Matsukawa 2016; Shirakawa 2013). The remaining five trials had no information regarding blinding. There were three trials with run‐in periods (Chapple 2011; Marks 2009; Yu 2011).
All studies were likely conducted in an outpatient clinic setting. Three studies explicitly stated that the trial was conducted in an outpatient clinic setting (Kawabe 2006a; Matsukawa 2016; Pande 2014). Most of the included studies (Jung 2012; Kawabe 2006a; Manjunatha 2016a; Masuda 2012; Matsukawa 2016; Miyakita 2010; Natarajan 2015; Pande 2014; Shirakawa 2013; Takeshita 2016; Watanabe 2011; Yamaguchi 2013; Yokoyama 2011; Yokoyama 2012; Yu 2011) were performed in Asia, except two studies, which were performed in Europe (Chapple 2011) and the USA (Marks 2009). Eight trials (Chapple 2011; Kawabe 2006a; Marks 2009; Masuda 2012; Matsukawa 2016; Miyakita 2010; Takeshita 2016; Watanabe 2011) were multicenter trials. The studies were performed from 2005 to 2015.
Participants
We included a total of 4295 randomized participants (silodosin 1955, placebo 834, tamsulosin 1049, naftopidil 380, alfuzosin 77), of which a total of 3751 finished the trials (silodosin 1684, placebo 769, tamsulosin 888, naftopidil 333, alfuzosin 77). However, two studies (Natarajan 2015; Yamanishi 2011), that compared silodosin to tamsulosin, did not report the number of participants who completed the trial in each group. All studies included men aged over 40 years. The mean age, prostate volume, prostate specific antigen (PSA), International Prostate Symptom Score (IPSS), and maximum flow rate (Qmax) of the participants were 66.5 years, 38.2 mL, 3.14 ng/mL, 19.1, and 9.5 mL/s, respectively.
Most of the studies included participants with lower urinary tract symptoms (LUTS) of a total IPSS more than 8 (Kawabe 2006a; Manjunatha 2016a; Masuda 2012; Matsukawa 2016; Miyakita 2010; Natarajan 2015; Pande 2014; Shirakawa 2013; Takeshita 2016; Watanabe 2011; Yamaguchi 2013; Yamanishi 2011; Yokoyama 2011; Yokoyama 2012). Participants with IPSS more than 13 were included in three studies (Chapple 2011; Marks 2009; Yu 2011). Two studies (abstract Jung 2012, protocol NCT00793819) did not specify the inclusion criteria for LUTS in detail. Eight out of 19 studies included participants with a prostate volume greater than 20 mL (Kawabe 2006a; Masuda 2012; Matsukawa 2016; Miyakita 2010; Shirakawa 2013; Takeshita 2016; Yamanishi 2011; Yu 2011). Nine studies used 15mL/s or less in Qmax as an inclusion criterion (Chapple 2011; Kawabe 2006a; Manjunatha 2016a; Marks 2009; Matsukawa 2016; Miyakita 2010; Shirakawa 2013; Yamanishi 2011; Yu 2011). Major exclusion criteria included LUTS from any cause other than benign prostatic hyperplasia (BPH), prior treatment with other BPH medical therapy, recent acute urinary retention (AUR), raised prostate‐specific antigen (PSA) level suspicious of prostate cancer, a history of prostate cancer or prior prostate‐related surgery. Chapple 2011 excluded men with improvement in the IPSS total score of 25% or more in the run‐in period and Marks 2009 excluded 615 participants due to adverse events, investigator recommendation, lack of efficacy, loss‐to‐follow‐up, protocol violation, voluntary withdrawal, or other issues during the run‐in period.
Intervention(s) and comparator(s)
Silodosin was administered as an oral dose of 8 mg (8 mg once daily or 4 mg twice daily) in all studies except one (Takeshita 2016; 4 mg once daily). Two studies titrated the drug dose (4 mg followed by 8 mg) during the study period (Masuda 2012; Matsukawa 2016).
Four agents, namely placebo, tamsulosin, naftopidil, and alfuzosin were used as comparators. All comparators were administrated orally. Placebo was administrated in accordance with frequencies of silodosin (Chapple 2011; Kawabe 2006a; Marks 2009; NCT00793819). Tamsulosin was administered as an oral dose of 0.2 mg (Jung 2012; Kawabe 2006a; Miyakita 2010; Takeshita 2016; Watanabe 2011; Yokoyama 2011; Yokoyama 2012; Yu 2011) or 0.4 mg once daily (Chapple 2011; Manjunatha 2016a; Natarajan 2015; Pande 2014). One study did not specify the exact dose of tamsulosin (Yamanishi 2011). Naftopidil was administered as an oral dose of 50 mg (Shirakawa 2013; Yokoyama 2011) or 75 mg once daily (Yamaguchi 2013). Two studies titrated the drug dose (50 mg followed by 75 mg) during the study period (Masuda 2012; Matsukawa 2016). Alfuzosin was administered as an oral dose of 10 mg once daily (Jung 2012; Manjunatha 2016a).
The duration of intervention was 12 weeks in 11 (of 19) studies (Chapple 2011; Kawabe 2006a; Manjunatha 2016a; Marks 2009; Matsukawa 2016; Natarajan 2015; Pande 2014; NCT00793819; Yamaguchi 2013; Yokoyama 2011; Yu 2011). Jung 2012 and Shirakawa 2013 followed the participants for four weeks and eight weeks only, respectively. Yamanishi 2011 reported 12‐month follow‐up data. For cross‐over trials, three (Miyakita 2010; Takeshita 2016; Watanabe 2011), one (Masuda 2012), and one study (Yokoyama 2012) reported 4 weeks', 6 weeks', and 12 weeks' follow‐up outcomes before the cross‐over, respectively.
Comparisons
We included four comparisons in this review: four studies compared silodosin to placebo (Chapple 2011; Kawabe 2006a; Marks 2009; NCT00793819). Thirteen (Chapple 2011; Jung 2012; Kawabe 2006a; Manjunatha 2016a; Miyakita 2010; Natarajan 2015; Pande 2014; Takeshita 2016; Watanabe 2011; Yamanishi 2011; Yokoyama 2011; Yokoyama 2012; Yu 2011) compared silodosin to tamsulosin, five (Masuda 2012; Matsukawa 2016; Shirakawa 2013; Yamaguchi 2013; Yokoyama 2011) compared silodosin to naftopidil, and two studies (Jung 2012; Manjunatha 2016a) compared silodosin to alfuzosin. All studies used silodosin, placebo, or other ABs as monotherapy. There were no trials that compared combination therapy with silodosin or any 5‐ARIs to combination therapy with other ABs and any 5‐ARIs.
Outcomes
We identified all primary outcomes in each of the included studies for four comparisons. No trial reported on our predefined secondary outcomes of AUR or surgical intervention for LUTS/BPH. However, we were able to obtain additional information by contact with the study authors (Chapple 2011; Pande 2014; Yamaguchi 2013; Yokoyama 2011) which we used for the data analysis across three comparisons. Given the nature of cross‐over design studies, we assumed they were not applicable to the outcomes of AUR and surgical intervention for LUTS/BPH for the analysis. Other secondary outcomes were reported in at least one of the included studies.
Funding sources and conflicts of interest
Four reported no funding source (Jung 2012; Kawabe 2006a; Manjunatha 2016a; Yokoyama 2012), and five were supported by pharmaceutical companies (Chapple 2011; Marks 2009; NCT00793819; Pande 2014; Yu 2011). The remaining did not mention a funding source.
Nine studies reported no conflicts of interest (Kawabe 2006a; Manjunatha 2016a; Pande 2014; Shirakawa 2013; Takeshita 2016; Watanabe 2011; Yamaguchi 2013; Yokoyama 2011; Yokoyama 2012), and four reported having relationships with pharmaceutical companies (Chapple 2011; Marks 2009; NCT00793819; Yu 2011). The remaining did not mention conflicts of interest.
Excluded studies
We excluded 23 studies (24 records) out of 58 studies (80 records) after evaluation of the full‐text publications. Seven studies were reviews (Abramowicz 2009; Alcántara Montero 2016; Curran 2011; Montorsi 2010; Montorsi 2013; Prescrire Int 2011; Prescrire Int 2012). Six studies had the wrong comparator (Cakiroglu 2016; JPRN‐UMIN000007917; Matsukawa 2012; Matsukawa 2017; Yoshida 2017; Yoshihisa 2012). Each of four studies had the wrong study design (Araki 2013; Boeri 2016; Chapple 2009; Kawabe 2006b) and wrong study outcome (Kobayashi 2008; Kobayashi 2009; Manjunatha 2016b; Zhou 2011), respectively. Two studies had the wrong population (Michel 2011; Roehrborn 2009). Details of excluded studies are presented elsewhere (see Characteristics of excluded studies).
Studies awaiting classification and ongoing trials
We found 12 studies awaiting classification (CTRI/2010/091/000526; Devana 2014; Jha 2015; JPRN‐UMIN000003125; JPRN‐UMIN000005151; JPRN‐UMIN000008538; JPRN‐UMIN000011556; Mandal 2013; Manohar 2014; Miyamae 2011; NCT01222650; Pawar 2015) that did not provide usable outcome data and two ongoing studies (JPRN‐UMIN000003609; CTRI/2013/10/004112). Details of studies awaiting classification and ongoing trials are presented elsewhere (see Characteristics of studies awaiting classification; Characteristics of ongoing studies).
Risk of bias in included studies

Risk of bias graph: review authors' judgements about each risk of bias item presented as percentages across all included studies
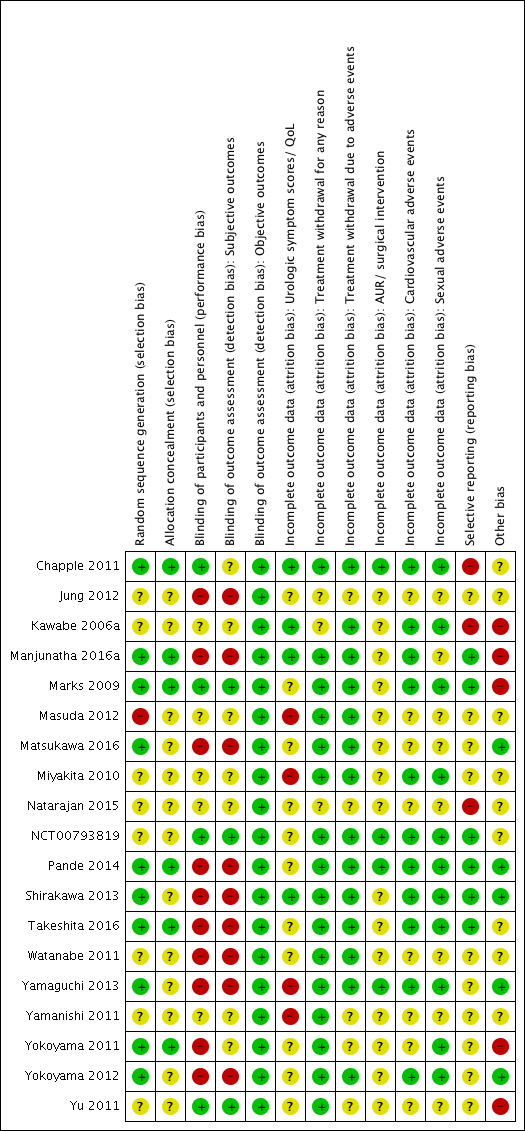
Risk of bias summary: review authors' judgements about each risk of bias item for each included study
Allocation
Random sequence generation
-
We rated 10 studies as low risk of bias (Chapple 2011; Manjunatha 2016a; Marks 2009; Matsukawa 2016; Pande 2014; Shirakawa 2013; Takeshita 2016; Yamaguchi 2013; Yokoyama 2011; Yokoyama 2012) and one study as high risk of bias (Masuda 2012). The remaining were judged as unclear risk of bias.
Allocation concealment
-
We rated six studies as low risk of bias (Chapple 2011; Manjunatha 2016a; Marks 2009; Pande 2014; Takeshita 2016; Yokoyama 2011) and the remaining as unclear risk of bias.
Blinding
Blinding of participants and personnel
-
We rated four studies as low risk of bias (Chapple 2011; Marks 2009; NCT00793819; Yu 2011). We judged 10 studies (Jung 2012; Manjunatha 2016a; Matsukawa 2016; Pande 2014; Shirakawa 2013; Takeshita 2016; Watanabe 2011; Yamaguchi 2013; Yokoyama 2011; Yokoyama 2012) as high risk of bias and the remaining as unclear risk of bias.
Blinding of outcome assessment
-
Subjective outcomes: we rated three studies as low risk of bias for subjective outcomes (Marks 2009; NCT00793819; Yu 2011). We judged nine studies (Jung 2012; Manjunatha 2016a; Matsukawa 2016; Pande 2014; Shirakawa 2013; Takeshita 2016; Watanabe 2011; Yamaguchi 2013; Yokoyama 2012) as high risk of bias and the remaining as unclear risk of bias for subjective outcomes. (Subjective outcomes: urologic symptom scores, quality of life, treatment withdrawal for any reason, treatment withdrawal due to adverse events, cardiovascular adverse events, and sexual adverse events.)
-
Objective outcomes: we rated all studies as low risk of bias for objective outcomes because objective outcomes are not likely to be affected by lack of blinding. (Objective outcomes: AUR and surgical intervention for LUTS/BPH.)
Incomplete outcome data
-
Urologic symptom scores and quality of life: we rated four studies as low risk of bias (Chapple 2011; Kawabe 2006a; Manjunatha 2016a; Shirakawa 2013). We judged four studies (Masuda 2012; Miyakita 2010; Yamaguchi 2013; Yamanishi 2011) as high risk of bias and the remaining as unclear risk of bias.
-
Treatment withdrawal for any reason: we rated 16 studies (Chapple 2011; Manjunatha 2016a; Marks 2009; Masuda 2012; Matsukawa 2016; Miyakita 2010; NCT00793819; Pande 2014; Shirakawa 2013; Takeshita 2016; Watanabe 2011; Yamaguchi 2013; Yamanishi 2011; Yokoyama 2011; Yokoyama 2012; Yu 2011) as low risk of bias and three studies (Jung 2012; Kawabe 2006a; Natarajan 2015) as unclear risk of bias. None of the studies were rated as high risk of bias.
-
Treatment withdrawal due to adverse events: we rated 14 studies (Chapple 2011; Kawabe 2006a; Manjunatha 2016a; Marks 2009; Masuda 2012; Matsukawa 2016; Miyakita 2010; NCT00793819; Pande 2014; Shirakawa 2013; Takeshita 2016; Watanabe 2011; Yamaguchi 2013; Yokoyama 2012) as low risk of bias and the remaining studies as unclear risk of bias.
-
AUR and surgical intervention for LUTS/BPH: we rated four studies (Chapple 2011; NCT00793819; Pande 2014; Yamaguchi 2013) as low risk of bias and the remaining studies as unclear risk of bias.
-
Cardiovascular adverse events: we rated 11 studies (Chapple 2011; Kawabe 2006a; Manjunatha 2016a; Marks 2009; Miyakita 2010; NCT00793819; Pande 2014; Shirakawa 2013; Takeshita 2016; Yamaguchi 2013; Yokoyama 2012) as low risk of bias and the remaining studies as unclear risk of bias.
-
Sexual adverse events: we rated 11 studies (Chapple 2011; Kawabe 2006a; Marks 2009; Miyakita 2010; NCT00793819; Pande 2014; Shirakawa 2013; Takeshita 2016; Yamaguchi 2013; Yokoyama 2011; Yokoyama 2012) as low risk of bias and the remaining studies as unclear risk of bias.
Selective reporting
-
We rated six studies as low risk of bias (Manjunatha 2016a; Marks 2009; NCT00793819; Pande 2014; Shirakawa 2013; Takeshita 2016). We judged three studies (Chapple 2011; Kawabe 2006a; Natarajan 2015) as high risk of bias and the remaining as unclear risk of bias.
Other potential sources of bias
-
We rated five studies as low risk of bias (Matsukawa 2016; Pande 2014; Shirakawa 2013; Yamaguchi 2013; Yokoyama 2012). We judged five studies (Kawabe 2006a; Manjunatha 2016a; Marks 2009; Yokoyama 2011; Yu 2011) as high risk of bias due to clinically important imbalances in baseline characteristics and high exclusion rates after placebo run‐in periods; the remaining studies were rated as unclear risk of bias.
Effects of interventions
See: Summary of findings for the main comparison Silodosin compared to placebo for the treatment of lower urinary tract symptoms in men with benign prostatic hyperplasia (short term); Summary of findings 2 Silodosin compared to tamsulosin for the treatment of lower urinary tract symptoms in men with benign prostatic hyperplasia (short term); Summary of findings 3 Silodosin compared to naftopidil for the treatment of lower urinary tract symptoms in men with benign prostatic hyperplasia (short term); Summary of findings 4 Silodosin compared to alfuzosin for the treatment of lower urinary tract symptoms in men with benign prostatic hyperplasia (short term)
Details are presented elsewhere (see summary of findings Table for the main comparison; summary of findings Table 2; summary of findings Table 3; summary of findings Table 4).
1. Silodosin versus placebo
1.1. Urologic symptom scores
We included three randomized controlled trials (RCTs) (Chapple 2011; Kawabe 2006a; Marks 2009) with 1743 participants in the analysis (silodosin 1012, placebo 731). Silodosin may reduce urologic symptom scores in an appreciable number of men (MD ‐2.65, 95% CI ‐3.23 to ‐2.08; I2 = 0%). We rated the quality of the evidence as low, downgrading for study limitations and imprecision (Analysis 1.1).
1.2. Quality of life
We included two RCTs (Chapple 2011; Kawabe 2006a) with 820 participants in the analysis (silodosin 546, placebo 274). Silodosin likely results in little or no difference in quality of life (MD ‐0.42, 95% CI ‐0.71 to ‐0.13; I2 = 57%). We rated the quality of the evidence as moderate, downgrading for study limitations (Analysis 1.2).
1.3. Treatment withdrawal for any reason
We included three RCTs (Chapple 2011; Marks 2009; NCT00793819) with 1703 participants in the analysis (silodosin 958, placebo 745). Silodosin may result in little or no difference in treatment withdrawal for any reason (RR 1.08, 95% CI 0.70 to 1.66; I2 = 42%). We rated the quality of the evidence as low, downgrading for study limitations and imprecision (Analysis 1.3).
1.4. Treatment withdrawal due to adverse events
We included four RCTs (Chapple 2011; Kawabe 2006a; Marks 2009; NCT00793819) with 1967 participants in the analysis (silodosin 1133, placebo 834). Silodosin likely increases treatment withdrawal due to adverse events (RR 2.29, 95% CI 1.41 to 3.72; I2 = 0%). Assuming a baseline risk of treatment withdrawal due to adverse events to be 13.0% (Preston 2000), silodosin would result in 168 more treatment withdrawals per 1000 men (95% CI 53 more to 354 more). We rated the quality of the evidence as moderate, downgrading for study limitations (Analysis 1.4).
1.5. AUR
We included two RCTs (Chapple 2011; NCT00793819) with 780 participants in the analysis (silodosin 492, placebo 288). We found no event for AUR in either study group.
1.6. Surgical intervention for LUTS/BPH
We included two RCTs (Chapple 2011; NCT00793819) with 780 participants in the analysis (silodosin 492, placebo 288). We found no event for surgical intervention for LUTS/BPH in either study group.
1.7. Cardiovascular adverse events
We included four RCTs (Chapple 2011; Kawabe 2006a; Marks 2009; NCT00793819) with 1967 participants in the analysis (silodosin 1133, placebo 834). We are uncertain about the effect of silodosin on cardiovascular adverse events (RR 1.28, 95% CI 0.67 to 2.45; I2 = 55%). We rated the quality of the evidence as very low, downgrading for study limitations, inconsistency, and imprecision (Analysis 1.5).
1.8. Sexual adverse events
We included four RCTs (Chapple 2011; Kawabe 2006a; Marks 2009; NCT00793819) with 1967 participants in the analysis (silodosin 1133, placebo 834). Silodosin likely increases sexual adverse events (RR 26.07, 95% CI 12.36 to 54.97; I2 = 0%). Silodosin would result in 180 more sexual adverse events per 1000 men (95% CI 82 more to 388 more). We rated the quality of the evidence as moderate, downgrading for study limitations (Analysis 1.6).
Subgroup analysis
We were unable to perform any predefined subgroup analyses because there were no relevant data in the included studies. While we found pooled analyses (Novara 2015) from two included studies (Chapple 2011; Marks 2009) that evaluated the efficacy and safety of silodosin versus placebo, we were unable to replicate these analyses ourselves.
Sensitivity analysis
We rated three RCTs (Chapple 2011; Marks 2009; NCT00793819) as low risk of bias and reanalyzed the data focused on these studies alone.
-
Urologic symptom scores: we found an MD of ‐2.60 (95% CI ‐3.28 to ‐1.92) with the studies rated as low risk of bias (Chapple 2011; Marks 2009) versus an MD of ‐2.65 (95% CI ‐3.23 to ‐2.08) with all included studies (Chapple 2011; Kawabe 2006a; Marks 2009).
-
Quality of life: we found an MD of ‐0.30 (95% CI ‐0.51 to ‐0.09) with the study rated as low risk of bias (Chapple 2011) versus an MD of ‐0.42 (95% CI ‐0.71 to ‐0.13) with all included studies (Chapple 2011; Kawabe 2006a).
-
Treatment withdrawal for any reason: we rated all included studies as low risk of bias and we were unable to perform sensitivity analyses for this outcome.
2. Silodosin versus tamsulosin
2.1. Urologic symptom scores
We included 10 RCTs (Chapple 2011; Kawabe 2006a; Manjunatha 2016a; Miyakita 2010; Pande 2014; Takeshita 2016; Yamanishi 2011; Yokoyama 2011; Yokoyama 2012; Yu 2011) with 1708 participants in the analysis (silodosin 859, tamsulosin 849). We used the final value in one study (Pande 2014) and change from baseline in the remaining studies. Silodosin may result in little to no difference in urologic symptom scores (MD ‐0.04, 95% CI ‐1.31 to 1.24; I2 = 87%). We rated the quality of the evidence as low, downgrading for study limitations and inconsistency (Analysis 2.1).
2.2. Quality of life
We included 10 RCTs (Chapple 2011; Kawabe 2006a; Manjunatha 2016a; Miyakita 2010; Pande 2014; Takeshita 2016; Yamanishi 2011; Yokoyama 2011; Yokoyama 2012; Yu 2011) with 1707 participants in the analysis (silodosin 859, tamsulosin 848). We used the final value in two studies (Miyakita 2010; Pande 2014) and change from baseline in the remaining studies. Silodosin may result in little to no difference in quality of life (MD ‐0.15, 95% CI ‐0.53 to 0.22; I2 = 93%). We rated the quality of the evidence as low, downgrading for study limitations and inconsistency (Analysis 2.2).
2.3. Treatment withdrawal for any reason
We included 10 RCTs (Chapple 2011; Manjunatha 2016a; Natarajan 2015; Pande 2014; Takeshita 2016; Watanabe 2011; Yamanishi 2011; Yokoyama 2011; Yokoyama 2012; Yu 2011) with 1573 participants in the analysis (silodosin 788, tamsulosin 785). For the cross‐over trial Watanabe 2011, we applied the conservative approach of only using the number of participants who had been initially randomized, due to lack of information about the number of participants in the analysis. We are uncertain about the effect of silodosin on treatment withdrawal for any reason (RR 1.02, 95% CI 0.62 to 1.69; I2 = 60%). We rated the quality of the evidence as very low, downgrading for study limitations, inconsistency, and imprecision (Analysis 2.3).
2.4. Treament withdrawal due to adverse events
We included nine RCTs (Chapple 2011; Kawabe 2006a; Manjunatha 2016a; Natarajan 2015; Pande 2014; Takeshita 2016; Watanabe 2011; Yokoyama 2011; Yokoyama 2012) with 1572 participants in the analysis (silodosin 779, tamsulosin 793). For the cross‐over trials Watanabe 2011 and Yokoyama 2012, we used only the number of participants who had been initially randomized due to lack of information about the number of participants in the analysis. Silodosin may or may not result in an important increase in treatment withdrawal due to adverse events (RR 1.96, 95% CI 1.12 to 3.44; I2 = 0%). Silodosin would result in 21 more treatment withdrawals for any reason per 1000 men (95% CI 3 more to 52 more). We rated the quality of the evidence as low, downgrading for study limitations and imprecision (Analysis 2.4).
2.5. AUR
We included three RCTs (Chapple 2011; Pande 2014; Yokoyama 2011) with 906 participants in the analysis (silodosin 454, tamsulosin 452). We found no event for AUR in either study group.
2.6. Surgical intervention for LUTS/BPH
We included three RCTs (Chapple 2011; Pande 2014; Yokoyama 2011) with 906 participants in the analysis (silodosin 454, tamsulosin 452). We found no event for surgical intervention for LUTS/BPH in either study group.
2.7. Cardiovascular adverse events
We included 11 RCTs (Chapple 2011; Kawabe 2006a; Manjunatha 2016a; Miyakita 2010; Natarajan 2015; Pande 2014; Takeshita 2016; Watanabe 2011; Yokoyama 2011; Yokoyama 2012; Yu 2011) with 1955 participants in the analysis (silodosin 967, tamsulosin 988). For cross‐over trials, we took all measurements from silodosin periods and all measurements from tamsulosin periods in Watanabe 2011 and analysed these as if the trial were a parallel‐group trial of silodosin versus tamsulosin. However, we used only the number of participants who had been initially randomized due to lack of information about the number of participants in the analysis (Miyakita 2010; Takeshita 2016; Yokoyama 2012). Silodosin may result in little to no difference in cardiovascular adverse events (RR 0.77, 95% CI 0.53 to 1.12; I2 = 3%). We rated the quality of the evidence as low downgrading for study limitations and imprecision (Analysis 2.5).
2.8. Sexual adverse events
We included 10 RCTs (Chapple 2011; Jung 2012; Kawabe 2006a; Natarajan 2015; Pande 2014; Takeshita 2016; Watanabe 2011; Yokoyama 2011; Yokoyama 2012; Yu 2011) with 1849 participants in the analysis (silodosin 920, tamsulosin 929). For cross‐over trials, we took all measurements from silodosin periods and all measurements from tamsulosin periods in Watanabe 2011. However, we used only the number of participants who had been initially randomized due to lack of information about the number of participants in the analysis (Yokoyama 2012). Silodosin likely increases sexual adverse events (RR 6.05, 95% CI 3.55 to 10.31; I2 = 27%). Silodosin would result in 141 more sexual adverse events per 1000 men (95% CI 71 more to 261 more). We rated the quality of the evidence as moderate, downgrading for study limitations (Analysis 2.6).
Subgroup analysis
We found one cross‐over trial that reported subgroup analyses according to age (70 years or older) and symptom severity (IPSS 20 or more) (Watanabe 2011). We were unable to perform preplanned subgroup analysis due to lack of information in within‐study comparisons.
Sensitivity analysis
We rated only one study (Chapple 2011) as low risk of bias and were unable to perform a sensitivity analysis.
3. Silodosin versus naftopidil
3.1. Urologic symptom scores
We included five RCTs (Masuda 2012; Matsukawa 2016; Shirakawa 2013; Yamaguchi 2013; Yokoyama 2011) with 652 participants in the analysis (silodosin 325, naftopidil 327). We used final value in one study (Masuda 2012) and change from baseline in the remaining studies. Silodosin may result in little to no difference in urologic symptom scores (MD ‐0.85, 95% CI ‐2.57 to 0.87; I2 = 84%). We rated the quality of the evidence as low, downgrading for study limitations and inconsistency (Analysis 3.1).
3.2. Quality of life
We included five RCTs (Masuda 2012; Matsukawa 2016; Shirakawa 2013; Yamaguchi 2013; Yokoyama 2011) with 652 participants in the analysis (silodosin 325, naftopidil 327). We used the final values in one study (Masuda 2012) and change from baseline in the remaining studies. Silodosin may result in little to no difference in quality of life (MD ‐0.17, 95% CI ‐0.60 to 0.27; I2 = 91%). We rated the quality of the evidence as low, downgrading for study limitations and inconsistency (Analysis 3.2).
3.3. Treatment withdrawal for any reason
We included four RCTs (Matsukawa 2016; Shirakawa 2013; Yamaguchi 2013; Yokoyama 2011) with 659 participants in the analysis (silodosin 334, naftopidil 325). Silodosin may result in little to no difference in treatment withdrawal for any reason (RR 1.25, 95% CI 0.81 to 1.93; I2 = 0%). We rated the quality of the evidence as low, downgrading for study limitations and imprecision (Analysis 3.3).
3.4. Treament withdrawal due to adverse events
We included five RCTs (Masuda 2012; Matsukawa 2016; Shirakawa 2013; Yamaguchi 2013; Yokoyama 2011) with 738 participants in the analysis (silodosin 372, naftopidil 366). For the cross‐over trial Masuda 2012, we used only the number of participants who had been initially randomized due to lack of information about the number of participants in the analysis. Silodosin may result in little to no difference in treatment withdrawal due to adverse events (RR 1.38, 95% CI 0.66 to 2.89; I2 = 0%). We rated the quality of the evidence as low downgrading for study limitations and imprecision (Analysis 3.4).
3.5. AUR
We included two RCTs (Yamaguchi 2013; Yokoyama 2011) with 180 participants in the analysis (silodosin 94, naftopidil 86). We found no event for AUR in either study group.
3.6. Surgical intervention for LUTS/BPH
We included two RCTs (Yamaguchi 2013; Yokoyama 2011) with 180 participants in the analysis (silodosin 94, naftopidil 86). We found no event for surgical intervention for LUTS/BPH in either study group.
3.7. Cardiovascular adverse events
We included five RCTs (Masuda 2012; Matsukawa 2016; Shirakawa 2013; Yamaguchi 2013; Yokoyama 2011) with 808 participants in the analysis (silodosin 411, naftopidil 397). For cross‐over trials, we took all measurements from silodosin periods and all measurements from tamsulosin periods in Masuda 2012. Silodosin may result in little to no difference in cardiovascular adverse events (RR 1.02, 95% CI 0.41 to 2.56; I2 = 0%). We rated the quality of the evidence as low downgrading for study limitations and imprecision (Analysis 3.5).
3.8. Sexual adverse events
We included four RCTs (Masuda 2012; Shirakawa 2013; Yamaguchi 2013; Yokoyama 2011) with 405 participants in the analysis (silodosin 206, naftopidil 199). For cross‐over trials, we took all measurements from silodosin periods and all measurements from tamsulosin periods in Masuda 2012. Silodosin likely increases sexual adverse events (RR 5.93, 95% CI 2.16 to 16.29; I2 = 0%). Silodosin would result in 74 more sexual adverse events per 1000 men (95% CI 17 more to 231 more). We rated the quality of the evidence as moderate, downgrading for study limitations (Analysis 3.6).
Subgroup analysis
We were unable to perform any subgroup analyses because there were no relevant data in the included studies.
Sensitivity analysis
We rated all of the included studies as high or unclear risk of bias and were unable to perform a sensitivity analysis.
4. Silodosin versus alfuzosin
4.1. Urologic symptom scores
We included one RCT (Manjunatha 2016a) with 60 participants in the analysis (silodosin 30, alfuzosin 30). Silodosin may or may not result in a clinically important increase in urologic symptom scores (MD 3.83, 95% CI 0.12 to 7.54). We rated the quality of the evidence as low, downgrading for study limitations and imprecision (Analysis 4.1).
4.2. Quality of life
We included one RCT (Manjunatha 2016a) with 60 participants in the analysis (silodosin 30, alfuzosin 30). Silodosin likely results in little to no difference in quality of life (MD 0.14, 95% CI ‐0.46 to 0.74). We rated the quality of the evidence as moderate, downgrading for study limitations (Analysis 4.2).
4.3. Treatment withdrawal for any reason
We included one RCT (Manjunatha 2016a) with 60 participants in the analysis (silodosin 30, alfuzosin 30). We found no event in treatment withdrawal for any reason in either study group.
4.4. Treatment withdrawal due to adverse events
We included one RCT (Manjunatha 2016a) with 60 participants in the analysis (silodosin 30, alfuzosin 30). We found no event in treatment withdrawal due to adverse events in either study group.
4.5. AUR
We did not find any study that reported this outcome.
4.6. Surgical intervention for LUTS/BPH
We did not find any study that reported this outcome.
4.7. Cardiovascular adverse events
We included one RCT (Manjunatha 2016a) with 60 participants in the analysis (silodosin 30, alfuzosin 30). Silodosin may result in little to no difference in cardiovascular adverse events (RR 0.67, 95% CI 0.36 to 1.24). We rated the quality of the evidence as low, downgrading for study limitations and imprecision (Analysis 4.3).
4.8. Sexual adverse events
We included one RCT (Jung 2012) with 95 participants in the analysis (silodosin 48, alfuzosin 47). Silodosin likely increases sexual adverse events (RR 37.21, 95% CI 5.32 to 260.07). Assuming a baseline risk of 0.6% (Van Kerrebroec 2002), silodosin would result in 217 more sexual adverse events per 1000 men (95% CI 26 more to 1000 more). We rated the quality of the evidence as moderate, downgrading for study limitations (Analysis 4.4).
Subgroup analysis and sensitivity analysis
We were unable to perform secondary analyses because there were no relevant data or too few data in the included studies.
Discusión
Resumen de los resultados principales
Se incluyeron 19 estudios únicos con 4295 participantes asignados al azar a cuatro comparaciones para el seguimiento a corto plazo. Todos los estudios incluyeron hombres mayores de 40 años. La media de edad y de la IPSS de los participantes fueron de 66,5 años y 19,1; respectivamente.
Silodosina versus placebo
La silodosina puede reducir las puntuaciones de los síntomas urológicos en un número apreciable de pacientes pero no mejorar la calidad de vida de manera significativa. Los retiros del tratamiento por cualquier motivo no parecen aumentar. No hay seguridad acerca del efecto de la silodosina en los eventos adversos cardiovasculares aunque el fármaco puede aumentar los efectos adversos sexuales. No hubo ningún cambio clínicamente importante de los efectos del tratamiento en un análisis de sensibilidad centrado en los estudios de bajo riesgo.
Silodosina versus tamsulosina
La silodosina puede dar lugar a poca o ninguna diferencia de las puntuaciones de los síntomas urológicos y la calidad de vida. No hay seguridad acerca de las tasas de retiro del tratamiento por cualquier motivo. La silodosina puede dar lugar a poca o ninguna diferencia en los efectos adversos cardiovasculares pero puede aumentar los efectos adversos sexuales de manera significativa.
Silodosina versus naftopidil
La silodosina puede tener efectos similares en las puntuaciones de los síntomas urológicos, la calidad de vida, las tasas de retiro del tratamiento por cualquier motivo y los efectos adversos cardiovasculares. La silodosina puede aumentar los efectos adversos sexuales de manera significativa.
Silodosina versus alfuzosina
La silodosina puede o no dar lugar a un aumento clínicamente importante de las puntuaciones de los síntomas urológicos y puede resultar en poca o ninguna diferencia en la calidad de vida. No se encontró ningún efecto del retiro del tratamiento por cualquier motivo. La silodosina puede no reducir los efectos adversos cardiovasculares pero puede aumentar los efectos adversos sexuales de manera significativa.
No fue posible realizar ninguno de los análisis de subgrupos predefinidos.
Compleción y aplicabilidad general de las pruebas
Hubo varias limitaciones relacionadas con la totalidad y la aplicabilidad general de la evidencia que merecen consideración.
-
La capacidad de evaluar los resultados a más largo plazo de la silodosina en comparación con otros fármacos se vio limitada porque la duración del seguimiento en casi todos los estudios (18 de 19) fue de 12 semanas o menos. Dado el uso a largo plazo de los BA para el tratamiento de SUB/HPB en la práctica clínica, el estudio de la eficacia y la seguridad de la silodosina en tan corto plazo aparece como insuficiente para brindar seguridad de los resultados a largo plazo.
-
Tres de los ensayos más grandes incluidos en esta revisión usaron períodos previos antes de la asignación al azar (Chapple 2011; Marks 2009; Yu 2011). Este hecho puede haber llevado a la exclusión de pacientes con menos probabilidades de cumplir con el tratamiento o más propensos a presentar efectos adversos, con lo que se limita la generalizabilidad.
-
No fue posible determinar el efecto de la silodosina sobre la RUA ni las intervenciones quirúrgicas por la ausencia de eventos en los estudios incluidos. Esto se corresponde una vez más al período de seguimiento corto. La información adicional puede tener que extraerse de los estudios observacionales a más largo plazo.
-
Las tasas de efectos adversos en dos estudios disponibles en forma de resumen sólo fueron más altas que las informadas en los estudios de texto completo, lo que genera inquietudes con respecto al sesgo de publicación (Jung 2012; Yamanishi 2011).
-
Aunque los BA como la silodosina se usan comúnmente en combinación con los 5‐IRA, no se encontró ningún estudio elegible.
Calidad de la evidencia
Se disminuyó sistemáticamente la calidad de la evidencia en una o dos categorías a moderara o baja. Los motivos más frecuentes para disminuir la calidad fueron: las limitaciones de los estudios (problemas con la ocultación de la asignación y el cegamiento), la inconsistencia (como lo representan los altos valores de I2), que no se pudo explicar con análisis secundarios, y la imprecisión (intervalos de confianza amplios que cruzaron el umbral supuesto de diferencia clínicamente importante o por los pocos eventos).
Sesgos potenciales en el proceso de revisión
A pesar de la estrategia integral de búsqueda sin ninguna publicación o restricción de idioma, es posible que se hayan omitido publicaciones relevantes. La mayoría de los estudios se originó de Japón y la India. Es posible que algunos estudios, sobre todo los negativos, fueran publicados en revistas no indizadas o presentadas en reuniones locales solamente, y por lo tanto, pueden haber sido omitidos en la búsqueda, lo que resulta en sesgo de publicación potencial. El número de estudios incluidos en esta revisión fueron insuficientes para generar gráficos en embudo; por lo tanto, puede haberse subestimado el riesgo de sesgo de publicación. Una actualización futura de esta revisión debe considerar la inclusión de las bases de datos bibliográficas regionales para mejorar aún más la búsqueda.
Se intentó contactar con todos los autores de los estudios en varias ocasiones para obtener información. Aunque se recibió información adicional de nueve autores de estudios, otros no respondieron. Ésta puede ser una fuente de sesgo.
Para los ensayos cruzados, se intentaron extraer los datos antes del cruzamiento, como si el estudio fuera un ensayo de grupos paralelos, en conformidad con el Manual Cochrane de Revisiones Sistemáticas de Intervenciones (Higgins 2011c). Sin embargo, dos ensayos cruzados informaron los efectos adversos con todas las mediciones de los períodos de silodosina y de tamsulosina (Masuda 2012; Watanabe 2011). Este hecho puede haber originado una unidad de error de análisis. Para otros ensayos cruzados, se usó el número de participantes inicialmente asignados como un enfoque más conservador. Además, un ensayo cruzado usó la tasa del evento para informar los efectos adversos individuales, que también pueden dar lugar a una unidad de error de análisis (recuento duplicado) (Masuda 2012).
Acuerdos y desacuerdos con otros estudios o revisiones
Hasta la fecha, no hay ninguna revisión sistemática que se centre en la silodosina y haya aplicado la misma metodología rigurosa como esta revisión Cochrane, que incluye un protocolo publicado, un énfasis en los resultados importantes para los pacientes, una búsqueda bibliográfica exhaustiva y una evaluación de la calidad de la evidencia mediante GRADE.
En una revisión y metanálisis sistemático recientemente informados, se encontró que diversos BA (incluida la silodosina) tuvieron una eficacia similar en comparación con el placebo pero se asociaron con una incidencia significativamente mayores de efectos adversos totales y retiro del tratamiento (Novara 2013; Yuan 2015). Por otro lado, Ding 2013 no informó ninguna diferencia significativa en la incidencia de trastorno de la eyaculación entre los grupos de silodosina y de tamsulosina, pero preocupa que los números usados en el metanálisis no fueran exactos. Una revisión sistemática sobre naftopidil informó que la silodosina tuvo una eficacia equivalente al naftopidil pero se asoció con una incidencia mayor de efectos adversos sexuales (Castiglione 2014). Sin embargo, no se informó ningún metanálisis y los autores no calificaron la calidad de la evidencia. En conjunto, los resultados de la presente revisión en gran parte son compatibles con los de las revisiones publicadas anteriormente en comparación con un placebo, la tamsulosina y el naftopidil.
No se encontró ninguna revisión sistemática publicada que comparara la silodosina con la alfuzosina: esta revisión es la primera.
Risk of bias graph: review authors' judgements about each risk of bias item presented as percentages across all included studies
Risk of bias summary: review authors' judgements about each risk of bias item for each included study

Comparison 1 Silodosin versus placebo, Outcome 1 Urologic symptom scores (short term).

Comparison 1 Silodosin versus placebo, Outcome 2 Quality of life (short term).

Comparison 1 Silodosin versus placebo, Outcome 3 Treatment withdrawal due to any reason (short term).
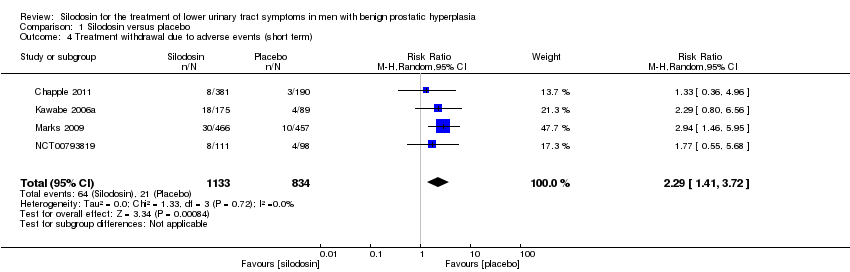
Comparison 1 Silodosin versus placebo, Outcome 4 Treatment withdrawal due to adverse events (short term).

Comparison 1 Silodosin versus placebo, Outcome 5 Cardiovascular adverse events (short term).

Comparison 1 Silodosin versus placebo, Outcome 6 Sexual adverse events (short term).

Comparison 2 Silodosin versus tamsulosin, Outcome 1 Urologic symptom scores (short term).

Comparison 2 Silodosin versus tamsulosin, Outcome 2 Quality of life (short term).

Comparison 2 Silodosin versus tamsulosin, Outcome 3 Treatment withdrawal due to any reason (short term).
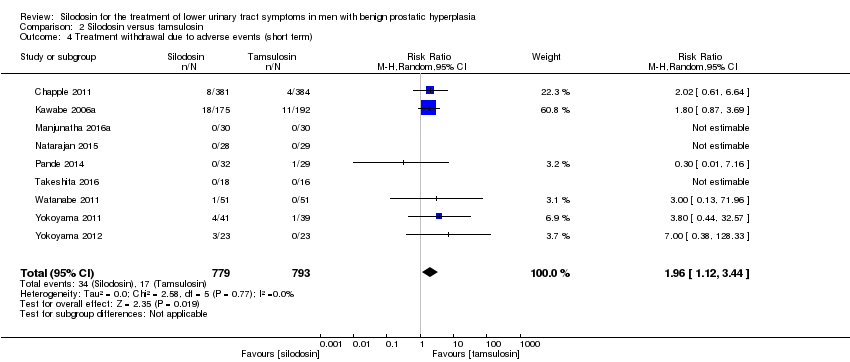
Comparison 2 Silodosin versus tamsulosin, Outcome 4 Treatment withdrawal due to adverse events (short term).
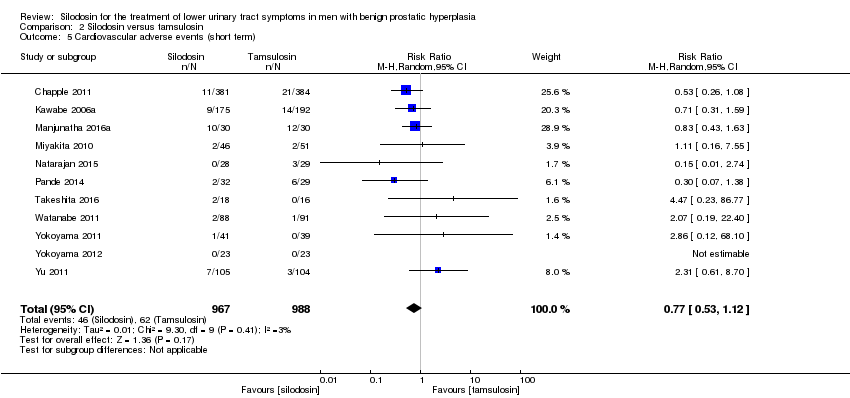
Comparison 2 Silodosin versus tamsulosin, Outcome 5 Cardiovascular adverse events (short term).
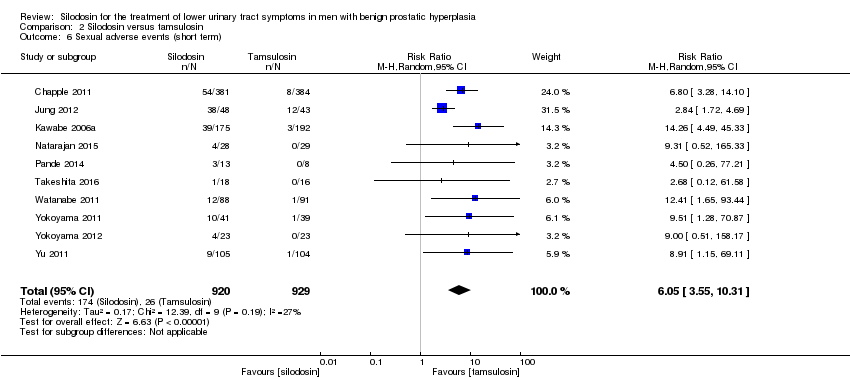
Comparison 2 Silodosin versus tamsulosin, Outcome 6 Sexual adverse events (short term).

Comparison 3 Silodosin versus naftopidil, Outcome 1 Urologic symptom scores (short term).

Comparison 3 Silodosin versus naftopidil, Outcome 2 Quality of life (short term).
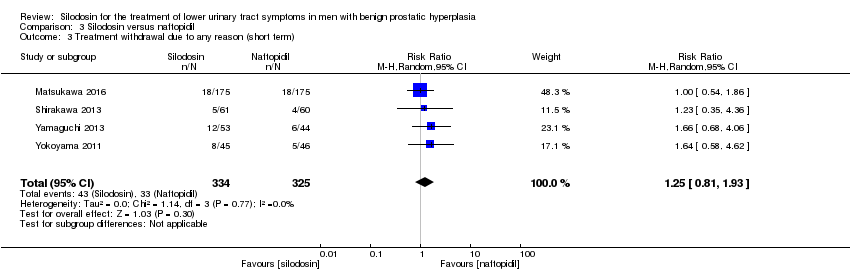
Comparison 3 Silodosin versus naftopidil, Outcome 3 Treatment withdrawal due to any reason (short term).
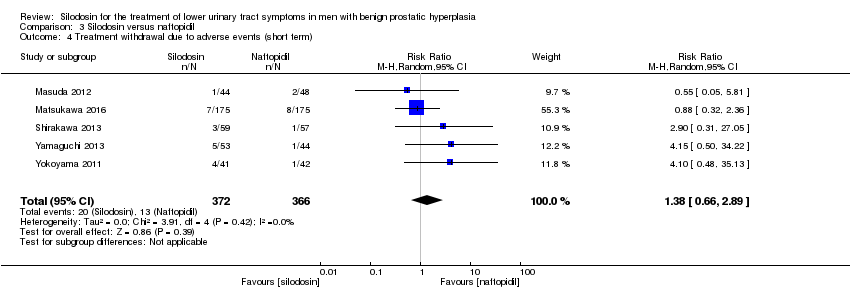
Comparison 3 Silodosin versus naftopidil, Outcome 4 Treatment withdrawal due to adverse events (short term).

Comparison 3 Silodosin versus naftopidil, Outcome 5 Cardiovascular adverse events (short term).

Comparison 3 Silodosin versus naftopidil, Outcome 6 Sexual adverse events (short term).

Comparison 4 Silodosin versus alfuzosin, Outcome 1 Urologic symptom scores (short term).

Comparison 4 Silodosin versus alfuzosin, Outcome 2 Quality of life (short term).

Comparison 4 Silodosin versus alfuzosin, Outcome 3 Cardiovascular adverse events (short term).

Comparison 4 Silodosin versus alfuzosin, Outcome 4 Sexual adverse events (short term).
| Silodosin compared to placebo for the treatment of lower urinary tract symptoms in men with benign prostatic hyperplasia (short term) | |||||
| Participants: men with lower urinary tract symptoms suggesting benign prostatic hyperplasia Setting: likely outpatients Intervention: silodosin Comparator: placebo | |||||
| Outcomes | № of participants | Quality of the evidence | Relative effect | Anticipated absolute effects* (95% CI) | |
| Risk with placebo | Risk difference with silodosin | ||||
| Urologic symptom scores | 1743 | ⊕⊕⊝⊝ | ‐ | The mean change of urologic symptom scores ranged from ‐5.30 to ‐3.50 | MD 2.65 lower |
| QoL | 820 | ⊕⊕⊕⊝ | ‐ | The mean change of QoL ranged from ‐1.10 to ‐0.80 | MD 0.42 lower |
| Treatment withdrawal due to any reason | 1703 | ⊕⊕⊝⊝ | RR 1.08 | Study population | |
| 83 per 1000 | 7 more per 1000 | ||||
| Cardiovascular adverse events | 1967 | ⊕⊝⊝⊝ | RR 1.28 | Study population | |
| 42 per 1000 | 12 more per 1000 | ||||
| Assumed baseline riske | |||||
| 61 per 1000 | 17 more per 1000 | ||||
| Sexual adverse events | 1967 | ⊕⊕⊝⊝ | RR 26.07 | Study population | |
| 7 per 1000 | 180 more per 1000 | ||||
| *The risk in the intervention group (and its 95% confidence interval) is based on the assumed risk in the comparison group and the relative effect of the intervention (and its 95% CI). | |||||
| GRADE Working Group grades of evidence | |||||
| aDowngraded by one level for study limitations: unclear or high risk of bias for one or more domains among the included studies. | |||||
| Silodosin compared to tamsulosin for the treatment of lower urinary tract symptoms in men with benign prostatic hyperplasia (short term) | |||||
| Participants: men with lower urinary tract symptoms suggesting benign prostatic hyperplasia Setting: likely outpatients Intervention: silodosin Comparator: tamsulosin | |||||
| Outcomes | № of participants | Quality of the evidence | Relative effect | Anticipated absolute effects* (95% CI) | |
| Risk with tamsulosin | Risk difference with silodosin | ||||
| Urologic symptom scores | 1708 | ⊕⊕⊝⊝ | ‐ | The mean change of urologic symptom scores ranged from ‐15.60 to ‐4.60 | MD 0.04 lower |
| QoL | 1707 | ⊕⊕⊝⊝ | ‐ | The mean change of QoL ranged from ‐3.60 to ‐0.90 | MD 0.15 lower |
| Treatment withdrawal due to any reason | 1573 | ⊕⊝⊝⊝ | RR 1.02 | Study population | |
| 121 per 1000 | 2 fewer per 1000 | ||||
| Cardiovascular adverse events | 1955 | ⊕⊕⊝⊝ | RR 0.77 | Study population | |
| 63 per 1000 | 14 fewer per 1000 | ||||
| Sexual adverse events | 1849 | ⊕⊕⊕⊝ | RR 6.05 | Study population | |
| 28 per 1000 | 141 more per 1000 | ||||
| *The risk in the intervention group (and its 95% confidence interval) is based on the assumed risk in the comparison group and the relative effect of the intervention (and its 95% CI). | |||||
| GRADE Working Group grades of evidence | |||||
| aDowngraded by one level for study limitations: unclear or high risk of bias for one or more domains among the included studies. | |||||
| Silodosin compared to naftopidil for the treatment of lower urinary tract symptoms in men with benign prostatic hyperplasia (short term) | |||||
| Participants: men with lower urinary tract symptoms suggesting benign prostatic hyperplasia Setting: likely outpatients Intervention: silodosin Comparator: naftopidil | |||||
| Outcomes | № of participants | Quality of the evidence | Relative effect | Anticipated absolute effects* (95% CI) | |
| Risk with naftopidil | Risk difference with silodosin | ||||
| Urologic symptom scores | 652 | ⊕⊕⊝⊝ | ‐ | The mean change of urologic symptom scores ranged from ‐7.52 to ‐3.56 | MD 0.85 lower |
| QoL | 652 | ⊕⊕⊝⊝ | ‐ | The mean change of QoL ranged from ‐1.60 to ‐0.95 | MD 0.17 lower |
| Treatment withdrawal due to any reason | 659 | ⊕⊕⊝⊝ | RR 1.25 | Study population | |
| 102 per 1000 | 25 more per 1000 | ||||
| Cardiovascular adverse events | 808 | ⊕⊕⊝⊝ | RR 1.02 | Study population | |
| 23 per 1000 | 0 more per 1000 | ||||
| Sexual adverse events | 405 | ⊕⊕⊕⊝ | RR 5.93 | Study population | |
| 15 per 1000 | 74 more per 1000 | ||||
| *The risk in the intervention group (and its 95% confidence interval) is based on the assumed risk in the comparison group and the relative effect of the intervention (and its 95% CI). | |||||
| GRADE Working Group grades of evidence | |||||
| aDowngraded by one level for study limitations: unclear or high risk of bias for one or more domains among the included studies. | |||||
| Silodosin compared to alfuzosin for the treatment of lower urinary tract symptoms in men with benign prostatic hyperplasia (short term) | |||||
| Participants: men with lower urinary tract symptoms suggesting benign prostatic hyperplasia Setting: likely outpatients Intervention: silodosin Comparator: alfuzosin | |||||
| Outcomes | № of participants | Quality of the evidence | Relative effect | Anticipated absolute effects* (95% CI) | |
| Risk with alfuzosin | Risk difference with silodosin | ||||
| Urologic symptom scores | 60 | ⊕⊕⊝⊝ | ‐ | The mean change of urologic symptom scores was ‐16.93 | MD 3.83 higher |
| QoL | 60 | ⊕⊕⊕⊝ | ‐ | The mean change of QoL was ‐4.27 | MD 0.14 higher |
| Treatment withdrawal due to any reason | 60 | ⊕⊕⊝⊝ | Not estimable | Study population | |
| ‐ | ‐ | ||||
| Cardiovascular adverse events | 60 | ⊕⊕⊝⊝ | RR 0.67 | Study population | |
| 500 per 1000 | 165 fewer per 1000 | ||||
| Assumed baseline riskd | |||||
| 44 per 1000 | 15 fewer per 1000 | ||||
| Sexual adverse events | 95 | ⊕⊕⊝⊝ | RR 37.21 | Study population | |
| 21 per 1000 | 770 more per 1000 | ||||
| Assumed baseline riskd | |||||
| 6 per 1000 | 217 more per 1000 | ||||
| *The risk in the intervention group (and its 95% confidence interval) is based on the assumed risk in the comparison group and the relative effect of the intervention (and its 95% CI). | |||||
| GRADE Working Group grades of evidence | |||||
| aDowngraded by one level for study limitations: unclear or high risk of bias for one or more domains in the included study. | |||||
| Study name | Trial | Country | Setting | Description of participants | Intervention(s) | Duration of | Age | Prostate volume | IPSS |
| 2006‐2007 | Europe | 72 hospital clinics and inpatient units in 11 countries | Men ≥ 50 years with LUTS (defined by a stable IPSS total score ≥ 13 points), bladder outlet obstruction (defined by a Qmax between 4 and 15 mL/s, with a minimum voided volume of ≥ 125 mL) | Silodosin 8 mg once daily | 12 weeks | 65.8 ± 7.70 | NR | 19.1 ± 4.2 | |
| Tamsulosin 0.4 mg once daily | 65.9 ± 7.41 | 18.9 ± 4.3 | |||||||
| Placebo once daily | 66.0 ± 7.37 | 19.3 ± 4.3 | |||||||
| NR | South Korea | NR | Sexually active men with BPH | Silodosin 8 mg once daily | 4 weeks | NR | NR | NR | |
| Tamsulosin 0.2 mg once daily | |||||||||
| Alfuzosin 10 mg once daily | |||||||||
| NR | Japan | 88 centers/outpatient | Men ≥ 50 years with LUTS (IPSS of ≥ 8, an associated QoL score of ≥ 3) and prostate volume of ≥ 20 mL | Silodosin 4 mg twice daily | 12 weeks | 65.4 ± 7.0 | 36.0 ± 16.9 | 17.1 ± 5.7 | |
| Tamsulosin 0.2 mg once daily | 65.6 ± 7.0 | 35.7 ± 14.4 | 17.0 ± 5.7 | ||||||
| Placebo twice daily | 65.0 ± 6.9 | 35.2 ± 16.0 | 17.1 ± 6.1 | ||||||
| 2013‐2014 | India | Tertiary care hospital | Men ≥ 45 years with symptomatic BPH with LUTS (IPSS of ≥ 8, QoL of ≥ 3, and Qmax of < 15 mL/s, but > 4 mL/s with a voided volume of > 100 mL) | Silodosin 8 mg once daily | 12 weeks | 64.00 ± 11.14 | 40.57 ± 16.45 | 15.93 ± 6.03 | |
| Tamsulosin 0.4 mg once daily | 63.60 ± 9.05 | 40.33 ± 21.55 | 21.63 ± 7.63 | ||||||
| Alfuzosin 10 mg once daily | 63.43 ± 8.91 | 44.43 ± 27.72 | 19.2 ± 9.6 | ||||||
| 2005‐2006 | USA | Multicenter | Men ≥ 50 years with IPSS ≥ 13, Qmax 4 mL/s‐15 mL/s and a PVR < 250 mL | Silodosin 8 mg once daily | 12 weeks | 64.6 ± 8.1 | NR | 21.3 ± 5.1 | |
| Placebo once daily | 64.7 ± 8.1 | 21.3 ± 4.9 | |||||||
| 2009‐2011 | Japan | NR | Men ≥ 50 years with prostate estimated volume of > 20 mL, IPSS ≥ 8, QoL score ≥ 3 points | Silodosin 2 mg‐4 mg twice/d for 2 weeks, followed by 4 mg twice/d for 4 weeks | 6 weeks (before cross‐over)/total 12 weeks | 66.5 ± 5.6 | 38.8 ± 13.1 | 18.6 ± 5.5 | |
| Naftopidil 50 mg‐75 mg once/d for 2 weeks, followed by 75 mg once/d for 4 weeks | 68.5 ± 5.7 | 45.7 ± 17.8 | 17.6 ± 5.0 | ||||||
| 2012‐2013 | Japan | 52 urologists participated at a total of 44 investigational sites/outpatients | Men with LUTS (IPSS ≥ 8, IPSS QoL score 3) and prostate volume ≥ 20 mL | Silodosin 4 mg/d for 4 weeks, followed by 8 mg/d for 8 weeks | 12 weeks | 70.6 ± 7.8 | 39.6 ± 16.7 | 18.8 ± 6.2 | |
| Naftopidil 50 mg/d for 4 weeks, followed by 75 mg/d for 8 weeks | 70.3 ± 7.8 | 38.6 ± 14.8 | 18.9 ± 6.1 | ||||||
| 2006‐2007 | Japan | Multicenter | Men with IPSS ≥ 8 points; QoL score ≥ 3 points; prostate volume measured by ultrasonographic method ≥ 20 mL; void volume ≥ 100 mL; and maximal urinary flow rate (Qmax) < 15 mL/s | Silodosin 4 mg twice daily | 4 weeks (before cross‐over)/total 8 weeks | 68.2 ± 8.6 | 41.3 ± 25.3 | 16.6 ± 5.2 | |
| Tamsulosin 0.2 mg once daily | 70.1 ± 8.9 | 37.8 ± 16.3 | 18.2 ± 5.8 | ||||||
| 2013‐2015 | India | Tertiary hospital | Men > 50 years with bothersome LUTS from BPH and IPSS > 7 | Silodosin 8 mg once daily | 12 weeks | 61 ‐ 62 | NR | NR | |
| Tamsulosin 0.4 mg once daily | |||||||||
| 2009 | NR | NR | Men ≥ 50 years, with symptoms of moderate‐severe BPH and nocturia (≥ 2 episodes/night) | Silodosin 8 mg daily | 12 weeks | 64.6 ± 8.03 | NR | NR | |
| Placebo once daily | 64.2 ± 8.92 | ||||||||
| 2012‐2013 | India | Tertiary care hospital/ outpatient | Men > 50 years with bothersome LUTS from BPH and IPSS > 7 | Silodosin 8 mg once daily | 12 weeks | 61.4 ± 7.88 | 42.0 ± 19.96 | 18.4 ± 3.32 | |
| Tamsulosin 0.4 mg once daily | 62.6 ± 7.55 | 35.6 ± 9.56 | 18.4 ± 3.94 | ||||||
| 2007‐2011 | Japan | Kobe University School or other collaborating institutions | Men with LUTS (total IPSS ≥ 8, QoL index ≥ 3) and prostate volume ≥ 20 mL | Silodosin 4 mg twice daily | 8 weeks | 70.98 ± 6.69 | 38.24 ± 12.94 | 17.53 ± 5.4 | |
| Naftopidil 50 mg once daily | 70.50 ± 6.58 | 39.39 ± 25.96 | 17.56 ± 6.7 | ||||||
| 2011‐2014 | Japan | Four community‐based hospitals | Men aged ≥ 50 years with LUTS/BPH, an IPSS of ≥ 8, QoL score of ≥ 3, and ultrasound‐estimated prostatic volume of ≥ 20 mL | Silodosin 4 mg once daily | 4 weeks (before cross‐over)/total 8 weeks | 69.6 ± 5.4 | 38.7 ± 11.6 | 17.1 ± 7.3 | |
| Tamsulosin 0.2 mg once daily | 69.4 ± 7.0 | 47.3 ± 30.4 | 15.2 ± 7.0 | ||||||
| 2008‐2009 | Japan | Three institutions | Men with LUTS associated with BPH and had an IPSS ≥ 8 and an IPSS‐QoL score ≥ 2 | Silodosin 4 mg twice daily | 4 weeks (before cross‐over)/total 8 weeks | 69.3 ± 8.3 | 36.6 ± 18.3 | 16.4 ± 5.0 | |
| Tamsulosin 0.2 mg once daily | 69.9 ± 8.4 | 35.1 ± 13.0 | 18.1 ± 6.2 | ||||||
| 2007‐2010 | Japan | Nihon University School of Medicine | Men with BPH, ≥ 50 years with significant LUTS (IPSS ≥ 8, QoL score ≥ 3) | Silodosin 8 mg/ day | 12 weeks | 69.3 ± 7.8 | 33.2 ± 21.2 | 16.9 ± 5.5 | |
| Naftopidil 75 mg/ day | 70.0 ± 7.0 | 39.5 ± 18.0 | 18.9 ± 7.0 | ||||||
| NR | NR | NR | Men with LUTS (IPSS total score ≥ 8, Qmax < 15 mL/s) and prostate volume > 20 mL | Silodosin 4 mg twice daily | 12 months | 71.3 ± 8.2 | 42.0 ± 23.7 | 18.8 ± 7.3 | |
| Tamsulosin 0.2 ‐ 0.4 mg daily | 72.2 ± 7.6 | 41.2 ± 23.0 | 17.8 ± 6.4 | ||||||
| NR | Japan | Kawasaki Medical School | Men aged 50–‐80 years and with IPSS ≥ 8 | Silodosin 4 mg twice daily | 12 weeks | 70.2 ± 0.9 | 33.3 ± 2.3 | 18.7 ± 0.7 | |
| Tamsulosin 0.2 mg once daily | 71.5 ± 1.1 | 32.5 ± 2.0 | 18.0 ± 1.1 | ||||||
| Naftopidil 50 mg once daily | 69.1 ± 1.2 | 35.0 ± 3.1 | 17.4 ± 0.8 | ||||||
| 2008‐2010 | Japan | Single center | Men aged 50 years who had a total IPSS ≥ 8 and a QoL index ≥ 3 | Silodosin 4 mg twice daily | 3 months (before cross‐over)/1 month wash‐out/3 months (after cross‐over)/total 7 months | 68.9 ± 5.6 | 35.0 ± 18.4 | 19.3 ± 4.9 | |
| Tamsulosin 0.2 mg once daily | 70.0 ± 6.8 | 36.1 ± 15.5 | 21.1 ± 6.8 | ||||||
| 2007‐2008 | Taiwan | Nine medical centers | Men aged ≥ 40 years with an IPSS of ≥ 13 and prostate volume of ≥ 20 mL | Silodosin 4 mg twice daily | 12 weeks | 67.5 ± 9.3 | 44.8 ± 24.2 | 19.3 ± 4.5 | |
| Tamsulosin 0.2 mg and one placebo | 65.0 ± 8.8 | 38.2 ± 16.7 | 19.8 ± 4.5 | ||||||
| BPH: benign prostatic hyperplasia; IPSS: International Prostate Symptom Score; LUTS: lower urinary tract symptoms; NR: not reported; PVR: postvoid residual; Qmax: maximum flow rate; QoL: quality of life | |||||||||
| Study name | Intervention(s) and comparator(s) | Screened/eligible (N) | randomized (N) | Analysed (N) | Finishing trial (N (%)) |
| Silodosin 8 mg | 1228/955 | 381 | 346 | 356 (93.4) | |
| Tamsulosin 0.4 mg | 384 | 347 | 364 (94.7) | ||
| Placebo | 190 | 168 | 172 (90.5) | ||
| Total | 955 | 861 | 892 (93.4) | ||
| Silodosin 8 mg | NR/138 | 48 | 48 | 48 (100.0) | |
| Tamsulosin 0.2 mg | 43 | 43 | 43 (100.0) | ||
| Alfuzosin 10 mg | 47 | 47 | 47 (100.0) | ||
| Total | 138 | 138 | 138 (100.0) | ||
| Silodosin 8 mg | NR/457 | 176 | 175 | 175 (99.4) | |
| Tamsulosin 0.2 mg | 192 | 192 | 192 (100.0) | ||
| Placebo | 89 | 89 | 89 (100.0) | ||
| Total | 457 | 456 | 456 (99.7) | ||
| Silodosin 8 mg | NR/90 | 30 | 30 | 30 (100.0) | |
| Tamsulosin 0.4 mg | 30 | 30 | 30 (100.0) | ||
| Alfuzosin 10 mg | 30 | 30 | 30 (100.0) | ||
| Total | 90 | 90 | 90 (100.0) | ||
| Silodosin 8 mg | 2849/923 | 466 | 466 | 413 (88.6) | |
| Placebo | 457 | 457 | 419 (91.6) | ||
| Total | 923 | 923 | 832 (90.1) | ||
| Silodosin 4 mg or 8 mg | NR/92 | 44 | 30/83a | 30 (68.1) | |
| Naftopidil 50 mg or 75 mg | 48 | 34/79a | 34 (70.8) | ||
| Total | 92 | 64/162a | 64 (69.5) | ||
| Silodosin 4 mg followed by 8 mg | NR/350 | 175 | 157 | 157 (89.7) | |
| Naftopidil 50 mg followed by 75 mg | 175 | 157 | 157 (89.7) | ||
| Total | 350 | 314 | 314 (89.7) | ||
| Silodosin 8 mg | NR/97 | 46 | 34 | 34 (73.9) | |
| Tamsulosin 0.2 mg | 51 | 31 | 31 (60.7) | ||
| Total | 97 | 65 | 65 (67.0) | ||
| Silodosin 8 mg | NR/57 | 28 | NR | NR | |
| Tamsulosin 0.4 mg | 29 | NR | NR | ||
| Total | 57 | NR | NR | ||
| Silodosin 8 mg | 215/209 | 111 | 111 | 97 (87.3) | |
| Placebo | 98 | 98 | 89 (90.8) | ||
| Total | 209 | 209 | 186 (88.9) | ||
| Silodosin 8 mg | 102/61 | 32 | 26 | 26 (81.2) | |
| Tamsulosin 0.4 mg | 29 | 27 | 27 (93.1) | ||
| Total | 61 | 53 | 53 (86.8) | ||
| Silodosin 8 mg | NR/121 | 61 | 56/59a | 56 (91.8) | |
| Naftopidil 50 mg | 60 | 56/57a | 56 (93.3) | ||
| Total | 121 | 112/116a | 112 (92.5) | ||
| Silodosin 4 mg | NR/34 | 18 | 16 | 16 (88.8) | |
| Tamsulosin 0.2 mg | 16 | 14 | 14 (87.5) | ||
| Total | 34 | 30 | 30 (88.2) | ||
| Silodosin 4 mg | NR/102 | 51 | 42/88a | 42 (82.3) | |
| Tamsulosin 0.2 mg | 51 | 42/91a | 42 (82.3) | ||
| Total | 102 | 84/179a | 42 (82.3) | ||
| Silodosin 8 mg | 109/109 | 58 | 53 | 53 (91.3) | |
| Naftopidil 75 mg | 51 | 44 | 44 (86.2) | ||
| Total | 109 | 97 | 97 (88.9) | ||
| Silodosin 8 mg | NR/149 | 75 | NR | NR | |
| Tamsulosin 0.2 ‐ 0.4 mg | 74 | NR | NR | ||
| Total | 149 | NR | NR | ||
| Silodosin 8 mg | 136/136 | 45 | 41 | 41 (91.1) | |
| Tamsulosin 0.2 mg | 45 | 39 | 39 (86.6) | ||
| Naftopidil 50 mg | 46 | 42 | 42 (91.3) | ||
| Total | 136 | 122 | 122 (89.7) | ||
| Silodosin 8 mg | NR/46 | 23 | 23 | 23 (100.0) | |
| Tamsulosin 0.2 mg | 23 | 23 | 23 (100.0) | ||
| Total | 46 | 46 | 46 (100.0) | ||
| Silodosin 8 mg | NR/209 | 105 | 87 | 87 (82.8) | |
| Tamsulosin 0.2 mg | 104 | 83 | 83 (79.8) | ||
| Total | 209 | 170 | 170 (81.3) | ||
| Grand total | Interventions: silodosin | 1955 | 1684b | ||
| Compartors: placebo | 834 | 769 (92.2) | |||
| Compartors: tamsulosin | 1049 | 888b | |||
| Compartors: naftopidil | 380 | 333 (87.6) | |||
| Comparator: alfuzosin | 77 | 77 (100.0) | |||
| Overall | 4295 | 3751b | |||
| N: number; NR: not reported a Efficacy analysis/safety analysis. | |||||
| Outcome or subgroup title | No. of studies | No. of participants | Statistical method | Effect size |
| 1 Urologic symptom scores (short term) Show forest plot | 3 | 1743 | Mean Difference (IV, Random, 95% CI) | ‐2.65 [‐3.23, ‐2.08] |
| 2 Quality of life (short term) Show forest plot | 2 | 820 | Mean Difference (IV, Random, 95% CI) | ‐0.42 [‐0.71, ‐0.13] |
| 3 Treatment withdrawal due to any reason (short term) Show forest plot | 3 | 1703 | Risk Ratio (M‐H, Random, 95% CI) | 1.08 [0.70, 1.66] |
| 4 Treatment withdrawal due to adverse events (short term) Show forest plot | 4 | 1967 | Risk Ratio (M‐H, Random, 95% CI) | 2.29 [1.41, 3.72] |
| 5 Cardiovascular adverse events (short term) Show forest plot | 4 | 1967 | Risk Ratio (M‐H, Random, 95% CI) | 1.28 [0.67, 2.45] |
| 6 Sexual adverse events (short term) Show forest plot | 4 | 1967 | Risk Ratio (M‐H, Random, 95% CI) | 26.07 [12.36, 54.97] |
| Outcome or subgroup title | No. of studies | No. of participants | Statistical method | Effect size |
| 1 Urologic symptom scores (short term) Show forest plot | 10 | 1708 | Mean Difference (IV, Random, 95% CI) | ‐0.04 [‐1.31, 1.24] |
| 2 Quality of life (short term) Show forest plot | 10 | 1707 | Mean Difference (IV, Random, 95% CI) | ‐0.15 [‐0.53, 0.22] |
| 3 Treatment withdrawal due to any reason (short term) Show forest plot | 10 | 1573 | Risk Ratio (M‐H, Random, 95% CI) | 1.02 [0.62, 1.69] |
| 4 Treatment withdrawal due to adverse events (short term) Show forest plot | 9 | 1572 | Risk Ratio (M‐H, Random, 95% CI) | 1.96 [1.12, 3.44] |
| 5 Cardiovascular adverse events (short term) Show forest plot | 11 | 1955 | Risk Ratio (M‐H, Random, 95% CI) | 0.77 [0.53, 1.12] |
| 6 Sexual adverse events (short term) Show forest plot | 10 | 1849 | Risk Ratio (M‐H, Random, 95% CI) | 6.05 [3.55, 10.31] |
| Outcome or subgroup title | No. of studies | No. of participants | Statistical method | Effect size |
| 1 Urologic symptom scores (short term) Show forest plot | 5 | 652 | Mean Difference (IV, Random, 95% CI) | ‐0.85 [‐2.57, 0.87] |
| 2 Quality of life (short term) Show forest plot | 5 | 652 | Mean Difference (IV, Random, 95% CI) | ‐0.17 [‐0.60, 0.27] |
| 3 Treatment withdrawal due to any reason (short term) Show forest plot | 4 | 659 | Risk Ratio (M‐H, Random, 95% CI) | 1.25 [0.81, 1.93] |
| 4 Treatment withdrawal due to adverse events (short term) Show forest plot | 5 | 738 | Risk Ratio (M‐H, Random, 95% CI) | 1.38 [0.66, 2.89] |
| 5 Cardiovascular adverse events (short term) Show forest plot | 5 | 808 | Risk Ratio (M‐H, Random, 95% CI) | 1.02 [0.41, 2.56] |
| 6 Sexual adverse events (short term) Show forest plot | 4 | 405 | Risk Ratio (M‐H, Random, 95% CI) | 5.93 [2.16, 16.29] |
| Outcome or subgroup title | No. of studies | No. of participants | Statistical method | Effect size |
| 1 Urologic symptom scores (short term) Show forest plot | 1 | 60 | Mean Difference (IV, Random, 95% CI) | 3.83 [0.12, 7.54] |
| 2 Quality of life (short term) Show forest plot | 1 | 60 | Mean Difference (IV, Random, 95% CI) | 0.14 [‐0.46, 0.74] |
| 3 Cardiovascular adverse events (short term) Show forest plot | 1 | 60 | Risk Ratio (M‐H, Random, 95% CI) | 0.67 [0.36, 1.24] |
| 4 Sexual adverse events (short term) Show forest plot | 1 | 95 | Risk Ratio (M‐H, Random, 95% CI) | 37.21 [5.32, 260.07] |