Cognitive behavioural therapy for tinnitus
Abstract
Background
Tinnitus affects up to 21% of the adult population with an estimated 1% to 3% experiencing severe problems. Cognitive behavioural therapy (CBT) is a collection of psychological treatments based on the cognitive and behavioural traditions in psychology and often used to treat people suffering from tinnitus.
Objectives
To assess the effects and safety of CBT for tinnitus in adults.
Search methods
The Cochrane ENT Information Specialist searched the ENT Trials Register; CENTRAL (2019, Issue 11); Ovid MEDLINE; Ovid Embase; CINAHL; Web of Science; ClinicalTrials.gov; ICTRP and additional sources for published and unpublished trials. The date of the search was 25 November 2019.
Selection criteria
Randomised controlled trials (RCTs) of CBT versus no intervention, audiological care, tinnitus retraining therapy or any other active treatment in adult participants with tinnitus.
Data collection and analysis
We used the standard methodological procedures expected by Cochrane. Our primary outcomes were the impact of tinnitus on disease‐specific quality of life and serious adverse effects. Our secondary outcomes were: depression, anxiety, general health‐related quality of life, negatively biased interpretations of tinnitus and other adverse effects. We used GRADE to assess the certainty of evidence for each outcome.
Main results
We included 28 studies (mostly from Europe) with a total of 2733 participants. All participants had had tinnitus for at least three months and their average age ranged from 43 to 70 years. The duration of the CBT ranged from 3 to 22 weeks and it was mostly conducted in hospitals or online.
There were four comparisons and we were interested in outcomes at end of treatment, and 6 and 12 months follow‐up. The results below only refer to outcomes at end of treatment due to an absence of evidence at the other follow‐up time points.
CBT versus no intervention/wait list control
Fourteen studies compared CBT with no intervention/wait list control. For the primary outcome, CBT may reduce the impact of tinnitus on quality of life at treatment end (standardised mean difference (SMD) ‐0.56, 95% confidence interval (CI) ‐0.83 to ‐0.30; 10 studies; 537 participants; low certainty). Re‐expressed as a score on the Tinnitus Handicap Inventory (THI; range 0 to 100) this is equivalent to a score 10.91 points lower in the CBT group, with an estimated minimal clinically important difference (MCID) for this scale being 7 points. Seven studies, rated as moderate certainty, either reported or informed us via personal communication about serious adverse effects. CBT probably results in little or no difference in adverse effects: six studies reported none and in one study one participant in the CBT condition worsened (risk ratio (RR) 3.00, 95% CI 0.13 to 69.87). For the secondary outcomes, CBT may result in a slight reduction in depression (SMD ‐0.34, 95% CI‐0.60 to ‐0.08; 8 studies; 502 participants; low certainty). However, we are uncertain whether CBT reduces anxiety, improves health‐related quality of life or reduces negatively biased interpretations of tinnitus (all very low certainty). From seven studies, no other adverse effects were reported (moderate certainty).
CBT versus audiological care
Three studies compared CBT with audiological care. CBT probably reduces the impact of tinnitus on quality of life when compared with audiological care as measured by the THI (range 0 to 100; mean difference (MD) ‐5.65, 95% CI ‐9.79 to ‐1.50; 3 studies; 444 participants) (moderate certainty; MCID = 7 points). No serious adverse effects occurred in the two included studies reporting these, thus risk ratios were not calculated (moderate certainty). The evidence suggests that CBT may slightly reduce depression but may result in little or no difference in anxiety or health‐related quality of life (all low certainty) when compared with audiological care. CBT may reduce negatively biased interpretations of tinnitus when compared with audiological care (low certainty). No other adverse effects were reported for either group (moderate certainty).
CBT versus tinnitus retraining therapy (TRT)
One study compared CBT with TRT (including bilateral sound generators as per TRT protocol). CBT may reduce the impact of tinnitus on quality of life as measured by the THI when compared with TRT (range 0 to 100) (MD ‐15.79, 95% CI ‐27.91 to ‐3.67; 1 study; 42 participants; low certainty). For serious adverse effects three participants deteriorated during the study: one in the CBT (n = 22) and two in the TRT group (n = 20) (RR 0.45, 95% CI 0.04 to 4.64; low certainty). We are uncertain whether CBT reduces depression and anxiety or improves health‐related quality of life (low certainty). CBT may reduce negatively biased interpretations of tinnitus. No data were available for other adverse effects.
CBT versus other active control
Sixteen studies compared CBT with another active control (e.g. relaxation, information, Internet‐based discussion forums). CBT may reduce the impact of tinnitus on quality of life when compared with other active treatments (SMD ‐0.30, 95% CI ‐0.55 to ‐0.05; 12 studies; 966 participants; low certainty). Re‐expressed as a THI score this is equivalent to 5.84 points lower in the CBT group than the other active control group (MCID = 7 points). One study reported that three participants deteriorated: one in the CBT and two in the information only group (RR 1.70, 95% CI 0.16 to 18.36; low certainty). CBT may reduce depression and anxiety (both low certainty). We are uncertain whether CBT improves health‐related quality of life compared with other control. CBT probably reduces negatively biased interpretations of tinnitus compared with other treatments. No data were available for other adverse effects.
Authors' conclusions
CBT may be effective in reducing the negative impact that tinnitus can have on quality of life. There is, however, an absence of evidence at 6 or 12 months follow‐up. There is also some evidence that adverse effects may be rare in adults with tinnitus receiving CBT, but this could be further investigated. CBT for tinnitus may have small additional benefit in reducing symptoms of depression although uncertainty remains due to concerns about the quality of the evidence. Overall, there is limited evidence for CBT for tinnitus improving anxiety, health‐related quality of life or negatively biased interpretations of tinnitus.
PICO
Plain language summary
Cognitive behavioural therapy for adults with tinnitus
What is the aim of this review?
The aim of this Cochrane Review was to find out if cognitive behavioural therapy (CBT) is effective for tinnitus. Cochrane researchers collected and analysed all relevant studies to answer this question.
Key messages
There is some low‐ to moderate‐certainty evidence that CBT may reduce the negative impact that tinnitus can have on quality of life at the end of treatment, with few or no adverse effects (although further research on this is needed).
What was studied in the review?
Tinnitus is the perception of sound in the ear or head without any outside source. It is often described as a ringing, hissing, buzzing or whooshing sound. Tinnitus is mostly managed with education and/or counselling, relaxation therapy, tinnitus retraining therapy and ear‐level sound generators or hearing aids. CBT is a form of talking therapy that aims to change the patient's emotional and/or behavioural response to their tinnitus. This review looked at studies of CBT for adults who had had tinnitus for at least three months. Participants in the control groups either received no intervention, audiological (hearing) care, tinnitus retraining therapy or another type of treatment. The review authors studied the effect of CBT on tinnitus‐related quality of life, adverse effects, depression, anxiety, general quality of life and negatively biased interpretations of tinnitus.
What are the main results of the review?
We found 28 relevant studies, mostly from Europe, with a total of 2733 participants. The participants receiving CBT had treatment for between three and 22 weeks (mostly in clinics or online).
When CBT was compared to no intervention there was low‐certainty evidence that CBT may reduce the negative impact of tinnitus on quality of life at the end of treatment. It is not known whether this effect persists in the longer term (six or 12 months). There were few or no adverse effects (only one adverse effect was reported in one participant among seven studies). CBT may also slightly reduce depression (low‐certainty evidence) and may reduce anxiety, although this finding is very uncertain. It is also uncertain whether CBT improves general quality of life or negatively biased interpretations of tinnitus.
Compared to audiological care, tinnitus retraining therapy and other types of treatment, there were findings that CBT probably reduces the negative impact of tinnitus on quality of life. The certainty of this evidence ranged from moderate to low. Where reported, there were few adverse effects and no significant differences between the groups. For depression, anxiety and general quality of life the results were more mixed and the evidence less certain. There is moderate‐certainty evidence that CBT may reduce negatively biased interpretations of tinnitus compared to other types of treatment, but compared to audiological care and tinnitus retraining therapy the evidence is less certain.
How up to date is this review?
The review authors searched for studies that had been published up to November 2019.
Authors' conclusions
Summary of findings
| CBT compared to no intervention/waiting list control for tinnitus at end of treatment | ||||||
| Patient or population: adults with tinnitus | ||||||
| Outcomes at end of treatment | Anticipated absolute effects* (95% CI) | Relative effect | № of participants | Certainty of the evidence | Comments | |
| Risk with no intervention/waiting list control | Risk with CBT | |||||
| Impact of tinnitus on quality of life at treatment end Assessed with: TFI, | — | SMD 0.56 lower | — | 537 | ⊕⊕⊝⊝ | CBT may reduce the impact of tinnitus on quality of life at treatment end. The SMD can be interpreted as the THI score in the CBT group being on average 10.91 points lower than in the no intervention/waiting list control group. (The minimal clinically important change score has been estimated to be 7 points on the THI). |
| Serious adverse effects at end of treatment | Study population | RR 3.00 | 447 | ⊕⊕⊕⊝ | One participant allocated to CBT deteriorated. However, the deterioration in symptoms occurred between two assessments prior to the intervention commencing but was still detectable at end of treatment. CBT probably results in little or no difference in adverse effects. | |
| 0 per 1000 | 0 per 1000 | |||||
| Depression at end of treatment | — | SMD 0.34 lower | — | 502 | ⊕⊕⊝⊝ | CBT may result in a slight reduction in depression at end of treatment. |
| Anxiety at end of treatment | — | SMD 0.45 lower | — | 429 | ⊕⊝⊝⊝ | The evidence is very uncertain about whether CBT reduces anxiety at end of treatment. |
| Health‐related quality of life | — | SMD 0.38 lower | — | 179 | ⊕⊝⊝⊝ | The evidence is very uncertain about whether CBT improves health‐related quality of life. |
| Negatively biased interpretations of tinnitus | — | SMD 0.4 lower | — | 84 | ⊕⊝⊝⊝ | The evidence is very uncertain about whether CBT reduces negatively biased interpretations of tinnitus. |
| Other adverse effects | No adverse effects occurred. | — | 447 | ⊕⊕⊕⊝ | — | |
| *The risk in the intervention group (and its 95% confidence interval) is based on the assumed risk in the comparison group and the relative effect of the intervention (and its 95% CI). | ||||||
| GRADE Working Group grades of evidence | ||||||
| 1Downgraded one level due to study limitations (risk of bias): all studies included for this outcome were judged to be either unclear or at high risk of performance bias due to an absence of blinding of participants and personnel. | ||||||
| CBT compared to audiological care (tinnitus education and rehabilitation for hearing loss) for tinnitus at end of treatment | ||||||
| Patient or population: adults with tinnitus | ||||||
| Outcomes at end of treatment | Anticipated absolute effects* (95% CI) | Relative effect | № of participants | Certainty of the evidence | Comments | |
| Risk with audiological care (tinnitus education and rehabilitation for hearing loss) | Risk with CBT | |||||
| Impact of tinnitus on quality of life | 34.14 | MD 5.65 lower | — | 430 | ⊕⊕⊕⊝ | The MD is reported here because the 3 studies all reported outcome data from the THI. CBT probably reduces the impact of tinnitus on quality of life when compared with audiological care. |
| Serious adverse effects | No serious adverse effects occurred. | — | 410 | ⊕⊕⊕⊝ | Meta‐analysis was not conducted for this outcome. | |
| Depression at end of treatment | — | SMD 0.18 lower | — | 410 | ⊕⊕⊝⊝ | CBT may slightly reduce depression at end of treatment when compared with audiological care. |
| Anxiety at end of treatment | — | SMD 0.06 lower | — | 410 | ⊕⊕⊝⊝ | CBT may result in little to no difference in anxiety at end of treatment when compared with audiological care. |
| Health‐related quality of life | — | SMD 0.07 lower | — | 410 | ⊕⊕⊝⊝ | CBT may result in little to no difference in health‐related quality of life when compared with audiological care. |
| Negatively biased interpretations of tinnitus | At end of treatment TCS scores had decreased from a mean of 21. 42 (SD 12.56) to 17.14 (SD 11.54). | At end of treatment TCS scores had decreased from a mean of 20.89 (SD 11.83) to 12.45 (10.30). | — | 336 | ⊕⊕⊝⊝ | CBT may reduce negatively biased interpretations of tinnitus when compared with audiological care. |
| Other adverse effects | No adverse effects occurred. | — | 410 | ⊕⊕⊕⊝ | — | |
| *The risk in the intervention group (and its 95% confidence interval) is based on the assumed risk in the comparison group and the relative effect of the intervention (and its 95% CI). The assumed risk score in the comparison group (34.14) was obtained from the median control group score from the largest study (Cima 2012) in this comparison. | ||||||
| GRADE Working Group grades of evidence | ||||||
| 1Downgraded one level due to study limitations (risk of bias): all studies included for this outcome were judged to be either unclear or at high risk of performance bias due to an absence of blinding of participants and personnel. 2Downgraded by one level due to imprecision: the confidence intervals cross the line of no effect. 3Downgraded one level due to study limitations (risk of bias): performance and detection bias judged as unclear. 4Downgraded one level due to imprecision: small sample size. | ||||||
| CBT compared to TRT (directive counselling and bilateral masking) for tinnitus at end of treatment | ||||||
| Patient or population: adults with tinnitus | ||||||
| Outcomes at end of treatment | Anticipated absolute effects* (95% CI) | Relative effect | № of participants | Certainty of the evidence | Comments | |
| Risk with TRT (directive counselling and bilateral masking) | Risk with CBT | |||||
| Impact of tinnitus on quality of life | At 10 weeks the THI score had decreased from an average of 47.00 (SD 18.19) to an average of 43.22 (SD 20.75). | At 10 weeks the THI score had decreased from an average of 45.27 (SD 14.99) to an average of 27.43 (19.18). | — | 42 | ⊕⊕⊝⊝ | CBT may reduce the impact of tinnitus on quality of life compared with TRT. |
| Serious adverse effects | Study population | RR 0.45 | 42 | ⊕⊕⊝⊝ | Three participants deteriorated over the course of the study: 1 participant was from the intervention group (ACT; n = 22) and 2 participants were from the comparison group (TRT; n = 20). | |
| 100 per 1000 | 45 per 1000 | |||||
| Depression Assessed with: HADS‐D | At 10 weeks the HADS‐D scores had decreased from a mean of 5.80 (SD 3.79) to 5.78 (SD 3.73). | At 10 weeks the HADS‐D scores had decreased from a mean of 4.05 (SD 3.06) to 3.20 (SD 3.47). | — | 42 | ⊕⊕⊝⊝ | We are uncertain whether CBT reduces depression compared with TRT. |
| Anxiety | At 10 weeks the HADS‐A scores had decreased from a mean of 8.2 (SD 3.75) to 7.0 (SD 4.20). | At 10 weeks the HADS‐A scores had decreased from a mean of 6.24 (SD 4.00) to 3.6 (SD 3.14). | — | 42 | ⊕⊕⊝⊝ | We are uncertain whether CBT reduces anxiety compared with TRT. |
| Health‐related quality of life | At 10 weeks QoLI scores had increased from a mean of 2.24 (SD 1.42) to 2.47 (SD 1.72). | At 10 weeks QoLI scores had increased from a mean of 2.43 (SD 1.30) to 2.78 (SD 1.53). | — | 42 | ⊕⊕⊝⊝ | We are uncertain whether CBT improves health‐related quality of life compared with TRT. |
| Negatively biased interpretations of tinnitus | At 10 weeks TAQ scores had increased from a mean of 36.65 (9.96) to 37.89 (SD 10.73). | At 10 weeks TAQ scores had increased from a mean of 41.05 (SD 9.49) to 47.67 (SD 11.15). | — | 42 | ⊕⊕⊝⊝ | CBT may reduce negatively biased interpretations of tinnitus compared with TRT. |
| Other adverse effects | No other adverse effects were reported. | — | 42 | ⊕⊕⊝⊝ | — | |
| *The risk in the intervention group (and its 95% confidence interval) is based on the assumed risk in the comparison group and the relative effect of the intervention (and its 95% CI). | ||||||
| GRADE Working Group grades of evidence | ||||||
| 1Downgraded one level due to study limitations (risk of bias). There was high risk of bias associated with allocation concealment and unclear risk of bias for performance, detection and attrition bias respectively. 2Downgraded one level due to imprecision: small sample size. | ||||||
| CBT compared to other experimental control for tinnitus | ||||||
| Patient or population: adults with tinnitus | ||||||
| Outcomes at end of treatment | Anticipated absolute effects* (95% CI) | Relative effect | № of participants | Certainty of the evidence | Comments | |
| Risk with other experimental control | Risk with CBT | |||||
| Impact of tinnitus on quality of life at end of treatment | — | SMD 0.30 lower | — | 966 | ⊕⊕⊝⊝ | CBT may reduce the impact of tinnitus on quality of life when compared with other treatments. The SMD can be interpreted as the THI score in the CBT group being on average 5.84 points lower than in the other experimental control group. (The minimal clinically important change score has been estimated to be 7 points on the THI). |
| Serious adverse effects | Study population | RR 1.70 | 595 | ⊕⊕⊝⊝ | Three participants deteriorated according to reliable change calculations using the TQ; 1 was from the group CBT intervention and 2 received "information only" control. | |
| 6 per 1000 | 10 per 1000 | |||||
| Depression at end of treatment | — | SMD 0.17 lower | — | 943 | ⊕⊕⊝⊝ | CBT may reduce depression when compared with other treatments. |
| Anxiety at end of treatment | — | SMD 0.25 lower | — | 696 | ⊕⊕⊝⊝ | CBT may reduce anxiety when compared with other treatments. |
| Health‐related quality of life at end of treatment | By the end of treatment, the mean quality of life score increased from a mean of 1.98 (SD 1.58) to 2.27 (1.5). | By the end of treatment, the quality of life score had increased from a mean of 1.67 (SD 1.71) to 2.32 (SD 1.51). | — | 95 | ⊕⊝⊝⊝ | We are uncertain whether CBT improves health‐related quality of life compared with other treatments. |
| Negatively biased interpretations of tinnitus at end of treatment | — | SMD 0.55 lower | — | 455 | ⊕⊕⊕⊝ | CBT probably reduces negatively biased interpretations of tinnitus when compared with other treatments. |
| Other adverse effects | No other adverse effects reported. | — | 595 | ⊕⊕⊝⊝ | — | |
| *The risk in the intervention group (and its 95% confidence interval) is based on the assumed risk in the comparison group and the relative effect of the intervention (and its 95% CI). | ||||||
| GRADE Working Group grades of evidence | ||||||
| 1Downgraded one level due to study limitations (risk of bias): all studies included for this outcome were judged to be either unclear or at high risk of performance bias due to an absence of blinding of participants and personnel. | ||||||
Background
The following paragraphs and Description of the condition are based on the Cochrane Review 'Amplification with hearing aids for patients with tinnitus and co‐existing hearing loss' and reproduced with permission (Hoare 2014).
Tinnitus is defined as the perception of sound in the absence of a corresponding auditory source (Jastreboff 2004). It is typically described by those who experience it as a ringing, hissing, buzzing or whooshing sound and is thought to result from abnormal neural activity and connectivity in auditory and non‐auditory pathways, which is interpreted by the brain as sound (Elgoyhen 2015; Shore 2016). Tinnitus can be either objective or subjective.
Objective tinnitus is estimated to occur in up to 10% of people with tinnitus seeking help (Kircher 2008), and refers to the perception of sound that can also be heard by the examiner (Roberts 2010). Objective forms include heartbeat synchronous pulsatile tinnitus and they usually have a detectable cause such as arteriovenous malformation, carotid stenosis or dissections (Langguth 2013). Specific medication or surgical treatment can lead to the cessation of the objective tinnitus percept (Kleinjung 2016).
Most commonly, however, tinnitus is subjective, meaning that the sound is only heard by the person experiencing it and no source of the sound can be identified (Jastreboff 1988). Subjective tinnitus (the focus of this review) is estimated to affect up to 21% of the general adult population, increasing to as many as 30% of adults over 50 years of age (Davis 2000; Gallus 2015; Kim 2015). It can be experienced acutely, recovering spontaneously within minutes to weeks. However, it can become chronic and is unlikely to resolve spontaneously when experienced for three months or more (Hahn 2008; Hall 2011; Rief 2005). In 1% to 3% of the population tinnitus causes severe problems with daily life functioning (Davis 2000; Kim 2015). Although a range of psychological, sound, electrical and electromagnetic therapies have been developed, currently there is no reliable cure for subjective tinnitus.
In England alone there are an estimated ¾ million General Practitioner consultations every year where the primary complaint is tinnitus (El‐Shunnar 2011), equating to a major burden on healthcare services. For many people tinnitus is persistent and troublesome, and has disabling effects such as insomnia, difficulty concentrating, difficulties in communication and social interaction, and negative emotional responses such as anxiety and depression (Andersson 2009; Cima 2011b; Crönlein 2007; Langguth 2011; Marciano 2003; Zirke 2013a; Zirke 2013b). In approximately 90% of cases, chronic tinnitus is co‐morbid with some degree of hearing loss, which may confound these disabling effects (Fowler 1944; Sanchez 2002). An important implication of this in clinical research is that outcome measures need to distinguish benefits specific to the tinnitus signal itself and related aspects such as impairments in communication, emotional processing and social interaction, which all play a relevant role in quality of life.
For the purposes of this review we will use 'the impact of tinnitus on quality of life' (or tinnitus‐related quality of life) as a collective term for the cognitive, emotional and behavioural consequences/sequelae that people living with chronic tinnitus experience. Additionally, unless otherwise noted, we will refer to subjective tinnitus simply as tinnitus.
Description of the condition
Pathophysiology
Most people with chronic tinnitus have some degree of hearing loss (Ratnayake 2009), and the prevalence of tinnitus increases with greater hearing loss (Han 2009; Martines 2010). Converging evidence from animal models and studies of human tinnitus sufferers indicates that, while cochlear damage is a trigger, most cases of tinnitus are generated by changes that take place in central auditory pathways when auditory neurons lose their input from the ear (Noreña 2011). Forms of neural plasticity underlie these neural changes, which include: increased spontaneous activity and neural gain in deafferented central auditory structures; increased synchronous activity in these structures; and changes in network behaviour in non‐auditory brain regions. These changes have been detected by functional imaging of individuals with tinnitus and corroborated by animal investigations (Eggermont 2014; Elgoyhen 2015). (Additional detail is provided in Appendix 1).
A complication in understanding the pathophysiology of tinnitus is that not all people with hearing loss have tinnitus and not all people with tinnitus have a clinically significant hearing loss. Other variables, such as the profile of a person's hearing loss, may account for differences in their tinnitus report. For example, König 2006 found that the maximum slope within audiograms was higher in people with tinnitus than in people with hearing loss who do not have tinnitus, despite the 'non‐tinnitus' group having the greater mean hearing loss. Also the additional involvement of non‐auditory areas of the brain, particularly areas associated with awareness and salience detection, can explain why some people with hearing loss develop tinnitus whereas others do not (de Ridder 2011; de Ridder 2014).
Whether tinnitus is perceived as bothersome or not may be related to the additional involvement of emotion processing areas (Rauschecker 2010; Schecklmann 2013; Vanneste 2012). Accordingly, some models have proposed that tinnitus reflects "an emergent property of multiple parallel dynamically changing and partially overlapping sub‐networks". This suggests that various brain networks associated with memory and emotional processing are involved in tinnitus and that the degree of involvement of the different networks reflects the variable aspects of an individual's tinnitus (de Ridder 2011; de Ridder 2014; Elgoyhen 2015).
Psychological models of tinnitus
In addition to the physiological data and models of tinnitus, psychological models have been developed to explain how and why some people experience a negative impact of tinnitus on quality of life. Psychological models of tinnitus include those developed by Hallam, which applies the concept of habituation (Hallam 1984); Jastreboff, whose model features classical conditioning mechanisms (Jastreboff 1988; Jastreboff 1990); and the cognitive behavioural models of McKenna 2014, Cima 2011b and Kleinstauber 2013 (Appendix 2). These psychological models underpin the rationale and development of cognitive behavioural interventions for reducing the impact of tinnitus on quality of life.
Diagnosis and clinical management of tinnitus
There is no universal internationally established standard procedure for the diagnosis or management of tinnitus. However, common across the (few) published practice guidelines is the use or recommendation of self‐report questionnaires to assess tinnitus and its impact on patients by measuring severity, quality of life, depression or anxiety (Fuller 2017a). Psychoacoustic measures of tinnitus (pitch, loudness, minimum masking level) are also used in patient assessment but do not correlate well with self‐reported measures of tinnitus annoyance (Hiller 2006). Instead they represent measurements of tinnitus that can be useful in patient counselling by, for example, demonstrating changes (or stability) in the individual's perception of the tinnitus over time (Department of Health 2009). No objective measures of tinnitus currently exist and so researchers and clinicians are reliant upon patient self‐report measures (usually questionnaires with Likert‐type or visual analogue scales) to record any changes in tinnitus related quality of life or other general health effects of therapy (Appendix 3). The previous Cochrane Review of cognitive behavioural therapy for tinnitus used self‐reported, subjective tinnitus loudness as the primary outcome measure (Martinez‐Devesa 2010). That review and others like it have consistently reported that there are generally weak (if any) effects of the intervention on the level of perceived loudness of the tinnitus (Andersson 1999; Martinez‐Devesa 2010). Additionally, concerns have been raised about what is actually being measured when people are asked to rate the subjective loudness of their tinnitus (McKenna 2014).
Clinical management strategies include education and/or counselling, relaxation therapy, tinnitus retraining therapy (TRT), cognitive behavioural therapies (CBT) and sound enrichment using ear‐level sound generators or hearing aids (Henry 2005). In addition, electrical and neurostimulation, as well as drug therapies aimed at treating tinnitus directly, or managing co‐morbid symptoms such as insomnia, anxiety or depression, have been tested. The effects of these management options are variable, they have inconclusive outcomes and some have risks or adverse effects (Dobie 1999; Hoare 2011a; Hoare 2011b; Hobson 2012; Langguth 2013; Martinez‐Devesa 2010; Phillips 2010).
Description of the intervention
Cognitive behavioural therapy (CBT) is an inclusive term that features and combines numerous psychological interventions that were developed and evolved from cognitive and behavioural therapies respectively. CBT for tinnitus aims primarily to reduce the impact of tinnitus on quality of life, rather than directly change the perceived loudness.
Behavioural therapies (e.g. behavioural activation, exposure, relaxation) aim to help patients overrule learned associations between tinnitus and counter‐productive responses (e.g. avoiding tinnitus‐increasing activities). Cognitive therapies, on the other hand, focus on the relationship between thoughts and emotions (Ellis 1977), and apply a process of identification and modification of errors in thought processing of experiences (Beck 1979). Combined, the behavioural and cognitive theories have produced a range of intervention components designed to address the dysfunctional thought processes, behavioural and emotional responses that maintain low tinnitus‐related quality of life..
As discussed by Cima 2014, cognitive behavioural interventions such as mindfulness‐based stress reduction (also known as 'mindfulness'; Kabat‐Zinn 1982) and acceptance and commitment therapy (ACT; Hayes 1999) have been developed and applied to the treatment of the impact of tinnitus on quality of life (e.g. Hesser 2009; Philippot 2012). For the purposes of this review, we will not make distinctions between whether an intervention is 'first', 'second' or 'third wave' CBT. Instead, we will treat ACT and mindfulness interventions as CBT and in the course of data extraction we will identify components/elements within all interventions as behavioural, cognitive or a combination (i.e. CBT).
Interventions described or labelled as 'CBT' cannot be assumed to be equivalent homogenous entities. Even if CBT interventions comprise the same elements they might vary with regard to: the mode of delivery of the intervention (e.g. face‐to‐face, mediated via telephone, Internet); the frequency of sessions (e.g. daily, weekly, fortnightly); the length of sessions; the duration of the intervention; who delivers the CBT (e.g. psychologist, social worker, nurse, computer program); the setting in which the treatment is delivered (e.g. hospital, health centre, private clinic); and whether the therapy is delivered in a group or individual format.
The previous Cochrane Review of CBT for tinnitus found that there were no reported adverse effects in the included studies (Martinez‐Devesa 2010). It is, however, conceivable that people might experience a deterioration in their mood during the course of CBT, due to the often challenging nature of the therapy or the distress arising as a result of changes in cognitive and emotional mechanisms. It is also possible that adverse effects were not reported by the authors of studies included in the review, as this is a common occurrence in studies (Pitrou 2009).
How the intervention might work
Since a growing body of evidence suggests that the impact of tinnitus on quality of life depends more on psychological factors than acoustic properties (Cima 2014; Milerova 2013), psychological therapies have been widely used for tinnitus treatment.
Cognitive strategies are based on the idea that negatively biased interpretations or thoughts about specific events or experiences, such as hearing tinnitus, produce a dysfunctional emotional and/or behavioural response (Beck 1979; Ellis 1977). Thus, cognitive strategies are thought to work by identifying any biased or irrational thinking styles (such as catastrophising), then challenging, modifying and/or replacing them with alternative and more realistic beliefs that lead to a more adaptive response.
A behavioural intervention such as an exposure therapy might be utilised to decrease the impact of tinnitus on daily life. Exposure to the tinnitus sound is thought to work through a process of extinction learning and generalisation. That is, a person learns that the tinnitus sound is no longer indicative of being emotionally aroused or in a distressed state and applies this new knowledge to situations beyond those learned in the therapeutic setting. In daily life this might mean a person re‐engages in activities that they previously avoided for fear that the tinnitus would deteriorate.
Individually, cognitive and behavioural therapy components are hypothesised to have specific effects. For example, education regarding the physiology and pathophysiology of hearing and tinnitus are thought to provide a foundation on which patients can begin to understand that tinnitus is not a harmful symptom in its own right and hence nothing, logically at least, to be afraid of. Cognitive behavioural approaches to tinnitus therapy are therefore hypothesised to affect a reduction in impact of tinnitus on quality of life through the summed or synergistic effects of the specific intervention components included in an individual therapy. Further, it is hypothesised that this has a consequent effect of reducing generalised anxiety or depression where it is co‐morbid, and generally improving self‐reported quality of life.
To date there has been little detailed research examining precisely when therapeutic change occurs during the course of CBT treatments, but they have been reported to be effective over at least a 12‐month period (e.g. Cima 2012).
Why it is important to do this review
This review includes recent randomised controlled trials of CBT for tinnitus that were not included in previous meta‐analyses or recent reviews. The most recently published review of CBT interventions for tinnitus was a historical and narrative overview in which a range of study designs in addition to RCTs were included, but also one in which neither a risk of bias assessment was undertaken nor a meta‐analysis conducted (Cima 2014). These methodological issues make it harder to draw conclusions about the strength of any treatment effects and risks of bias in the evidence included in the narrative synthesis.
A second reason is that it was also important to address new questions that will inform decisions about service provision, as this has particular relevance for the policy‐makers and agencies involved in the funding of treatment (e.g. insurance companies). CBT for tinnitus is generally well received by patients and is potentially a cost‐effective means for reducing the impact of tinnitus on quality of life (Maes 2014), but it would also be informative to compare the effectiveness of CBT delivered in group and individual formats and CBT performed by psychologists compared with other health professionals.
Finally, since the previous version of the Cochrane Review of CBT for tinnitus was published (Martinez‐Devesa 2010), Cochrane standards for the conduct of intervention reviews have been revised (Higgins 2013; Higgins 2016). This new review not only includes recent randomised controlled trials, but also complies with the new standards.
In summary, this review synthesises the latest evidence related to CBT for tinnitus, which will help inform decisions on whether CBT for tinnitus is effective at reducing the impact of tinnitus on quality of life.
Objectives
To assess the effects and safety of CBT for tinnitus in adults.
Methods
Criteria for considering studies for this review
Types of studies
Randomised controlled trials (including cluster‐randomised). If included studies had used a cross‐over design, we would have only included data from the first treatment phase. Quasi‐randomised controlled studies were not included.
We did not apply restrictions on language, year of publication or publication status.
Types of participants
Participants were at least 18 years of age with tinnitus as the primary reason for seeking treatment.
In the event that studies included an age range of participants below 18 years (e.g. 16 to 21 years), they were included if the mean age was 18 years or above.
Types of interventions
The primary intervention of interest was CBT. For the purposes of this review we included studies that also described CBT interventions that apparently only used cognitive or behavioural elements. Interventions such as acceptance and commitment therapy (ACT) and mindfulness were also included but simply considered as types of CBT.
We considered interventions as 'mindfulness' if they involved: exercises that involved self‐regulation of attention on experience and emphasised openness, curiosity and acceptance (Bishop 2004).
For the purposes of determining similarities for subgroup analysis, we would have attempted to contact authors of studies that examined the effectiveness of an apparently 'pure' cognitive or behavioural interventions to obtain treatment manuals or protocols.
Upon receipt of any protocols, two authors would have then independently reviewed the intervention manual classifying treatment elements as either cognitive or behavioural. Based on results from a review of treatment components used in psychological therapy for people with tinnitus (Thompson 2016) and the behaviour change taxonomy (Michie 2013), we classified interventions as either 'cognitive only', 'behavioural only' or 'CBT'. In the event that the review authors had differed in their judgements, a third review author would have acted as an arbiter.
We stratified studies into four comparisons:
-
CBT versus no intervention/waiting list control;
-
CBT versus usual audiological care (tinnitus education and rehabilitation for hearing loss);
-
CBT versus TRT (directive counselling and the use of bilateral sound generators as per TRT protocol);
-
CBT versus other experimental control (pooled if using the same experimental control). Other experimental controls may include transcranial magnetic stimulation, electrical or electromagnetic stimulation therapy and bio‐ neuro‐feedback.
Types of outcome measures
We analysed the following outcomes in the review, but did not use them as a basis for including or excluding studies.
Primary outcomes
-
Impact of tinnitus on quality of life as measured by validated tinnitus‐specific multi‐item questionnaires identified in a systematic review of outcome instruments used in studies of interventions for tinnitus (Hall 2016). These included:
-
Tinnitus Functional Index;
-
Tinnitus Handicap Inventory;
-
Tinnitus Handicap Questionnaire;
-
Tinnitus Questionnaire;
-
Tinnitus Reaction Questionnaire;
-
Tinnitus Disability Index;
-
Tinnitus Severity Scale.
-
For references associated with the outcome measures see Appendix 4).
If a study used multiple measures of the impact of tinnitus on quality of life we applied the following as a hierarchy of the outcome measures based on their known psychometric validity (Fackrell 2014): Tinnitus Functional Index, Tinnitus Handicap Inventory, Tinnitus Handicap Questionnaire, Tinnitus Questionnaire, Tinnitus Reaction Questionnaire, Tinnitus Disability Index, Tinnitus Severity Scale and then other tinnitus‐specific questionnaires. Invariably these questionnaires show good convergent validity.
-
Serious adverse effects: self‐harm, suicide, suicide attempt, suicidal crisis, severe symptom exacerbation.
Secondary outcomes
-
Generalised depression as measured by validated questionnaires, such as the Beck Depression Inventory II (Beck 1996), the depression scale of the Hospital Anxiety and Depression Scale (HADS; Zigmond 1983), and the Hamilton Rating Scale for Depression (Hamilton 1960).
-
Generalised anxiety as measured by a validated scale, for example, the anxiety scale of the HADS or Beck Anxiety Inventory (Beck 1988) or the Anxiety Sensitivity Index (Reiss 1986).
-
Health‐related quality of life as measured by a validated scale, for example, the Short‐Form 36 (Hays 1993), WHOQoL‐BREF (Skevington 2004), and other WHOQoL versions, Health Utilities Index (Furlong 2001).
-
Negatively biased interpretations of tinnitus as measured by a validated scale, such as the Tinnitus Catastrophizing Scale (Cima 2011b), the Fear of Tinnitus Questionnaire (Cima 2011b), and the Tinnitus Fear and Avoidance Scale (Kleinstauber 2013).
-
Other adverse effects: acute emotional discomfort.
We measured outcomes at treatment end (typically six to eight weeks) and at long‐term follow‐up (6 and 12 months).
Search methods for identification of studies
The Cochrane ENT Information Specialist conducted systematic searches for randomised controlled trials and controlled clinical trials. There were no language, publication year or publication status restrictions. The date of the search was 25 November 2019.
Electronic searches
The Information Specialist searched:
-
the Cochrane ENT Trials Register (searched 25 November 2019);
-
CENTRAL (2019, Issue 11) via the Cochrane Register of Studies (25 November 2019);
-
Epub Ahead of Print, In‐Process & Other Non‐Indexed Citations, Ovid MEDLINE(R) Daily and Ovid MEDLINE(R) 1946 to 25 November 2019);
-
Ovid EMBASE (1974 to 25 November 2019);
-
EBSCO CINAHL (1982 to 25 November 2019);
-
Ovid AMED (1985 to 25 November 2019);
-
Ovid PsycINFO (1806 to 25 November 2019);
-
Web of Knowledge, Core Collection (1945 to 25 November 2019);
-
ClinicalTrials.gov, (searched via the Cochrane Register of Studies 26 November 2019);
-
World Health Organization (WHO) International Clinical Trials Registry Platform (ICTRP), www.who.int/ictrp (searched via the Cochrane Register of Studies 26 November 2019).
In searches prior to November 2019, we also searched LILACS, KoreaMed, IndMed and PakMediNet to November 2018.
The Information Specialist modelled subject strategies for databases on the search strategy designed for CENTRAL. Where appropriate, they were combined with subject strategy adaptations of the highly sensitive search strategy designed by Cochrane for identifying randomised controlled trials and controlled clinical trials (as described in the Cochrane Handbook for Systematic Reviews of Interventions Version 5.1.0, Box 6.4.b. (Higgins 2011). Search strategies for major databases including CENTRAL are provided in Appendix 5.
Searching other resources
We scanned the reference lists of identified publications for additional studies and contacted study authors where necessary. In addition, the Information Specialist searched Ovid MEDLINE to retrieve existing systematic reviews relevant to this systematic review, so that we could scan their reference lists for additional studies. The Information Specialist also ran non‐systematic searches of Google Scholar to retrieve grey literature and other sources of potential studies.
Data collection and analysis
Selection of studies
Thomas Fuller (TF) and Rilana Cima (RC) independently screened titles and abstracts from the search results for eligible studies. When there were disagreements at the screening stage, we obtained copies of the full‐text articles and examined them closely for eligibility. For all disagreements over full‐text articles being assessed for inclusion, a third review author was consulted as an arbiter.
We recorded and presented the flow of study identification and selection in the form of a PRISMA flow chart (Moher 2009; Figure 1).

Process for sifting search results and selecting studies for inclusion
Data extraction and management
TF co‐ordinated the retrieval of full‐text articles as well as the management and extraction of all data. Two of TF, Derek Hoare (DH), RC or Birgit Mazurek (BM) independently extracted data from the included studies into standardised data forms based on a generic form developed by the Cochrane ENT editorial group. In the event that one of the review authors was the author of an included study he or she did not extract data from the study. Where relevant, the review authors copied and pasted verbatim text from included studies into the data extraction form. Any disagreements in the data extraction were initially addressed through discussion between the review authors involved. If that did not lead to agreement, a third review author was consulted as an arbiter. In the event of information not being reported in adequate detail to enable decisions about inclusion or exclusion, we contacted (or at least attempted multiple times to do so) study authors to request the provision of additional information.
Data extraction included information on the following: details of the source of participants, eligibility criteria, methods, participants, intervention treatment elements, outcome measures at baseline (or pre‐test) and other time points reported in the respective studies, results including estimates of effects and confidence intervals, details of the funding source, key conclusions from the authors, comments from the review authors especially with regard to any differences between protocols and study reports, details of any correspondence required and any references to other relevant studies. Further details of the data to be extracted for intervention reviews are specified in table 7.2 of the Cochrane Handbook for Systematic of Interventions (Higgins 2011).
At the completion of data collection and once there was agreement on the data set that had been extracted, we entered the data into Review Manager 5.3 (RevMan 2014).
Assessment of risk of bias in included studies
TF, BM, DH and RC completed assessment of the risk of bias of the included studies independently, with the following taken into consideration, as guided by theCochrane Handbook for Systematic Reviews of Interventions (Higgins 2011):
-
sequence generation;
-
allocation concealment;
-
blinding;
-
incomplete outcome data;
-
selective outcome reporting; and
-
other sources of bias.
We used the Cochrane 'Risk of bias' tool in RevMan 5.3 (RevMan 2014), which involved describing each of these domains as reported in the study and then assigning a judgement about the adequacy of each entry: 'low', 'high' or 'unclear' risk of bias. In the event of disagreement between assessors of risk of bias, we discussed the rationale for the respective judgements in an effort to resolve the differences. If that did not lead to agreement, a third review author acted as an arbiter.
Measures of treatment effect
We analysed ordinal data as if it were continuous data and used standardised mean differences (SMD) and Cohen's d effect size measurement to estimate treatment effects for measures of the impact of tinnitus on quality of life and other continuous measures of secondary outcomes. If feasible, we also pooled data from the same scale and used mean differences (MD).
We analysed dichotomous data using risk ratios (RR) and reported all results with 95% confidence intervals (95% CIs).
Unit of analysis issues
One study used a cluster‐randomised design so we chose statistical methods in consultation with a statistician and following the recommendations in the Cochrane Handbook for Systematic Reviews of Interventions to "extract an estimate of the required effect measure from an analysis that accounts for the cluster design" using an odds ratio with confidence interval or generalised estimating equations (Higgins 2011). Also as specified we used the inverse variance method to meta‐analyse effect estimates and standard errors so that the clustered nature of the data was taken into consideration (Higgins 2011).
We did not include any RCTs that used a cross‐over design. Had we done so, individual participant data constituting the unit of analysis from the first treatment phase would have been included in the meta‐analysis.
Dealing with missing data
Whenever possible we attempted to contact investigators to request missing data relating to, for example, study characteristics, outcome measures and how many patients dropped out or were included in the analysis. In relation to missing information about dropout or numbers included in the analysis, if we did not receive a response or data from the authors, we conducted the analysis using a conservative approach and assumed that the missing participants' data indicated no effect of/from the intervention. We undertook a sensitivity analysis to examine the effect of this assumption by comparing the results with what would happen if the missing participants had the best possible outcome.
In one study standard deviations were not reported for the Tinnitus Effects Questionnaire (TEQ) total score (Jakes 1992). It was not possible, from the information reported in Jakes 1992, to estimate the standard deviations, so we made a decision to use the standard deviation reported in Henry 1998a.
Where there were missing standard deviations for continuous data, we used methods to estimate these using confidence intervals, standard errors, t, P or F values where reported.
We report the attempts to contact authors for missing data and responses (or otherwise), along with consideration of the potential impact of the missing data, in the Discussion of the review.
Assessment of heterogeneity
We investigated clinical heterogeneity with regard to: components of the interventions, mode of delivery, level of action, who delivered the CBT and the type of intervention used in the control condition. We also assessed methodological heterogeneity according to study design and risk of bias (i.e. randomisation, blinding of outcome assessment, losses to follow‐up).
We assessed the degree of statistical heterogeneity that existed across studies using the I2 statistic and we used the following from the Cochrane Handbook for Systematic Reviews of Interventions as a guide for interpretation (Higgins 2011):
-
0% to 40%: might not be important;
-
30% to 60%: may represent moderate heterogeneity;
-
50% to 90%: may represent substantial heterogeneity;
-
75% to 100%: considerable heterogeneity.
Assessment of reporting biases
We examined reporting bias through the creation of funnel plots for the comparisons of CBT versus no intervention/wait list control and CBT versus any other active comparator.
Data synthesis
We conducted meta‐analyses using random‐effects models as we expected that there would be differences between the study populations and methods used. We conducted sensitivity analyses using fixed‐effect models.
We pooled studies where there was sufficient similarity between them with regard to: outcome (good convergent validity), level of action (i.e. individual or group therapy) and mode of delivery (i.e. in person, face‐to‐face or online).
We stratified studies into four comparisons:
-
CBT versus no intervention/waiting list control;
-
CBT versus usual audiological care (tinnitus education and rehabilitation for hearing loss);
-
CBT versus TRT (directive counselling and bilateral masking);
-
CBT versus other experimental control (pooled if using the same experimental control). Other experimental controls may include transcranial magnetic stimulation, electrical or electromagnetic stimulation therapy or bio‐ neuro‐feedback.
The intention was to pool the results of the CBT treatments. While CBT treatment protocols differed we judged them, within the particular sub‐types of CBT, to be similar enough to conduct meta‐analyses although there was significant statistical heterogeneity.
Subgroup analysis and investigation of heterogeneity
We conducted the following subgroup analyses for the primary outcome of the impact of tinnitus on quality of life:
-
Studies by types of therapy: 'cognitive only', 'behavioural only', 'cognitive and behavioural only', ACT, mindfulness.
-
Studies by modes of delivery: 'face‐to‐face' or 'online CBT'.
-
Studies by unit of delivery: 'individual patient therapy' or 'group therapy'.
-
Study or patient groups by who delivers CBT; 'psychologists' or 'psychiatrists' or 'audiologists' or other therapists or clinicians.
-
Studies by whether participants are included/excluded according to their hearing status: 'hearing loss was an exclusion criterion' or 'hearing loss was not an exclusion criterion'.
Sensitivity analysis
We conducted the following sensitivity analyses to examine the role of:
-
meta‐analysis using random‐effects and fixed‐effect models respectively;
-
including or excluding studies at high risk of bias for incomplete outcome data.
-
replacing missing data with a conservative compared with an 'optimistic' approach in the event that data within a particular study were not collected (or reported) at the end of treatment.
Summary of findings and assessment of the certainty of the evidence
We used the GRADE approach to rate the overall certainty of evidence. The certainty of evidence reflected the extent to which we were confident that an estimate of effect was correct and we applied this to the interpretation of results. There were four possible ratings: high, moderate, low, and very low. A rating of high certainty of evidence implied that we were confident in our estimate of effect and that further research is very unlikely to change our confidence in the estimate of effect. A rating of very low certainty implied that any estimate of effect obtained is very uncertain.
The GRADE approach rates evidence from RCTs that do not have serious limitations as high certainty. However, several factors can lead to the downgrading of the evidence to moderate, low, or very low. The degree of downgrading is determined by the seriousness of these factors:
-
study limitations (risk of bias);
-
inconsistency;
-
indirectness of evidence;
-
imprecision; and
-
publication bias.
'Summary of findings' tables for CBT compared with no intervention/waiting list control, usual audiological care, TRT and other control interventions are presented (summary of findings Table for the main comparison; summary of findings Table 2; summary of findings Table 3; summary of findings Table 4). The tables include the following outcomes: impact of tinnitus on quality of life, serious adverse effects, depression, anxiety, health‐related quality of life, negatively biased interpretations of tinnitus and other adverse effects.
Results
Description of studies
Results of the search
The Cochrane ENT Information Specialist conducted an electronic search of the literature in November 2019. A total of 3180 records were identified through this method, of which 1350 remained after duplicates were removed. We excluded 1148 references on the basis of title or abstract and retrieved a total of 102 records for full‐text review. We discarded 54 records and excluded 20 (10 because the allocation of participants was not randomised, nine because the interventions were not CBT and one because there was not a relevant comparator). See Characteristics of excluded studies for details. Five records were for ongoing studies (see Characteristics of ongoing studies). There are no studies awaiting assessment.
In total we included 28 studies in this review. Twenty‐two of these studies reported quantitative data, which were included in meta‐analyses (Abbott 2009; Andersson 2002; Andersson 2005; Arif 2017; Beukes 2018a; Beukes 2018b; Cima 2012; Davies 1995; Henry 1996; Hesser 2012; Jakes 1992; Jasper 2014; Kaldo 2007; Kreuzer 2012; Malinvaud 2016; McKenna 2017; Nyenhuis 2013a; Oron (unpublished); Philippot 2012a; Schmidt 2018; Weise 2016; Westin 2011). Six studies did not present usable data (Henry 1998; Jakes 1986; Lindberg 1989; Martz 2018; Robinson 2008; Zhong 2014).
No additional studies were identified through other search methods, which included contacting researchers and handsearching the references of included studies.
Figure 1 presents the study retrieval and selection process, and reasons for exclusion.
Included studies
We included 27 published studies and one unpublished study that is being prepared for publication (Oron (unpublished)). For descriptions of the studies, see the Characteristics of included studies table.
Design
Twenty‐seven studies were parallel‐group RCTs and one was a cluster‐RCT (Abbott 2009).
Three studies had multiple intervention/treatment arms (Jasper 2014; Hesser 2012; Martz 2018). Jasper 2014 was a three‐arm trial in which Internet‐based CBT (iCBT) and group‐CBT was compared with an Internet‐based discussion forum. Hesser 2012 was also a three‐arm trial but compared a CBT intervention with an ACT intervention and an online discussion forum condition respectively. Martz 2018 examined the efficacy of CBT, ACT, Coping Effectiveness Training and a wait list control condition.
Sample sizes
The total sample size for all included studies was 2733. Within studies the sample size ranged from 23 (Andersson 2005) to 492 (Cima 2012) participants.
Setting
Nine studies were set in hospitals. Two of these were in England (Davies 1995; McKenna 2017), two in Sweden (Lindberg 1989; Westin 2011), and one each in China (Zhong 2014), France (Malinvaud 2016), Israel (Oron (unpublished)), the Netherlands (Cima 2012), and Wales (Arif 2017). A total of five studies, in four countries, were conducted online (i.e. using Internet‐based interventions): two in Sweden (Andersson 2002; Hesser 2012), and one in Australia (Abbott 2009), England (Beukes 2018a), and Germany (Weise 2016) respectively. In one study the intervention (iCBT) was conducted online while the comparator, audiological treatment as usual was conducted in hospital settings (Beukes 2018b).
Three studies were conducted in Veterans Affairs clinics in the USA (Martz 2018; Robinson 2008; Schmidt 2018) and two studies were conducted in psychology clinics (one in Belgium (Philippot 2012a) and one in Sweden (Andersson 2005)). Nyenhuis 2013a conducted a study with four arms that included an online condition, a bibliotherapy condition and interventions delivered face‐to‐face in two "study centres" in the southern region of Lower Saxony, Germany. One study, set in Sweden, delivered the intervention primarily through bibliotherapy (Kaldo 2007). Two of three conditions in Jasper 2014 (set in Germany) were delivered as an Internet‐based intervention (i.e. iCBT and the control condition), while the setting for group CBT was not described. Five studies did not report the setting in which the studies were conducted; two were from Australia (Henry 1996; Henry 1998), two were from England (Jakes 1986; Jakes 1992), and one was from Germany (Kreuzer 2012).
Of the 28 included studies, six were from England, six from Sweden, four from Germany, three from the USA, three from Australia, and one each from Belgium, China, France, Israel, the Netherlands and Wales.
Participants
All studies included adult participants (18 years or over) with the mean age of participants ranging from 42.6 years to 70.1 years. Six studies limited the maximum age of participants: one limited it to 65 years (Abbott 2009); three to 70 years (Andersson 2002; Jakes 1986; Malinvaud 2016); one to 75 years (Nyenhuis 2013a); and one to 80 years (Kreuzer 2012). One study had a minimum age of 65 years (Andersson 2005). Eleven studies did not report inclusion or exclusion criteria related to age (Davies 1995; Henry 1996; Henry 1998; Jakes 1992; Jasper 2014; Lindberg 1989; Martz 2018; Oron (unpublished); Philippot 2012a; Robinson 2008; Zhong 2014).
Of all the participants in the included studies, 40.7% were female (n = 1106) and 58.1% were male (n = 1579). There were missing data on gender for 34 participants from five studies (Abbott 2009; Davies 1995; Henry 1996; Malinvaud 2016; Schmidt 2018), although one study accounted for approximately 44% of this (n = 15) (Davies 1995). Three of the 28 studies had a greater proportion of female than male participants (53.5%, 52.4% and 59.7% respectively) (Arif 2017; Jakes 1992; Weise 2016). The proportion of males in the included studies ranged from 28.9% (Davies 1995) to 82.1% (Abbott 2009).
The reported tinnitus duration ranged from a minimum average of 3.2 months (Nyenhuis 2013a) to a maximum average of 22.9 years (Schmidt 2018). A minimum tinnitus duration was not required/reported in nine studies (Arif 2017; Beukes 2018b; Cima 2012; Jakes 1986; Martz 2018; Oron (unpublished); Philippot 2012a; Robinson 2008; Zhong 2014), although three did require a referral and/or diagnosis from a medical professional such as an Ear, Nose and Throat surgeon or general practitioner (Beukes 2018b; Cima 2012; Philippot 2012a). Seven studies specified that participants had a diagnosis from a medical professional as part of their inclusion criteria (Abbott 2009; Andersson 2002; Henry 1996; Henry 1998; Hesser 2012; Kaldo 2007; Weise 2016).
Most studies (24 of the 28) stated or described in their inclusion criteria a level of tinnitus severity required to participate. Ten studies gave cut‐off scores on self‐report questionnaires as criteria indicating minimum levels of severity. Within this group, there was some variation on the specific cut‐off scores and questionnaires referred to. Specifically, Jasper 2014 required participants to have a minimum score of 18 on the THI, compared with others who required minimums of 20 (Schmidt 2018), 30 (Westin 2011) or 38 (Hesser 2012; Weise 2016). Jasper 2014 and Weise 2016 also specified additional cut‐off scores on the mini‐TQ (8 and 13 respectively) and Schmidt 2018 specified a minimum score of 17 on the TRQ, and 5 or more on the Tinnitus Impact Screening Interview. Three studies referred solely to a TRQ score, though there was also a difference in cut‐offs (Henry 1996; Henry 1998; Kaldo 2007); 10 or more for Kaldo 2007, and 17 or more for Henry 1996 and Henry 1998. Martz 2018 required prospective participants to have a minimum score of 21 and Beukes 2018a required participants to have a minimum of 25 on the Tinnitus Functional Index (TFI). Descriptions and/or indicators of tinnitus severity referred to in other studies included for example: "primary complaint of tinnitus" (e.g. Cima 2012), "self‐reported distress due to tinnitus" (Robinson 2008), and "significant psychological distress and impairment in everyday activities resulting from tinnitus" (Philippot 2012a).
One study excluded participants with severe hearing loss due to the impact this could have on the use of wearable sound generators (Westin 2011), but otherwise hearing loss was not applied as an exclusion criterion for participating in the studies.
In relation to co‐morbid psychological conditions, 16 studies included measures of anxiety and 23 included measures of depression. However, only three studies specifically referred to anxiety or depression in their inclusion or exclusion criteria (Andersson 2005; Kaldo 2007; Weise 2016). Kaldo 2007 specified that participants must have scores lower than 19 on both the anxiety and depression subscales of the Hospital Anxiety and Depression Scale. Andersson 2005 included people with scores lower than 22 on the Beck Depression Inventory, and Weise 2016 included those without a "clinical diagnosis of depression". It was, however, more common (15 out of 28 studies) that descriptive criteria about psychopathology were used to exclude potential participants. For example, criteria would refer to prospective participants with/without the presence/absence of a major psychiatric condition or disorder (Beukes 2018a; Davies 1995; Jakes 1992). Five studies also specified high risk of suicide in their exclusion criteria (Andersson 2005; Hesser 2012; Jasper 2014; McKenna 2017; Weise 2016). Other specific psychological conditions referred to in participant selection criteria included substance use disorders (McKenna 2017; Schmidt 2018; Weise 2016), psychosis (Robinson 2008; Schmidt 2018), and personality disorders (Philippot 2012a).
Interventions and comparisons
Cognitive, behavioural, ACT, mindfulness, and cognitive and behavioural (combined) interventions were considered as 'CBT' and thus eligible for inclusion in this review. (Note that in the following description of the studies, some had more than one CBT and/or control arm within the study, and thus the total number of comparisons does not equal 28). Seventeen studies tested CBT (Abbott 2009; Andersson 2002; Andersson 2005; Beukes 2018a; Beukes 2018b; Cima 2012; Jasper 2014; Kaldo 2007; Lindberg 1989; Malinvaud 2016; Martz 2018; Nyenhuis 2013a; Robinson 2008; Schmidt 2018; Zhong 2014); five tested cognitive interventions (Davies 1995; Henry 1996; Henry 1998; Jakes 1986; Jakes 1992), four tested ACT (Hesser 2012; Martz 2018; Oron (unpublished); Westin 2011), and four tested mindfulness interventions. Within the mindfulness interventions, two tested mindfulness meditation (Arif 2017; Kreuzer 2012), one tested a mindfulness‐based stress reduction (Philippot 2012a), and one tested a mindfulness‐based cognitive therapy intervention (McKenna 2017). No studies tested purely behavioural interventions.
The most common mode by which interventions were delivered was face‐to‐face. Twenty‐one studies delivered CBT face‐to‐face (Andersson 2005; Arif 2017; Cima 2012; Davies 1995; Henry 1996; Henry 1998; Jakes 1986; Jakes 1992; Jasper 2014; Kreuzer 2012; Lindberg 1989; Malinvaud 2016; Martz 2018; McKenna 2017; Nyenhuis 2013a; Oron (unpublished); Philippot 2012a; Robinson 2008; Schmidt 2018; Westin 2011; Zhong 2014), six delivered CBT in the form of an Internet‐based intervention (Abbott 2009; Andersson 2002; Beukes 2018a; Beukes 2018b; Hesser 2012; Weise 2016), and one multi‐arm study included an Internet‐based and face‐to‐face CBT condition (Jasper 2014). Kaldo 2007 compared CBT delivered as bibliotherapy with email contact with a wait list control condition. Seventeen studies delivered CBT in a group format (Andersson 2005; Cima 2012; Henry 1996; Henry 1998; Jakes 1986; Jakes 1992; Jasper 2014; Kreuzer 2012; Lindberg 1989; Malinvaud 2016; Martz 2018; McKenna 2017; Nyenhuis 2013a; Oron (unpublished); Philippot 2012a; Robinson 2008; Schmidt 2018; Zhong 2014), 10 studies delivered CBT individually (Abbott 2009; Andersson 2002; Arif 2017; Beukes 2018a; Beukes 2018b; Davies 1995; Jakes 1986; Kaldo 2007; Weise 2016; Westin 2011), and one study included an individual and group CBT condition (Jasper 2014).
Professions involved in delivering interventions included psychologists (Abbott 2009; Andersson 2005; Davies 1995; Henry 1996; Hesser 2012; Jasper 2014; Kaldo 2007; Lindberg 1989; Malinvaud 2016; Martz 2018; McKenna 2017; Nyenhuis 2013a; Philippot 2012a; Robinson 2008; Schmidt 2018; Weise 2016; Westin 2011), and audiologists (Beukes 2018a; Beukes 2018b). In one study a multidisciplinary team delivered CBT (Cima 2012), and in another psychologists and psychiatrists delivered the intervention (Robinson 2008). Three studies described the people delivering the interventions as "therapists" without providing details of qualifications (Arif 2017; Jakes 1992; Kreuzer 2012), and four studies did not report any information about who delivered the intervention (Henry 1998; Jakes 1986; Oron (unpublished); Zhong 2014).
CBT versus no intervention/waiting list control
Fourteen studies compared CBT to wait list control conditions (Andersson 2002; Andersson 2005; Beukes 2018a; Henry 1996; Henry 1998; Jakes 1992; Kaldo 2007; Kreuzer 2012; Lindberg 1989; Malinvaud 2016; Martz 2018; Oron (unpublished); Robinson 2008; Westin 2011). The duration of the waiting list control period ranged from 3 (Lindberg 1989) to 22 (Kreuzer 2012) weeks, with the median being 6 weeks, and the average waiting period being 8.1 weeks. In all studies, participants were offered the CBT intervention at the end of the waiting period.
CBT versus usual audiological care (tinnitus education and rehabilitation for hearing loss)
Three studies compared CBT to audiological care (Beukes 2018b; Cima 2012; Schmidt 2018). Beukes 2018b compared an individually delivered, eight‐week iCBT (with optional email contact with an audiologist) intervention to audiological care as usually delivered in the UK; that is, three 60‐minute appointments, and two follow‐up appointments at one and two months respectively. In Cima 2012, the CBT intervention was delivered face‐to‐face, according to a stepped‐care model where those requiring greater assistance received a greater number of sessions. The audiological care condition in Cima 2012 was based on the results from a survey of audiologists asking what care they provided to patients with tinnitus, as at the time there was no standardised audiological care for tinnitus in the Netherlands. The audiological care in Cima 2012 also comprised a stepped‐care approach where patients first had audiological tests and education in step 1, and then if needed in step 2, up to nine sessions with a social worker. Schmidt 2018 tested a six‐week face‐to‐face group CBT intervention developed specifically for veterans of military service. Audiological care was also delivered in groups over six weeks, and included tinnitus education and attentional skills training (Schmidt 2018).
CBT versus tinnitus retraining therapy
One study compared CBT to TRT and a wait list control condition (Westin 2011). The CBT intervention comprised Acceptance and Commitment Therapy (ACT) delivered individually over the course of 10 weeks in 60‐ to 75‐minute sessions. TRT involved a 2.5‐hour consultation with an ENT physician which included a diagnostic assessment, and directive counselling. Participants in the TRT condition were also fitted with bilateral sound generators (as per TRT protocol) and instructed to use them for a minimum of eight hours per day over an 18‐month period.
CBT versus other active control
Sixteen studies compared CBT to an active experimental control group not otherwise included in the previous comparisons (Abbott 2009; Arif 2017; Davies 1995; Henry 1996; Hesser 2012; Jakes 1986; Jakes 1992; Jasper 2014; Malinvaud 2016; Martz 2018; McKenna 2017; Nyenhuis 2013a; Oron (unpublished); Philippot 2012a; Weise 2016; Zhong 2014).
The CBT interventions included: CBT (Abbott 2009; Jakes 1986; Jasper 2014; Malinvaud 2016; Martz 2018; Nyenhuis 2013a; Weise 2016; Zhong 2014), cognitive therapy (Davies 1995; Henry 1998; Jakes 1992), ACT (Hesser 2012; Martz 2018; Oron (unpublished), and mindfulness (Arif 2017; McKenna 2017; Philippot 2012a). Eleven CBT interventions were delivered face‐to‐face (Arif 2017; Davies 1995; Henry 1996; Jakes 1986; Jakes 1992; Malinvaud 2016; Martz 2018; McKenna 2017;Nyenhuis 2013a; Oron (unpublished); Zhong 2014), and three were delivered as Internet‐based interventions (Abbott 2009; Hesser 2012; Weise 2016). Jasper 2014 included a group CBT and iCBT arm in addition to a control condition.
CBT was provided individually in five studies (Abbott 2009; Arif 2017; Davies 1995; Hesser 2012; Weise 2016), in groups in nine studies (Henry 1996; Jakes 1986; Jakes 1992; Malinvaud 2016; Martz 2018; McKenna 2017; Nyenhuis 2013a; Oron (unpublished); Philippot 2012a), and both individually and in groups in Jasper 2014. In one study, no information was reported to indicate whether participants engaged in treatment individually or in groups (Zhong 2014).
In nine studies psychologists delivered CBT (Davies 1995; Henry 1996; Jakes 1986; Jasper 2014; Malinvaud 2016; Martz 2018; McKenna 2017; Nyenhuis 2013a; Philippot 2012a), four studies tested guided Internet‐based interventions by psychologists who were available via email to answer questions and provide feedback (Abbott 2009; Hesser 2012; Jasper 2014; Weise 2016), and two studies reported that "therapists" delivered the intervention but did not provide further information on their qualifications or experience (Arif 2017; Jakes 1992). One study, Zhong 2014, did not report what professional delivered the CBT.
Other experimental control interventions included:
-
Relaxation (Arif 2017; Davies 1995; Jakes 1986; McKenna 2017; Philippot 2012a). The types of relaxation used as active control conditions included: applied relaxation based on the work of Bernstein 1973 (Jakes 1986), Bernstein 1984 (Davies 1995), Jacobson 1957 (Philippot 2012a), and Ost 1987 (Arif 2017; McKenna 2017), respectively. In each of these studies, the same people who delivered the CBT delivered the relaxation therapy.
-
Provision of information about tinnitus and hearing (Abbott 2009; Henry 1996; Nyenhuis 2013a). This included information about tinnitus and its causes, the auditory system, audiological assessment and available treatments. Information about tinnitus was provided by: a clinical psychologist (Henry 1996), an 11‐page booklet (Nyenhuis 2013a), and computer/Internet with the support of brief contact from a psychologist to provide new passwords to access new information support regarding their tinnitus coping.
-
Internet‐based discussion forums (Hesser 2012; Jasper 2014; Weise 2016). The discussion forums were moderated by clinical psychology students (Hesser 2012; Jasper 2014; Weise 2016), licensed CBT therapists (Weise 2016) or licensed psychologists (Hesser 2012). New topics of discussion, such as "representations of tinnitus in the media" (Weise 2016) were presented on a weekly basis in addition to participants being able to initiate topics in each of the respective studies.
-
Coping effectiveness training (Martz 2018; Oron (unpublished)) aimed to increase understanding of stress and coping with tinnitus, and how to better learn how to match appropriate coping strategies to situations. The intervention content was delivered in English by psychologists or counsellors (Martz 2018), and in Hebrew (Oron (unpublished)) ‐ no information available about the presenters).
-
Masking (Jakes 1992; Zhong 2014). Jakes 1992 used a standard masker device supplied by A and M Hearing Aids Ltd and instructed participants to turn the masker volume up so that they could not hear the tinnitus. Jakes 1992 also included a condition with a placebo masking device that was the same as in the masking condition, but the volume control of the masker was glued into place at the participant's threshold. Zhong 2014 used an MP3 player (no further details provided) as a masking device and participants were instructed to use it one to three times a day, for 15 to 20 minutes each time.
-
Virtual reality was delivered in two steps; the first of which included information about tinnitus, treatment and short breathing and relaxation techniques (Malinvaud 2016). The second step where participants entered into a virtual world and were able to control a tinnitus avatar took place under the direction of an ENT physician over eight once‐weekly sessions. During a session (one‐hour duration) participants were asked to navigate through three environments in which they could choose to displace, mask or unmask sounds as they wished (Malinvaud 2016).
-
Self‐help.Nyenhuis 2013a included two self‐help conditions which varied only in the mode of delivery, i.e. via bibliotherapy or Internet. The content of these conditions was adapted from Tinnitus Coping Training (Kröner‐Herwig 1997; Kröner‐Herwig 2003). (See also Characteristics of included studies).
Five studies also included a wait list control condition in addition to an active control group (Henry 1996; Jakes 1992; Malinvaud 2016; Martz 2018; Oron (unpublished).
Outcomes
Primary outcomes
Impact of tinnitus on quality of life
Twenty‐six of the 28 studies reported changes in the impact of tinnitus on quality of life as measured by scores on a multi‐item questionnaire. Fourteen studies used a single multi‐item questionnaire (Abbott 2009; Andersson 2002; Andersson 2005; Arif 2017; Beukes 2018a; Davies 1995; Hesser 2012; Jakes 1986; Jakes 1992; Nyenhuis 2013a; Oron (unpublished); Philippot 2012a; Westin 2011; Zhong 2014), nine studies used two multi‐item questionnaires (Beukes 2018b; Cima 2012; Jasper 2014; Kaldo 2007; Kreuzer 2012; Malinvaud 2016; McKenna 2017; Schmidt 2018; Weise 2016), two studies used three multi‐item questionnaires (Henry 1996; Henry 1998), and one study used four multi‐item questionnaires (Robinson 2008).
Of the 14 studies that used one multi‐item questionnaire, four used the Tinnitus Handicap Inventory (THI; Newman 1996) (Hesser 2012; Oron (unpublished); Westin 2011; Zhong 2014), four used the Tinnitus Reaction Questionnaire (TRQ; Wilson 1991) (Abbott 2009; Andersson 2002; Andersson 2005; Arif 2017), three used the Tinnitus Effects Questionnaire‐Emotional Distress scale (TEQ‐ED; Hallam 1988) (Davies 1995; Jakes 1986; Jakes 1992), one used the Tinnitus Functional Index (TFI; Meikle 2012) (Beukes 2018a), one used the Tinnitus Questionnaire (TQ; Hallam 1988; Hallam 2008) (Nyenhuis 2013a), and one used the Tinnitus Psychological Impact Questionnaire (QIPA) (Philippot 2012a). (See explanatory note in Characteristics of included studies, Philippot 2012a regarding the QIPA).
Of the nine studies that used two questionnaires, Beukes 2018b used the TFI and THI; Jasper 2014 and Weise 2016 both used the THI and mini‐TQ, Malinvaud 2016 used the THI and THQ; Schmidt 2018 and Kaldo 2007 used the THI and TRQ; Kreuzer 2012 and Cima 2012 used the THI and TQ; and, McKenna 2017 used the TFI and TQ. Henry 1996 and Henry 1998 both used the same three questionnaires (TRQ, THQ, TEQ‐ED) and Robinson 2008 used four multi‐item questionnaires (THQ, TRQ, THI, TQ).
In this review we measured outcome at treatment end, and at six‐ and 12‐month follow‐up. Three studies reported follow‐up data at six months (Jasper 2014; McKenna 2017; Weise 2016), and six studies reported data at 12 months follow‐up (Andersson 2002; Henry 1996; Hesser 2012; Kaldo 2007; Robinson 2008; Weise 2016). However, only McKenna 2017 and Henry 1996 reported data from active comparator groups that could be considered. Other studies used wait list control groups and subsequently gave those participants CBT. The time points at which follow‐up data were collected in other studies included two weeks (Kreuzer 2012), one month (Davies 1995; Jakes 1986; Martz 2018; McKenna 2017; Zhong 2014), two months (Beukes 2018a; Beukes 2018b; Robinson 2008; Schmidt 2018), three months (Andersson 2005; Jakes 1992; Malinvaud 2016; Philippot 2012a), four months (Cima 2012; Davies 1995; Henry 1996; Jakes 1986; Robinson 2008; Zhong 2014), 4.5 months (Westin 2011), eight months (Henry 1996), nine months (Nyenhuis 2013a), and 16 months (Westin 2011). Four studies did not collect follow‐up data (Abbott 2009; Arif 2017; Lindberg 1989; Oron (unpublished)).
Serious adverse effects
Eleven of the 28 studies provided information about the incidence of serious adverse effects. Seven studies reported, or we were informed by the authors via personal communication, that there were no serious adverse effects associated with CBT (Andersson 2002; Andersson 2005; Beukes 2018b; Cima 2012; Kaldo 2007; Malinvaud 2016; Oron (unpublished)). Four studies reported some serious adverse effects (mostly symptom deterioration) in a small number of participants (Beukes 2018a; Nyenhuis 2013a; Weise 2016; Westin 2011). Information about the presence of serious adverse effects was available at the end of treatment (Beukes 2018a; Nyenhuis 2013a; Westin 2011), six‐month follow‐up (Westin 2011) and 12‐month follow‐up (Beukes 2018a as reported in Beukes 2018c).
Secondary outcomes
Depression
Depression was measured with multi‐item questionnaires in 22 studies. It was measured with the Hospital Anxiety and Depression Scale‐Depression subscale (HADS‐D; Zigmond 1983) in 11 studies (Andersson 2002; Andersson 2005; Arif 2017; Cima 2012; Hesser 2012; Jasper 2014; Kaldo 2007; Malinvaud 2016; McKenna 2017; Weise 2016; Westin 2011), the Beck Depression Inventory (BDI; Beck 1996) in five studies (Davies 1995; Henry 1996; Henry 1998; Kreuzer 2012; Philippot 2012a), the Patient Health Questionnaire‐9 (PHQ‐9; Kroenke 2001) in three studies (Beukes 2018a; Beukes 2018b; Nyenhuis 2013a), the Depression Anxiety and Stress Scale‐Depression subscale (DASS‐D; Lovibond 1995) in one study (Abbott 2009), and the Hamilton Rating Scale for Depression (HRSD; Hamilton 1960) in one study (Jakes 1986). One study used both the HRSD and the BDI to measure depression (Robinson 2008).
Anxiety
Anxiety was measured with multi‐item questionnaires in 16 studies. It was measured with the Hospital Anxiety and Depression Scale‐Anxiety subscale (HADS‐A; Zigmond 1983) in nine studies (Arif 2017; Cima 2012; Hesser 2012; Jasper 2014; Kaldo 2007; Malinvaud 2016; McKenna 2017; Weise 2016; Westin 2011); the Generalised Anxiety Disorder‐7 scale (GAD‐7; Spitzer 2006) in two studies (Beukes 2018a; Beukes 2018b); the State Trait Anxiety Inventory (STAI; Spielberger 1983) in two studies (Davies 1995; Philippot 2012a); and the Depression Anxiety and Stress Scale‐Anxiety subscale (DASS‐A; Lovibond 1995) in one study (Abbott 2009). Two studies used both the HADS‐A and Anxiety Sensitivity Index (ASI; Reiss 1986) to assess anxiety (Andersson 2002; Andersson 2005).
Quality of life
Seven studies assessed change in quality of life. Quality of life was assessed with multi‐item questionnaires that included the Satisfaction with Life Survey (SWLS; Diener 1985) in two studies (Beukes 2018a; Beukes 2018b); the Quality of Life Inventory (QOLI; Frisch 1992) in two studies (Hesser 2012; Westin 2011); the Health Utilities Index (HUI; Furlong 2001) in one study (Cima 2012); the Quality of Well‐being Scale (Kaplan 1996) in one study (Robinson 2008); and the WHOQoL (Skevington 2004) in one study (Abbott 2009).
Negative biased interpretations of tinnitus
Biased interpretations of tinnitus were measured with multi‐item questionnaires in 10 studies. The Tinnitus Acceptance Questionnaire (TAQ; Weise 2013) was used in five studies (Hesser 2012; Jasper 2014; McKenna 2017; Weise 2016; Westin 2011); the Tinnitus Effects Questionnaire‐Irrational Beliefs subscale (TEQ‐IB; Hallam 1988) in four studies (Davies 1995; Jakes 1992; Henry 1996; Henry 1998); and the Tinnitus Cognitions Questionnaire (TCQ; Wilson 1998) in two studies (Henry 1996; Henry 1998). Cima 2012 used the Tinnitus Catastrophizing Scale (TCS; Cima 2011b) and Fear of Tinnitus Questionnaire (FTQ; Cima 2011b), and McKenna 2017 used the TAQ (Weise 2013), TCS (Cima 2011b), and Tinnitus‐Fear and Avoidance Scale (T‐FAS; Kleinstauber 2013).
Other adverse effects
Only one study reported some 'other' adverse effects (Weise 2016). These adverse effects occurred at 12 months follow‐up and referred to some "slight deterioration in sleep quality". (Note: there were no long‐term comparator data available as the online discussion comparator group had received CBT by that time).
Non‐relevant outcomes
Two studies did not use any outcomes that were relevant to this review (Lindberg 1989; Martz 2018). Lindberg 1989 reported results from visual analogue scales that were used on a daily basis for one week to measure subjective loudness, discomfort from tinnitus and ability to control the discomfort from tinnitus. Martz 2018 reported results from the Brief COPE scale (Carver 1997), a 28‐item version of the COPE inventory (Carver 1989) measuring what techniques, strategies or supports people use to manage challenging situations or experiences. Martz 2018 specifically reported results for three subscales: "engagement coping", which includes, for example, positive re‐framing, self‐distraction and use of humour, "disengagement coping", which includes, denial, behavioural disengagement and self‐blame, and "social support coping", which includes instrumental support, emotional support, venting and religion.
Excluded studies
From the full‐text screening we excluded 15 studies. The main reasons for excluding studies were: non‐random allocation of participants (six studies); wrong intervention (six studies); secondary analyses of data (two studies); and no appropriate comparator included (one study). A list of studies and the specific reason for exclusion is in the Characteristics of excluded studies table.
Ongoing studies
We identified five ongoing studies in our search results (NCT03022084; NCT03386123; NCT04004260; NTR6415; SLCTR/2018/005), which are reported in the Characteristics of ongoing studies table.
Risk of bias in included studies
A graph showing a summary of the 'Risk of bias' assessments is shown in Figure 2 and the review authors' judgements for each included study are shown in Figure 3.
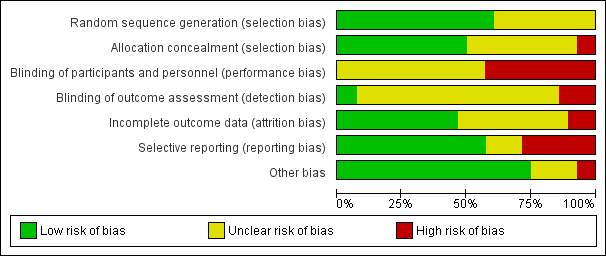
'Risk of bias' graph: review authors' judgements about each risk of bias item presented as percentages across all included studies.
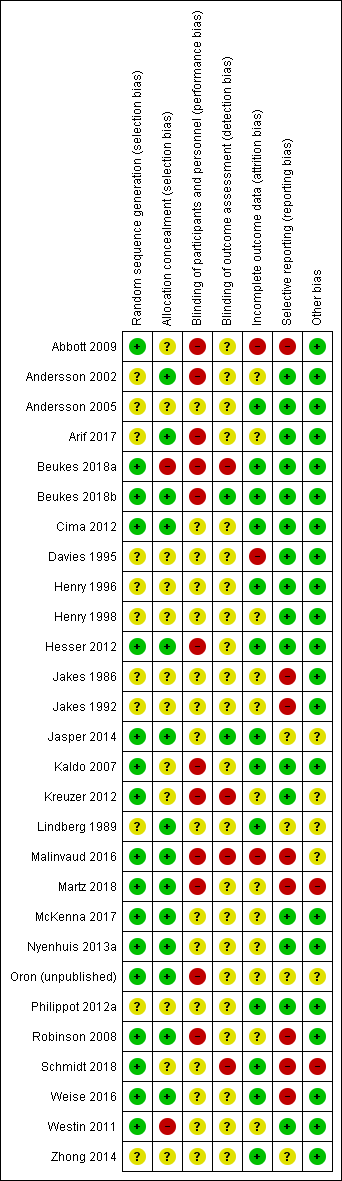
'Risk of bias' summary: review authors' judgements about each risk of bias item for each included study.
Allocation
Random sequence generation
We rated 17 included studies as having low risk of bias because they clearly described or information was received from corresponding authors to confirm an adequate random sequence generation process had been used (Abbott 2009; Beukes 2018a; Beukes 2018b; Cima 2012; Hesser 2012; Jasper 2014; Kaldo 2007; Kreuzer 2012; Malinvaud 2016; Martz 2018; McKenna 2017; Nyenhuis 2013a; Oron (unpublished); Robinson 2008; Schmidt 2018; Weise 2016; Westin 2011). Methods of random sequence generation included Internet‐based randomisation systems (e.g. www.random.org, www.randomization.com), coin tossing, computer‐generated random number sequences and block randomisation, and drawing numbers from a hat. We rated the remaining 11 studies as having an 'unclear' risk of bias as they did not describe their random sequence generation methods (Andersson 2002; Andersson 2005; Arif 2017; Davies 1995; Henry 1996; Henry 1998; Jakes 1986; Jakes 1992; Lindberg 1989; Philippot 2012a; Zhong 2014).
Allocation concealment
We rated half the included studies as having a low risk of bias for allocation concealment as it was performed by staff independent of the research team, or was conducted centrally (Andersson 2002; Arif 2017; Beukes 2018b; Cima 2012; Hesser 2012; Jasper 2014; Lindberg 1989; Malinvaud 2016; Martz 2018; McKenna 2017; Nyenhuis 2013a; Oron (unpublished); Robinson 2008; Weise 2016). We rated two studies as being at high risk of bias because there was no allocation concealment (Beukes 2018a; Westin 2011). In the remaining 12 studies, allocation concealment was not described and so we rated those studies as having unclear risk of bias (Abbott 2009; Andersson 2005; Davies 1995; Henry 1996; Henry 1998; Jakes 1986; Jakes 1992; Kaldo 2007; Kreuzer 2012; Philippot 2012a; Schmidt 2018; Zhong 2014).
Blinding
Blinding of participants and personnel
We judged 12 studies to be at high risk of bias (Abbott 2009; Andersson 2002; Arif 2017; Beukes 2018a; Beukes 2018b; Hesser 2012; Kaldo 2007; Kreuzer 2012; Malinvaud 2016; Martz 2018; Oron (unpublished); Robinson 2008), and the remaining 16 to be at unclear risk of bias in relation to blinding of participants and personnel (Andersson 2005; Cima 2012; Davies 1995; Henry 1996; Henry 1998; Jakes 1986; Jakes 1992; Jasper 2014; Lindberg 1989; McKenna 2017; Nyenhuis 2013a; Philippot 2012a; Schmidt 2018; Weise 2016; Westin 2011; Zhong 2014). Although CBT itself is not possible to 'mask', we judged there to be a high risk where there was a clear difference between the intervention and comparison group. Specifically, we judged there to be a high risk when there was a wait list control (e.g. Andersson 2002), when an information only control was used (e.g. Abbott 2009), and when participants were explicitly informed of the differences between groups/interventions that they could be allocated to (e.g. Arif 2017). In other scenarios, for example, where participants might not know the difference between the intervention and control, and/or if the content of the alterative treatment was masked, we rated the risk of bias as unclear (e.g. Cima 2012).
Blinding of outcome assessment
We rated two studies as having a low risk of bias (Beukes 2018b; Jasper 2014) and four studies as having a high risk of bias with regard to the likely impact that unblinded outcome assessment had on the study results (Beukes 2018a; Kreuzer 2012; Malinvaud 2016; Schmidt 2018). We rated Beukes 2018b as low risk of bias as the data analysts were blinded to group allocation. Jasper 2014 specifically investigated the perceived expectations and credibility of the intervention (iCBT) and control (online discussion forum), and concluded that there was no effect of these on the results. The four studies rated as high risk of bias due to lack of blinding all reported that outcome assessors were not blinded. The remaining 22 studies did not report sufficient detail to judge whether outcome assessors were blinded and so we rated them as having unclear risk of detection bias.
Incomplete outcome data
We rated three studies as having a high risk (Abbott 2009; Davies 1995; Malinvaud 2016), 12 an unclear risk (Andersson 2002; Arif 2017; Henry 1998; Jakes 1986; Jakes 1992; Kreuzer 2012; Martz 2018; McKenna 2017; Nyenhuis 2013a; Oron (unpublished); Robinson 2008; Westin 2011), and 13 a low risk of attrition bias (Andersson 2005; Beukes 2018a; Beukes 2018b; Cima 2012; Henry 1996; Hesser 2012; Jasper 2014; Kaldo 2007; Lindberg 1989; Philippot 2012a; Schmidt 2018; Weise 2016; Zhong 2014).
Abbott 2009 reported a high level of attrition, most of which was unexplained, and replaced missing data with the last (observed) outcome carried forward. Davies 1995 reported differing levels of attrition across groups and concluded from this that the "differential attrition to some extent invalidates the group comparison". Malinvaud 2016 reported that different reasons were given by participants for dropout depending on the group they were allocated to, and missing data appear to be related to treatment outcome. Hence we also rated this study as having a high risk of attrition bias.
Selective reporting
We judged eight studies to be at high risk of reporting bias. These included studies with discrepancies between what was reported in the protocol or methods and what was published in the results (Abbott 2009; Jakes 1992; Malinvaud 2016; Martz 2018; Robinson 2008; Weise 2016). For example, Schmidt 2018 specified a primary outcome in the study protocol but did not report it as such in the publication, and additional outcomes not identified in protocol were reported in the publication. Three studies did not report enough information to judge the risk of reporting bias (Jasper 2014; Lindberg 1989; Zhong 2014), and one is currently being prepared for publication and hence we judged it as at unclear risk (Oron (unpublished)). We rated all other studies as low risk, having either fully reported what was specified in their respective methods sections, and/or reported everything as specified in a published protocol or trial registration (Arif 2017Beukes 2018b; Cima 2012; Davies 1995; Henry 1996; Henry 1998; Hesser 2012; Kaldo 2007; Kreuzer 2012; McKenna 2017; Nyenhuis 2013a; Philippot 2012a; Westin 2011).
Other potential sources of bias
We judged two studies to be at risk of other biases. Martz 2018 did not explain why the initial anticipated sample size estimate was 80 but only 40 participants were included in the final publication, or why ACT was added as an intervention arm one year after initial trial registration. In Schmidt 2018 there were additional discrepancies between the protocol and publication, e.g. the protocol included a "no‐intervention/standard care condition" but this was not reported in the publication of the study.
Four studies received an unclear rating for various reasons. In Jasper 2014 the inclusion criteria differed between the protocol (mini TQ score over 12) and study publications (mini TQ score over 8). In Kreuzer 2012 the long waiting time could lead to increased spontaneous improvements in the control group. Lindberg 1989 reported no scientific input from funders, but no protocol was available to inform our judgement. In Malinvaud 2016 there were some deviations from the protocol with an unknown effect on the outcomes of the study. Oron (unpublished) is not yet published. We judged all other studies as having a low risk of other biases.
Effects of interventions
See: Summary of findings for the main comparison CBT compared to no intervention/waiting list control for tinnitus; Summary of findings 2 CBT compared to audiological care (tinnitus education and rehabilitation for hearing loss) for tinnitus; Summary of findings 3 CBT compared to TRT (directive counselling and bilateral masking) for tinnitus; Summary of findings 4 CBT compared to other experimental control for tinnitus
Comparison 1: Cognitive behavioural therapy (CBT) versus no intervention/wait list control
Primary outcomes
1.1 Impact of tinnitus on quality of life
1.1.1 End of treatment
Ten studies reported data on the impact of tinnitus on quality of life at the end of treatment using validated multi‐item questionnaires (Andersson 2002; Andersson 2005; Beukes 2018a; Henry 1996; Jakes 1992; Kaldo 2007; Kreuzer 2012; Malinvaud 2016; Oron (unpublished); Westin 2011). (Note: Post‐treatment data from Malinvaud 2016 were not available and so, in accordance with a conservative approach, we entered baseline data showing no difference between the groups. This note applies to all analyses where Malinvaud 2016 is included). Overall, there was a clear difference in favour of CBT indicating that it may lead to a reduction in the impact of tinnitus on quality of life (standardised mean difference (SMD) ‐0.56, 95% confidence interval (CI) ‐0.83 to ‐0.30; 10 studies; 537 participants; Analysis 1.1). Re‐expressed as a score on the Tinnitus Handicap Inventory (THI; range 0 to 100) this is equivalent to a score 10.91 points lower in the CBT group, with an estimated minimal clinically important difference (MCID) for this scale being 7 points. A moderate level of heterogeneity was present (Tau² = 0.08; Chi² = 17.62, df = 9 (P = 0.04); I² = 49%). The forest plot illustrating this result is shown in Figure 4 and it is reported in summary of findings Table for the main comparison as a finding of importance. We rated the certainty of the evidence as low.

Forest plot of comparison: 1 CBT versus no intervention/waiting list control, outcome: 1.1 Impact of tinnitus on quality of life at end of treatment.
Subgroup analyses examining the type of therapy compared to wait list control indicated that there no statistically significant differences between the types of therapy, and that heterogeneity might not be important (Chi² = 1.80, df = 3 (P = 0.61), I² = 0%; Analysis 1.7): six studies used CBT (Andersson 2002; Andersson 2005; Beukes 2018a; Jakes 1992; Kaldo 2007; Malinvaud 2016), two used acceptance and commitment therapy (ACT) (Oron (unpublished); Westin 2011), one used cognitive therapy (Henry 1996), and one used mindfulness (Kreuzer 2012).
Subgroup analyses examining the mode of delivery (bibliotherapy, face‐to‐face and Internet‐based) indicated that there were no significant differences between the modes of delivery, and that heterogeneity might not be important (Chi² = 0.69, df = 2 (P = 0.71), I² = 0%; Analysis 1.9). Seven of the studies in this analysis delivered therapy face‐to‐face (Andersson 2005; Henry 1996; Jakes 1992; Kreuzer 2012; Malinvaud 2016; Oron (unpublished); Westin 2011), two via Internet interventions (Andersson 2002; Beukes 2018a), and one by bibliotherapy (Kaldo 2007).
When the unit of delivery was examined (i.e. individual compared with group), the subgroup analyses detected no significant differences and indicated that heterogeneity might not be a problem (Chi² = 0.01, df = 1 (P = 0.94), I² = 0%; Analysis 1.11): six studies delivered treatment in groups (Andersson 2005; Henry 1996; Jakes 1992; Kreuzer 2012; Malinvaud 2016; Oron (unpublished)), and four delivered it individually (Andersson 2002; Beukes 2018a; Kaldo 2007; Westin 2011).
Subgroup analyses by who delivered CBT (i.e. psychologists, "other clinician", computer, bibliotherapy) indicated no difference, and that heterogeneity might not be a problem (Chi² = 1.65, df = 3 (P = 0.65), I² = 0%; Analysis 1.13): four studies reported that psychologists delivered treatment (Henry 1996; Malinvaud 2016; Oron (unpublished); Westin 2011), three employed "other clinicians" (Andersson 2005; Jakes 1992; Kreuzer 2012), two used computers/Internet interventions (Andersson 2002; Beukes 2018a), and one used bibliotherapy (Kaldo 2007).
No data were available for subgroup analysis comparing selection of participants based on inclusion/exclusion criteria relating to severe hearing loss.
1.1.2 Six months follow‐up
One study collected six‐month follow‐up data (Henry 1998), but by this time the participants in the wait list control group had received CBT and thus there was no comparison available.
1.1.3 Twelve months follow‐up
Four studies collected 12‐month follow‐up data (Andersson 2002; Henry 1996; Kaldo 2007; Robinson 2008), but participants in the wait list groups had all received CBT treatment by that time and thus at the 12‐month time point no comparison could be made.
1.2 Serious adverse effects
1.2.1 End of treatment
Seven studies, rated as moderate certainty, either reported or informed us via personal communication about serious adverse effects. Six informed us that no serious adverse effects occurred in the CBT or wait list condition at the end of treatment (Andersson 2002; Andersson 2005; Beukes 2018a; Kaldo 2007; Malinvaud 2016; Oron (unpublished)) and one study (Westin 2011) reported that one participant had deteriorated according to calculations of the reliable change index (Jacobson 1991) using the THI scores. This deterioration, however, occurred in the period between pre‐treatment assessment and the assessment following the first session but still appeared in the data at end of treatment. Given the timing of the deterioration, it is unlikely to be related to CBT (or specifically, ACT).
1.2.2 Six months follow‐up
Westin 2011 reported at six‐month follow‐up that one participant of the 22 in the ACT condition had, according to reliable change calculations, deteriorated. This deterioration occurred in the period between pre‐treatment assessment to the assessment following the first session (hence it was unlikely to be caused by CBT) but was still detectable at six‐month follow‐up.
1.2.3 Twelve months follow‐up
At 12‐month follow‐up Beukes 2018c reported that three participants from the study Beukes 2018a developed "moderate" new symptoms, "moderate" negative well being, and that two participants had thought that treatment was too long.
Secondary outcomes
1.3 Depression
1.3.1 End of treatment
Eight studies reported scores on measures of depression at the end of treatment (Andersson 2002; Andersson 2005; Beukes 2018a; Henry 1996; Kaldo 2007; Kreuzer 2012; Malinvaud 2016; Westin 2011). There was a statistically significant difference in favour of CBT (SMD ‐0.34, 95% CI ‐0.60 to ‐0.08; 8 studies; 502 participants; Analysis 1.3) while moderate heterogeneity might be present (Tau² = 0.06; Chi² = 12.85, df = 7 (P = 0.08); I² = 46%). This result was reported in summary of findings Table for the main comparison. Overall we rated the certainty of the evidence for this outcome as low.
1.3.2 Six months follow‐up
No data were available for this outcome at this time point.
1.3.3 Twelve months follow‐up
No data were available for this outcome at this time point.
1.4 Anxiety
1.4.1 End of treatment
Six studies reported scores on multi‐item questionnaires measuring levels of anxiety at the end of treatment (Andersson 2002; Andersson 2005; Beukes 2018a; Kaldo 2007; Malinvaud 2016; Westin 2011). There was a statistically significant difference in favour of CBT (SMD ‐0.45, 95% CI ‐0.82 to ‐0.09; 6 studies; 429 participants; Analysis 1.4). Substantial statistical heterogeneity was present (Tau² = 0.13; Chi² = 15.36, df = 5 (P = 0.009); I² = 67%). We rated the certainty of the evidence for this outcome as very low meaning that the true effect is likely to be substantially different from the estimate of effect.
1.4.2 Six months follow‐up
No data were available for this outcome at this time point.
1.4.3 Twelve months follow‐up
No data were available for this outcome at this time point.
1.5 Health‐related quality of life
1.5.1 End of treatment
Two studies collected health‐related quality of life data and the results indicated that there was a significant difference in favour of CBT (SMD ‐0.38, 95% CI ‐0.67 to ‐0.08; 2 studies; 179 participants; Analysis 1.5). Heterogeneity was not likely to be important (Tau² = 0.00; Chi² = 0.26, df = 1 (P = 0.61); I² = 0%). Beukes 2018a used the Satisfaction with Life Scales and reported that the CBT group's quality of life improved significantly more than the wait list control group. Westin 2011 used the Quality of Life Index and linear mixed model regression to examine group by time effects over the 18‐month follow‐up period of the study. Although means and standard deviations were reported at the end of the treatment phase for the groups (i.e. ACT, TRT and wait list control) the differences between the groups were not analysed at this time point.
We rated the certainty of the evidence as very low meaning that the true effect is likely to be substantially different from the estimate of effect.
1.5.2 Six months follow‐up
No data were available for this outcome at this time point.
1.5.3 Twelve months follow‐up
No data were available for this outcome at this time point.
1.6 Negatively biased interpretations of tinnitus
1.6.1 End of treatment
Two studies reported multi‐item questionnaire measures of negatively biased interpretations of tinnitus (Henry 1996; Westin 2011). The analysis of the combined data revealed no difference between the CBT and wait list control groups. We rated the certainty of the evidence as very low, which suggests that the true effect is likely to be substantially different from the estimate of effect. There was high statistical heterogeneity (I² = 73%), which could be explained by the different CBT interventions and units of delivery: Henry 1996 compared group cognitive therapy whereas Westin 2011 compared ACT delivered to individuals. Both studies, however, employed psychologists to provide the face‐to‐face intervention.
1.6.2 Six months follow‐up
No data were available for this outcome at this time point.
1.6.3 Twelve months follow‐up
No data were available for this outcome at this time point.
1.7 Other adverse effects
1.7.1 End of treatment
Seven studies, rated as moderate certainty, either reported or informed us via personal communication that no other adverse effects occurred in the CBT or wait list conditions at the end of treatment (Andersson 2002; Andersson 2005; Beukes 2018a; Kaldo 2007; Malinvaud 2016; Oron (unpublished); Westin 2011).
1.7.2 Six months follow‐up
No data were available for this outcome at this time point.
1.7.3 Twelve months follow‐up
No data were available for this outcome at this time point.
Comparison 2: CBT versus usual audiological care
Three studies compared CBT to audiological care (Beukes 2018b; Cima 2012; Schmidt 2018). No follow‐up data were available at 6 or 12 months following the interventions. Two studies reported follow‐up data at two months (Beukes 2018b; Schmidt 2018) and one at four months (Cima 2012).
We did not conduct subgroup analyses for this comparison as only three studies were included.
Primary outcomes
2.1 Impact of tinnitus on quality of life
2.1.1 End of treatment
Three studies each reported results using the THI and thus we pooled and analysed the data using mean differences (MD). The results indicated a statistically significant difference in favour of CBT compared to usual audiological care (MD ‐5.65, 95% CI ‐9.79 to ‐1.50; 3 studies; 430 participants; MCID = 7 points; Analysis 2.1). Statistical heterogeneity was unlikely to be important (Tau² = 0.00; Chi² = 0.08, df = 2 (P = 0.96); I² = 0%). The forest plot is shown in Figure 5. We rated the certainty of the evidence as moderate reflecting that we are moderately confident that the true effect is likely to be close to the effect estimate but that there is a possibility that it could be substantially different (summary of findings Table 2).
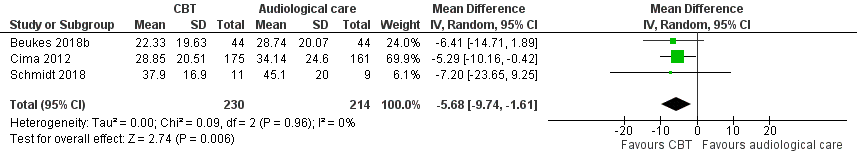
Forest plot of comparison: 2 CBT versus audiological care (tinnitus education and rehabilitation for hearing loss), outcome: 2.1 Impact of tinnitus on quality of life at end of treatment.
2.1.2 Six months follow‐up
No data were available for this outcome at this time point.
2.1.3 Twelve months follow‐up
No data were available for this outcome at this time point.
2.2 Serious adverse effects
2.2.1 End of treatment
Two studies reported that no serious adverse effects occurred as a result of the intervention (Beukes 2018b; Cima 2012), and one study did not report information related to this outcome (Schmidt 2018). We rated the certainty of the evidence as moderate for this outcome (summary of findings Table 2).
2.2.2 Six months follow‐up
No data were available for this outcome at this time point.
2.2.3 Twelve months follow‐up
No data were available for this outcome at this time point.
Secondary outcomes
2.3 Depression
2.3.1 End of treatment
Beukes 2018b used the PHQ‐9 and Cima 2012 used the HADS‐D to measure depression on multi‐item questionnaires. The results indicated that there was no difference between CBT and audiological care (Analysis 2.3). We rated the certainty of the evidence as low suggesting that the true effect is likely to be different from the estimate of the effect (summary of findings Table 2).
2.3.2 Six months follow‐up
No data were available for this outcome at this time point.
2.3.3 Twelve months follow‐up
No data were available for this outcome at this time point.
2.4 Anxiety
2.4.1 End of treatment
Beukes 2018b used the Generalised Anxiety Disorder‐7 (GAD‐7) scale and Cima 2012 the Hospital Anxiety and Depression Scale ‐ Anxiety subscale (HADS‐A) to measure anxiety on multi‐item questionnaires. The results indicated that there was no difference between CBT and audiological care (Analysis 2.4). We rated the certainty of the evidence as low suggesting that the true effect is likely to be different from the estimate of the effect (summary of findings Table 2).
2.4.2 Six months follow‐up
No data were available for this outcome at this time point.
2.4.3 Twelve months follow‐up
No data were available for this outcome at this time point.
2.5 Health‐related quality of life
2.5.1 End of treatment
Beukes 2018b used the Satisfaction with Life Scale (SLWS) and Cima 2012 used the Health Utilities Index (HUI) to measure quality of life on multi‐item questionnaires. The results indicated that there was no difference between CBT and audiological care (Analysis 2.5). We rated the certainty of the evidence as low, suggesting that the true effect is likely to be different from the estimate of the effect (summary of findings Table 2).
2.5.2 Six months follow‐up
No data were available for this outcome at this time point.
2.5.3 Twelve months follow‐up
No data were available for this outcome at this time point.
2.6 Negatively biased interpretations of tinnitus
2.6.1 End of treatment
Cima 2012 used the Tinnitus Catastrophizing Scale to measure negatively biased interpretations of tinnitus. At the end of treatment there was a statistically significant difference in favour of CBT based on an intention‐to‐treat analysis (group difference –4.683, 95% CI ‐6.938 to –2.428, P < 0.0001), which equated to a moderate effect size (Cohen's d = 0.60). We rated the certainty of the evidence as low, suggesting that the true effect is likely to be different from the estimate of the effect (summary of findings Table 2).
2.6.2 Six months follow‐up
No data were available for this outcome at this time point.
2.6.3 Twelve months follow‐up
No data were available for this outcome at this time point.
2.7 Other adverse effects
No other adverse effects were reported at the end of treatment or at 6 and 12 months respectively in any of the three studies that compared CBT to usual audiological care. We rated the certainty of the evidence as moderate for this outcome (summary of findings Table 2).
Comparison 3: CBT versus tinnitus retraining therapy (TRT)
One study compared a CBT intervention (ACT) with TRT and a wait list control condition (Westin 2011). For this comparison the wait list control group was included in the analyses reported in Comparison 1.
We did not conduct subgroup analyses for this comparison as only one study was included.
We assessed the certainty of the evidence for all the outcomes in this comparison as low (summary of findings Table 3).
Primary outcomes
3.1 Impact of tinnitus on quality of life
Westin 2011 conducted linear mixed model analyses, which revealed a significant linear (time by group) interaction effect on the main outcome measure (THI) at all time points in the study (post‐treatment, 6‐month and 18‐month follow‐up; F(1,114) = 8.49; P = 0.04).
3.1.1 End of treatment
At end of treatment, there was a statistically significant difference in favour of ACT compared with TRT (MD ‐15.79, 95% CI ‐27.91 to ‐3.67; 1 study; 42 participants; Analysis 3.1).
3.1.2 Six months follow‐up
At six months follow‐up, there was a statistically significant difference in favour of ACT compared with TRT (MD ‐13.10, 95% CI ‐26.08 to ‐ 0.12; 1 study; 42 participants Analysis 3.2).
3.1.3 Twelve months follow‐up
No data were available for this outcome at this time point.
3.2 Serious adverse effects
3.2.1 End of treatment
Three participants deteriorated over the course of the study: one participant was in the ACT group (n = 22), and two participants were in the TRT group (n = 20). (See section 1.2.1 for information about the participant in the ACT group who deteriorated according to reliable change index calculations (Jacobson 1991; Westin 2011)).
3.2.2 Six months follow‐up
The two participants in the TRT condition who deteriorated did so between 10 weeks and six months, although they also continued use of the wearable noise generators. (See section 1.2.2 for information about the participant in the ACT group who deteriorated (Westin 2011)).
3.2.3 Twelve months follow‐up
No data were available for this outcome at this time point.
Secondary outcomes
3.3 Depression
3.3.1 End of treatment
At the end of treatment there were no time, group or interaction effects on depression scores as measured by the HADS‐D (Westin 2011).
3.3.2 Six months follow‐up
At six months follow‐up there were no time, group or interaction effects on depression scores as measured by the HADS‐D (Westin 2011).
3.3.3 Twelve months follow‐up
No data were available for this outcome at this time point.
3.4 Anxiety
3.4.1 End of treatment
At the end of treatment there were no time, group or interaction effects on anxiety scores as measured by the HADS‐A (Westin 2011).
3.4.2 Six months follow‐up
At six months after treatment there were no time, group or interaction effects on anxiety scores as measured by the HADS‐A (Westin 2011).
3.4.3 Twelve months follow‐up
No data were available for this outcome at this time point.
3.5 Health‐related quality of life
3.5.1 End of treatment
At the end of treatment there were no time, group or interaction effects on health‐related quality of life scores as measured by the Quality of Life Inventory (QOLI) (Westin 2011).
3.5.2 Six months follow‐up
At six months after treatment there were no time, group or interaction effects on health‐related quality of life scores as measured by the QOLI (Westin 2011)
3.5.3 Twelve months follow‐up
No data were available for this outcome at this time point.
3.6 Negatively biased interpretations of tinnitus
Westin 2011 used the Tinnitus Acceptance Questionnaire (TAQ) as a process measure rather than an outcome measure. Before treatment no differences were found between the three groups (ACT, TRT, wait list) concerning tinnitus acceptance F(2,61) = 1.21; P = 0.31 (higher scores indicate better levels of tinnitus acceptance).
3.6.1 End of treatment
At the end of treatment there was a clear difference in favour of CBT compared with TRT (MD ‐9.78, 95% CI ‐16.40 to ‐3.16; 1 study; 42 participants; Analysis 3.4).
3.6.2 Six months follow‐up
At 6 months follow‐up, there was a difference in favour of CBT compared with TRT (MD ‐8.28, 95% CI ‐15.34 to ‐1.22; 1 study; 42 participants; Analysis 3.5).
3.6.3 Twelve months follow‐up
No data were available for this outcome at this time point.
3.7 Other adverse effects
3.7.1 End of treatment
No data were available for this outcome at this time point.
3.7.2 Six months follow‐up
No data were available for this outcome at this time point.
3.7.3 Twelve months follow‐up
No data were available for this outcome at this time point.
Comparison 4: CBT versus other active control
Sixteen studies compared CBT to an active experimental control group not otherwise included in the previous comparisons (Abbott 2009; Arif 2017; Davies 1995; Henry 1996; Hesser 2012; Jakes 1986; Jakes 1992; Jasper 2014; Malinvaud 2016; Martz 2018; McKenna 2017; Nyenhuis 2013a; Oron (unpublished); Philippot 2012a; Weise 2016; Zhong 2014). Four of these studies did not provide any data that could be included in meta‐analyses (Jakes 1986; Martz 2018; Philippot 2012a; Zhong 2014). For a description of the types of active comparison conditions used see Description of studies.
Abbott 2009 used a cluster‐randomised controlled trial design but did not report the intracluster correlation coefficients and did not take into consideration the clustered nature of the data in their analyses. In consultation with a statistician, we obtained an estimate of an appropriate intracluster correlation coefficient from Meijerink 2017 and used this to adjust the sample size for the study.
Primary outcomes
4.1 Impact of tinnitus on quality of life
4.1.1 End of treatment
Twelve studies provided data on the impact of tinnitus on quality of life using multi‐item questionnaires. Analysis indicated that the results were clearly in favour of CBT regardless of what the active control condition was (SMD ‐0.30, 95% CI ‐0.55 to ‐0.05; 12 studies; 966 participants; Analysis 4.1). The forest plot is shown in Figure 6. Overall we rated the certainty of the evidence as low, which indicates that the true effect might be substantially different from the effect estimate (summary of findings Table 4). Heterogeneity was moderate to substantial (Tau² = 0.12; Chi² = 33.27, df = 11 (P = 0.0005), I² = 67%).

Forest plot of comparison: 4 CBT versus other experimental control, outcome: 4.1 Impact of tinnitus on quality of life.
Subgroup analysis examining the type of therapy indicated that there were no significant differences between the types of therapy, and that heterogeneity was not a problem (Chi² = 0.29, df = 3; P = 0.96; I² = 0%; Analysis 4.14).
Subgroup analysis comparing face‐to‐face delivery to Internet‐based delivery of CBT indicated that there was no significant difference between the respective modes of delivery (Chi² = 1.54, df = 1 (P = 0.21), I² = 35%; Analysis 4.16)
Subgroup analysis examining whether there was a difference between CBT delivered in groups compared to individually found no difference (Chi² = 1.328, df = 1; P = 0.25; I² = 24%; Analysis 4.17).
There were no significant group differences regarding who delivers the CBT (psychologists, Internet‐based or "therapists") (Chi² = 0.15, df = 2; P = 0.93; I² = 0%; Analysis 4.18).
No data were available for subgroup analysis comparing selection of participants based on inclusion/exclusion criteria relating to severe hearing loss.
4.1.2 Six months follow‐up
McKenna 2017 reported that at six months after treatment there was a statistically significant difference in favour of CBT compared to relaxation therapy in the impact of tinnitus on quality of life, as measured by the Tinnitus Questionnaire (TQ). Specifically, the adjusted mean score in Mindfulness Based Cognitive Therapy (MBCT) (mean = 23, SD –18.1) was 7.2 points lower (95% CI 2.1–12.3, P = 0.006) than in relaxation therapy (mean = 35.6, SD = 16.8), with a standardised effect size of 0.56 (95% CI 0.16 to 0.96).
4.1.3 Twelve months follow‐up
One study provided 12‐month follow‐up data comparing cognitive therapy combined with education to education only, on the impact of tinnitus on quality of life, as measured by the THQ (Henry 1996). Results from repeated measures ANOVAs indicated that there was no significant difference between the conditions.
4.2 Serious adverse effects
4.2.1 End of treatment
Nyenhuis 2013a reported that three participants deteriorated using the scores from the TQ in reliable change index calculations (Jacobson 1991); one participant was from the group CBT intervention and two from the information only control. We assessed the certainty of the evidence as low, meaning that the true effect could be substantially different from the effect estimate (summary of findings Table 4).
4.2.2 Six months follow‐up
No data were available for this outcome at this time point.
4.2.3 Twelve months follow‐up
Weise 2016 reported that three participants showed "reliable deterioration" using the reliable change index for measures of the impact of tinnitus on quality of life (THI, n = 2; Mini‐TQ, n = 1). (Note: by this time point there were no longer comparator participants since they had been offered and received CBT).
Secondary outcomes
4.3 Depression
4.3.1 End of treatment
Eleven studies supplied data for this analysis (Abbott 2009; Arif 2017; Davies 1995; Henry 1996; Hesser 2012; Jasper 2014;Malinvaud 2016; McKenna 2017; Nyenhuis 2013a; Philippot 2012a; Weise 2016). The results indicated a small difference in favour of CBT over other active interventions (SMD ‐0.17, 95% CI ‐0.33 to ‐0.01; 11 studies; 943 participants; Analysis 4.5), and heterogeneity was unlikely to be important (Chi² = 13.00, df = 10; P = 0.22; I² = 23%). We assessed the certainty of the evidence as low, meaning that the true effect could be substantially different from the effect estimate (summary of findings Table 4).
4.3.2 Six months follow‐up
At six months follow‐up, McKenna 2017 reported that there were no differences between the MBCT group and active control (relaxation therapy) in HADS‐D scores after pre‐treatment scores had been taken into consideration (MD ‐1.90, 95% CI ‐3.87 to 0.07; 1 study; 62 participants; Analysis 4.6).
4.3.3 Twelve months follow‐up
Henry 1996 compared cognitive therapy combined with education to an education only control condition, and reported that there was no significant difference between the groups (MD ‐2.00, 95% CI ‐7.88 to 3.88; 1 study; 33 participants; Analysis 4.7).
4.4 Anxiety
4.4.1 End of treatment
Nine studies supplied data for the comparison of CBT to an active control (Abbott 2009; Arif 2017; Davies 1995; Hesser 2012; Jasper 2014; Malinvaud 2016; McKenna 2017; Philippot 2012a; Weise 2016). There was a significant difference in favour of CBT (SMD ‐0.25, 95% CI ‐0.48 to ‐0.02; 9 studies; 696 participants; Analysis 4.8) with moderate to substantial heterogeneity (Chi² = 16.54, df = 8; P = 0.04; I² = 52%). We rated the certainty of the evidence as low, which indicated that the true effect might be substantially different from the effect estimate (summary of findings Table 4).
4.4.2 Six months follow‐up
At six months follow‐up, McKenna 2017 reported that there were no differences between the MBCT group and active control (relaxation therapy) in HADS‐A scores after pre‐treatment scores had been taken into consideration (MD ‐1.20, 95% CI ‐3.07 to 0.67; 1 study; 62 participants; Analysis 4.9).
4.4.3 Twelve months follow‐up
No data were available for this outcome at this time point.
4.5 Health‐related quality of life
4.5.1 End of treatment
One study reported quality of life data for the comparison of CBT and other active control (Hesser 2012), but found no difference between the conditions (MD ‐0.05, 95% CI ‐0.68 to 0.59; 1 study, 95 participants; Analysis 4.10). We rated the certainty of the evidence for this outcome as very low, reflecting that we have little confidence in the effect estimate and that the true effect is likely to be substantially different (summary of findings Table 4).
4.5.2 Six months follow‐up
No data were available for this outcome at this time point.
4.5.3 Twelve months follow‐up
No data were available for this outcome at this time point.
4.6 Negatively biased interpretations of tinnitus
4.6.1 End of treatment
Data were supplied from five studies (Henry 1996; Hesser 2012; Jasper 2014; McKenna 2017; Weise 2016). These yielded results that found a significant difference in favour of CBT at the end of treatment (SMD ‐0.55, 95% CI ‐0.75 to ‐0.35; 5 studies; 455 participants; Analysis 4.11). Heterogeneity might not be important (Tau² = 0.00; Chi² = 4.23, df = 4 (P = 0.38); I² = 5%). We rated the certainty of the evidence for this outcome as moderate, indicating that the true effect is likely to be close to the effect estimate, but could possibly be substantially different (summary of findings Table 4).
4.6.2 Six months follow‐up
At six months follow‐up, McKenna 2017 reported that there was a statistically significant difference between participants' scores in the MBCT group compared to the active control (relaxation therapy) on catastrophising as measured by the Tinnitus Catastrophizing Scale (TCS) (MD ‐7.20, 95% CI ‐13.65 to ‐0.75; 1 study; 62 participants; Analysis 4.12). McKenna 2017 reported an adjusted mean difference of ‐4.6 (95% CI –8.7 to –0.5).
4.6.3 Twelve months follow‐up
One study provided 12‐month follow‐up data that compared cognitive therapy combined with education, to education only, on the negatively biased interpretations of tinnitus as measured by the Tinnitus Cognitions Questionnaire (Henry 1996). Results from repeated measures ANOVAs indicated that there were no significant differences between the conditions.
4.7 Other adverse effects
4.7.1 End of treatment
No other adverse effects were reported at end of treatment.
4.7.2 Six months follow‐up
No data were available for this outcome at this time point.
4.7.3 Twelve months follow‐up
One study reported some slight deterioration in sleep quality in three participants (Weise 2016). (Note: by this time point there were no longer comparator participants since they had been offered and received CBT).
Sensitivity analyses
Random‐effects models compared to fixed‐effect models
There were no substantial differences between results depending on whether random‐effects or fixed‐effect modelling was used in the respective meta‐analyses for the comparisons:
-
CBT versus wait list control (Analysis 1.7; Analysis 1.8);
-
CBT versus usual audiological care (Analysis 2.1; Analysis 2.7);
-
CBT versus other active control (Analysis 4.14; Analysis 4.15).
Excluding studies at high risk of bias for incomplete data
Comparison 1: CBT versus no intervention/wait list control at end of treatment ‐ impact of tinnitus on quality of life
We judged one study to be at high risk of bias for incomplete data (Malinvaud 2016). Retaining or excluding Malinvaud 2016 from the meta‐analysis did not change the conclusion that CBT was more effective than wait list control, and did not change the effect size (moderate). With Malinvaud 2016 included the SMD was ‐0.56 (95% CI ‐0.83 to ‐0.30; 10 studies, 537 participants; Analysis 1.1) and with Malinvaud 2016 excluded the SMD was ‐0.64 (95% CI ‐0.88 to ‐0.40; 9 studies, 454 participants; Analysis 1.15). Excluding Malinvaud 2016 from the analysis reduced the heterogeneity from I² = 49% (Tau² = 0.08; Chi² = 17.62, df = 9 (P = 0.04)) to I² = 28% (Tau² = 0.04; Chi² = 11.18, df = 8 (P = 0.19)).
Comparison 4: CBT versus other active control at the end of treatment ‐ impact of tinnitus on quality of life
We judged three studies to be at high risk of bias for incomplete outcome data (Abbott 2009; Davies 1995; Malinvaud 2016). With Abbott 2009, Davies 1995 and Malinvaud 2016 included the SMD was ‐0.32 (95% CI ‐0.56 to ‐0.08; 12 studies; 967 participants; Analysis 4.1), therefore lower than with the studies excluded (SMD ‐0.48, 95% CI ‐0.71 to ‐0.26; 9 studies; 770 participants; Analysis 4.21). Excluding the studies did not change the finding that CBT was more effective at decreasing the impact of tinnitus on quality of life, but did lead to a change in the effect size from 'small' to 'moderate'. Statistical heterogeneity was also reduced when the three studies were excluded, from I² = 66% (Tau² = 0.11; Chi² = 32.28, df = 11 (P = 0.0007)) to I² = 47% (Tau² = 0.05; Chi² = 15.18, df = 8 (P = 0.06)).
Effects of replacing missing data with a 'conservative' compared with an 'optimistic' approach
One study that was included in two comparisons had missing data that were replaced with (baseline) data showing no difference between the groups (Malinvaud 2016). To examine the effect of entering data on a 'conservative' basis showing no effect, we undertook a sensitivity analysis replacing it with data at three months follow‐up, which showed a change in participants' scores in favour of CBT.
Comparison 1: CBT versus no intervention/wait list control at the end of treatment ‐ impact of tinnitus on quality of life
Using data showing a more 'optimistic' response at the end of treatment resulted in a small increase in the SMD but did not change the effect size (moderate) or conclusion that CBT was more effective than wait list control at reducing the impact of tinnitus on quality of life at the end of treatment. Specifically, using the 'conservative' approach, the SMD was ‐0.56 (95% CI ‐0.83 to ‐0.30; Analysis 1.1) compared to the 'optimistic' scenario using three‐month follow‐up data (SMD ‐0.65, 95% CI ‐0.85 to ‐0.44; Analysis 1.16). Heterogeneity decreased from I² = 49% (Tau² = 0.08; Chi² = 17.62, df = 9, P = 0.04) to I² = 20% (Tau² = 0.02; Chi² = 11.29, df = 9, P = 0.26) with the use of three‐month follow‐up data.
Comparison 4: CBT versus other active control at the end of treatment ‐ impact of tinnitus on quality of life
Using data that showed a more 'optimistic' response at the end of treatment resulted in a small increase in SMD score in favour of CBT, but did not change the effect size (small). Specifically, the SMD increased from ‐0.32 (95% CI ‐0.56 to ‐0.08; Analysis 4.1) to ‐0.37 (95% CI ‐0.58 to ‐0.17; Analysis 4.23) when the more 'optimistic' data were used. Furthermore, heterogeneity decreased from I² = 66% (Tau² = 0.11; Chi² = 32.28, df = 11, P = 0.0007) to I² = 54% (Tau² = 0.07; Chi² = 23.74, df = 11, P = 0.01).
Discussion
Summary of main results
The objective of this review was to assess the effects and safety of cognitive behavioural therapy (CBT) for tinnitus in adults. Twenty‐eight randomised controlled trials (RCTs) were included in the review with 21 of these supplying data for inclusion in meta‐analyses. The four main comparisons of interest were wait list control, usual audiological care, tinnitus retraining therapy (TRT) and 'other' active control conditions.
Ten studies supplied data for the comparison of CBT with no intervention/wait list control. However, not all of them provided data on all the outcomes of interest for this review. There was evidence to indicate that CBT was superior to not providing any intervention in reducing the impact of tinnitus on quality of life and depression. However, there is limited evidence for CBT for tinnitus reducing anxiety, improving health‐related quality of life, or reducing negatively biased interpretations of tinnitus (summary of findings Table for the main comparison). Furthermore, information from six of the 10 studies indicated that there were no serious adverse effects at the end of treatment. One study reported that one participant who received CBT experienced a deterioration in their symptoms. Although the results appear promising, effect sizes were small or medium, and the certainty of the evidence was very low, low or moderate, depending on the specific outcome.
Three studies supplied data for the comparison of CBT with audiological care. With regard to reducing the impact of tinnitus on quality of life, there was evidence to indicate that CBT was superior to audiological care and without serious adverse effects. The mean difference across the three studies (5.65) was less than the difference of seven points that has been reported to reflect a clinically important change (Zeman 2011). For this comparison though it is relevant to consider that one large study (n = 336) reported a large effect in favour of CBT and influences the overall result. There were negligible differences between CBT and audiological care on measures of depression, anxiety or quality of life. There was insufficient evidence to conclude that either CBT or audiological care is superior or inferior with regard to reducing negatively biased interpretations of tinnitus. No other adverse effects occurred. (See summary of findings Table 2).
There was insufficient evidence to conclude that CBT is superior or inferior to TRT on the outcomes of interest as only one study was included for this comparison (Westin 2011). In one of the few examples of studies reporting adverse effects, Westin 2011 found that three participants tinnitus worsened following treatment (one from the CBT and two from the TRT group). (See summary of findings Table 3).
Twelve studies compared CBT to another active control condition. Across the studies there was variation in what form of CBT was used, what the comparison group received, whether it was individual or group treatment, delivered in person or not, and who delivered the treatment(s). Despite this, there was evidence to indicate that overall and albeit with small effect sizes, CBT is superior to other active treatments (e.g. relaxation, information sessions) in reducing the impact of tinnitus on quality of life. Similarly, small effect sizes in favour of CBT were found for reducing symptoms of depression, anxiety and negatively biased interpretations of tinnitus. Data from six of the 12 studies also suggest that adverse effects were less likely with CBT than with other active treatments. There was insufficient evidence to support the superiority or inferiority of CBT compared to other active treatments on quality of life. (See summary of findings Table 4).
Sensitivity analyses indicated that the findings and conclusions were robust to tests of assumptions and the methods used.
Results from subgroup analyses
The subgroup analyses examined whether there were differences in effects between: the types of CBT; modes of delivery; unit of delivery; health professional involved in delivery; and whether effects differed between studies that excluded participants according to hearing thresholds. Results from each of these analyses are briefly discussed below.
Type of CBT
Subgroup analyses for both the comparison of CBT versus wait list control and an active control intervention (excluding usual audiological care and TRT) found no statistically significant differences between the types of CBT (Analysis 1.7; Analysis 4.14). It is important to note, however, that the most frequent intervention type included in the subgroup analyses was CBT.
In summary, the type of CBT intervention used might not matter, but a relatively low number of studies using mindfulness or acceptance and commitment therapy (ACT) (i.e. 'third wave' CBT) prevents more definitive conclusions from being drawn.
Mode of delivery
While there was no statistically significant difference between the effects of CBT when mode of delivery was taken into account, there was greater variation in effect size when CBT was delivered face‐to‐face compared with as an Internet‐based intervention. If CBT delivered as an Internet‐based intervention is indeed as effective as face‐to‐face CBT, this has implications for access to treatment and cost‐effectiveness. (See Implications for practice).
Unit of delivery
Subgroup analyses in the respective comparisons examining whether there were difference in effectiveness of CBT delivered individually compared with groups were consistent in their results. They both found that there was no statistical difference when CBT was delivered individually compared to groups (Analysis 1.11; Analysis 4.17).
Health professional involved in delivery
There were no statistically significant differences in effect between who (or what) delivered CBT when comparing CBT to wait list (Analysis 1.13) or an 'other' active control (Analysis 4.18). Two issues are important to consider. First, the Internet‐delivered and bibliotherapy CBT interventions were designed by psychologists but were not delivered by psychologists. Secondly, it was unclear exactly in what training or profession the "other clinicians" were in four studies across the two subgroup analyses (Andersson 2005; Arif 2017; Jakes 1992; Kreuzer 2012). These issues prevent conclusions being drawn with regard to the question of whether it matters who delivers CBT.
Hearing thresholds as a selection criteria in RCTs of CBT for tinnitus
Only one study included in this review excluded participants with severe hearing loss (Westin 2011). On one hand, this means that it is not possible to establish whether there are differences in results obtained between studies that examine whether there are differences in effectiveness of CBT depending on hearing loss, but on the other hand, it means that the results from the review can be applied to all people seeking help for tinnitus‐related distress regardless of whether or not they have hearing loss.
Additional results and considerations
Many articles did not report or collect data on adverse effects or other outcomes of interest
Adverse effects of CBT for tinnitus are rare. However, this conclusion comes with the caveat that relatively few studies actually reported whether adverse effects occurred or not, and when they did there was little or no information on the method used to identify adverse effects. The exception to this being in four studies (Beukes 2018a; Nyenhuis 2013a; Weise 2016; Westin 2011), where deterioration on measures of tinnitus‐related quality of life was established using the calculation of reliable change indices. When not reported, information about adverse effects was sought from and/or obtained from personal email communication with authors involved in the studies. Although a lot of authors responded to our inquiries, not all were able to recall whether there were adverse effects or not.
In addition to the absence of data relating to adverse effects, it was relatively rare for studies to collect outcome data for quality of life (6 of 28 studies) and negatively biased interpretations of tinnitus (10 of 28 studies).
Few studies collected six‐ and 12‐month follow‐up data
Collecting longer‐term follow‐up data is vital for examining whether or not any intervention effects are sustained over time. This in turn can have an effect on treatment preferences of the patient, service provider and at a policy level. The time points of interest for this review were post‐treatment, six‐ and 12‐month follow‐up, which in the context of 'longer‐term follow‐up' is not actually that long. Unfortunately, only two studies reported outcome data that were collected at six months and six studies collected outcome data at 12 months follow‐up. Even then, not all the data collected at these time points could be included in meta‐analyses as the comparators were mostly wait list control conditions and participants had already received CBT by the six‐ or 12‐month time point. The average duration for which follow‐up data were collected was four months and the median was three months.
Short‐term follow‐up data might also limit the ability of multi‐item questionnaires to detect changes in overall quality of life in particular. This might be the case here because a change in one domain (e.g. tinnitus‐related quality of life) might not immediately generalise or have an effect on other domains of life in the short term, but might do so in the longer term.
Origin of CBT materials
Viktor Kaldo and Gerhard Andersson co‐authored a manual (in Swedish) for conducting CBT for tinnitus (Kaldo 2004a), which subsequently formed the basis for many bibliotherapy and Internet‐based interventions. Nine of the 21 studies that supplied data for meta‐analyses are derived from this work. In addition to the Swedish studies (Andersson 2002; Andersson 2005; Hesser 2012; Kaldo 2007), the treatment manual and Internet‐based interventions have been adapted, translated and used in English‐ (Abbott 2009; Beukes 2018a; Beukes 2018b) and German‐speaking populations (Jasper 2014; Weise 2016). With the exception of Abbott 2009, which used a cluster‐randomised control design and had a high participant dropout rate, results from the other eight studies were consistently in favour of CBT over comparison conditions. This suggests that the CBT content delivered with little human interaction is efficacious and robust to different contexts and languages.
Issues of sample size
With the exception of one study, all studies involved samples of fewer than 150 participants. Cima 2012 included 492 participants. This one large study reported a large effect size in favour of CBT and was weighted highly in the meta‐analysis for the comparison in which it was included (CBT compared to audiological care). Ultimately the result showing that CBT was superior to audiological treatment was thus largely determined by the results of Cima 2012.
Outlier study
In general the results of studies included in this review found that CBT is superior to other control/comparator conditions with regard to reducing the impact tinnitus has on quality of life. The notable exception to this was Oron (unpublished), which found that the participants in the comparator intervention (coping effectiveness training; CET) had significantly lower scores on the THI than participants in the acceptance and commitment therapy (ACT) condition. A possible explanation for this result could be that CET appears to have some intervention components that are commonly found in CBT interventions. For example, CET included problem‐solving skills with the intention of reducing stress, relaxation and pleasant activity scheduling.
Clinical significance
All of the included studies report group‐level statistical significance of changes in the outcomes of the interventions. However, only 15 studies discussed clinical significance. Reporting the clinical significance of an intervention is important in order to provide an indication of size of effect, and the numbers of individual participants who might have benefited, remained the same or deteriorated following treatment. Clinical significance can be calculated in many ways and there is no standardised criteria or method for doing this. For example, within the included studies Kaldo 2007 used a pre‐specified criteria of a 50% reduction in the Tinnitus Reaction Questionnaire (TRQ) score as a sign of clinically significant change. In contrast, Weise 2016 used two methods to estimate clinical significance. Firstly, the Reliable Change Index (Jacobson 1991) to establish the change in score required to reflect change beyond measurement error, and second, calculating the numbers of participants who were "highly functioning" following treatment according to if they scored in the "mild" range on the THI (i.e. less than or equal to 36).
Given that there were only small to moderate effect sizes achieved, it seems that there is still room for improvement in the design and implementation of CBT interventions for tinnitus. However, by way of comparison, the magnitudes of the effect sizes reported in this review are similar to those reported for psychological interventions for treating chronic pain (Ecclestone 2013), which has many conceptual similarities to chronic tinnitus.
Studies at high risk of bias for missing data affected heterogeneity
Sensitivity analyses revealed that including studies judged to be at high risk for missing data inflated the level of heterogeneity (Abbott 2009; Davies 1995; Malinvaud 2016). Furthermore, for Comparison 1, the inclusion of Malinvaud 2016 also contributed to us downgrading the level of evidence for inconsistency in the results ‐ that is, inconsistency that we introduced ourselves into the data set by including the study.
Limitations
The results of this review should be interpreted with five main limitations in mind. First, information about adverse effects associated with CBT was rarely reported, and the methods associated with monitoring or seeking information about adverse effects were not reported. Where information about adverse effects (serious or otherwise) was not reported, we made efforts to contact authors to obtain this information. Not every author we contacted responded to our requests for information and in many cases, information was dependent on recall of studies that occurred many years ago. It is conceivable that authors who responded to our inquiries were less likely to have observed adverse effects in their studies, thus leading to an underestimation of the risks associated with CBT. Nonetheless, CBT is considered to be a safe intervention, compared to surgical and pharmacological treatments since it is non‐invasive.
A second limitation within this review concerns the lack of six‐ and 12‐month follow‐up data. Very few studies collected longer‐term follow‐up data, which in turn limits our ability to draw any conclusions about the longer‐term efficacy of CBT for tinnitus. This has long been recognised as an issue within tinnitus research (Henry 1996), but little has changed in recent years.
'Risk of bias' assessments revealed that there were very few studies at low risk of performance and detection biases. This is partially a product of CBT as intervention being difficult to mask from participants and that trialists depended on multi‐item self‐report questionnaires of subjective variables such as tinnitus‐related quality of life. None of the included studies had, for example, an independent outcome assessor to complement the responses obtained from the self‐report questionnaires.
Another limitation within the review is the limited number of studies included for the subgroup analyses: those results should be interpreted with caution.
Lastly, although not an inherent limitation, we only included evidence from parallel‐group and cluster‐randomised controlled trials. Excluding non‐randomised studies may limit the generalisability of drawing conclusions on how well CBT for tinnitus will work in everyday clinical practice. Although accompanied by higher risks of bias, the (potential) benefit of non‐randomised trials is that they can inform judgments of the effectiveness of CBT when implemented in everyday practice.
Overall completeness and applicability of evidence
Completeness
The completeness of the evidence was variable with regard to the four main comparisons included in this review. There is sufficient evidence of moderate certainty to conclude that CBT is superior to wait list control conditions at the end of treatment. However, there were too few studies comparing CBT with audiological care and TRT respectively to reach a conclusion. For the comparison of CBT with any other active intervention, the rating of the evidence (i.e. low certainty) means that our confidence in the effect estimate is limited.
Information about adverse effects (serious or otherwise) was rarely reported (although we obtained information about adverse effects from some authors). Three‐quarters of the studies provided data for inclusion in meta‐analyses of the primary outcome (impact of tinnitus on quality of life). Outcome data for depression and anxiety were more frequently reported than data related to quality of life and negatively biased interpretations of tinnitus.
Across all comparisons and outcomes there was an absence of evidence of the efficacy of CBT at 6 or 12 months after treatment.
For the subgroup analyses, there were considerable differences in the number of studies that provided data within the respective comparisons. For example, there was a comparable number of studies using different modes and units of delivery, but not of types of therapy, professional delivering therapy or of studies using and not using hearing loss as an exclusion criteria.
Applicability
There was a relatively complete representation of the population of people living with and seeking psychological help for tinnitus. There was a wide age range, a wide range of tinnitus duration, and a balance of males and females. Only one study excluded participants based on hearing thresholds (Westin 2011). The most frequent exclusion criteria were objective tinnitus and/or severe mental health conditions. In summary, the evidence appears applicable to people suffering from chronic tinnitus. People suffering from tinnitus and seeking pharmacological, electrical or electromagnetic stimulation therapy, or bio‐ neuro‐feedback treatments would not have sought to participate in the included studies, and thus could be different in some characteristics.
Between the studies there was considerable variation in the possible combinations and permutations of CBT; that is, there was variation in the type of CBT, how it was delivered to participants, the unit of delivery, who delivered CBT and the duration of treatment. With the exception of the studies linked to Andersson and Kaldo's work there was also variation in the content of the CBT interventions included/used in the studies. The planned comparisons we specified meant that almost all RCTs of CBT for tinnitus have been included, making the results applicable to CBT for tinnitus in general.
The results from this review are most applicable to when either a psychologist (or psychologist in training) delivers the interventions and/or designed the CBT intervention. Although 'therapists' were referred to in some studies there was, overall, an absence of evidence from studies that had professionals other than psychologists delivering CBT. The absence of follow‐up data also means that the results are only applicable to CBT in the short rather than medium or long term.
It is also important to recognise that the data included in this review came from studies conducted in outpatient clinics in a relatively small number of European countries, America and Australia. One study from China was included in the review, but did not provide data suitable for inclusion in meta‐analyses. We are thus unclear about the effectiveness of CBT for tinnitus when conducted in inpatient settings or in other countries beyond those included here. Similarly, it is unclear what effects CBT might have when delivered by professionals such as audiologists due to an absence of data.
Quality of the evidence
For the comparison 'CBT versus no intervention/wait list control' the certainty of evidence for the two primary outcomes was low and moderate respectively. We downgraded the evidence (10 studies) by one level due to risk of bias associated with an absence of blinding of participants and personnel with regard to both the intervention and outcome assessment. We also downgraded the evidence for the outcome impact of tinnitus on quality of life by one level due to inconsistency in the results.
For the comparison 'CBT versus audiological care' the certainty of evidence for the primary outcomes was moderate. We downgraded the evidence (three studies) by one level due to risk of bias. We judged all studies in this comparison to be at high risk of performance bias due to an absence of blinding of participants and personnel.
For the comparison 'CBT versus tinnitus retraining therapy' we rated the certainty of evidence for the primary outcomes as low. We downgraded the evidence (one study) primarily due to high risk of bias associated with an absence of allocation concealment, and also an unclear risk of bias due to performance, detection and attrition biases. We also downgraded the evidence by one level due to imprecision (sample size fewer than 350 participants).
For the comparison 'CBT versus other experimental control' we rated the certainty of evidence for the primary outcomes as low. For the outcome of impact of tinnitus on quality of life we downgraded the evidence by two levels due to risk of bias (unclear or high risk associated with performance bias and blinding) and inconsistency (not all confidence levels overlapped and there was high statistical heterogeneity). For the outcome of serious adverse effects, we downgraded the evidence by two levels due to unclear or high risk of performance and attrition bias respectively.
Potential biases in the review process
The searches of the electronic databases were conducted independently of the group of authors by Information Specialists within the Cochrane ENT group. We also searched the reference lists of the included studies and previous Cochrane Reviews (Martinez‐Devesa 2010). Date of publication and language were not barriers to inclusion in this review. In addition to English, we reviewed full‐text articles in Chinese and German for eligibility assessment. Where authors of this review were listed as authors of included studies, they were not involved in decisions related to screening, data extraction or risk of bias assessment.
We conscientiously followed Cochrane guidelines and the methods described in the protocol (Fuller 2017b). This, however, does not entirely prevent biases from influencing the outcome of the review. It is possible that biases influenced decisions in the development of the protocol and thus the procedures that we followed thereafter. For example, how we defined CBT determined the studies that were included. There is some debate about whether ACT and mindfulness constitute a new form of CBT or should be considered independently (Hofmann 2008). Similarly, after some debate within the group, we excluded Malouff 2010 on the grounds that giving participants a book based on CBT principles, but without any contact from a psychologist or other therapist, does not constitute CBT. It is possible that a different group of authors might have reached different conclusions about these issues.
There were three minor changes to the roles of authors in relation to data extraction and risk of bias assessments (see Differences between protocol and review). However, given that this led to additional participation from more rather than fewer authors, it is likely that biased thinking was decreased rather than increased as a result of greater scrutiny amongst the review team.
In this review, one cluster‐randomised controlled trial was included (Abbott 2009). The analysis conducted by Abbott 2009 did not take into account the clustered nature of the data, and the corresponding author informed us that the data set was no longer available. The Cochrane Handbook for Systematic Reviews of Interventions advises that a post‐hoc calculation can be made to adjust the sample size to account for the clustered nature of the data, using a value for the intracluster correlation (ICC) (Higgins 2011). If an ICC is not reported in the article, a suitable alternative should be identified. Ultimately, we used an ICC value from a cluster‐RCT with hearing aid users as the best/closest approximation (Meijerink 2017). This ICC was identified by the Cochrane Methods Support Unit (see Acknowledgements) and the decision to use it was taken in consultation with the Cochrane ENT Managing Editor.
Agreements and disagreements with other studies or reviews
The conclusions of this review are mostly consistent with previous systematic reviews. The previous Cochrane Review of CBT for tinnitus concluded that "CBT has a positive effect on the management of tinnitus" (p.2; Martinez‐Devesa 2010). This conclusion was based on results showing significant improvement in the impact of tinnitus on quality of life and depression scores. While we agree with this conclusion in principle, our results are more nuanced as a result of being able to include more recent studies and subsequently conduct subgroup analyses. Furthermore our conclusions about the efficacy of CBT are limited to post‐treatment as there is an absence of evidence at six and 12 months follow‐up.
The effect sizes for the impact of tinnitus on quality of life reported for CBT versus wait list control at end of treatment in Martinez‐Devesa 2010 were larger (standardised mean difference (SMD) 0.91, 95% confidence interval (CI) 0.50 to 1.32; 5 studies; 309 participants) than the ones we report (SMD 0.56, 95% CI ‐0.83 to ‐0.30; 10 studies; 537 participants). We identified a few examples of participant deterioration following CBT, though Martinez‐Devesa 2010 did not.
Regarding the secondary outcomes, for depression our results for the comparison of CBT versus wait list control and versus another active treatment were in agreement. Specifically, each review reported medium and small effect sizes respectively. Martinez‐Devesa 2010, however, did not examine outcomes related to anxiety, quality of life or negatively biased interpretations of tinnitus. We on the other hand did not include subjective loudness of tinnitus as an outcome despite it being the primary outcome of Martinez‐Devesa 2010. Research has consistently reported that CBT does not affect the perceptual characteristics of tinnitus.
While our conclusions are consistent with Martinez‐Devesa 2010 there are differences in the studies that were included and excluded. We excluded the following studies that Martinez‐Devesa 2010 included: Kröner‐Herwig 1995; Kröner‐Herwig 2003; Rief 2005; Weise 2008; Zachriat 2004. (See Excluded studies for reasons why the studies were excluded from this review). In contrast, we included the following studies that Martinez‐Devesa 2010 excluded: Abbott 2009; Andersson 2002; Davies 1995; Henry 1998; Jakes 1986; Jakes 1992; Lindberg 1989; Robinson 2008. Five of these studies were excluded by Martinez‐Devesa 2010 due to high participant dropout rates, a criterion that is no longer considered as valid for exclusion. One study was excluded for not having usable data (Henry 1998), one for not being randomised (Jakes 1986), and one study was judged not to have used CBT as an intervention (Lindberg 1989). We included these studies although none provided data that could be included in the meta‐analyses.
Two studies were listed in Martinez‐Devesa 2010 as ongoing studies at the time of publication. We included one, Schmidt 2018 (referred to as "Kendall 2009" in Martinez‐Devesa 2010, p. 12) and excluded one, Zenner 2013 (referred to as "Zenner 2010" in Martinez‐Devesa 2010, p. 12).
In addition to the previous Cochrane Review of CBT for tinnitus, there have been nine other systematic reviews that have examined the efficacy of CBT for tinnitus (Andersson 1999; Hesser 2011; Hoare 2011b; Nyenhuis 2013b; Cima 2014; Beukes 2019; Landry 2019; Mehta 2019; Rademaker 2019). Although these reviews differ from each other and our review in their focus and methodology, the conclusions are consistent in that CBT appears to be superior to other control conditions for alleviating the impact of tinnitus on quality of life. The moderate effect sizes for CBT versus wait list control reported by Hesser 2011 and Hoare 2011b are comparable with our results but smaller than the large effect size reported by Landry 2019.

Process for sifting search results and selecting studies for inclusion

'Risk of bias' graph: review authors' judgements about each risk of bias item presented as percentages across all included studies.

'Risk of bias' summary: review authors' judgements about each risk of bias item for each included study.

Forest plot of comparison: 1 CBT versus no intervention/waiting list control, outcome: 1.1 Impact of tinnitus on quality of life at end of treatment.

Forest plot of comparison: 2 CBT versus audiological care (tinnitus education and rehabilitation for hearing loss), outcome: 2.1 Impact of tinnitus on quality of life at end of treatment.
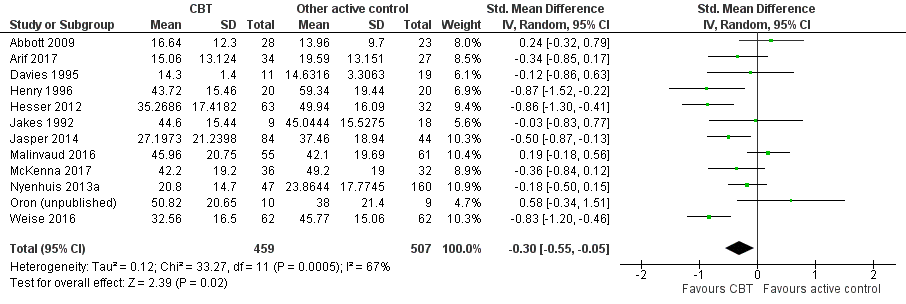
Forest plot of comparison: 4 CBT versus other experimental control, outcome: 4.1 Impact of tinnitus on quality of life.

Comparison 1 CBT versus no intervention/waiting list control, Outcome 1 Impact of tinnitus on quality of life at end of treatment.

Comparison 1 CBT versus no intervention/waiting list control, Outcome 2 Serious adverse effects at end of treatment.

Comparison 1 CBT versus no intervention/waiting list control, Outcome 3 Depression at end of treatment.

Comparison 1 CBT versus no intervention/waiting list control, Outcome 4 Anxiety at end of treatment.

Comparison 1 CBT versus no intervention/waiting list control, Outcome 5 Health‐related quality of life at end of treatment.
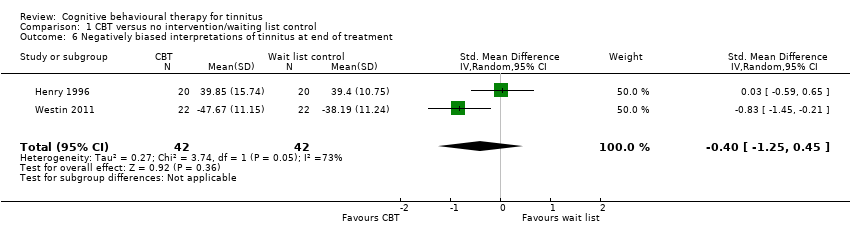
Comparison 1 CBT versus no intervention/waiting list control, Outcome 6 Negatively biased interpretations of tinnitus at end of treatment.

Comparison 1 CBT versus no intervention/waiting list control, Outcome 7 Subgroup analysis (random‐effects model): type of therapy ‐ impact of tinnitus on quality of life at end of treatment.

Comparison 1 CBT versus no intervention/waiting list control, Outcome 8 Subgroup analysis (fixed‐effect model): type of therapy ‐ impact of tinnitus on quality of life at end of treatment.

Comparison 1 CBT versus no intervention/waiting list control, Outcome 9 Subgroup analysis (random‐effects model): mode of delivery ‐ impact of tinnitus on quality of life at end of treatment.
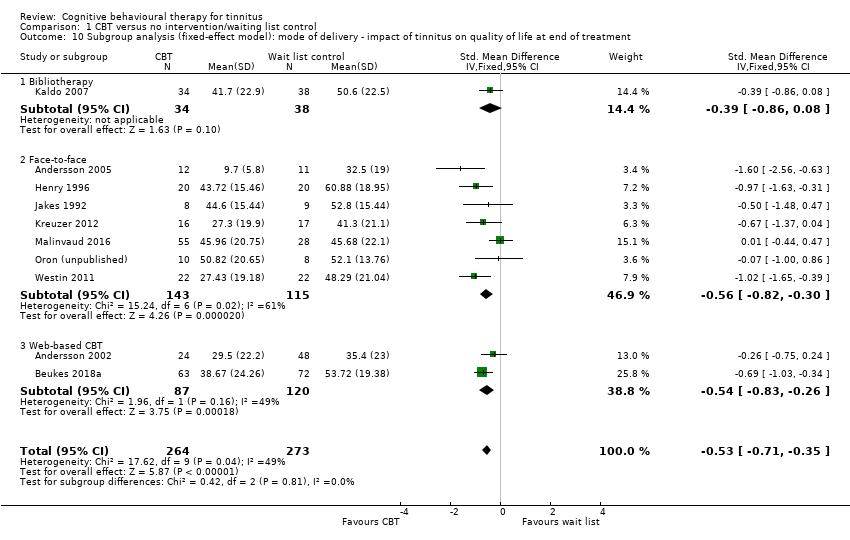
Comparison 1 CBT versus no intervention/waiting list control, Outcome 10 Subgroup analysis (fixed‐effect model): mode of delivery ‐ impact of tinnitus on quality of life at end of treatment.
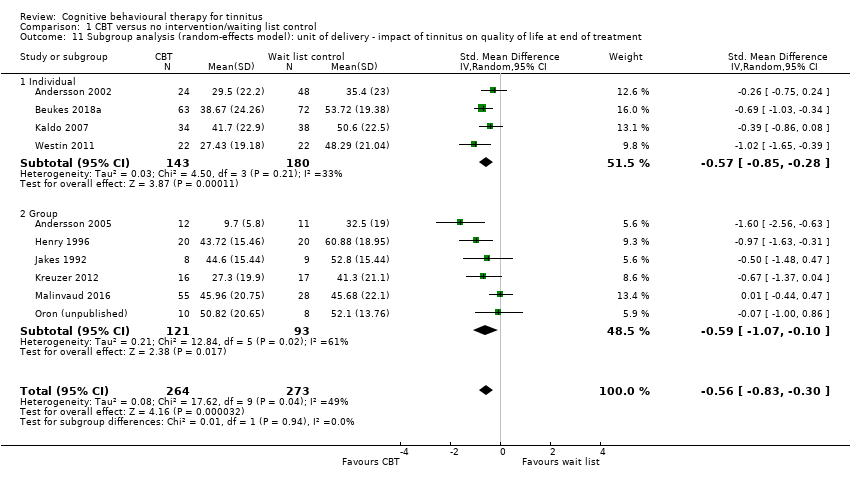
Comparison 1 CBT versus no intervention/waiting list control, Outcome 11 Subgroup analysis (random‐effects model): unit of delivery ‐ impact of tinnitus on quality of life at end of treatment.
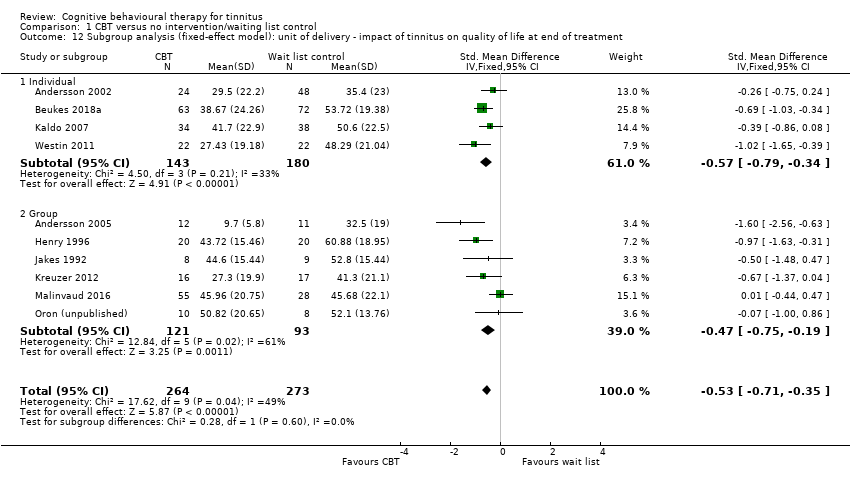
Comparison 1 CBT versus no intervention/waiting list control, Outcome 12 Subgroup analysis (fixed‐effect model): unit of delivery ‐ impact of tinnitus on quality of life at end of treatment.
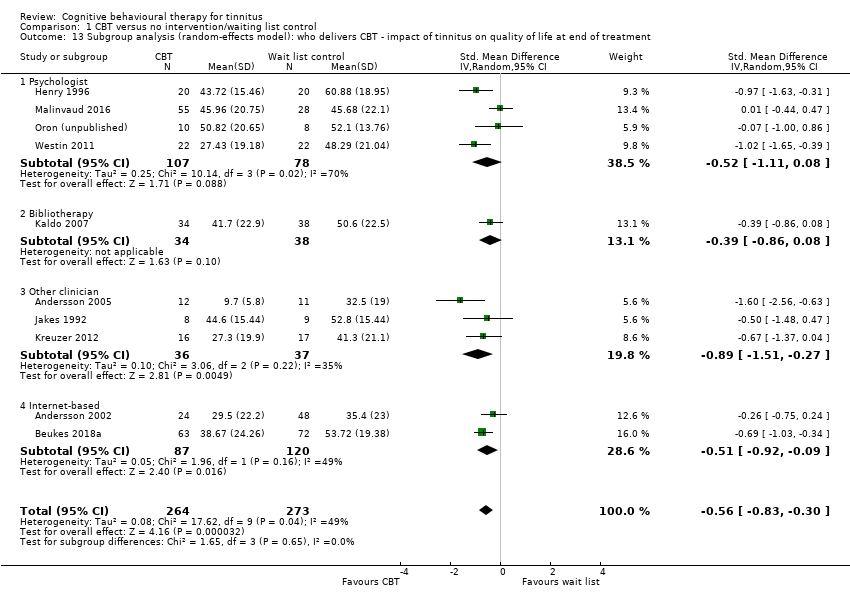
Comparison 1 CBT versus no intervention/waiting list control, Outcome 13 Subgroup analysis (random‐effects model): who delivers CBT ‐ impact of tinnitus on quality of life at end of treatment.

Comparison 1 CBT versus no intervention/waiting list control, Outcome 14 Subgroup analysis (fixed‐effect model): who delivers CBT ‐ impact of tinnitus on quality of life at end of treatment.

Comparison 1 CBT versus no intervention/waiting list control, Outcome 15 Sensitivity analysis without Malinvaud (high risk of bias) impact of tinnitus on quality of life at end of treatment.

Comparison 1 CBT versus no intervention/waiting list control, Outcome 16 Sensitivity analysis with optimistic assumption for Malinvaud ‐ impact of tinnitus on quality of life at end of treatment.

Comparison 2 CBT versus audiological care (tinnitus education and rehabilitation for hearing loss), Outcome 1 Impact of tinnitus on quality of life at end of treatment.

Comparison 2 CBT versus audiological care (tinnitus education and rehabilitation for hearing loss), Outcome 2 Serious adverse effects at end of treatment.

Comparison 2 CBT versus audiological care (tinnitus education and rehabilitation for hearing loss), Outcome 3 Depression at end of treatment.

Comparison 2 CBT versus audiological care (tinnitus education and rehabilitation for hearing loss), Outcome 4 Anxiety at end of treatment.

Comparison 2 CBT versus audiological care (tinnitus education and rehabilitation for hearing loss), Outcome 5 Health‐related quality of life.

Comparison 2 CBT versus audiological care (tinnitus education and rehabilitation for hearing loss), Outcome 6 Negatively biased interpretations of tinnitus.

Comparison 2 CBT versus audiological care (tinnitus education and rehabilitation for hearing loss), Outcome 7 Sensitivity analysis (fixed‐effect model): impact of tinnitus on quality of life.
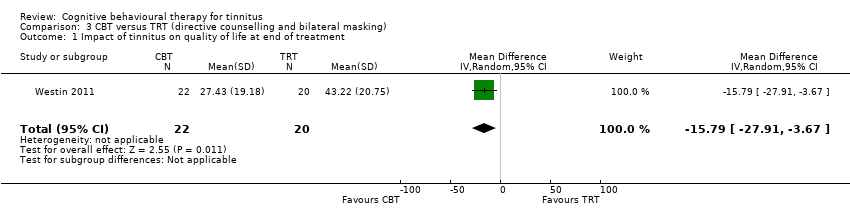
Comparison 3 CBT versus TRT (directive counselling and bilateral masking), Outcome 1 Impact of tinnitus on quality of life at end of treatment.

Comparison 3 CBT versus TRT (directive counselling and bilateral masking), Outcome 2 Impact of tinnitus on quality of life at 6 months follow‐up.
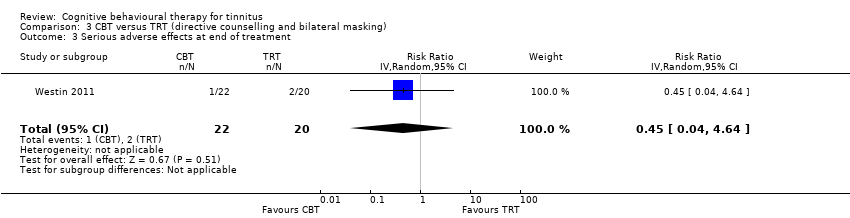
Comparison 3 CBT versus TRT (directive counselling and bilateral masking), Outcome 3 Serious adverse effects at end of treatment.
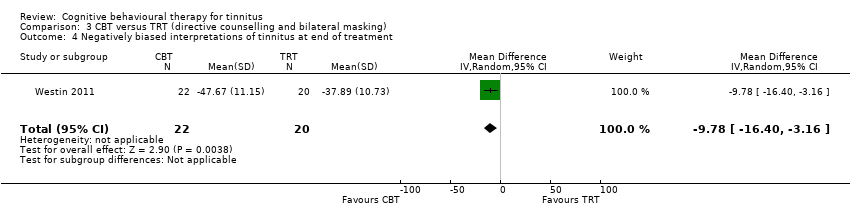
Comparison 3 CBT versus TRT (directive counselling and bilateral masking), Outcome 4 Negatively biased interpretations of tinnitus at end of treatment.

Comparison 3 CBT versus TRT (directive counselling and bilateral masking), Outcome 5 Negatively biased interpretations of tinnitus at 6 months follow‐up.

Comparison 4 CBT versus other active control, Outcome 1 Impact of tinnitus on quality of life at end of treatment.

Comparison 4 CBT versus other active control, Outcome 2 Impact of tinnitus on quality of life at 6 months follow‐up.
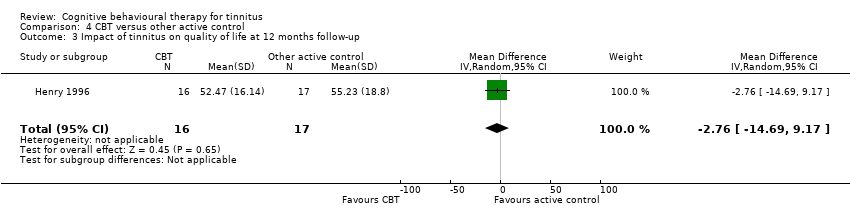
Comparison 4 CBT versus other active control, Outcome 3 Impact of tinnitus on quality of life at 12 months follow‐up.
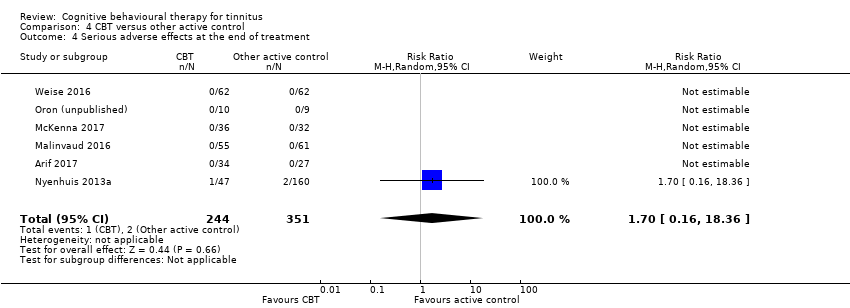
Comparison 4 CBT versus other active control, Outcome 4 Serious adverse effects at the end of treatment.

Comparison 4 CBT versus other active control, Outcome 5 Depression at end of treatment.
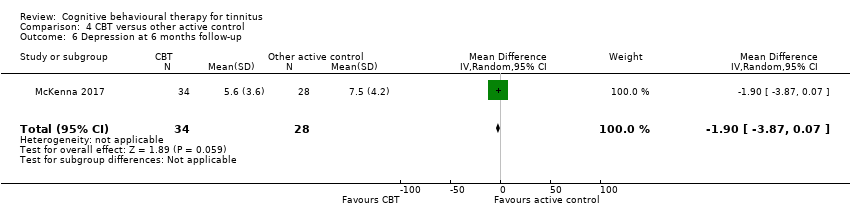
Comparison 4 CBT versus other active control, Outcome 6 Depression at 6 months follow‐up.
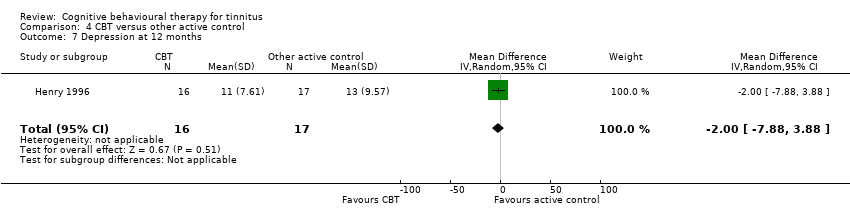
Comparison 4 CBT versus other active control, Outcome 7 Depression at 12 months.

Comparison 4 CBT versus other active control, Outcome 8 Anxiety at end of treatment.

Comparison 4 CBT versus other active control, Outcome 9 Anxiety at 6 months follow‐up.

Comparison 4 CBT versus other active control, Outcome 10 Health‐related quality of life at end of treatment.
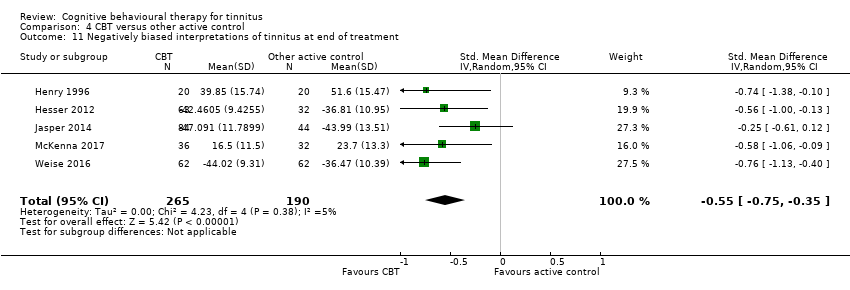
Comparison 4 CBT versus other active control, Outcome 11 Negatively biased interpretations of tinnitus at end of treatment.

Comparison 4 CBT versus other active control, Outcome 12 Negatively biased interpretations of tinnitus at 6 months follow‐up.

Comparison 4 CBT versus other active control, Outcome 13 Negatively biased interpretations of tinnitus at 12 months follow‐up.

Comparison 4 CBT versus other active control, Outcome 14 Subgroup analysis (random‐effects model): type of therapy ‐ impact of tinnitus on quality of life.

Comparison 4 CBT versus other active control, Outcome 15 Subgroup analysis (fixed‐effect model): type of therapy ‐ impact of tinnitus on quality of life.

Comparison 4 CBT versus other active control, Outcome 16 Subgroup analysis: mode of delivery ‐ impact of tinnitus on quality of life.
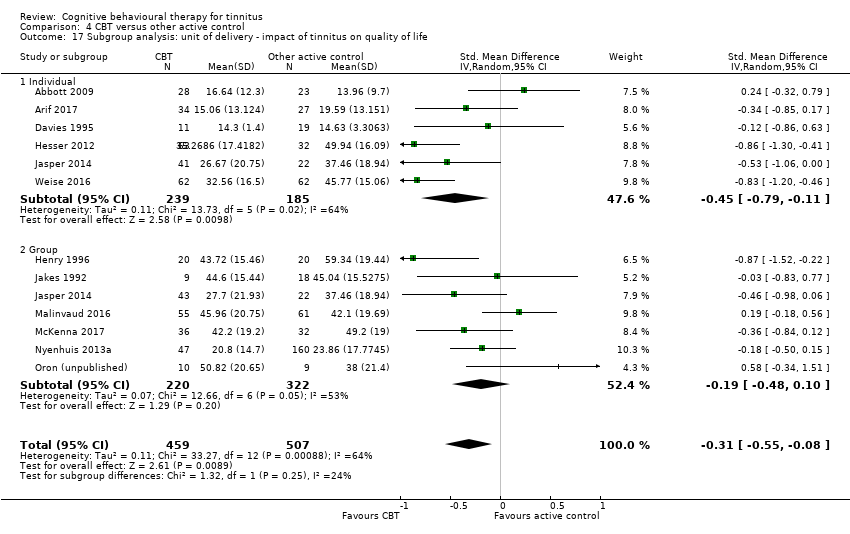
Comparison 4 CBT versus other active control, Outcome 17 Subgroup analysis: unit of delivery ‐ impact of tinnitus on quality of life.
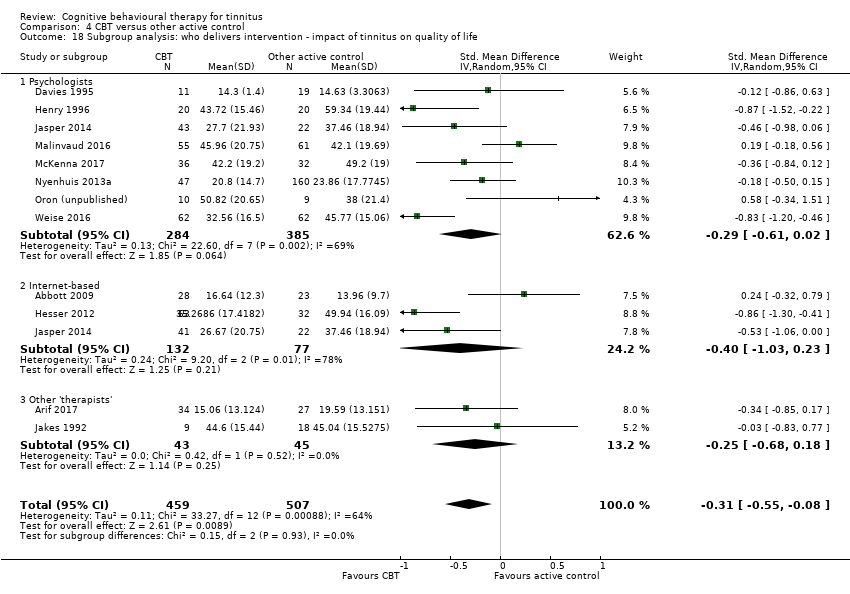
Comparison 4 CBT versus other active control, Outcome 18 Subgroup analysis: who delivers intervention ‐ impact of tinnitus on quality of life.

Comparison 4 CBT versus other active control, Outcome 19 Subgroup analysis: type of control ‐ impact of tinnitus on quality of life.

Comparison 4 CBT versus other active control, Outcome 20 Sensitivity analysis (fixed‐effect model): impact of tinnitus on quality of life at end of treatment.

Comparison 4 CBT versus other active control, Outcome 21 Sensitivity analysis: without studies at high risk of bias for incomplete outcome data ‐ impact of tinnitus on quality of life.

Comparison 4 CBT versus other active control, Outcome 22 Sensitivity analysis: without high risk of bias of missing outcome data, by subgroups (random‐effects model): type of therapy ‐ impact of tinnitus on quality of life.
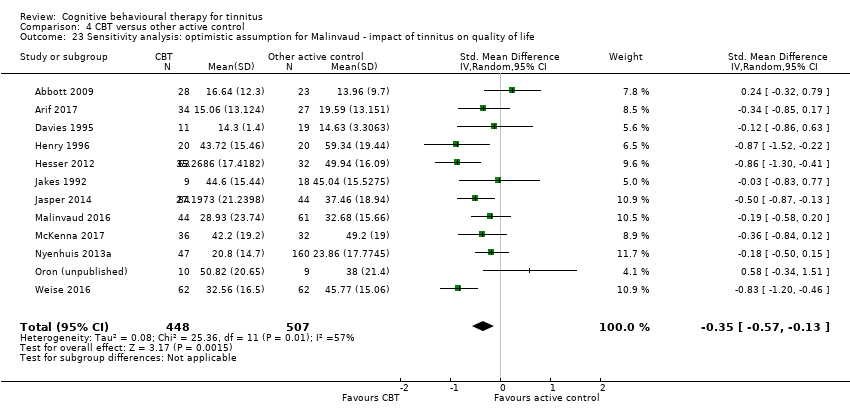
Comparison 4 CBT versus other active control, Outcome 23 Sensitivity analysis: optimistic assumption for Malinvaud ‐ impact of tinnitus on quality of life.

Comparison 4 CBT versus other active control, Outcome 24 Sensitivity analysis: optimistic assumption for Malinvaud ‐ depression.

Comparison 4 CBT versus other active control, Outcome 25 Sensitivity analysis: optimistic assumption for Malinvaud ‐ anxiety.
| CBT compared to no intervention/waiting list control for tinnitus at end of treatment | ||||||
| Patient or population: adults with tinnitus | ||||||
| Outcomes at end of treatment | Anticipated absolute effects* (95% CI) | Relative effect | № of participants | Certainty of the evidence | Comments | |
| Risk with no intervention/waiting list control | Risk with CBT | |||||
| Impact of tinnitus on quality of life at treatment end Assessed with: TFI, | — | SMD 0.56 lower | — | 537 | ⊕⊕⊝⊝ | CBT may reduce the impact of tinnitus on quality of life at treatment end. The SMD can be interpreted as the THI score in the CBT group being on average 10.91 points lower than in the no intervention/waiting list control group. (The minimal clinically important change score has been estimated to be 7 points on the THI). |
| Serious adverse effects at end of treatment | Study population | RR 3.00 | 447 | ⊕⊕⊕⊝ | One participant allocated to CBT deteriorated. However, the deterioration in symptoms occurred between two assessments prior to the intervention commencing but was still detectable at end of treatment. CBT probably results in little or no difference in adverse effects. | |
| 0 per 1000 | 0 per 1000 | |||||
| Depression at end of treatment | — | SMD 0.34 lower | — | 502 | ⊕⊕⊝⊝ | CBT may result in a slight reduction in depression at end of treatment. |
| Anxiety at end of treatment | — | SMD 0.45 lower | — | 429 | ⊕⊝⊝⊝ | The evidence is very uncertain about whether CBT reduces anxiety at end of treatment. |
| Health‐related quality of life | — | SMD 0.38 lower | — | 179 | ⊕⊝⊝⊝ | The evidence is very uncertain about whether CBT improves health‐related quality of life. |
| Negatively biased interpretations of tinnitus | — | SMD 0.4 lower | — | 84 | ⊕⊝⊝⊝ | The evidence is very uncertain about whether CBT reduces negatively biased interpretations of tinnitus. |
| Other adverse effects | No adverse effects occurred. | — | 447 | ⊕⊕⊕⊝ | — | |
| *The risk in the intervention group (and its 95% confidence interval) is based on the assumed risk in the comparison group and the relative effect of the intervention (and its 95% CI). | ||||||
| GRADE Working Group grades of evidence | ||||||
| 1Downgraded one level due to study limitations (risk of bias): all studies included for this outcome were judged to be either unclear or at high risk of performance bias due to an absence of blinding of participants and personnel. | ||||||
| CBT compared to audiological care (tinnitus education and rehabilitation for hearing loss) for tinnitus at end of treatment | ||||||
| Patient or population: adults with tinnitus | ||||||
| Outcomes at end of treatment | Anticipated absolute effects* (95% CI) | Relative effect | № of participants | Certainty of the evidence | Comments | |
| Risk with audiological care (tinnitus education and rehabilitation for hearing loss) | Risk with CBT | |||||
| Impact of tinnitus on quality of life | 34.14 | MD 5.65 lower | — | 430 | ⊕⊕⊕⊝ | The MD is reported here because the 3 studies all reported outcome data from the THI. CBT probably reduces the impact of tinnitus on quality of life when compared with audiological care. |
| Serious adverse effects | No serious adverse effects occurred. | — | 410 | ⊕⊕⊕⊝ | Meta‐analysis was not conducted for this outcome. | |
| Depression at end of treatment | — | SMD 0.18 lower | — | 410 | ⊕⊕⊝⊝ | CBT may slightly reduce depression at end of treatment when compared with audiological care. |
| Anxiety at end of treatment | — | SMD 0.06 lower | — | 410 | ⊕⊕⊝⊝ | CBT may result in little to no difference in anxiety at end of treatment when compared with audiological care. |
| Health‐related quality of life | — | SMD 0.07 lower | — | 410 | ⊕⊕⊝⊝ | CBT may result in little to no difference in health‐related quality of life when compared with audiological care. |
| Negatively biased interpretations of tinnitus | At end of treatment TCS scores had decreased from a mean of 21. 42 (SD 12.56) to 17.14 (SD 11.54). | At end of treatment TCS scores had decreased from a mean of 20.89 (SD 11.83) to 12.45 (10.30). | — | 336 | ⊕⊕⊝⊝ | CBT may reduce negatively biased interpretations of tinnitus when compared with audiological care. |
| Other adverse effects | No adverse effects occurred. | — | 410 | ⊕⊕⊕⊝ | — | |
| *The risk in the intervention group (and its 95% confidence interval) is based on the assumed risk in the comparison group and the relative effect of the intervention (and its 95% CI). The assumed risk score in the comparison group (34.14) was obtained from the median control group score from the largest study (Cima 2012) in this comparison. | ||||||
| GRADE Working Group grades of evidence | ||||||
| 1Downgraded one level due to study limitations (risk of bias): all studies included for this outcome were judged to be either unclear or at high risk of performance bias due to an absence of blinding of participants and personnel. 2Downgraded by one level due to imprecision: the confidence intervals cross the line of no effect. 3Downgraded one level due to study limitations (risk of bias): performance and detection bias judged as unclear. 4Downgraded one level due to imprecision: small sample size. | ||||||
| CBT compared to TRT (directive counselling and bilateral masking) for tinnitus at end of treatment | ||||||
| Patient or population: adults with tinnitus | ||||||
| Outcomes at end of treatment | Anticipated absolute effects* (95% CI) | Relative effect | № of participants | Certainty of the evidence | Comments | |
| Risk with TRT (directive counselling and bilateral masking) | Risk with CBT | |||||
| Impact of tinnitus on quality of life | At 10 weeks the THI score had decreased from an average of 47.00 (SD 18.19) to an average of 43.22 (SD 20.75). | At 10 weeks the THI score had decreased from an average of 45.27 (SD 14.99) to an average of 27.43 (19.18). | — | 42 | ⊕⊕⊝⊝ | CBT may reduce the impact of tinnitus on quality of life compared with TRT. |
| Serious adverse effects | Study population | RR 0.45 | 42 | ⊕⊕⊝⊝ | Three participants deteriorated over the course of the study: 1 participant was from the intervention group (ACT; n = 22) and 2 participants were from the comparison group (TRT; n = 20). | |
| 100 per 1000 | 45 per 1000 | |||||
| Depression Assessed with: HADS‐D | At 10 weeks the HADS‐D scores had decreased from a mean of 5.80 (SD 3.79) to 5.78 (SD 3.73). | At 10 weeks the HADS‐D scores had decreased from a mean of 4.05 (SD 3.06) to 3.20 (SD 3.47). | — | 42 | ⊕⊕⊝⊝ | We are uncertain whether CBT reduces depression compared with TRT. |
| Anxiety | At 10 weeks the HADS‐A scores had decreased from a mean of 8.2 (SD 3.75) to 7.0 (SD 4.20). | At 10 weeks the HADS‐A scores had decreased from a mean of 6.24 (SD 4.00) to 3.6 (SD 3.14). | — | 42 | ⊕⊕⊝⊝ | We are uncertain whether CBT reduces anxiety compared with TRT. |
| Health‐related quality of life | At 10 weeks QoLI scores had increased from a mean of 2.24 (SD 1.42) to 2.47 (SD 1.72). | At 10 weeks QoLI scores had increased from a mean of 2.43 (SD 1.30) to 2.78 (SD 1.53). | — | 42 | ⊕⊕⊝⊝ | We are uncertain whether CBT improves health‐related quality of life compared with TRT. |
| Negatively biased interpretations of tinnitus | At 10 weeks TAQ scores had increased from a mean of 36.65 (9.96) to 37.89 (SD 10.73). | At 10 weeks TAQ scores had increased from a mean of 41.05 (SD 9.49) to 47.67 (SD 11.15). | — | 42 | ⊕⊕⊝⊝ | CBT may reduce negatively biased interpretations of tinnitus compared with TRT. |
| Other adverse effects | No other adverse effects were reported. | — | 42 | ⊕⊕⊝⊝ | — | |
| *The risk in the intervention group (and its 95% confidence interval) is based on the assumed risk in the comparison group and the relative effect of the intervention (and its 95% CI). | ||||||
| GRADE Working Group grades of evidence | ||||||
| 1Downgraded one level due to study limitations (risk of bias). There was high risk of bias associated with allocation concealment and unclear risk of bias for performance, detection and attrition bias respectively. 2Downgraded one level due to imprecision: small sample size. | ||||||
| CBT compared to other experimental control for tinnitus | ||||||
| Patient or population: adults with tinnitus | ||||||
| Outcomes at end of treatment | Anticipated absolute effects* (95% CI) | Relative effect | № of participants | Certainty of the evidence | Comments | |
| Risk with other experimental control | Risk with CBT | |||||
| Impact of tinnitus on quality of life at end of treatment | — | SMD 0.30 lower | — | 966 | ⊕⊕⊝⊝ | CBT may reduce the impact of tinnitus on quality of life when compared with other treatments. The SMD can be interpreted as the THI score in the CBT group being on average 5.84 points lower than in the other experimental control group. (The minimal clinically important change score has been estimated to be 7 points on the THI). |
| Serious adverse effects | Study population | RR 1.70 | 595 | ⊕⊕⊝⊝ | Three participants deteriorated according to reliable change calculations using the TQ; 1 was from the group CBT intervention and 2 received "information only" control. | |
| 6 per 1000 | 10 per 1000 | |||||
| Depression at end of treatment | — | SMD 0.17 lower | — | 943 | ⊕⊕⊝⊝ | CBT may reduce depression when compared with other treatments. |
| Anxiety at end of treatment | — | SMD 0.25 lower | — | 696 | ⊕⊕⊝⊝ | CBT may reduce anxiety when compared with other treatments. |
| Health‐related quality of life at end of treatment | By the end of treatment, the mean quality of life score increased from a mean of 1.98 (SD 1.58) to 2.27 (1.5). | By the end of treatment, the quality of life score had increased from a mean of 1.67 (SD 1.71) to 2.32 (SD 1.51). | — | 95 | ⊕⊝⊝⊝ | We are uncertain whether CBT improves health‐related quality of life compared with other treatments. |
| Negatively biased interpretations of tinnitus at end of treatment | — | SMD 0.55 lower | — | 455 | ⊕⊕⊕⊝ | CBT probably reduces negatively biased interpretations of tinnitus when compared with other treatments. |
| Other adverse effects | No other adverse effects reported. | — | 595 | ⊕⊕⊝⊝ | — | |
| *The risk in the intervention group (and its 95% confidence interval) is based on the assumed risk in the comparison group and the relative effect of the intervention (and its 95% CI). | ||||||
| GRADE Working Group grades of evidence | ||||||
| 1Downgraded one level due to study limitations (risk of bias): all studies included for this outcome were judged to be either unclear or at high risk of performance bias due to an absence of blinding of participants and personnel. | ||||||
| Outcome or subgroup title | No. of studies | No. of participants | Statistical method | Effect size |
| 1 Impact of tinnitus on quality of life at end of treatment Show forest plot | 10 | 537 | Std. Mean Difference (IV, Random, 95% CI) | ‐0.56 [‐0.83, ‐0.30] |
| 2 Serious adverse effects at end of treatment Show forest plot | 7 | 447 | Risk Ratio (IV, Random, 95% CI) | 3.00 [0.13, 69.87] |
| 3 Depression at end of treatment Show forest plot | 8 | 502 | Std. Mean Difference (IV, Random, 95% CI) | ‐0.34 [‐0.60, ‐0.08] |
| 4 Anxiety at end of treatment Show forest plot | 6 | 429 | Std. Mean Difference (IV, Random, 95% CI) | ‐0.45 [‐0.82, ‐0.09] |
| 5 Health‐related quality of life at end of treatment Show forest plot | 2 | 179 | Std. Mean Difference (IV, Random, 95% CI) | ‐0.38 [‐0.67, ‐0.08] |
| 6 Negatively biased interpretations of tinnitus at end of treatment Show forest plot | 2 | 84 | Std. Mean Difference (IV, Random, 95% CI) | ‐0.40 [‐1.25, 0.45] |
| 7 Subgroup analysis (random‐effects model): type of therapy ‐ impact of tinnitus on quality of life at end of treatment Show forest plot | 10 | 537 | Std. Mean Difference (IV, Random, 95% CI) | ‐0.56 [‐0.83, ‐0.30] |
| 7.1 CBT | 6 | 402 | Std. Mean Difference (IV, Random, 95% CI) | ‐0.47 [‐0.81, ‐0.13] |
| 7.2 ACT | 2 | 62 | Std. Mean Difference (IV, Random, 95% CI) | ‐0.61 [‐1.53, 0.32] |
| 7.3 Cognitive therapy | 1 | 40 | Std. Mean Difference (IV, Random, 95% CI) | ‐0.97 [‐1.63, ‐0.31] |
| 7.4 Mindfulness | 1 | 33 | Std. Mean Difference (IV, Random, 95% CI) | ‐0.67 [‐1.37, 0.04] |
| 8 Subgroup analysis (fixed‐effect model): type of therapy ‐ impact of tinnitus on quality of life at end of treatment Show forest plot | 10 | 537 | Std. Mean Difference (IV, Fixed, 95% CI) | ‐0.53 [‐0.71, ‐0.35] |
| 8.1 CBT | 6 | 402 | Std. Mean Difference (IV, Fixed, 95% CI) | ‐0.45 [‐0.65, ‐0.24] |
| 8.2 ACT | 2 | 62 | Std. Mean Difference (IV, Fixed, 95% CI) | ‐0.72 [‐1.24, ‐0.20] |
| 8.3 Cognitive therapy | 1 | 40 | Std. Mean Difference (IV, Fixed, 95% CI) | ‐0.97 [‐1.63, ‐0.31] |
| 8.4 Mindfulness | 1 | 33 | Std. Mean Difference (IV, Fixed, 95% CI) | ‐0.67 [‐1.37, 0.04] |
| 9 Subgroup analysis (random‐effects model): mode of delivery ‐ impact of tinnitus on quality of life at end of treatment Show forest plot | 10 | 537 | Std. Mean Difference (IV, Random, 95% CI) | ‐0.56 [‐0.83, ‐0.30] |
| 9.1 Bibliotherapy | 1 | 72 | Std. Mean Difference (IV, Random, 95% CI) | ‐0.39 [‐0.86, 0.08] |
| 9.2 Face‐to‐face | 7 | 258 | Std. Mean Difference (IV, Random, 95% CI) | ‐0.66 [‐1.09, ‐0.22] |
| 9.3 Internet‐based CBT | 2 | 207 | Std. Mean Difference (IV, Random, 95% CI) | ‐0.51 [‐0.92, ‐0.09] |
| 10 Subgroup analysis (fixed‐effect model): mode of delivery ‐ impact of tinnitus on quality of life at end of treatment Show forest plot | 10 | 537 | Std. Mean Difference (IV, Fixed, 95% CI) | ‐0.53 [‐0.71, ‐0.35] |
| 10.1 Bibliotherapy | 1 | 72 | Std. Mean Difference (IV, Fixed, 95% CI) | ‐0.39 [‐0.86, 0.08] |
| 10.2 Face‐to‐face | 7 | 258 | Std. Mean Difference (IV, Fixed, 95% CI) | ‐0.56 [‐0.82, ‐0.30] |
| 10.3 Web‐based CBT | 2 | 207 | Std. Mean Difference (IV, Fixed, 95% CI) | ‐0.54 [‐0.83, ‐0.26] |
| 11 Subgroup analysis (random‐effects model): unit of delivery ‐ impact of tinnitus on quality of life at end of treatment Show forest plot | 10 | 537 | Std. Mean Difference (IV, Random, 95% CI) | ‐0.56 [‐0.83, ‐0.30] |
| 11.1 Individual | 4 | 323 | Std. Mean Difference (IV, Random, 95% CI) | ‐0.57 [‐0.85, ‐0.28] |
| 11.2 Group | 6 | 214 | Std. Mean Difference (IV, Random, 95% CI) | ‐0.59 [‐1.07, ‐0.10] |
| 12 Subgroup analysis (fixed‐effect model): unit of delivery ‐ impact of tinnitus on quality of life at end of treatment Show forest plot | 10 | 537 | Std. Mean Difference (IV, Fixed, 95% CI) | ‐0.53 [‐0.71, ‐0.35] |
| 12.1 Individual | 4 | 323 | Std. Mean Difference (IV, Fixed, 95% CI) | ‐0.57 [‐0.79, ‐0.34] |
| 12.2 Group | 6 | 214 | Std. Mean Difference (IV, Fixed, 95% CI) | ‐0.47 [‐0.75, ‐0.19] |
| 13 Subgroup analysis (random‐effects model): who delivers CBT ‐ impact of tinnitus on quality of life at end of treatment Show forest plot | 10 | 537 | Std. Mean Difference (IV, Random, 95% CI) | ‐0.56 [‐0.83, ‐0.30] |
| 13.1 Psychologist | 4 | 185 | Std. Mean Difference (IV, Random, 95% CI) | ‐0.52 [‐1.11, 0.08] |
| 13.2 Bibliotherapy | 1 | 72 | Std. Mean Difference (IV, Random, 95% CI) | ‐0.39 [‐0.86, 0.08] |
| 13.3 Other clinician | 3 | 73 | Std. Mean Difference (IV, Random, 95% CI) | ‐0.89 [‐1.51, ‐0.27] |
| 13.4 Internet‐based | 2 | 207 | Std. Mean Difference (IV, Random, 95% CI) | ‐0.51 [‐0.92, ‐0.09] |
| 14 Subgroup analysis (fixed‐effect model): who delivers CBT ‐ impact of tinnitus on quality of life at end of treatment Show forest plot | 10 | 537 | Std. Mean Difference (IV, Fixed, 95% CI) | ‐0.53 [‐0.71, ‐0.35] |
| 14.1 Psychologist | 4 | 185 | Std. Mean Difference (IV, Fixed, 95% CI) | ‐0.45 [‐0.75, ‐0.14] |
| 14.2 Other clinician | 3 | 73 | Std. Mean Difference (IV, Fixed, 95% CI) | ‐0.87 [‐1.36, ‐0.38] |
| 14.3 Computer | 3 | 279 | Std. Mean Difference (IV, Fixed, 95% CI) | ‐0.50 [‐0.74, ‐0.26] |
| 15 Sensitivity analysis without Malinvaud (high risk of bias) impact of tinnitus on quality of life at end of treatment Show forest plot | 9 | 454 | Std. Mean Difference (IV, Random, 95% CI) | ‐0.64 [‐0.88, ‐0.40] |
| 16 Sensitivity analysis with optimistic assumption for Malinvaud ‐ impact of tinnitus on quality of life at end of treatment Show forest plot | 10 | 526 | Std. Mean Difference (IV, Random, 95% CI) | ‐0.65 [‐0.85, ‐0.44] |
| Outcome or subgroup title | No. of studies | No. of participants | Statistical method | Effect size |
| 1 Impact of tinnitus on quality of life at end of treatment Show forest plot | 3 | 444 | Mean Difference (IV, Random, 95% CI) | ‐5.68 [‐9.74, ‐1.61] |
| 2 Serious adverse effects at end of treatment Show forest plot | 2 | 410 | Risk Ratio (M‐H, Fixed, 95% CI) | 0.0 [0.0, 0.0] |
| 3 Depression at end of treatment Show forest plot | 2 | 410 | Std. Mean Difference (IV, Random, 95% CI) | ‐0.18 [‐0.38, 0.01] |
| 4 Anxiety at end of treatment Show forest plot | 2 | 410 | Std. Mean Difference (IV, Random, 95% CI) | ‐0.06 [‐0.26, 0.13] |
| 5 Health‐related quality of life Show forest plot | 2 | 410 | Std. Mean Difference (IV, Random, 95% CI) | ‐0.07 [‐0.26, 0.13] |
| 6 Negatively biased interpretations of tinnitus Show forest plot | 1 | 336 | Mean Difference (IV, Random, 95% CI) | ‐4.69 [‐7.04, ‐2.34] |
| 7 Sensitivity analysis (fixed‐effect model): impact of tinnitus on quality of life Show forest plot | 3 | 430 | Mean Difference (IV, Fixed, 95% CI) | ‐5.65 [‐9.79, ‐1.50] |
| Outcome or subgroup title | No. of studies | No. of participants | Statistical method | Effect size |
| 1 Impact of tinnitus on quality of life at end of treatment Show forest plot | 1 | 42 | Mean Difference (IV, Random, 95% CI) | ‐15.79 [‐27.91, ‐3.67] |
| 2 Impact of tinnitus on quality of life at 6 months follow‐up Show forest plot | 1 | 42 | Mean Difference (IV, Random, 95% CI) | ‐13.10 [‐26.08, ‐0.12] |
| 3 Serious adverse effects at end of treatment Show forest plot | 1 | 42 | Risk Ratio (IV, Random, 95% CI) | 0.45 [0.04, 4.64] |
| 4 Negatively biased interpretations of tinnitus at end of treatment Show forest plot | 1 | 42 | Mean Difference (IV, Random, 95% CI) | ‐9.78 [‐16.40, ‐3.16] |
| 5 Negatively biased interpretations of tinnitus at 6 months follow‐up Show forest plot | 1 | 42 | Mean Difference (IV, Random, 95% CI) | ‐8.28 [‐15.34, ‐1.22] |
| Outcome or subgroup title | No. of studies | No. of participants | Statistical method | Effect size |
| 1 Impact of tinnitus on quality of life at end of treatment Show forest plot | 12 | 966 | Std. Mean Difference (IV, Random, 95% CI) | ‐0.30 [‐0.55, ‐0.05] |
| 2 Impact of tinnitus on quality of life at 6 months follow‐up Show forest plot | 1 | 62 | Mean Difference (IV, Random, 95% CI) | ‐11.80 [‐23.06, ‐0.54] |
| 3 Impact of tinnitus on quality of life at 12 months follow‐up Show forest plot | 1 | 33 | Mean Difference (IV, Random, 95% CI) | ‐2.76 [‐14.69, 9.17] |
| 4 Serious adverse effects at the end of treatment Show forest plot | 6 | 595 | Risk Ratio (M‐H, Random, 95% CI) | 1.70 [0.16, 18.36] |
| 5 Depression at end of treatment Show forest plot | 11 | 943 | Std. Mean Difference (IV, Random, 95% CI) | ‐0.17 [‐0.33, ‐0.01] |
| 6 Depression at 6 months follow‐up Show forest plot | 1 | 62 | Mean Difference (IV, Random, 95% CI) | ‐1.90 [‐3.87, 0.07] |
| 7 Depression at 12 months Show forest plot | 1 | 33 | Mean Difference (IV, Random, 95% CI) | ‐2.0 [‐7.88, 3.88] |
| 8 Anxiety at end of treatment Show forest plot | 9 | 696 | Std. Mean Difference (IV, Random, 95% CI) | ‐0.25 [‐0.48, ‐0.02] |
| 9 Anxiety at 6 months follow‐up Show forest plot | 1 | 62 | Mean Difference (IV, Random, 95% CI) | ‐1.20 [‐3.07, 0.67] |
| 10 Health‐related quality of life at end of treatment Show forest plot | 1 | 95 | Mean Difference (IV, Random, 95% CI) | ‐0.05 [‐0.68, 0.59] |
| 11 Negatively biased interpretations of tinnitus at end of treatment Show forest plot | 5 | 455 | Std. Mean Difference (IV, Random, 95% CI) | ‐0.55 [‐0.75, ‐0.35] |
| 12 Negatively biased interpretations of tinnitus at 6 months follow‐up Show forest plot | 1 | 62 | Mean Difference (IV, Random, 95% CI) | ‐7.20 [‐13.65, ‐0.75] |
| 13 Negatively biased interpretations of tinnitus at 12 months follow‐up Show forest plot | 1 | 33 | Mean Difference (IV, Random, 95% CI) | ‐14.05 [‐24.80, ‐3.30] |
| 14 Subgroup analysis (random‐effects model): type of therapy ‐ impact of tinnitus on quality of life Show forest plot | 12 | 966 | Std. Mean Difference (IV, Random, 95% CI) | ‐0.30 [‐0.55, ‐0.05] |
| 14.1 CBT | 5 | 626 | Std. Mean Difference (IV, Random, 95% CI) | ‐0.23 [‐0.62, 0.15] |
| 14.2 Cognitive therapy | 3 | 97 | Std. Mean Difference (IV, Random, 95% CI) | ‐0.38 [‐0.92, 0.17] |
| 14.3 ACT | 2 | 114 | Std. Mean Difference (IV, Random, 95% CI) | ‐0.20 [‐1.60, 1.21] |
| 14.4 Mindfulness | 2 | 129 | Std. Mean Difference (IV, Random, 95% CI) | ‐0.35 [‐0.70, ‐0.00] |
| 15 Subgroup analysis (fixed‐effect model): type of therapy ‐ impact of tinnitus on quality of life Show forest plot | 12 | 966 | Std. Mean Difference (IV, Fixed, 95% CI) | ‐0.33 [‐0.46, ‐0.19] |
| 15.1 CBT | 5 | 626 | Std. Mean Difference (IV, Fixed, 95% CI) | ‐0.27 [‐0.44, ‐0.10] |
| 15.2 Cognitive therapy | 3 | 97 | Std. Mean Difference (IV, Fixed, 95% CI) | ‐0.40 [‐0.82, 0.02] |
| 15.3 ACT | 2 | 114 | Std. Mean Difference (IV, Fixed, 95% CI) | ‐0.59 [‐0.99, ‐0.19] |
| 15.4 Mindfulness | 2 | 129 | Std. Mean Difference (IV, Fixed, 95% CI) | ‐0.35 [‐0.70, ‐0.00] |
| 16 Subgroup analysis: mode of delivery ‐ impact of tinnitus on quality of life Show forest plot | 12 | 966 | Std. Mean Difference (IV, Random, 95% CI) | ‐0.31 [‐0.55, ‐0.08] |
| 16.1 Face‐to‐face | 9 | 633 | Std. Mean Difference (IV, Random, 95% CI) | ‐0.20 [‐0.43, 0.03] |
| 16.2 Internet‐based CBT | 4 | 333 | Std. Mean Difference (IV, Random, 95% CI) | ‐0.52 [‐0.98, ‐0.07] |
| 17 Subgroup analysis: unit of delivery ‐ impact of tinnitus on quality of life Show forest plot | 12 | 966 | Std. Mean Difference (IV, Random, 95% CI) | ‐0.31 [‐0.55, ‐0.08] |
| 17.1 Individual | 6 | 424 | Std. Mean Difference (IV, Random, 95% CI) | ‐0.45 [‐0.79, ‐0.11] |
| 17.2 Group | 7 | 542 | Std. Mean Difference (IV, Random, 95% CI) | ‐0.19 [‐0.48, 0.10] |
| 18 Subgroup analysis: who delivers intervention ‐ impact of tinnitus on quality of life Show forest plot | 12 | 966 | Std. Mean Difference (IV, Random, 95% CI) | ‐0.31 [‐0.55, ‐0.08] |
| 18.1 Psychologists | 8 | 669 | Std. Mean Difference (IV, Random, 95% CI) | ‐0.29 [‐0.61, 0.02] |
| 18.2 Internet‐based | 3 | 209 | Std. Mean Difference (IV, Random, 95% CI) | ‐0.40 [‐1.03, 0.23] |
| 18.3 Other 'therapists' | 2 | 88 | Std. Mean Difference (IV, Random, 95% CI) | ‐0.25 [‐0.68, 0.18] |
| 19 Subgroup analysis: type of control ‐ impact of tinnitus on quality of life Show forest plot | 12 | 965 | Std. Mean Difference (IV, Random, 95% CI) | ‐0.30 [‐0.54, ‐0.06] |
| 19.1 Information | 3 | 171 | Std. Mean Difference (IV, Random, 95% CI) | ‐0.32 [‐0.91, 0.27] |
| 19.2 Coping effectiveness training | 1 | 19 | Std. Mean Difference (IV, Random, 95% CI) | 0.58 [‐0.34, 1.51] |
| 19.3 Relaxation | 3 | 159 | Std. Mean Difference (IV, Random, 95% CI) | ‐0.31 [‐0.63, 0.01] |
| 19.4 Discussion forum | 3 | 347 | Std. Mean Difference (IV, Random, 95% CI) | ‐0.72 [‐0.95, ‐0.49] |
| 19.5 Masking | 1 | 27 | Std. Mean Difference (IV, Random, 95% CI) | ‐0.03 [‐0.83, 0.77] |
| 19.6 Virtual reality | 1 | 116 | Std. Mean Difference (IV, Random, 95% CI) | 0.19 [‐0.18, 0.56] |
| 19.7 Self‐help | 1 | 126 | Std. Mean Difference (IV, Random, 95% CI) | ‐0.06 [‐0.52, 0.39] |
| 20 Sensitivity analysis (fixed‐effect model): impact of tinnitus on quality of life at end of treatment Show forest plot | 12 | 966 | Std. Mean Difference (IV, Fixed, 95% CI) | ‐0.33 [‐0.46, ‐0.19] |
| 21 Sensitivity analysis: without studies at high risk of bias for incomplete outcome data ‐ impact of tinnitus on quality of life Show forest plot | 9 | 770 | Std. Mean Difference (IV, Random, 95% CI) | ‐0.48 [‐0.71, ‐0.26] |
| 22 Sensitivity analysis: without high risk of bias of missing outcome data, by subgroups (random‐effects model): type of therapy ‐ impact of tinnitus on quality of life Show forest plot | 9 | 769 | Std. Mean Difference (IV, Random, 95% CI) | ‐0.45 [‐0.70, ‐0.21] |
| 22.1 CBT | 3 | 459 | Std. Mean Difference (IV, Random, 95% CI) | ‐0.49 [‐0.87, ‐0.12] |
| 22.2 Cognitive therapy | 2 | 67 | Std. Mean Difference (IV, Random, 95% CI) | ‐0.48 [‐1.31, 0.34] |
| 22.3 ACT | 2 | 114 | Std. Mean Difference (IV, Random, 95% CI) | ‐0.20 [‐1.60, 1.21] |
| 22.4 Mindfulness | 2 | 129 | Std. Mean Difference (IV, Random, 95% CI) | ‐0.35 [‐0.70, ‐0.00] |
| 23 Sensitivity analysis: optimistic assumption for Malinvaud ‐ impact of tinnitus on quality of life Show forest plot | 12 | 955 | Std. Mean Difference (IV, Random, 95% CI) | ‐0.35 [‐0.57, ‐0.13] |
| 24 Sensitivity analysis: optimistic assumption for Malinvaud ‐ depression Show forest plot | 11 | 921 | Std. Mean Difference (IV, Random, 95% CI) | ‐0.21 [‐0.34, ‐0.07] |
| 25 Sensitivity analysis: optimistic assumption for Malinvaud ‐ anxiety Show forest plot | 9 | 674 | Std. Mean Difference (IV, Random, 95% CI) | ‐0.28 [‐0.48, ‐0.09] |