Terapia cognitivoconductual para el tinnitus
Information
- DOI:
- https://doi.org/10.1002/14651858.CD012614.pub2Copy DOI

- Database:
-
- Cochrane Database of Systematic Reviews
- Version published:
-
- 08 January 2020see what's new
- Type:
-
- Intervention
- Stage:
-
- Review
- Cochrane Editorial Group:
-
Cochrane ENT Group
- Copyright:
-
- Copyright © 2020 The Cochrane Collaboration. Published by John Wiley & Sons, Ltd.
Article metrics
Altmetric:
Cited by:
Authors
Contributions of authors
The author contributions were as follows:
-
TF, RC and JWSV conceived and all authors contributed to the design of the study.
-
The Cochrane ENT Information Specialist developed and ran the search strategy.
-
TF obtained copies of the studies with the assistance of Maastricht University Library.
-
TF, RC and DH were responsible for the selection of studies.
-
TF, RC, BM and DH were responsible for data extraction.
-
TF, RC, BM and DH were responsible for assessing risk of bias.
-
TF entered data into RevMan.
-
TF, RC and DH, in consultation with Cochrane Methods Support Unit, conducted the analysis.
-
All authors contributed to the interpretation of the analysis.
-
TF drafted and revised the review and all authors commented critically on intellectual content.
-
All authors will contribute to the drafting and updating of the review.
Sources of support
Internal sources
-
No sources of support supplied
External sources
-
National Institute for Health Research, UK.
Infrastructure funding for Cochrane ENT
-
SWOL Limburgs Fonds voor Revalidatie and Netherlands Organisation for Health Research and Development (ZonMW), Netherlands.
Research programme: Health Care Efficiency, Subprogramme: Effects & Costs, Grant number: 945‐07‐715 provided funding for the employment of Thomas Fuller
Declarations of interest
Where review authors were also study authors, they had no involvement in study selection, data extraction or risk of bias assessment.
Thomas Fuller: none known.
Rilana Cima: was an investigator and author of the Cima 2012 study, which was a RCT comparing stepped CBT‐based care with treatment as usual on the impact of tinnitus on quality of life.
Berthold Langguth: has received funding for research from the Deutsche Forschungsgemeinschaft, the German Ministry for Research, the American Tinnitus Association, the Tinnitus Research Initiative, the European Union, Otonomy and Sivantos. He has received consultancy and speaker honoraria from Autifony, ANM, Astra Zeneca, Kyorin, Merz, McKinsey, Microtransponder, Neuromod, Novartis, Pfizer, Lundbeck and Servier.
Birgit Mazurek: has received funding for research from the Deutsche Forschungsgemeinschaft, the German Ministry for Research, the American Tinnitus Association and the German Tinnitus Association Charité.
Derek J Hoare: is vice chair of the British Society of Audiology.
Johan WS Vlaeyen: was an investigator and author of the Cima 2012 study, which was a RCT comparing stepped CBT‐based care with treatment as usual on the impact of tinnitus on quality of life.
Acknowledgements
We would like to thank the corresponding authors of the following included studies for providing additional information: Abbott 2009; Andersson 2002; Andersson 2005; Arif 2017; Beukes 2018a; Beukes 2018b; Cima 2012; Kaldo 2007; Lindberg 1989; Malinvaud 2016; Martz 2018; Oron (unpublished); Philippot 2012a; Robinson 2008; Schmidt 2018; Westin 2011. We would also like to thank the corresponding authors of Kröner‐Herwig 1995, Kröner‐Herwig 1999, Kröner‐Herwig 2003, Kröner‐Herwig 2006 and Tucker 2013, who provided additional information about their studies that ultimately helped inform our decisions on whether they met the inclusion criteria.
We would like to acknowledge Jenny Bellorini for all the practical assistance and guidance throughout the review. We thank Samantha Cox for preparing and conducting the initial and final literature searches, and Vittoria Lutje for conducting an update search. We would also like to thank Aidan Tan and Yu‐Tian Xiao who extracted data from and conducted the risk of bias assessment for the Zhong 2014 study.
We would like to thank Nuala Livingstone and Kerry Dwan from the Cochrane Methods Support Unit for providing guidance and an intracluster correlation coefficient to enable data from Abbott 2009 to be included in meta‐analyses.
Thomas Fuller was supported by SWOL Limburgs Fonds voor Revalidatie and the Netherlands Organisation for Health Research and Development (ZonMW), Research programme: Health Care Efficiency, Subprogramme: Effects & Costs, Grant number: 945‐07‐715.
Rilana Cima received funding from the Innovational Research Incentives Scheme Veni, from the Netherlands Organisation for Scientific Research (NWO).
Derek J Hoare is funded through the National Institute for Health Research (NIHR) Biomedical Research Centre Programme. The view expressed are those of the author and not necessarily those of the NIHR, the NHS, or the Department of Health and Social Care.
Johan WS Vlaeyen received funding from the Research Foundation, Flanders FWO, Belgium (Fonds Wetenschappelijk Onderzoek Vlaanderen) and the Netherlands Organisation for Health Research and Development (ZonMW).
This project was supported by the National Institute for Health Research, via Cochrane Infrastructure, Cochrane Programme Grant or Cochrane Incentive funding to Cochrane ENT. The views and opinions expressed therein are those of the authors and do not necessarily reflect those of the Systematic Reviews Programme, NIHR, NHS or the Department of Health.
Version history
| Published | Title | Stage | Authors | Version |
| 2020 Jan 08 | Cognitive behavioural therapy for tinnitus | Review | Thomas Fuller, Rilana Cima, Berthold Langguth, Birgit Mazurek, Johan WS Vlaeyen, Derek J Hoare | |
| 2017 Apr 06 | Cognitive behavioural therapy for tinnitus | Protocol | Thomas Fuller, Rilana Cima, Berthold Langguth, Birgit Mazurek, Angus Waddell, Derek J Hoare, Johan WS Vlaeyen | |
Differences between protocol and review
"Tinnitus reactivity", defined as being tinnitus‐specific health‐related quality of life, as measured by multi‐item questionnaires (e.g. TFI), was specified as the primary outcome in our protocol (Fuller 2017b). This terminology was replaced in the review with "impact of tinnitus on quality of life" in order to be consistent with other reviews related to tinnitus in the Cochrane ENT group (Sereda 2018; Wegner 2018).
We had not specified in our protocol what outcome measure we would use if studies used more than one multi‐item questionnaire to measure the secondary outcomes for depression, anxiety, quality of life and negatively biased interpretations of tinnitus. Whenever possible we chose the multi‐item questionnaire that would allow pooling of data and analysis using mean differences. Failing that, we chose the measure that had the better psychometric properties.
In the protocol we had not clearly described how we would treat cluster‐RCTs that did not include information about the intracluster correlation coefficient (ICC). We followed the recommendations in Chapter 16.3.4 'Approximate analyses of cluster‐randomised trials for a meta‐analysis: effective sample sizes' in the Cochrane Handbook for Systematic Reviews of Interventions (Higgins 2011). After a search for examples of cluster‐RCTs with tinnitus patients yielded no results, we contacted the Cochrane ENT group Managing Editor for further guidance. Courtesy of the Cochrane Methods Support Unit, we obtained an estimate of an ICC that was reasonable for us to use with this population. We also conducted a sensitivity analysis including and excluding the data from Abbott 2009.
We have provided some clarification in the report of the review regarding 'mindfulness'. We have added the following text: "We considered interventions as 'mindfulness' if they involved: exercises that involved self‐regulation of attention on experience and emphasised openness, curiosity and acceptance (Bishop 2004)".
In the protocol we stated that if the I² was > 30%, the Chi² value was greater than the degrees of freedom and/or the confidence intervals of the included studies did not show overlap, we would not pool studies and instead describe the findings in a narrative form. Although the I² values were above 30% in numerous analyses, there was clear overlap of almost all the confidence intervals, and the trend of the effect across studies was consistently towards the interventions favouring CBT regardless of the comparator. Furthermore, we expected that the underlying reason for this high level of statistical heterogeneity was the anticipated clinical or methodological factors for which we had planned subgroup analyses. Given this and the potential value of a meta‐analysis compared with only providing a narrative summary of the literature, we pooled the data.
We conducted an additional sensitivity analysis to examine the effect of using a 'conservative' compared to an 'optimistic' approach in one study (Malinvaud 2016), which did not report outcome data at the end of treatment but did so at three months follow‐up.
Compared with what we initially described in the protocol, there were changes in the contributions of authors to two tasks. DH also contributed to data extraction, and BM and RC also conducted 'Risk of bias' assessments. AW withdrew from the review team due to increased work commitments elsewhere.
Notes
The publication of this review will lead to the previous one becoming obsolete. A link to the superseded review will be available (Martinez‐Devesa 2010).
Keywords
MeSH
Medical Subject Headings (MeSH) Keywords
Medical Subject Headings Check Words
Humans;
PICOs

Process for sifting search results and selecting studies for inclusion
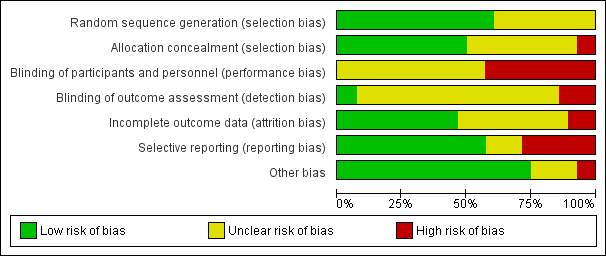
'Risk of bias' graph: review authors' judgements about each risk of bias item presented as percentages across all included studies.
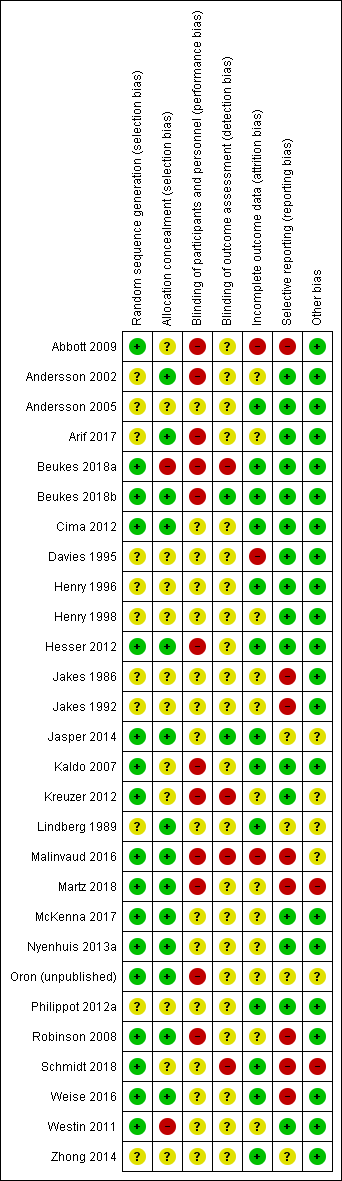
'Risk of bias' summary: review authors' judgements about each risk of bias item for each included study.

Forest plot of comparison: 1 CBT versus no intervention/waiting list control, outcome: 1.1 Impact of tinnitus on quality of life at end of treatment.
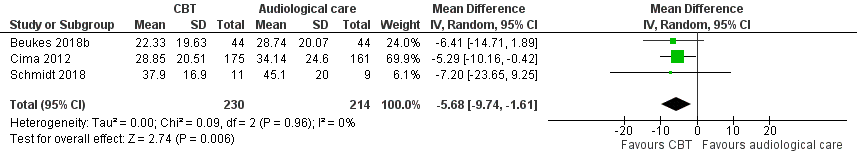
Forest plot of comparison: 2 CBT versus audiological care (tinnitus education and rehabilitation for hearing loss), outcome: 2.1 Impact of tinnitus on quality of life at end of treatment.
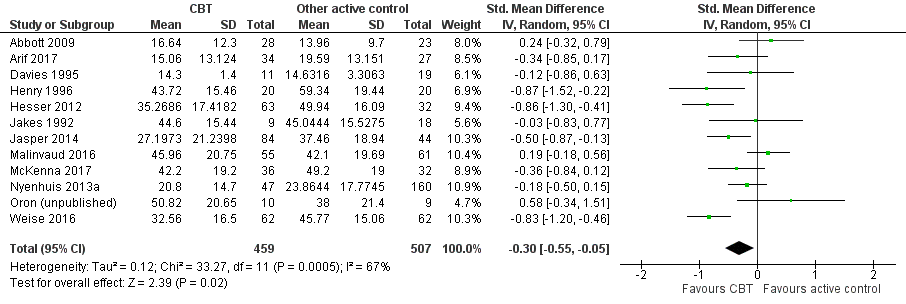
Forest plot of comparison: 4 CBT versus other experimental control, outcome: 4.1 Impact of tinnitus on quality of life.

Comparison 1 CBT versus no intervention/waiting list control, Outcome 1 Impact of tinnitus on quality of life at end of treatment.

Comparison 1 CBT versus no intervention/waiting list control, Outcome 2 Serious adverse effects at end of treatment.

Comparison 1 CBT versus no intervention/waiting list control, Outcome 3 Depression at end of treatment.

Comparison 1 CBT versus no intervention/waiting list control, Outcome 4 Anxiety at end of treatment.

Comparison 1 CBT versus no intervention/waiting list control, Outcome 5 Health‐related quality of life at end of treatment.

Comparison 1 CBT versus no intervention/waiting list control, Outcome 6 Negatively biased interpretations of tinnitus at end of treatment.

Comparison 1 CBT versus no intervention/waiting list control, Outcome 7 Subgroup analysis (random‐effects model): type of therapy ‐ impact of tinnitus on quality of life at end of treatment.

Comparison 1 CBT versus no intervention/waiting list control, Outcome 8 Subgroup analysis (fixed‐effect model): type of therapy ‐ impact of tinnitus on quality of life at end of treatment.

Comparison 1 CBT versus no intervention/waiting list control, Outcome 9 Subgroup analysis (random‐effects model): mode of delivery ‐ impact of tinnitus on quality of life at end of treatment.

Comparison 1 CBT versus no intervention/waiting list control, Outcome 10 Subgroup analysis (fixed‐effect model): mode of delivery ‐ impact of tinnitus on quality of life at end of treatment.

Comparison 1 CBT versus no intervention/waiting list control, Outcome 11 Subgroup analysis (random‐effects model): unit of delivery ‐ impact of tinnitus on quality of life at end of treatment.

Comparison 1 CBT versus no intervention/waiting list control, Outcome 12 Subgroup analysis (fixed‐effect model): unit of delivery ‐ impact of tinnitus on quality of life at end of treatment.

Comparison 1 CBT versus no intervention/waiting list control, Outcome 13 Subgroup analysis (random‐effects model): who delivers CBT ‐ impact of tinnitus on quality of life at end of treatment.

Comparison 1 CBT versus no intervention/waiting list control, Outcome 14 Subgroup analysis (fixed‐effect model): who delivers CBT ‐ impact of tinnitus on quality of life at end of treatment.

Comparison 1 CBT versus no intervention/waiting list control, Outcome 15 Sensitivity analysis without Malinvaud (high risk of bias) impact of tinnitus on quality of life at end of treatment.

Comparison 1 CBT versus no intervention/waiting list control, Outcome 16 Sensitivity analysis with optimistic assumption for Malinvaud ‐ impact of tinnitus on quality of life at end of treatment.

Comparison 2 CBT versus audiological care (tinnitus education and rehabilitation for hearing loss), Outcome 1 Impact of tinnitus on quality of life at end of treatment.

Comparison 2 CBT versus audiological care (tinnitus education and rehabilitation for hearing loss), Outcome 2 Serious adverse effects at end of treatment.

Comparison 2 CBT versus audiological care (tinnitus education and rehabilitation for hearing loss), Outcome 3 Depression at end of treatment.

Comparison 2 CBT versus audiological care (tinnitus education and rehabilitation for hearing loss), Outcome 4 Anxiety at end of treatment.

Comparison 2 CBT versus audiological care (tinnitus education and rehabilitation for hearing loss), Outcome 5 Health‐related quality of life.

Comparison 2 CBT versus audiological care (tinnitus education and rehabilitation for hearing loss), Outcome 6 Negatively biased interpretations of tinnitus.

Comparison 2 CBT versus audiological care (tinnitus education and rehabilitation for hearing loss), Outcome 7 Sensitivity analysis (fixed‐effect model): impact of tinnitus on quality of life.

Comparison 3 CBT versus TRT (directive counselling and bilateral masking), Outcome 1 Impact of tinnitus on quality of life at end of treatment.

Comparison 3 CBT versus TRT (directive counselling and bilateral masking), Outcome 2 Impact of tinnitus on quality of life at 6 months follow‐up.

Comparison 3 CBT versus TRT (directive counselling and bilateral masking), Outcome 3 Serious adverse effects at end of treatment.

Comparison 3 CBT versus TRT (directive counselling and bilateral masking), Outcome 4 Negatively biased interpretations of tinnitus at end of treatment.

Comparison 3 CBT versus TRT (directive counselling and bilateral masking), Outcome 5 Negatively biased interpretations of tinnitus at 6 months follow‐up.

Comparison 4 CBT versus other active control, Outcome 1 Impact of tinnitus on quality of life at end of treatment.

Comparison 4 CBT versus other active control, Outcome 2 Impact of tinnitus on quality of life at 6 months follow‐up.

Comparison 4 CBT versus other active control, Outcome 3 Impact of tinnitus on quality of life at 12 months follow‐up.

Comparison 4 CBT versus other active control, Outcome 4 Serious adverse effects at the end of treatment.

Comparison 4 CBT versus other active control, Outcome 5 Depression at end of treatment.

Comparison 4 CBT versus other active control, Outcome 6 Depression at 6 months follow‐up.

Comparison 4 CBT versus other active control, Outcome 7 Depression at 12 months.

Comparison 4 CBT versus other active control, Outcome 8 Anxiety at end of treatment.

Comparison 4 CBT versus other active control, Outcome 9 Anxiety at 6 months follow‐up.

Comparison 4 CBT versus other active control, Outcome 10 Health‐related quality of life at end of treatment.

Comparison 4 CBT versus other active control, Outcome 11 Negatively biased interpretations of tinnitus at end of treatment.

Comparison 4 CBT versus other active control, Outcome 12 Negatively biased interpretations of tinnitus at 6 months follow‐up.

Comparison 4 CBT versus other active control, Outcome 13 Negatively biased interpretations of tinnitus at 12 months follow‐up.

Comparison 4 CBT versus other active control, Outcome 14 Subgroup analysis (random‐effects model): type of therapy ‐ impact of tinnitus on quality of life.

Comparison 4 CBT versus other active control, Outcome 15 Subgroup analysis (fixed‐effect model): type of therapy ‐ impact of tinnitus on quality of life.

Comparison 4 CBT versus other active control, Outcome 16 Subgroup analysis: mode of delivery ‐ impact of tinnitus on quality of life.

Comparison 4 CBT versus other active control, Outcome 17 Subgroup analysis: unit of delivery ‐ impact of tinnitus on quality of life.

Comparison 4 CBT versus other active control, Outcome 18 Subgroup analysis: who delivers intervention ‐ impact of tinnitus on quality of life.

Comparison 4 CBT versus other active control, Outcome 19 Subgroup analysis: type of control ‐ impact of tinnitus on quality of life.

Comparison 4 CBT versus other active control, Outcome 20 Sensitivity analysis (fixed‐effect model): impact of tinnitus on quality of life at end of treatment.

Comparison 4 CBT versus other active control, Outcome 21 Sensitivity analysis: without studies at high risk of bias for incomplete outcome data ‐ impact of tinnitus on quality of life.

Comparison 4 CBT versus other active control, Outcome 22 Sensitivity analysis: without high risk of bias of missing outcome data, by subgroups (random‐effects model): type of therapy ‐ impact of tinnitus on quality of life.

Comparison 4 CBT versus other active control, Outcome 23 Sensitivity analysis: optimistic assumption for Malinvaud ‐ impact of tinnitus on quality of life.

Comparison 4 CBT versus other active control, Outcome 24 Sensitivity analysis: optimistic assumption for Malinvaud ‐ depression.

Comparison 4 CBT versus other active control, Outcome 25 Sensitivity analysis: optimistic assumption for Malinvaud ‐ anxiety.
| CBT compared to no intervention/waiting list control for tinnitus at end of treatment | ||||||
| Patient or population: adults with tinnitus | ||||||
| Outcomes at end of treatment | Anticipated absolute effects* (95% CI) | Relative effect | № of participants | Certainty of the evidence | Comments | |
| Risk with no intervention/waiting list control | Risk with CBT | |||||
| Impact of tinnitus on quality of life at treatment end Assessed with: TFI, | — | SMD 0.56 lower | — | 537 | ⊕⊕⊝⊝ | CBT may reduce the impact of tinnitus on quality of life at treatment end. The SMD can be interpreted as the THI score in the CBT group being on average 10.91 points lower than in the no intervention/waiting list control group. (The minimal clinically important change score has been estimated to be 7 points on the THI). |
| Serious adverse effects at end of treatment | Study population | RR 3.00 | 447 | ⊕⊕⊕⊝ | One participant allocated to CBT deteriorated. However, the deterioration in symptoms occurred between two assessments prior to the intervention commencing but was still detectable at end of treatment. CBT probably results in little or no difference in adverse effects. | |
| 0 per 1000 | 0 per 1000 | |||||
| Depression at end of treatment | — | SMD 0.34 lower | — | 502 | ⊕⊕⊝⊝ | CBT may result in a slight reduction in depression at end of treatment. |
| Anxiety at end of treatment | — | SMD 0.45 lower | — | 429 | ⊕⊝⊝⊝ | The evidence is very uncertain about whether CBT reduces anxiety at end of treatment. |
| Health‐related quality of life | — | SMD 0.38 lower | — | 179 | ⊕⊝⊝⊝ | The evidence is very uncertain about whether CBT improves health‐related quality of life. |
| Negatively biased interpretations of tinnitus | — | SMD 0.4 lower | — | 84 | ⊕⊝⊝⊝ | The evidence is very uncertain about whether CBT reduces negatively biased interpretations of tinnitus. |
| Other adverse effects | No adverse effects occurred. | — | 447 | ⊕⊕⊕⊝ | — | |
| *The risk in the intervention group (and its 95% confidence interval) is based on the assumed risk in the comparison group and the relative effect of the intervention (and its 95% CI). | ||||||
| GRADE Working Group grades of evidence | ||||||
| 1Downgraded one level due to study limitations (risk of bias): all studies included for this outcome were judged to be either unclear or at high risk of performance bias due to an absence of blinding of participants and personnel. | ||||||
| CBT compared to audiological care (tinnitus education and rehabilitation for hearing loss) for tinnitus at end of treatment | ||||||
| Patient or population: adults with tinnitus | ||||||
| Outcomes at end of treatment | Anticipated absolute effects* (95% CI) | Relative effect | № of participants | Certainty of the evidence | Comments | |
| Risk with audiological care (tinnitus education and rehabilitation for hearing loss) | Risk with CBT | |||||
| Impact of tinnitus on quality of life | 34.14 | MD 5.65 lower | — | 430 | ⊕⊕⊕⊝ | The MD is reported here because the 3 studies all reported outcome data from the THI. CBT probably reduces the impact of tinnitus on quality of life when compared with audiological care. |
| Serious adverse effects | No serious adverse effects occurred. | — | 410 | ⊕⊕⊕⊝ | Meta‐analysis was not conducted for this outcome. | |
| Depression at end of treatment | — | SMD 0.18 lower | — | 410 | ⊕⊕⊝⊝ | CBT may slightly reduce depression at end of treatment when compared with audiological care. |
| Anxiety at end of treatment | — | SMD 0.06 lower | — | 410 | ⊕⊕⊝⊝ | CBT may result in little to no difference in anxiety at end of treatment when compared with audiological care. |
| Health‐related quality of life | — | SMD 0.07 lower | — | 410 | ⊕⊕⊝⊝ | CBT may result in little to no difference in health‐related quality of life when compared with audiological care. |
| Negatively biased interpretations of tinnitus | At end of treatment TCS scores had decreased from a mean of 21. 42 (SD 12.56) to 17.14 (SD 11.54). | At end of treatment TCS scores had decreased from a mean of 20.89 (SD 11.83) to 12.45 (10.30). | — | 336 | ⊕⊕⊝⊝ | CBT may reduce negatively biased interpretations of tinnitus when compared with audiological care. |
| Other adverse effects | No adverse effects occurred. | — | 410 | ⊕⊕⊕⊝ | — | |
| *The risk in the intervention group (and its 95% confidence interval) is based on the assumed risk in the comparison group and the relative effect of the intervention (and its 95% CI). The assumed risk score in the comparison group (34.14) was obtained from the median control group score from the largest study (Cima 2012) in this comparison. | ||||||
| GRADE Working Group grades of evidence | ||||||
| 1Downgraded one level due to study limitations (risk of bias): all studies included for this outcome were judged to be either unclear or at high risk of performance bias due to an absence of blinding of participants and personnel. 2Downgraded by one level due to imprecision: the confidence intervals cross the line of no effect. 3Downgraded one level due to study limitations (risk of bias): performance and detection bias judged as unclear. 4Downgraded one level due to imprecision: small sample size. | ||||||
| CBT compared to TRT (directive counselling and bilateral masking) for tinnitus at end of treatment | ||||||
| Patient or population: adults with tinnitus | ||||||
| Outcomes at end of treatment | Anticipated absolute effects* (95% CI) | Relative effect | № of participants | Certainty of the evidence | Comments | |
| Risk with TRT (directive counselling and bilateral masking) | Risk with CBT | |||||
| Impact of tinnitus on quality of life | At 10 weeks the THI score had decreased from an average of 47.00 (SD 18.19) to an average of 43.22 (SD 20.75). | At 10 weeks the THI score had decreased from an average of 45.27 (SD 14.99) to an average of 27.43 (19.18). | — | 42 | ⊕⊕⊝⊝ | CBT may reduce the impact of tinnitus on quality of life compared with TRT. |
| Serious adverse effects | Study population | RR 0.45 | 42 | ⊕⊕⊝⊝ | Three participants deteriorated over the course of the study: 1 participant was from the intervention group (ACT; n = 22) and 2 participants were from the comparison group (TRT; n = 20). | |
| 100 per 1000 | 45 per 1000 | |||||
| Depression Assessed with: HADS‐D | At 10 weeks the HADS‐D scores had decreased from a mean of 5.80 (SD 3.79) to 5.78 (SD 3.73). | At 10 weeks the HADS‐D scores had decreased from a mean of 4.05 (SD 3.06) to 3.20 (SD 3.47). | — | 42 | ⊕⊕⊝⊝ | We are uncertain whether CBT reduces depression compared with TRT. |
| Anxiety | At 10 weeks the HADS‐A scores had decreased from a mean of 8.2 (SD 3.75) to 7.0 (SD 4.20). | At 10 weeks the HADS‐A scores had decreased from a mean of 6.24 (SD 4.00) to 3.6 (SD 3.14). | — | 42 | ⊕⊕⊝⊝ | We are uncertain whether CBT reduces anxiety compared with TRT. |
| Health‐related quality of life | At 10 weeks QoLI scores had increased from a mean of 2.24 (SD 1.42) to 2.47 (SD 1.72). | At 10 weeks QoLI scores had increased from a mean of 2.43 (SD 1.30) to 2.78 (SD 1.53). | — | 42 | ⊕⊕⊝⊝ | We are uncertain whether CBT improves health‐related quality of life compared with TRT. |
| Negatively biased interpretations of tinnitus | At 10 weeks TAQ scores had increased from a mean of 36.65 (9.96) to 37.89 (SD 10.73). | At 10 weeks TAQ scores had increased from a mean of 41.05 (SD 9.49) to 47.67 (SD 11.15). | — | 42 | ⊕⊕⊝⊝ | CBT may reduce negatively biased interpretations of tinnitus compared with TRT. |
| Other adverse effects | No other adverse effects were reported. | — | 42 | ⊕⊕⊝⊝ | — | |
| *The risk in the intervention group (and its 95% confidence interval) is based on the assumed risk in the comparison group and the relative effect of the intervention (and its 95% CI). | ||||||
| GRADE Working Group grades of evidence | ||||||
| 1Downgraded one level due to study limitations (risk of bias). There was high risk of bias associated with allocation concealment and unclear risk of bias for performance, detection and attrition bias respectively. 2Downgraded one level due to imprecision: small sample size. | ||||||
| CBT compared to other experimental control for tinnitus | ||||||
| Patient or population: adults with tinnitus | ||||||
| Outcomes at end of treatment | Anticipated absolute effects* (95% CI) | Relative effect | № of participants | Certainty of the evidence | Comments | |
| Risk with other experimental control | Risk with CBT | |||||
| Impact of tinnitus on quality of life at end of treatment | — | SMD 0.30 lower | — | 966 | ⊕⊕⊝⊝ | CBT may reduce the impact of tinnitus on quality of life when compared with other treatments. The SMD can be interpreted as the THI score in the CBT group being on average 5.84 points lower than in the other experimental control group. (The minimal clinically important change score has been estimated to be 7 points on the THI). |
| Serious adverse effects | Study population | RR 1.70 | 595 | ⊕⊕⊝⊝ | Three participants deteriorated according to reliable change calculations using the TQ; 1 was from the group CBT intervention and 2 received "information only" control. | |
| 6 per 1000 | 10 per 1000 | |||||
| Depression at end of treatment | — | SMD 0.17 lower | — | 943 | ⊕⊕⊝⊝ | CBT may reduce depression when compared with other treatments. |
| Anxiety at end of treatment | — | SMD 0.25 lower | — | 696 | ⊕⊕⊝⊝ | CBT may reduce anxiety when compared with other treatments. |
| Health‐related quality of life at end of treatment | By the end of treatment, the mean quality of life score increased from a mean of 1.98 (SD 1.58) to 2.27 (1.5). | By the end of treatment, the quality of life score had increased from a mean of 1.67 (SD 1.71) to 2.32 (SD 1.51). | — | 95 | ⊕⊝⊝⊝ | We are uncertain whether CBT improves health‐related quality of life compared with other treatments. |
| Negatively biased interpretations of tinnitus at end of treatment | — | SMD 0.55 lower | — | 455 | ⊕⊕⊕⊝ | CBT probably reduces negatively biased interpretations of tinnitus when compared with other treatments. |
| Other adverse effects | No other adverse effects reported. | — | 595 | ⊕⊕⊝⊝ | — | |
| *The risk in the intervention group (and its 95% confidence interval) is based on the assumed risk in the comparison group and the relative effect of the intervention (and its 95% CI). | ||||||
| GRADE Working Group grades of evidence | ||||||
| 1Downgraded one level due to study limitations (risk of bias): all studies included for this outcome were judged to be either unclear or at high risk of performance bias due to an absence of blinding of participants and personnel. | ||||||
| Outcome or subgroup title | No. of studies | No. of participants | Statistical method | Effect size |
| 1 Impact of tinnitus on quality of life at end of treatment Show forest plot | 10 | 537 | Std. Mean Difference (IV, Random, 95% CI) | ‐0.56 [‐0.83, ‐0.30] |
| 2 Serious adverse effects at end of treatment Show forest plot | 7 | 447 | Risk Ratio (IV, Random, 95% CI) | 3.00 [0.13, 69.87] |
| 3 Depression at end of treatment Show forest plot | 8 | 502 | Std. Mean Difference (IV, Random, 95% CI) | ‐0.34 [‐0.60, ‐0.08] |
| 4 Anxiety at end of treatment Show forest plot | 6 | 429 | Std. Mean Difference (IV, Random, 95% CI) | ‐0.45 [‐0.82, ‐0.09] |
| 5 Health‐related quality of life at end of treatment Show forest plot | 2 | 179 | Std. Mean Difference (IV, Random, 95% CI) | ‐0.38 [‐0.67, ‐0.08] |
| 6 Negatively biased interpretations of tinnitus at end of treatment Show forest plot | 2 | 84 | Std. Mean Difference (IV, Random, 95% CI) | ‐0.40 [‐1.25, 0.45] |
| 7 Subgroup analysis (random‐effects model): type of therapy ‐ impact of tinnitus on quality of life at end of treatment Show forest plot | 10 | 537 | Std. Mean Difference (IV, Random, 95% CI) | ‐0.56 [‐0.83, ‐0.30] |
| 7.1 CBT | 6 | 402 | Std. Mean Difference (IV, Random, 95% CI) | ‐0.47 [‐0.81, ‐0.13] |
| 7.2 ACT | 2 | 62 | Std. Mean Difference (IV, Random, 95% CI) | ‐0.61 [‐1.53, 0.32] |
| 7.3 Cognitive therapy | 1 | 40 | Std. Mean Difference (IV, Random, 95% CI) | ‐0.97 [‐1.63, ‐0.31] |
| 7.4 Mindfulness | 1 | 33 | Std. Mean Difference (IV, Random, 95% CI) | ‐0.67 [‐1.37, 0.04] |
| 8 Subgroup analysis (fixed‐effect model): type of therapy ‐ impact of tinnitus on quality of life at end of treatment Show forest plot | 10 | 537 | Std. Mean Difference (IV, Fixed, 95% CI) | ‐0.53 [‐0.71, ‐0.35] |
| 8.1 CBT | 6 | 402 | Std. Mean Difference (IV, Fixed, 95% CI) | ‐0.45 [‐0.65, ‐0.24] |
| 8.2 ACT | 2 | 62 | Std. Mean Difference (IV, Fixed, 95% CI) | ‐0.72 [‐1.24, ‐0.20] |
| 8.3 Cognitive therapy | 1 | 40 | Std. Mean Difference (IV, Fixed, 95% CI) | ‐0.97 [‐1.63, ‐0.31] |
| 8.4 Mindfulness | 1 | 33 | Std. Mean Difference (IV, Fixed, 95% CI) | ‐0.67 [‐1.37, 0.04] |
| 9 Subgroup analysis (random‐effects model): mode of delivery ‐ impact of tinnitus on quality of life at end of treatment Show forest plot | 10 | 537 | Std. Mean Difference (IV, Random, 95% CI) | ‐0.56 [‐0.83, ‐0.30] |
| 9.1 Bibliotherapy | 1 | 72 | Std. Mean Difference (IV, Random, 95% CI) | ‐0.39 [‐0.86, 0.08] |
| 9.2 Face‐to‐face | 7 | 258 | Std. Mean Difference (IV, Random, 95% CI) | ‐0.66 [‐1.09, ‐0.22] |
| 9.3 Internet‐based CBT | 2 | 207 | Std. Mean Difference (IV, Random, 95% CI) | ‐0.51 [‐0.92, ‐0.09] |
| 10 Subgroup analysis (fixed‐effect model): mode of delivery ‐ impact of tinnitus on quality of life at end of treatment Show forest plot | 10 | 537 | Std. Mean Difference (IV, Fixed, 95% CI) | ‐0.53 [‐0.71, ‐0.35] |
| 10.1 Bibliotherapy | 1 | 72 | Std. Mean Difference (IV, Fixed, 95% CI) | ‐0.39 [‐0.86, 0.08] |
| 10.2 Face‐to‐face | 7 | 258 | Std. Mean Difference (IV, Fixed, 95% CI) | ‐0.56 [‐0.82, ‐0.30] |
| 10.3 Web‐based CBT | 2 | 207 | Std. Mean Difference (IV, Fixed, 95% CI) | ‐0.54 [‐0.83, ‐0.26] |
| 11 Subgroup analysis (random‐effects model): unit of delivery ‐ impact of tinnitus on quality of life at end of treatment Show forest plot | 10 | 537 | Std. Mean Difference (IV, Random, 95% CI) | ‐0.56 [‐0.83, ‐0.30] |
| 11.1 Individual | 4 | 323 | Std. Mean Difference (IV, Random, 95% CI) | ‐0.57 [‐0.85, ‐0.28] |
| 11.2 Group | 6 | 214 | Std. Mean Difference (IV, Random, 95% CI) | ‐0.59 [‐1.07, ‐0.10] |
| 12 Subgroup analysis (fixed‐effect model): unit of delivery ‐ impact of tinnitus on quality of life at end of treatment Show forest plot | 10 | 537 | Std. Mean Difference (IV, Fixed, 95% CI) | ‐0.53 [‐0.71, ‐0.35] |
| 12.1 Individual | 4 | 323 | Std. Mean Difference (IV, Fixed, 95% CI) | ‐0.57 [‐0.79, ‐0.34] |
| 12.2 Group | 6 | 214 | Std. Mean Difference (IV, Fixed, 95% CI) | ‐0.47 [‐0.75, ‐0.19] |
| 13 Subgroup analysis (random‐effects model): who delivers CBT ‐ impact of tinnitus on quality of life at end of treatment Show forest plot | 10 | 537 | Std. Mean Difference (IV, Random, 95% CI) | ‐0.56 [‐0.83, ‐0.30] |
| 13.1 Psychologist | 4 | 185 | Std. Mean Difference (IV, Random, 95% CI) | ‐0.52 [‐1.11, 0.08] |
| 13.2 Bibliotherapy | 1 | 72 | Std. Mean Difference (IV, Random, 95% CI) | ‐0.39 [‐0.86, 0.08] |
| 13.3 Other clinician | 3 | 73 | Std. Mean Difference (IV, Random, 95% CI) | ‐0.89 [‐1.51, ‐0.27] |
| 13.4 Internet‐based | 2 | 207 | Std. Mean Difference (IV, Random, 95% CI) | ‐0.51 [‐0.92, ‐0.09] |
| 14 Subgroup analysis (fixed‐effect model): who delivers CBT ‐ impact of tinnitus on quality of life at end of treatment Show forest plot | 10 | 537 | Std. Mean Difference (IV, Fixed, 95% CI) | ‐0.53 [‐0.71, ‐0.35] |
| 14.1 Psychologist | 4 | 185 | Std. Mean Difference (IV, Fixed, 95% CI) | ‐0.45 [‐0.75, ‐0.14] |
| 14.2 Other clinician | 3 | 73 | Std. Mean Difference (IV, Fixed, 95% CI) | ‐0.87 [‐1.36, ‐0.38] |
| 14.3 Computer | 3 | 279 | Std. Mean Difference (IV, Fixed, 95% CI) | ‐0.50 [‐0.74, ‐0.26] |
| 15 Sensitivity analysis without Malinvaud (high risk of bias) impact of tinnitus on quality of life at end of treatment Show forest plot | 9 | 454 | Std. Mean Difference (IV, Random, 95% CI) | ‐0.64 [‐0.88, ‐0.40] |
| 16 Sensitivity analysis with optimistic assumption for Malinvaud ‐ impact of tinnitus on quality of life at end of treatment Show forest plot | 10 | 526 | Std. Mean Difference (IV, Random, 95% CI) | ‐0.65 [‐0.85, ‐0.44] |
| Outcome or subgroup title | No. of studies | No. of participants | Statistical method | Effect size |
| 1 Impact of tinnitus on quality of life at end of treatment Show forest plot | 3 | 444 | Mean Difference (IV, Random, 95% CI) | ‐5.68 [‐9.74, ‐1.61] |
| 2 Serious adverse effects at end of treatment Show forest plot | 2 | 410 | Risk Ratio (M‐H, Fixed, 95% CI) | 0.0 [0.0, 0.0] |
| 3 Depression at end of treatment Show forest plot | 2 | 410 | Std. Mean Difference (IV, Random, 95% CI) | ‐0.18 [‐0.38, 0.01] |
| 4 Anxiety at end of treatment Show forest plot | 2 | 410 | Std. Mean Difference (IV, Random, 95% CI) | ‐0.06 [‐0.26, 0.13] |
| 5 Health‐related quality of life Show forest plot | 2 | 410 | Std. Mean Difference (IV, Random, 95% CI) | ‐0.07 [‐0.26, 0.13] |
| 6 Negatively biased interpretations of tinnitus Show forest plot | 1 | 336 | Mean Difference (IV, Random, 95% CI) | ‐4.69 [‐7.04, ‐2.34] |
| 7 Sensitivity analysis (fixed‐effect model): impact of tinnitus on quality of life Show forest plot | 3 | 430 | Mean Difference (IV, Fixed, 95% CI) | ‐5.65 [‐9.79, ‐1.50] |
| Outcome or subgroup title | No. of studies | No. of participants | Statistical method | Effect size |
| 1 Impact of tinnitus on quality of life at end of treatment Show forest plot | 1 | 42 | Mean Difference (IV, Random, 95% CI) | ‐15.79 [‐27.91, ‐3.67] |
| 2 Impact of tinnitus on quality of life at 6 months follow‐up Show forest plot | 1 | 42 | Mean Difference (IV, Random, 95% CI) | ‐13.10 [‐26.08, ‐0.12] |
| 3 Serious adverse effects at end of treatment Show forest plot | 1 | 42 | Risk Ratio (IV, Random, 95% CI) | 0.45 [0.04, 4.64] |
| 4 Negatively biased interpretations of tinnitus at end of treatment Show forest plot | 1 | 42 | Mean Difference (IV, Random, 95% CI) | ‐9.78 [‐16.40, ‐3.16] |
| 5 Negatively biased interpretations of tinnitus at 6 months follow‐up Show forest plot | 1 | 42 | Mean Difference (IV, Random, 95% CI) | ‐8.28 [‐15.34, ‐1.22] |
| Outcome or subgroup title | No. of studies | No. of participants | Statistical method | Effect size |
| 1 Impact of tinnitus on quality of life at end of treatment Show forest plot | 12 | 966 | Std. Mean Difference (IV, Random, 95% CI) | ‐0.30 [‐0.55, ‐0.05] |
| 2 Impact of tinnitus on quality of life at 6 months follow‐up Show forest plot | 1 | 62 | Mean Difference (IV, Random, 95% CI) | ‐11.80 [‐23.06, ‐0.54] |
| 3 Impact of tinnitus on quality of life at 12 months follow‐up Show forest plot | 1 | 33 | Mean Difference (IV, Random, 95% CI) | ‐2.76 [‐14.69, 9.17] |
| 4 Serious adverse effects at the end of treatment Show forest plot | 6 | 595 | Risk Ratio (M‐H, Random, 95% CI) | 1.70 [0.16, 18.36] |
| 5 Depression at end of treatment Show forest plot | 11 | 943 | Std. Mean Difference (IV, Random, 95% CI) | ‐0.17 [‐0.33, ‐0.01] |
| 6 Depression at 6 months follow‐up Show forest plot | 1 | 62 | Mean Difference (IV, Random, 95% CI) | ‐1.90 [‐3.87, 0.07] |
| 7 Depression at 12 months Show forest plot | 1 | 33 | Mean Difference (IV, Random, 95% CI) | ‐2.0 [‐7.88, 3.88] |
| 8 Anxiety at end of treatment Show forest plot | 9 | 696 | Std. Mean Difference (IV, Random, 95% CI) | ‐0.25 [‐0.48, ‐0.02] |
| 9 Anxiety at 6 months follow‐up Show forest plot | 1 | 62 | Mean Difference (IV, Random, 95% CI) | ‐1.20 [‐3.07, 0.67] |
| 10 Health‐related quality of life at end of treatment Show forest plot | 1 | 95 | Mean Difference (IV, Random, 95% CI) | ‐0.05 [‐0.68, 0.59] |
| 11 Negatively biased interpretations of tinnitus at end of treatment Show forest plot | 5 | 455 | Std. Mean Difference (IV, Random, 95% CI) | ‐0.55 [‐0.75, ‐0.35] |
| 12 Negatively biased interpretations of tinnitus at 6 months follow‐up Show forest plot | 1 | 62 | Mean Difference (IV, Random, 95% CI) | ‐7.20 [‐13.65, ‐0.75] |
| 13 Negatively biased interpretations of tinnitus at 12 months follow‐up Show forest plot | 1 | 33 | Mean Difference (IV, Random, 95% CI) | ‐14.05 [‐24.80, ‐3.30] |
| 14 Subgroup analysis (random‐effects model): type of therapy ‐ impact of tinnitus on quality of life Show forest plot | 12 | 966 | Std. Mean Difference (IV, Random, 95% CI) | ‐0.30 [‐0.55, ‐0.05] |
| 14.1 CBT | 5 | 626 | Std. Mean Difference (IV, Random, 95% CI) | ‐0.23 [‐0.62, 0.15] |
| 14.2 Cognitive therapy | 3 | 97 | Std. Mean Difference (IV, Random, 95% CI) | ‐0.38 [‐0.92, 0.17] |
| 14.3 ACT | 2 | 114 | Std. Mean Difference (IV, Random, 95% CI) | ‐0.20 [‐1.60, 1.21] |
| 14.4 Mindfulness | 2 | 129 | Std. Mean Difference (IV, Random, 95% CI) | ‐0.35 [‐0.70, ‐0.00] |
| 15 Subgroup analysis (fixed‐effect model): type of therapy ‐ impact of tinnitus on quality of life Show forest plot | 12 | 966 | Std. Mean Difference (IV, Fixed, 95% CI) | ‐0.33 [‐0.46, ‐0.19] |
| 15.1 CBT | 5 | 626 | Std. Mean Difference (IV, Fixed, 95% CI) | ‐0.27 [‐0.44, ‐0.10] |
| 15.2 Cognitive therapy | 3 | 97 | Std. Mean Difference (IV, Fixed, 95% CI) | ‐0.40 [‐0.82, 0.02] |
| 15.3 ACT | 2 | 114 | Std. Mean Difference (IV, Fixed, 95% CI) | ‐0.59 [‐0.99, ‐0.19] |
| 15.4 Mindfulness | 2 | 129 | Std. Mean Difference (IV, Fixed, 95% CI) | ‐0.35 [‐0.70, ‐0.00] |
| 16 Subgroup analysis: mode of delivery ‐ impact of tinnitus on quality of life Show forest plot | 12 | 966 | Std. Mean Difference (IV, Random, 95% CI) | ‐0.31 [‐0.55, ‐0.08] |
| 16.1 Face‐to‐face | 9 | 633 | Std. Mean Difference (IV, Random, 95% CI) | ‐0.20 [‐0.43, 0.03] |
| 16.2 Internet‐based CBT | 4 | 333 | Std. Mean Difference (IV, Random, 95% CI) | ‐0.52 [‐0.98, ‐0.07] |
| 17 Subgroup analysis: unit of delivery ‐ impact of tinnitus on quality of life Show forest plot | 12 | 966 | Std. Mean Difference (IV, Random, 95% CI) | ‐0.31 [‐0.55, ‐0.08] |
| 17.1 Individual | 6 | 424 | Std. Mean Difference (IV, Random, 95% CI) | ‐0.45 [‐0.79, ‐0.11] |
| 17.2 Group | 7 | 542 | Std. Mean Difference (IV, Random, 95% CI) | ‐0.19 [‐0.48, 0.10] |
| 18 Subgroup analysis: who delivers intervention ‐ impact of tinnitus on quality of life Show forest plot | 12 | 966 | Std. Mean Difference (IV, Random, 95% CI) | ‐0.31 [‐0.55, ‐0.08] |
| 18.1 Psychologists | 8 | 669 | Std. Mean Difference (IV, Random, 95% CI) | ‐0.29 [‐0.61, 0.02] |
| 18.2 Internet‐based | 3 | 209 | Std. Mean Difference (IV, Random, 95% CI) | ‐0.40 [‐1.03, 0.23] |
| 18.3 Other 'therapists' | 2 | 88 | Std. Mean Difference (IV, Random, 95% CI) | ‐0.25 [‐0.68, 0.18] |
| 19 Subgroup analysis: type of control ‐ impact of tinnitus on quality of life Show forest plot | 12 | 965 | Std. Mean Difference (IV, Random, 95% CI) | ‐0.30 [‐0.54, ‐0.06] |
| 19.1 Information | 3 | 171 | Std. Mean Difference (IV, Random, 95% CI) | ‐0.32 [‐0.91, 0.27] |
| 19.2 Coping effectiveness training | 1 | 19 | Std. Mean Difference (IV, Random, 95% CI) | 0.58 [‐0.34, 1.51] |
| 19.3 Relaxation | 3 | 159 | Std. Mean Difference (IV, Random, 95% CI) | ‐0.31 [‐0.63, 0.01] |
| 19.4 Discussion forum | 3 | 347 | Std. Mean Difference (IV, Random, 95% CI) | ‐0.72 [‐0.95, ‐0.49] |
| 19.5 Masking | 1 | 27 | Std. Mean Difference (IV, Random, 95% CI) | ‐0.03 [‐0.83, 0.77] |
| 19.6 Virtual reality | 1 | 116 | Std. Mean Difference (IV, Random, 95% CI) | 0.19 [‐0.18, 0.56] |
| 19.7 Self‐help | 1 | 126 | Std. Mean Difference (IV, Random, 95% CI) | ‐0.06 [‐0.52, 0.39] |
| 20 Sensitivity analysis (fixed‐effect model): impact of tinnitus on quality of life at end of treatment Show forest plot | 12 | 966 | Std. Mean Difference (IV, Fixed, 95% CI) | ‐0.33 [‐0.46, ‐0.19] |
| 21 Sensitivity analysis: without studies at high risk of bias for incomplete outcome data ‐ impact of tinnitus on quality of life Show forest plot | 9 | 770 | Std. Mean Difference (IV, Random, 95% CI) | ‐0.48 [‐0.71, ‐0.26] |
| 22 Sensitivity analysis: without high risk of bias of missing outcome data, by subgroups (random‐effects model): type of therapy ‐ impact of tinnitus on quality of life Show forest plot | 9 | 769 | Std. Mean Difference (IV, Random, 95% CI) | ‐0.45 [‐0.70, ‐0.21] |
| 22.1 CBT | 3 | 459 | Std. Mean Difference (IV, Random, 95% CI) | ‐0.49 [‐0.87, ‐0.12] |
| 22.2 Cognitive therapy | 2 | 67 | Std. Mean Difference (IV, Random, 95% CI) | ‐0.48 [‐1.31, 0.34] |
| 22.3 ACT | 2 | 114 | Std. Mean Difference (IV, Random, 95% CI) | ‐0.20 [‐1.60, 1.21] |
| 22.4 Mindfulness | 2 | 129 | Std. Mean Difference (IV, Random, 95% CI) | ‐0.35 [‐0.70, ‐0.00] |
| 23 Sensitivity analysis: optimistic assumption for Malinvaud ‐ impact of tinnitus on quality of life Show forest plot | 12 | 955 | Std. Mean Difference (IV, Random, 95% CI) | ‐0.35 [‐0.57, ‐0.13] |
| 24 Sensitivity analysis: optimistic assumption for Malinvaud ‐ depression Show forest plot | 11 | 921 | Std. Mean Difference (IV, Random, 95% CI) | ‐0.21 [‐0.34, ‐0.07] |
| 25 Sensitivity analysis: optimistic assumption for Malinvaud ‐ anxiety Show forest plot | 9 | 674 | Std. Mean Difference (IV, Random, 95% CI) | ‐0.28 [‐0.48, ‐0.09] |