Methods for managing miscarriage: a network meta‐analysis
Abstract
Background
Miscarriage, defined as the spontaneous loss of a pregnancy before 24 weeks’ gestation, is common with approximately 25% of women experiencing a miscarriage in their lifetime. An estimated 15% of pregnancies end in miscarriage. Miscarriage can lead to serious morbidity, including haemorrhage, infection, and even death, particularly in settings without adequate healthcare provision. Early miscarriages occur during the first 14 weeks of pregnancy, and can be managed expectantly, medically or surgically. However, there is uncertainty about the relative effectiveness and risks of each option.
Objectives
To estimate the relative effectiveness and safety profiles for the different management methods for early miscarriage, and to provide rankings of the available methods according to their effectiveness, safety, and side‐effect profile using a network meta‐analysis.
Search methods
We searched the Cochrane Pregnancy and Childbirth’s Trials Register (9 February 2021), ClinicalTrials.gov and the WHO International Clinical Trials Registry Platform (ICTRP) (12 February 2021), and reference lists of retrieved studies.
Selection criteria
We included all randomised controlled trials assessing the effectiveness or safety of methods for miscarriage management. Early miscarriage was defined as less than or equal to 14 weeks of gestation, and included missed and incomplete miscarriage. Management of late miscarriages after 14 weeks of gestation (often referred to as intrauterine fetal deaths) was not eligible for inclusion in the review. Cluster‐ and quasi‐randomised trials were eligible for inclusion. Randomised trials published only as abstracts were eligible if sufficient information could be retrieved. We excluded non‐randomised trials.
Data collection and analysis
At least three review authors independently assessed the trials for inclusion and risk of bias, extracted data and checked them for accuracy. We estimated the relative effects and rankings for the primary outcomes of complete miscarriage and composite outcome of death or serious complications. The certainty of evidence was assessed using GRADE. Relative effects for the primary outcomes are reported subgrouped by the type of miscarriage (incomplete and missed miscarriage). We also performed pairwise meta‐analyses and network meta‐analysis to determine the relative effects and rankings of all available methods.
Main results
Our network meta‐analysis included 78 randomised trials involving 17,795 women from 37 countries. Most trials (71/78) were conducted in hospital settings and included women with missed or incomplete miscarriage. Across 158 trial arms, the following methods were used: 51 trial arms (33%) used misoprostol; 50 (32%) used suction aspiration; 26 (16%) used expectant management or placebo; 17 (11%) used dilatation and curettage; 11 (6%) used mifepristone plus misoprostol; and three (2%) used suction aspiration plus cervical preparation. Of these 78 studies, 71 (90%) contributed data in a usable form for meta‐analysis.
Complete miscarriage
Based on the relative effects from the network meta‐analysis of 59 trials (12,591 women), we found that five methods may be more effective than expectant management or placebo for achieving a complete miscarriage:
· suction aspiration after cervical preparation (risk ratio (RR) 2.12, 95% confidence interval (CI) 1.41 to 3.20, low‐certainty evidence),
· dilatation and curettage (RR 1.49, 95% CI 1.26 to 1.75, low‐certainty evidence),
· suction aspiration (RR 1.44, 95% CI 1.29 to 1.62, low‐certainty evidence),
· mifepristone plus misoprostol (RR 1.42, 95% CI 1.22 to 1.66, moderate‐certainty evidence),
· misoprostol (RR 1.30, 95% CI 1.16 to 1.46, low‐certainty evidence).
The highest ranked surgical method was suction aspiration after cervical preparation. The highest ranked non‐surgical treatment was mifepristone plus misoprostol. All surgical methods were ranked higher than medical methods, which in turn ranked above expectant management or placebo.
Composite outcome of death and serious complications
Based on the relative effects from the network meta‐analysis of 35 trials (8161 women), we found that four methods with available data were compatible with a wide range of treatment effects compared with expectant management or placebo:
· dilatation and curettage (RR 0.43, 95% CI 0.17 to 1.06, low‐certainty evidence),
· suction aspiration (RR 0.55, 95% CI 0.23 to 1.32, low‐certainty evidence),
· misoprostol (RR 0.50, 95% CI 0.22 to 1.15, low‐certainty evidence),
· mifepristone plus misoprostol (RR 0.76, 95% CI 0.31 to 1.84, low‐certainty evidence).
Importantly, no deaths were reported in these studies, thus this composite outcome was entirely composed of serious complications, including blood transfusions, uterine perforations, hysterectomies, and intensive care unit admissions. Expectant management and placebo ranked the lowest when compared with alternative treatment interventions.
Subgroup analyses by type of miscarriage (missed or incomplete) agreed with the overall analysis in that surgical methods were the most effective treatment, followed by medical methods and then expectant management or placebo, but there are possible subgroup differences in the effectiveness of the available methods.
Authors' conclusions
Based on relative effects from the network meta‐analysis, all surgical and medical methods for managing a miscarriage may be more effective than expectant management or placebo. Surgical methods were ranked highest for managing a miscarriage, followed by medical methods, which in turn ranked above expectant management or placebo. Expectant management or placebo had the highest chance of serious complications, including the need for unplanned or emergency surgery. A subgroup analysis showed that surgical and medical methods may be more beneficial in women with missed miscarriage compared to women with incomplete miscarriage. Since type of miscarriage (missed and incomplete) appears to be a source of inconsistency and heterogeneity within these data, we acknowledge that the main network meta‐analysis may be unreliable. However, we plan to explore this further in future updates and consider the primary analysis as separate networks for missed and incomplete miscarriage.
PICO
Plain language summary
Which management option is best when women experience an early miscarriage?
What is the issue?
Miscarriage is the most common cause of pregnancy loss and one of the most common complications in early pregnancy. An estimated 15% of pregnancies will end in miscarriage, with 25% of women experiencing a miscarriage in their lifetime. Miscarriage can lead to serious complications, including haemorrhage and infection, and even death, particularly in low‐income countries. Miscarriage is generally defined as the spontaneous loss of a pregnancy before 24 weeks’ gestation. Most miscarriages happen in the first 14 weeks, and are known as early miscarriages.
Why is this important?
Miscarriage can be managed expectantly (waiting for the pregnancy tissue to pass naturally), medically (tablets given to make the womb expel the pregnancy tissue) or surgically (removal of the pregnancy tissue during surgery). However, there is uncertainty about the effectiveness, safety, and side effects of the available methods for managing a miscarriage. The aim of this Cochrane Review is to find out which method is the most effective and safest with the least side effects. We collected and analysed all the relevant studies to answer this question.
What evidence did we find?
We searched for evidence in February 2021 and identified 78 studies involving 17,795 women. Most women were managed in hospitals. Women were diagnosed with missed (also called silent miscarriage where no pregnancy tissue has been expelled and there is no bleeding or pain) or incomplete miscarriage (already started to bleed or have pain and perhaps expelled some pregnancy tissue). We found evidence for six different methods of managing a miscarriage; three surgical methods (suction aspiration plus cervical preparation, dilatation and curettage, or suction aspiration), two medical methods (mifepristone plus misoprostol or misoprostol alone), and expectant management or placebo.
The analysis suggested that all three surgical methods and both medical methods may be more effective than expectant management or placebo for completing the process of miscarriage. Suction aspiration plus cervical preparation was the best method of miscarriage management followed by dilatation and curettage, and suction aspiration alone. The two medical methods of mifepristone combined with misoprostol, and misoprostol alone were ranked fourth and fifth best methods, respectively.
From the available data, we cannot learn much for the outcome of death or serious complications. No deaths were reported in the studies that contributed towards this outcome. Amongst the serious complications, the majority were women who required blood transfusions, some had womb perforations related to surgery or required further life‐saving procedures. We could not know which method is best for this outcome due to limited data. However, expectant management or placebo was associated with more serious complications compared with the alternative treatment options.
We also looked separately at women suffering from an incomplete miscarriage compared to those suffering from a missed miscarriage. For both groups of women, all three surgical methods and both medical methods were found to be more effective than expectant management or placebo for providing a definitive treatment for a miscarriage. These analyses for incomplete and missed miscarriages agreed with the overall analysis in that surgical methods were better for providing a definitive treatment for a miscarriage than medical methods, which in turn were better than expectant management or placebo. However, the benefits for women with missed miscarriages undergoing any management method other than expectant management or placebo were far greater compared to women with incomplete miscarriages. This is probably because expectant management or placebo is more effective in women in whom the process of miscarriage has already started compared with women in whom the process is yet to start.
What does this mean?
All methods were generally more effective for managing a miscarriage compared with expectant management or placebo, but surgical methods were more effective than medical methods. Expectant management or placebo has the lowest chance of successfully treating a miscarriage and has the highest chance of serious complications and the need for unplanned or emergency surgery. In this review we found that the benefits for women with missed miscarriages undergoing any management method other than expectant management or placebo were far greater compared to women with incomplete miscarriages.
Authors' conclusions
Summary of findings
| Medical and surgical management compared with expectant management or placebo for treating missed early miscarriage | |||||||||
| Patient or population: women with missed miscarriage at ≤14 weeks gestation Settings: hospital or other healthcare facility Intervention: multiple interventions (suction aspiration, misoprostol, dilation and curettage, mifepristone plus misoprostol, suction aspiration plus cervical preparation) Comparison (reference): expectant management or placebo Outcome: complete miscarriage | |||||||||
| Intervention | Network evidence | Direct evidence | Indirect evidence | Illustrative comparative risks* (95% CI) for NMA estimate | |||||
| Relative effect | Certainty of the evidence | Relative effect | Certainty of the evidence | Relative effect | Certainty of the evidence | Risk | Risk | Risk difference | |
| Suction aspiration plus cervical preparation | 2.12 (1.41 to 3.20) | ⊕⊕⊖⊖ LOWa | Not reported by included studies | ‐ | 2.12 (1.41 to 3.20) | ⊕⊕⊖⊖ LOWb | 640 per 1000 | 1000 per 1000 | 360 more per 1,000 (from 182 more to 577 more) |
| Suction aspiration | 1.44 (1.29 to 1.62) | ⊕⊕⊖⊖ LOWc | 1.27 (1.08 to 1.48) | ⊕⊕⊕⊖ MODERATEd | 1.72 (1.44 to 2.06) | ⊕⊕⊕⊖ MODERATEf | 640 per 1000 | 922 per 1000 | 282 more per 1,000 (from 186 more to 397 more) |
| Dilation and curettage | 1.49 (1.26 to 1.75) | ⊕⊕⊖⊖ LOWc | 1.25 (1.12 to 1.39) | ⊕⊕⊕⊖ MODERATEe | 1.55 (1.29 to 1.86) | ⊕⊕⊖⊖ LOWb | 640 per 1000 | 954 per 1000 | 314 more per 1,000 (from 166 more to 480 more) |
| Mifepristone plus misoprostol | 1.42 (1.22 to 1.66) | ⊕⊕⊕⊖ MODERATEg | 1.59 (1.01 to 2.51) | ⊕⊕⊕⊖ MODERATEd | 1.40 (1.16 to 1.70) | ⊕⊕⊕⊖ MODERATEf | 640 per 1000 | 909 per 1000 | 269 more per 1,000 (from 141 more to 422 more) |
| Misoprostol | 1.30 (1.16 to 1.46) | ⊕⊕⊖⊖ LOWc | 1.85 (1.35 to 2.55) | ⊕⊕⊕⊖ MODERATEd | 1.14 (0.99 to 1.31) | ⊕⊕⊕⊖ MODERATEf | 640 per 1000 | 832 per 1000 | 192 more per 1,000 (from 102 more to 294 more) |
| *The basis for the assumed risk (e.g. the median control group risk across studies) is provided in footnotes. The corresponding risk (and its 95% confidence interval) is based on the assumed risk in the comparison group and the relative effect of the intervention (and its 95% CI). | |||||||||
| GRADE Working Group grades of evidence | |||||||||
| a Network evidence downgraded ‐2 due to low certainty indirect evidence (no intransitivity, incoherence, or imprecision) b Indirect evidence downgraded ‐2 due to limitations in study design c Network evidence downgraded ‐2 due to moderate certainty direct evidence and incoherence between direct and indirect estimates (no intransitivity, or imprecision) d Direct evidence downgraded ‐1 due to severe unexplained statistical heterogeneity e Direct evidence downgraded ‐1 due to serious imprecision f Indirect evidence downgraded ‐1 due to severe unexplained statistical heterogeneity g Network evidence downgraded ‐1 due to moderate certainty indirect evidence (no intransitivity, incoherence, or imprecision) | |||||||||
| Medical and surgical management compared with expectant management or placebo for treating missed early miscarriage | |||||||||
| Patient or population: women with missed miscarriage at ≤14 weeks gestation Settings: hospital or other healthcare facility Intervention: multiple interventions (suction aspiration, misoprostol, dilation and curettage, mifepristone plus misoprostol, suction aspiration plus cervical preparation) Comparison (reference): expectant management or placebo Outcome: complete miscarriage | |||||||||
| Intervention | Network evidence | Direct evidence | Indirect evidence | Illustrative comparative risks* (95% CI) for NMA estimate | |||||
| Relative effect | Certainty of the evidence | Relative effect | Certainty of the evidence | Relative effect | Certainty of the evidence | Risk | Risk | Risk difference | |
| Suction aspiration plus cervical preparation | Not estimable | ‐ | Not reported by included studies | ‐ | Not estimable | ‐ | Not estimable | Not estimable | Not estimable |
| Suction aspiration | 2.43 (1.69 to 3.49) | ⊕⊕⊕⊖ MODERATEb | 1.88 (1.68 to 2.12) | ⊕⊕⊕⊕ HIGH | 3.35 (1.94 to 5.81) | ⊕⊖⊖⊖ VERY LOWa | 455 per 1000 | 942 per 1000 | 487 more per 1000 (from 402 more to 580 more) |
| Dilation and curettage | 2.07 (1.19 to 3.59) | ⊕⊕⊕⊕ HIGH | Not reported by included studies | ‐ | Not estimable | ‐ | 455 per 1000 | 1000 per 1000 | 545 more per 1000 (from 313 more to 847 more) |
| Mifepristone plus misoprostol | 1.82 (1.28 to 2.58) | ⊕⊕⊕⊖ MODERATEb | 1.25 (1.09 to 1.45) | ⊕⊕⊕⊕ HIGH | 2.40 (1.58 to 3.65) | ⊕⊕⊕⊖ MODERATEc | 455 per 1000 | 828 per 1000 | 373 more per 1000 (from 127 more to 719 more) |
| Misoprostol | 1.67 (1.18 to 2.37) | ⊕⊕⊖⊖ LOWe | 3.18 (1.48 to 6.85) | ⊕⊕⊕⊖ MODERATEd | 1.16 (0.81 to 1.67) | ⊕⊕⊕⊖ MODERATEc | 455 per 1000 | 760 per 1000 | 305 more per 1000 (from 82 more to 623 more) |
| *The basis for the assumed risk (e.g. the median control group risk across studies) is provided in footnotes. The corresponding risk (and its 95% confidence interval) is based on the assumed risk in the comparison group and the relative effect of the intervention (and its 95% CI). | |||||||||
| GRADE Working Group grades of evidence | |||||||||
| a Indirect evidence downgraded ‐3 due to multiple crucial limitations in study design, severe unexplained statistical heterogeneity and imprecision b Network evidence downgraded ‐1 due to high certainty direct evidence and incoherence between direct and indirect estimates (no intransitivity, or imprecision) c Indirect evidence downgraded ‐1 due to severe unexplained statistical heterogeneity d Direct evidence downgraded ‐1 due to severe unexplained statistical heterogeneity e Network evidence downgraded ‐2 due to moderate certainty indirect evidence and incoherence between direct and indirect estimates (no intransitivity, or imprecision) | |||||||||
| Medical and surgical management compared with expectant management or placebo for treating incomplete early miscarriage | |||||||||
| Patient or population: women with incomplete miscarriage at ≤14 weeks gestation Settings: hospital or other healthcare facility Intervention: multiple interventions (suction aspiration, misoprostol, dilation and curettage, mifepristone plus misoprostol, suction aspiration plus cervical preparation) Comparison (reference): expectant management or placebo Outcome: complete miscarriage | |||||||||
| Intervention | Network evidence | Direct evidence | Indirect evidence | Illustrative comparative risks* (95% CI) for NMA estimate | |||||
| Relative effect | Quality of the evidence | Relative effect | Certainty of the evidence | Relative effect | Certainty of the evidence | Risk | Risk | Risk difference | |
| Suction aspiration plus cervical preparation | Not estimable | ‐ | Not reported by included studies | ‐ | Not estimable | ‐ | Not estimable | Not estimable | Not estimable |
| Suction aspiration | 1.19 (1.09 to 1.31) | ⊕⊕⊕⊖ MODERATEc | 1.20 (0.85 to 1.69) | ⊕⊖⊖⊖ VERY LOWa | 1.28 (1.11 to 1.48) | ⊕⊕⊖⊖ LOWb | 767 per 1000 | 913 per 1000 | 146 more per 1000 (from 69 more to 238 more) |
| Dilation and curettage | 1.19 (1.08 to 1.31) | ⊕⊕⊕⊖ MODERATEf | 1.25 (1.12 to 1.39) | ⊕⊕⊕⊖ MODERATEd | 1.15 (1.02 to 1.30) | ⊕⊖⊖⊖ VERY LOWe | 767 per 1000 | 913 per 1000 | 146 more per 1000 (from 61 more to 238 more) |
| Mifepristone plus misoprostol | 1.08 (0.87 to 1.34) | ⊕⊖⊖⊖ VERY LOWh | 1.08 (0.90 to 1.30) | ⊕⊖⊖⊖ VERY LOWg | Not estimable | ‐ | 767 per 1000 | 828 per 1000 | 61 more per 1000 (from 100 fewer to 261 more) |
| Misoprostol | 1.14 (1.03 to 1.25) | ⊕⊕⊕⊖ MODERATEj | 1.04 (0.70 to 1.54) | ⊕⊕⊖⊖ LOWi | 1.12 (1.02 to 1.24) | ⊕⊖⊖⊖ VERY LOWe | 767 per 1000 | 874 per 1000 | 107 more per 1000 (from 23 more to 192 more) |
| *The basis for the assumed risk (e.g. the median control group risk across studies) is provided in footnotes. The corresponding risk (and its 95% confidence interval) is based on the assumed risk in the comparison group and the relative effect of the intervention (and its 95% CI). | |||||||||
| GRADE Working Group grades of evidence | |||||||||
| a Direct evidence downgraded ‐3 due to multiple crucial limitations in study design, severe unexplained statistical heterogeneity and imprecision b Indirect evidence downgraded ‐2 due to serious imprecision c Network evidence downgraded ‐1 due to low certainty indirect evidence upgraded by 1 as it was downgraded for imprecision d Direct evidence downgraded ‐1 due to serious imprecision e Indirect evidence downgraded ‐3 due to multiple crucial limitations in study design, severe unexplained statistical heterogeneity and imprecision f Network evidence downgraded ‐1 due to moderate certainty direct evidence (no intransitivity, incoherence, or imprecision) g Direct evidence downgraded ‐3 due to multiple crucial limitations in study design and imprecision h Network evidence downgraded ‐3 due to very low certainty direct evidence (no intransitivity, incoherence, or imprecision) i Direct evidence downgraded ‐2 due to serious imprecision j Network evidence downgraded ‐1 due to low certainty direct evidence upgraded by 1 as network evidence is precise | |||||||||
| Medical and surgical management compared with expectant management or placebo for treating early miscarriage | |||||||||
| Patient or population: women with missed or incomplete miscarriage at ≤14 weeks gestation Settings: Hospital Intervention: multiple interventions (suction aspiration, misoprostol, dilation plus curettage, mifepristone plus misoprostol, suction aspiration plus cervical preparation) Comparison (reference): expectant management Outcome: composite outcome of death or serious complication | |||||||||
| Intervention | Network evidence | Direct evidence | Indirect evidence | Illustrative comparative risks* (95% CI) for NMA estimate | |||||
| Relative effect | Certainty of the evidence | Relative effect | Certainty of the evidence | Relative effect | Certainty of the evidence | Risk | Risk | Risk difference | |
| Suction aspiration plus cervical preparation | Not reported by included studies | ‐ | Not reported by included studies | ‐ | Not reported by included studies | ‐ | Not estimable | Not estimable | Not estimable |
| Suction aspiration | 0.55 (0.23 to 1.32) | ⊕⊕⊖⊖ LOWc | 0.43 (0.12 to 1.53) | ⊕⊕⊖⊖ LOWa | 0.97 (0.21 to 4.40) | ⊕⊕⊖⊖ LOWb | 19 per 1000 | 10 per 1000 | 9 fewer per 1000 (from 15 fewer to 6 more) |
| Dilation and curettage | 0.43 (0.17 to 1.06) | ⊕⊕⊖⊖ LOWd | Not reported by included studies | ‐ | 0.43 (0.17 to 1.06) | ⊕⊕⊖⊖ LOWb | 19 per 1000 | 8 per 1000 | 11 fewer per 1000 (from 16 fewer to 1 more) |
| Mifepristone plus misoprostol | 0.76 (0.31 to 1.84) | ⊕⊕⊖⊖ LOWc | 0.46 (0.13 to 1.63) | ⊕⊕⊖⊖ LOWa | 1.38 (0.37 to 5.17) | ⊕⊕⊖⊖ LOWb | 19 per 1000 | 14 per 1000 | 5 fewer per 1000 (from 13 fewer to 16 more) |
| Misoprostol | 0.50 (0.22 to 1.15) | ⊕⊕⊖⊖ LOWd | 0.96 (0.06 to 15.08) | ⊕⊕⊖⊖ LOWa | 0.35 (0.13 to 0.97) | ⊕⊕⊖⊖ LOWb | 19 per 1000 | 10 per 1000 | 9 fewer per 1000 (from 15 fewer to 3 more) |
| *The basis for the assumed risk (e.g. the median control group risk across studies) is provided in footnotes. The corresponding risk (and its 95% confidence interval) is based on the assumed risk in the comparison group and the relative effect of the intervention (and its 95% CI). | |||||||||
| GRADE Working Group grades of evidence | |||||||||
| a Direct evidence downgraded ‐2 due to very serious imprecision b Indirect evidence downgraded ‐2 due to very serious imprecision c Network evidence downgraded ‐2 due to low certainty direct evidence (no intransitivity or incoherence) d Network evidence downgraded ‐2 due to low certainty indirect evidence (no intransitivity or incoherence) | |||||||||
| Medical and surgical management compared with expectant management or placebo for treating early miscarriage | |||||||||
| Patient or population: women with a miscarriage at ≤14 weeks gestation Settings: hospital or other healthcare facility Intervention: multiple interventions (suction aspiration, misoprostol, dilation and curettage, mifepristone plus misoprostol, suction aspiration plus cervical preparation) Comparison (reference): expectant management or placebo Outcome: need for unplanned/emergency surgical procedure | |||||||||
| Intervention | Network evidence | Direct evidence | Indirect evidence | Illustrative comparative risks* (95% CI) for NMA estimate | |||||
| Relative effect | Certainty of the evidence | Relative effect | Certainty of the evidence | Relative effect | Certainty of the evidence | Risk | Risk | Risk difference | |
| Suction aspiration plus cervical preparation | Not estimable | ‐ | Not reported by included studies | ‐ | Not estimable | ‐ | Not estimable | Not estimable | Not estimable |
| Suction aspiration | 0.37 (0.22 to 0.65) | ⊕⊕⊕⊖ MODERATEb | 0.51 (0.30 to 0.87) | ⊕⊕⊕⊕ HIGH | 0.13 (0.05 to 0.35) | ⊕⊕⊖⊖ LOWa | 120 per 1000 | 44 per 1000 | 76 fewer per 1000 (from 42 fewer to 94 fewer) |
| Dilation and curettage | 0.80 (0.09 to 7.02) | ⊕⊖⊖⊖ VERY LOWc | Not reported by included studies | ‐ | Not estimable | ‐ | 120 per 1000 | 96 per 1000 | 24 fewer per 1000 (from 109 fewer to 722 more) |
| Mifepristone plus misoprostol | 0.64 (0.33 to 1.23) | ⊕⊕⊖⊖ LOWe | 0.32 (0.11 to 0.90) | ⊕⊕⊕⊖ MODERATEd | 0.91 (0.43 to 1.93) | ⊕⊕⊖⊖ LOWa | 120 per 1000 | 77 per 1000 | 43 less per 1000 (from 80 fewer to 28 more) |
| Misoprostol | 1.04 (0.56 to 1.95) | ⊕⊕⊖⊖ LOWg | 0.67 (0.23 to 1.95) | ⊕⊕⊖⊖ LOWf | 1.28 (0.61 to 2.66) | ⊕⊕⊖⊖ LOWa | 120 per 1000 | 125 per 1000 | 5 more per 1000 (from 53 fewer to 114 more) |
| *The basis for the assumed risk (e.g. the median control group risk across studies) is provided in footnotes. The corresponding risk (and its 95% confidence interval) is based on the assumed risk in the comparison group and the relative effect of the intervention (and its 95% CI). | |||||||||
| GRADE Working Group grades of evidence | |||||||||
| a Indirect evidence downgraded ‐2 due to serious imprecision b Network evidence downgraded ‐1 due to high certainty direct evidence downgraded due to incoherence c Network evidence downgraded ‐1 due to low certainty indirect loop further downgraded due to imprecision d Direct evidence downgraded ‐1 due to imprecision e Network evidence downgraded ‐1 due to moderate certainty direct evidence downgraded due to incoherence f Direct evidence downgraded ‐2 due to serious imprecision g Network evidence downgraded due to low certainty indirect evidence with imprecision but not further downgraded as indirect evidence previously downgraded for imprecision | |||||||||
| Medical and surgical management compared with expectant management or placebo for treating early miscarriage | |||||
| Patient or population: women with a miscarriage at ≤14 weeks gestation Settings: hospital or other healthcare facility Intervention: multiple interventions (suction aspiration, misoprostol, dilation and curettage, mifepristone plus misoprostol, suction aspiration plus cervical preparation) Comparison (reference): expectant management or placebo Outcome: pain scores (visual analogue scale) | |||||
| Intervention | Anticipated absolute effects* (95% CI) | № of participants | Certainty of the evidence | Comments | |
|---|---|---|---|---|---|
| Risk with standard care | Risk with intervention | ||||
| Suction aspiration plus cervical preparation | The mean pain score was 0 | Not reported by included studies | ‐ | ‐ | |
| Suction aspiration | The mean pain score was 0 | Not reported by included studies | ‐ | ‐ | |
| Dilation and curettage | The mean pain score was 0 | Not reported by included studies | ‐ | ‐ | |
| Mifepristone plus misoprostol | The pain score in the mifepristone plus misoprostol group was on average 0.14 higher (from 0.21 lower to 0.5 higher) than in the expectant management or placebo group | 122 | ⊕⊕⊝⊝ | small effect | |
| Misoprostol | The pain score in the misoprostol group was on average 0.33 higher (from 0.08 lower to 0.57 higher) than in the expectant management or placebo group | 262 | ⊕⊕⊝⊝ | small effect | |
| *The risk in the intervention group (and its 95% confidence interval) is based on the assumed risk in the comparison group and the relative effect of the intervention (and its 95% CI). | |||||
| GRADE Working Group grades of evidence | |||||
| a ‐1 as patient reported outcome b ‐1 due to imprecision | |||||
| Medical and surgical management compared with expectant management or placebo for treating early miscarriage | |||||||||
| Patient or population: women with a miscarriage at ≤14 weeks gestation Settings: Hospital or other healthcare facility Intervention: multiple interventions (suction aspiration, misoprostol, dilation and curettage, mifepristone plus misoprostol, suction aspiration plus cervical preparation) Comparison (reference): expectant management or placebo Outcome: pelvic inflammatory disease, sepsis or endometritis | |||||||||
| Intervention | Network evidence | Direct evidence | Indirect evidence | Illustrative comparative risks* (95% CI) for NMA estimate | |||||
| Relative effect | Certainty of the evidence | Relative effect | Certainty of the evidence | Relative effect | Certainty of the evidence | Risk | Risk | Risk difference | |
| Suction aspiration plus cervical preparation | Not estimable | ‐ | Not reported by included studies | ‐ | Not estimable | ‐ | Not estimable | Not estimable | Not estimable |
| Suction aspiration | 1.42 (0.88 to 2.28) | ⊕⊕⊕⊖ MODERATEc | 1.35 (0.76 to 2.41) | ⊕⊕⊕⊖ MODERATEa | 1.55 (0.66 to 3.68) | ⊕⊕⊖⊖ LOWb | 36 per 1000 | 51 per 1000 | 15 more per 1000 (from 4 fewer to 46 more) |
| Dilation and curettage | 1.85 (1.05 to 3.25) | ⊕⊖⊖⊖ VERY LOWf | 3.30 (0.82 to 13.28) | ⊕⊕⊖⊖ LOWd | 1.65 (0.89 to 3.06) | ⊕⊖⊖⊖ VERY LOWe | 36 per 1000 | 67 per 1000 | 31 more 1000 (from 2 more to 81 more) |
| Mifepristone plus misoprostol | 0.90 (0.48 to 1.68) | ⊕⊕⊖⊖ LOWg | 0.73 (0.30 to 1.80) | ⊕⊕⊖⊖ LOWd | 1.11 (0.47 to 2.64) | ⊕⊕⊖⊖ LOWb | 36 per 1000 | 32 per 1000 | 4 fewer per 1000 (from 19 fewer to 25 more) |
| Misoprostol | 1.08 (0.62 to 1.88) | ⊕⊕⊕⊖ MODERATEc | 1.84 (0.35 to 9.68) | ⊕⊕⊖⊖ LOWd | 1.10 (0.56 to 2.16) | ⊕⊕⊕⊖ MODERATEh | 36 per 1000 | 39 per 1000 | 3 more per 1000 (from 14 fewer to 32 more) |
| *The basis for the assumed risk (e.g. the median control group risk across studies) is provided in footnotes. The corresponding risk (and its 95% confidence interval) is based on the assumed risk in the comparison group and the relative effect of the intervention (and its 95% CI). | |||||||||
| GRADE Working Group grades of evidence | |||||||||
| a Direct evidence downgraded ‐1 due to imprecision b Indirect evidence downgraded ‐2 due to serious imprecision c Network evidence downgraded ‐1 due to moderate certainty direct evidence not further downgraded due to imprecision as direct evidence previously downgraded for imprecision d Direct evidence downgraded ‐2 due to serious imprecision e Indirect evidence downgraded ‐3 due to serious design limitations and imprecision in direct evidence f Network evidence downgraded ‐3 due to very low certainty indirect evidence, further downgraded ‐1 for incoherence but upgraded +1 as network is precise g Network evidence downgraded ‐2 due to low certainty direct evidence, not further downgraded due to imprecision as direct evidence previously downgraded for imprecision h Indirect evidence downgraded ‐1 due to imprecision in direct evidence | |||||||||
| Medical and surgical management compared with expectant management or placebo for treating early miscarriage | |||||||||
| Patient or population: women with a miscarriage at ≤14 weeks gestation Settings: hospital or other healthcare facility Intervention: multiple interventions (suction aspiration, misoprostol, dilation and curettage, mifepristone plus misoprostol, suction aspiration plus cervical preparation) Comparison (reference): expectant management or placebo Outcome: days of bleeding | |||||||||
| Intervention | Network evidence | Direct evidence | Indirect evidence | Illustrative comparative risks* (95% CI) for NMA estimate | |||||
| Mean difference | Certainty of the evidence | Mean difference | Certainty of the evidence | Mean difference | Certainty of the evidence | Risk | Risk | Risk difference | |
| Suction aspiration plus cervical preparation | Not estimable | ‐ | Not reported by included studies | ‐ | Not estimable | ‐ | Not estimable | Not estimable | Not estimable |
| Suction aspiration | ‐2.00 (‐3.01 to ‐0.99) | ⊕⊖⊖⊖ VERY LOWc | ‐2.75 (‐4.08 to ‐1.42) | ⊕⊕⊖⊖ LOWa | ‐0.73 (‐2.12 to 0.66) | ⊕⊖⊖⊖ VERY LOWb | 10 days | 8 days | 2 days less (from 0.99 days less to 3.01 days less) |
| Dilation and curettage | ‐1.96 (‐3.48 to ‐0.45) | ⊕⊕⊖⊖ LOWf | ‐1.26 (‐2.27 to ‐0.25) | ⊕⊕⊖⊖ LOWd | ‐2.47 (‐4.47 to ‐0.46) | ⊕⊖⊖⊖ VERY LOWe | 10 days | 8.04 days | 1.96 days less (from 0.45 days less to 3.48 days less) |
| Mifepristone plus misoprostol | ‐0.14 (‐1.71 to 1.43) | ⊕⊖⊖⊖ VERY LOWh | 0.70 (‐0.43 to 1.83) | ⊕⊖⊖⊖ VERY LOWg | ‐0.77 (‐2.83 to 1.30) | ⊕⊖⊖⊖ VERY LOWb | 10 days | 9.86 days | 0.14 days less (from 1.71 days less to 1.43 days more) |
| Misoprostol | ‐0.47 (‐1.53 to 0.60) | ⊕⊖⊖⊖ VERY LOWk | 0.32 (‐2.19 to 2.84) | ⊕⊖⊖⊖ VERY LOWi | ‐0.96 (‐2.27 to 0.35) | ⊕⊕⊖⊖ LOWj | 10 days | 9.53 days | 0.47 days less (from 1.53 days less to 0.60 days more) |
| *The basis for the assumed risk (e.g. the median control group risk across studies) is provided in footnotes. The corresponding risk (and its 95% confidence interval) is based on the assumed risk in the comparison group and the relative effect of the intervention (and its 95% CI). | |||||||||
| GRADE Working Group grades of evidence | |||||||||
| a Direct evidence downgraded ‐2 due to patient reported outcome and significant heterogeneity b Indirect evidence downgraded ‐4 due to patient reported outcome, significant heterogeneity and serious imprecision c Network evidence downgraded ‐4 due to low certainty direct evidence, further downgraded due to incoherence and not upgraded as direct grade not downgraded for imprecision d Direct evidence downgraded ‐2 due to patient reported outcome and imprecision e Indirect evidence downgraded ‐4 due to very low certainty direct evidence which was due to patient reported outcome, moderate design limitations and serious imprecision f Network evidence downgraded ‐2 due to low certainty direct evidence, further downgraded ‐1 for incoherence but upgraded +1 as network is precise and direct evidence was previously downgraded for imprecision g Direct evidence downgraded ‐3 due to patient reported outcome and serious imprecision h Network evidence downgraded ‐5 due to very low certainty direct evidence, further downgraded due to incoherence but not even further downgraded due to imprecision as direct evidence previously downgraded for imprecision i Direct evidence downgraded ‐4 due to patient reported outcome, significant heterogeneity and serious imprecision j Indirect evidence downgraded ‐2 due to patient reported outcome and significant heterogeneity k Network evidence downgraded ‐3 due to low certainty indirect evidence downgraded ‐1 due to imprecision | |||||||||
| Medical and surgical management compared with expectant management or placebo for treating early miscarriage | ||||
| Patient or population: women with a miscarriage at ≤14 weeks gestation Settings: hospital or other healthcare facility Intervention: multiple interventions (suction aspiration, misoprostol, dilation and curettage, mifepristone plus misoprostol, suction aspiration plus cervical preparation) Comparison (reference): expectant management or placebo Outcome: women's views/ satisfaction | ||||
| Intervention | Narrative synthesis | № of participants | Certainty of the evidence | Comments |
|---|---|---|---|---|
| Suction aspiration plus cervical preparation | Not reported by included studies | (0 RCTs) | ‐ | |
| Suction aspiration | 2 trials described 92 out of 96 women (98.5%) as being satisfied with suction aspiration compared to 97 out of 99 women (98.0%) for expectant management or placebo. 1 trial used a 10 point numerical scale and found suction aspiration had a satisfaction score of 7.57 from 175 women and expectant management or placebo also had a 7.57 score from 177 women. | 547 | ⊕⊕⊕⊝ | |
| Dilatation and curettage | Not reported by included studies | (0 RCTs) | ‐ | |
| Mifepristone plus misoprostol | 1 trial used a visual analogue scale and found Mifepristone plus misoprostol had a score of 28.6 (SD 24.8) from 60 women compared to 25.2 (SD 25.6) from 62 women for expectant management or placebo | 122 | ⊕⊝⊝⊝ | |
| Misoprostol | 1 trial used a visual analogue scale and found misoprostol had a score of 8.9 (+/‐ 1.3) compared to 8.7 (+/‐ 1.5) for expectant management or placebo with 52 women in each arm. 1 trial described 14 out of 16 (87.5%) women as being satisfied with misoprostol compared to 12 out of 16 (75%) women as being satisfied with expectant management or placebo | 136 | ⊕⊕⊝⊝ | |
| GRADE Working Group grades of evidence | ||||
| a‐1 no meta‐analysis possible, narrative synthesis was conducted, estimates are not precise b ‐1 due to design limitations c ‐1 due to imprecision | ||||
Background
Description of the condition
Miscarriage is the most common cause of pregnancy loss. An estimated 15% of pregnancies will end in miscarriage, with 25% of women experiencing a miscarriage in their lifetime (Alberman 1992). This can have emotional and physical impact on both women and their partners extending well beyond the pregnancy (Conway 2000; Geller 2001; Neugebauer 1997).
Miscarriage is generally defined as the spontaneous pregnancy loss before 24 weeks’ gestation (Shiers 2003). Most miscarriages happen in the first 14 weeks, and are known as early miscarriages (Alberman 1992). The clinical signs of miscarriage are vaginal bleeding, usually with abdominal pain. Miscarriage can lead to serious morbidity, including haemorrhage and infection, and even death, particularly in low‐ and middle‐income countries (MBRRACE‐UK 2016, WHO 2018). A missed miscarriage, also known as a delayed or silent miscarriage, is diagnosed when a non‐viable pregnancy is identified on ultrasound scan. Often, women who have missed miscarriage are asymptomatic or have small amounts of vaginal bleeding or pain before the diagnosis is made, but all pregnancy tissue is retained in the uterus. In contrast, incomplete miscarriage is diagnosed when pregnancy tissue has been partly expelled from the uterus (NICE 2019).
Description of the intervention
Miscarriage can be managed expectantly, medically, or surgically. Surgical methods have traditionally been used to manage early miscarriage. Dilatation and curettage uses sharp metal curettage that is often performed in an operating room under regional or general anaesthesia. Sharp curettage is often performed after dilatation of the cervix. Even though, it is a relatively simple procedure, it does carry a small chance of serious complications, such as anaesthetic complications, infection, uterine perforation and Asherman's syndrome. Suction aspiration (electrical or manual vacuum aspiration) has replaced sharp curettage in high‐income countries and has a well‐documented safety profile and is the recommended surgical method according to the World Health Organization (WHO) safe abortion guidelines (WHO 2009, WHO 2012a). Even so, it is less commonly used in low‐ and middle‐income countries due to lack of equipment and experience. Surgical methods can be combined with an agent to prepare (or ripen) the cervix to avoid the risks of injury from cervical dilation. Commonly used agents include mechanical and pharmacological dilators. The mechanical dilators may use osmotic cervical rods, Foley catheters or laminaria to dilate the cervix. The pharmacological dilators cause cervical ripening by softening and dilation of the cervix. The most common pharmacological dilator is misoprostol, a synthetic prostaglandin E1 analogue that induces cervical ripening and uterine contraction. It is water‐soluble and heat‐stable (Davies 2001). Oral and sublingual routes have the advantage of rapid onset of action, while the vaginal and rectal routes result in prolonged activity and greater bioavailability (Schaff 2005). Misoprostol is, however, associated with side effects such as diarrhoea, abdominal pain, nausea and vomiting, shivering and pyrexia (Tunçalp 2012).
Medical methods of management of miscarriage include various agents. They usually involve a synthetic prostaglandin and the most commonly used prostaglandin is misoprostol. Other synthetic prostaglandins are available, such as gemeprost or dinoprost, but these agents are less frequently used in this setting. Mifepristone is a progesterone antagonist that interferes with the production or functioning of progesterone and can initiate shedding of pregnancy tissue. Mifepristone has been used alone for terminating unwanted pregnancies, but more frequently is used in combination with misoprostol to manage early miscarriage. It is considered to be more useful in women with missed miscarriages where a non‐viable pregnancy is identified on ultrasound scan, and pregnancy tissue is retained in the uterus. In women with incomplete miscarriage, the anti‐progesterone effect of mifepristone is considered less useful and treatment is aimed to stimulate uterine contractility often with misoprostol alone. Expectant management involves no surgical or medical intervention, with the expectation that the miscarriage will happen naturally.
Why it is important to do this review
Several Cochrane Reviews have compared an individual method for managing miscarriage with another method or with expectant management (Lemmers 2019; Kim 2017; Nanda 2012; Tuncalp 2010). However, a standard pairwise meta‐analysis can only compare two methods that have been directly compared in head‐to‐head trials (direct evidence). In the absence of a single high‐quality randomised controlled trial that compares all methods for managing miscarriage, uncertainty remains about which is the most effective. For the management of miscarriage with multiple competing treatment methods, not all of which have been directly compared, a network meta‐analysis may be better able to allow for all possible comparisons to be made so we can determine which method is most effective (Caldwell 2005; Caldwell 2010). A network meta‐analysis simultaneously pools all the available direct and indirect evidence on relative treatment effects, within a single coherent analysis. Indirect evidence is obtained by inferring the relative effectiveness of two competing methods through a common comparator. Thus, a network meta‐analysis produces estimates of the relative effects of each method compared with every other in a network, even though some pairs may not have been directly compared, and has the potential to reduce the uncertainty in treatment effect estimates (Caldwell 2005). It also allows for the calculation of the probability that each method is the best for any given outcome and can be used to identify gaps in the evidence base (Caldwell 2005).
Objectives
To estimate the relative effectiveness and safety profiles for the different management methods for early miscarriage, and to provide rankings of the available methods according to their effectiveness, safety, and side‐effect profile using a network meta‐analysis.
Methods
Criteria for considering studies for this review
Types of studies
We included all randomised controlled comparisons that assessed the effectiveness or safety of methods for miscarriage management. Cluster‐randomised trials and quasi‐randomised trials were eligible for inclusion. Randomised trials published only as abstracts were eligible if sufficient information could be retrieved. We excluded non‐randomised trials.
Types of participants
We included all studies that included women who were being treated for early miscarriage (pregnancy loss at less than or equal to 14 weeks of gestation), diagnosed by ultrasound or clinically alone. We included women with both missed and incomplete miscarriage. Late miscarriages after 14 weeks of gestation (often referred to as intrauterine fetal deaths) was not eligible for inclusion in the review. We considered for inclusion studies conducted in all settings regardless of the age of women.
Types of interventions
All interventions were eligible for inclusion, and the following were included in the review: suction aspiration, suction aspiration plus cervical preparation, dilatation and curettage, mifepristone plus misoprostol, misoprostol, and expectant management or placebo.
We included regimens irrespective of their dose as long as they were in the therapeutic range that are recommended in international guidelines. Multi‐arm trials that compared different dosages, regimens or routes of one drug, but also compared those versus another drug or method, were included. For the multi‐arm trials, we merged the intervention arms of different dosages, regimens or routes of the same drug together for the global analysis of all outcomes and did not treat them as separate independent comparisons. We did not include trials that compared exclusively different dosages, regimens or routes of administration of the same drug. The review was restricted to studies that evaluated drugs or interventions administered by healthcare professionals.
We classified the comparisons within a study as follows:
-
suction aspiration plus cervical preparation = any surgical management that involves suction aspiration with cervical preparation agents;
-
suction aspiration = any surgical management that involves suction aspiration without any cervical preparation agents;
-
dilatation and curettage = any surgical treatment involving sharp metal curette;
-
mifepristone plus misoprostol = any medical management with the combined use of mifepristone plus misoprostol at any dose, route or regimen;
-
misoprostol = any medical management with the use of misoprostol alone at any dose, route or regimen;
-
expectant management = any management that does not involve any surgical or medical treatment.
Types of outcome measures
We estimated the relative effects and rankings of the competing methods of miscarriage management for the following outcomes.
Primary outcomes
-
Complete miscarriage: this is defined as evidence of complete evacuation of uterine contents based on clinical findings or ultrasound examination after a specific time period as defined in the primary studies. Outcomes were pooled regardless of the timeframe for assessment.
-
Composite outcome of death or serious complications (e.g. uterine perforation, need for further life‐saving procedures including hysterectomy, blood transfusion or intensive care unit admission).
Secondary outcomes
-
Need for unplanned/emergency surgical procedure.
-
Pain scores (visual analogue scale).
-
Pelvic inflammatory disease, sepsis or endometritis.
-
Mean volumes of blood loss (mL).
-
Change in haemoglobin measurements before and after the miscarriage.
-
Days of bleeding.
-
Cervical tear.
-
Women’s views or satisfaction.
-
Mean duration of hospital stay (days).
-
Re‐admission to hospital.
-
Nausea.
-
Vomiting.
-
Diarrhoea.
-
Pyrexia.
-
Anxiety score.
-
Depression score.
Search methods for identification of studies
The following methods section of this review is based on a standard template used by Cochrane Pregnancy and Childbirth.
Electronic searches
We searched Cochrane Pregnancy and Childbirth’s Trials Register by contacting their Information Specialist (9 February 2021).
The Register is a database containing over 27,000 reports of controlled trials in the field of pregnancy and childbirth. It represents over 30 years of searching. For full current search methods used to populate Pregnancy and Childbirth’s Trials Register including the detailed search strategies for CENTRAL, MEDLINE, Embase and CINAHL; the list of handsearched journals and conference proceedings, and the list of journals reviewed via the current awareness service, please follow this link.
Briefly, Cochrane Pregnancy and Childbirth’s Trials Register is maintained by their Information Specialist and contains trials identified from:
-
monthly searches of the Cochrane Central Register of Controlled Trials (CENTRAL);
-
weekly searches of MEDLINE (Ovid);
-
weekly searches of Embase (Ovid);
-
monthly searches of CINAHL (EBSCO);
-
hand searches of 30 journals and the proceedings of major conferences;
-
weekly current awareness alerts for a further 44 journals plus monthly BioMed Central email alerts.
Search results are screened by two people and the full text of all relevant trial reports identified through the searching activities described above is reviewed. Based on the intervention described, each trial report is assigned a number that corresponds to a specific Pregnancy and Childbirth review topic (or topics), and is then added to the Register. The Information Specialist searches the Register for each review using this topic number rather than keywords. This results in a more specific search set that has been fully accounted for in the relevant review sections (Included studies, Excluded studies, Studies awaiting classification or Ongoing studies).
In addition, we searched ClinicalTrials.gov and the WHO International Clinical Trials Registry Platform (ICTRP) for unpublished, planned and ongoing trial reports (Feb 12 2021) using the terms listed in Appendix 1.
Searching other resources
We retrieved additional relevant references cited in papers identified through the above search strategy. We screened citations and abstracts and searched for the full texts of studies identified as abstracts. If required, we sought information from primary authors to investigate whether these studies meet eligibility criteria, and to obtain outcome and study data. If this was not possible, we only included abstracts if we could extract sufficient information to satisfy our eligibility criteria and the study authors reported the outcomes of interest. Trials that compared at least two of the drugs or interventions were eligible and we searched for all possible comparisons formed by the drugs or interventions of interest. We did not apply any language or date restrictions.
Data collection and analysis
Selection of studies
At least two review authors (JG, HJ, VD) retrieved and independently assessed for inclusion all the potential studies we identified as a result of the search strategy. Any disagreements were resolved through discussion or, when required, with consultation with a third review author (IDG). We created a PRISMA study flow diagram to map out the number of records identified, included and excluded (Figure 1).

Study flow diagram.
Data extraction and management
We designed an electronic form to extract data. For eligible studies, at least three review authors (JG, AP, HJ, AD, LB, VD) independently extracted the data using the form. We resolved discrepancies through discussion or, when required, with consultation with a seventh review author (IDG). We entered data into Review Manager 5 (RevMan 5.4) software and it was checked for accuracy (RevMan 2014). When information regarding any of the above was unclear, we attempted to contact the authors of the original reports to provide further details. We extracted the following data.
Methods extracted
-
Study design
-
Sequence generation
-
Allocation sequence concealment
-
Blinding
-
Attrition
-
Study protocol and inconsistencies compared with the published report
-
Financial support and conflicts of interest
-
Other concerns about bias
Data extracted
From each included study we extracted the number of participants, along with the inclusion and exclusion criteria. We also extracted the interventions being compared including the healthcare setting, and their respective primary and secondary outcomes relevant to this review. We extracted all relevant arm level data (e.g. number of events and number of participants for binary outcomes and means and standard deviations per study arm for continuous outcomes). Participants in the network could in principle have been randomised to any of the methods being compared. For example, a woman with an early miscarriage could be equally likely to be randomised to dilatation and curettage, misoprostol, suction aspiration, suction aspiration plus cervical preparation, mifepristone plus misoprostol or expectant management or placebo. All of these six interventions were of direct interest.
Data on potential effect modifiers
From each included study we extracted the following study, intervention and population characteristics that may act as effect modifiers:
-
gestational age (less than or equal to nine weeks versus greater than nine weeks of gestation);
-
type of miscarriage (incomplete versus missed miscarriage);
-
healthcare setting (inpatient versus outpatient);
-
dosage, regimen, and route of drug administration (sublingual, rectal, oral).
Other data
From each included study we extracted the following additional information:
-
country or countries in which the study was performed;
-
date of publication;
-
type of publication (full‐text publication, abstract publication, unpublished data);
-
trial registration reference.
Assessment of risk of bias in included studies
At least two review authors (JG, HJ, AD, LB, VD) independently assessed the risk of bias for each included study using the criteria outlined in the Cochrane Handbook for Systematic Reviews of Interventions (Higgins 2011). Any disagreement was resolved by discussion or by involving another review author (AP, IDG).
(1) Random sequence generation (checking for possible selection bias)
We described for each included study the method used to generate the allocation sequence in sufficient detail to allow an assessment of whether it should produce comparable groups.
We assessed the methods as:
-
low risk of bias (any truly random process, e.g. random number table; computer random number generator);
-
high risk of bias (any non‐random process, e.g. odd or even date of birth; hospital or clinic record number);
-
unclear risk of bias.
(2) Allocation concealment (checking for possible selection bias)
We described for each included study the method used to conceal allocation to interventions prior to assignment and assessed whether intervention allocation could have been foreseen in advance of, or during recruitment, or changed after assignment.
We assessed the methods as:
-
low risk of bias (e.g. telephone or central randomisation; consecutively numbered sealed opaque envelopes);
-
high risk of bias (open random allocation; unsealed or non‐opaque envelopes, alternation; date of birth);
-
unclear risk of bias.
(3.1) Blinding of participants and personnel (checking for possible performance bias)
We described for each included study the methods used, if any, to blind study participants and personnel from knowledge of which intervention a participant received. We considered that studies were at low risk of bias if they were blinded, or if we judged that the lack of blinding would have been unlikely to affect results. We assessed blinding separately for different outcomes or classes of outcomes.
We assessed the methods as:
-
low, high or unclear risk of bias for participants;
-
low, high or unclear risk of bias for personnel.
(3.2) Blinding of outcome assessment (checking for possible detection bias)
We described for each included study the methods used, if any, to blind outcome assessors from knowledge of which intervention a participant received. We assessed blinding separately for different outcomes or classes of outcomes.
We assessed methods used to blind outcome assessment as at:
-
low, high or unclear risk of bias.
(4) Incomplete outcome data (checking for possible attrition bias due to the amount, nature and handling of incomplete outcome data)
We described for each included study, and for each outcome or class of outcomes, the completeness of data including attrition and exclusions from the analysis. We state whether attrition and exclusions were reported and the numbers included in the analysis at each stage (compared with the total randomised participants), reasons for attrition or exclusion where reported, and whether missing data were balanced across groups or were related to outcomes. Where sufficient information was reported, or has been supplied by the trial authors, we have re‐included missing data in the analyses which we undertook.
We assessed methods as at:
-
low risk of bias (e.g. no missing outcome data; missing outcome data balanced across groups or not exceeding 10% for the primary outcomes of the review);
-
high risk of bias (e.g. numbers or reasons for missing data imbalanced across groups; ‘as treated’ analysis done with substantial departure of intervention received from that assigned at randomisation or exceeding 10% for the primary outcomes of the review);
-
unclear risk of bias.
(5) Selective reporting (checking for reporting bias)
We described for each included study how we investigated the possibility of selective outcome reporting bias.
We assessed the methods as:
-
low risk of bias (where it was clear that all of the study’s pre‐specified outcomes and all expected outcomes of interest to the review have been reported);
-
high risk of bias (where not all the study’s pre‐specified outcomes have been reported; one or more reported primary outcomes were not pre‐specified; outcomes of interest were reported incompletely and so cannot be used; the study fails to include results of a key outcome that would have been expected to have been reported);
-
unclear risk of bias.
(6) Other bias (checking for bias due to problems not covered by (1) to (5) above)
We described for each included study any important concerns we have about other possible sources of bias.
We assessed whether each study was free of other problems that could put it at risk of bias:
-
low risk of other bias;
-
high risk of other bias;
-
unclear whether there is risk of other bias.
(7) Overall risk of bias
We made explicit judgements about whether studies are at high risk of bias, according to the criteria given in the Cochrane Handbook for Systematic Reviews of Interventions (Higgins 2011). With reference to (1) to (6) above, we assessed the likely magnitude and direction of the bias and whether we considered it was likely to impact on the findings. We explored the impact of the level of bias through undertaking sensitivity analyses (see the 'Sensitivity analysis' section). For our primary outcomes, we combined quality items and judged trials as “A" if they were at low risk of bias and if they include an adequate random sequence generation, allocation concealment, blinding, no selective reporting and with little loss to follow‐up (less than 10%) and free of other bias. Trials were judged at “B" if they were at moderate risk of bias and if they demonstrated serious limitations in key criteria excluding randomisation and allocation concealment, for example unclear concealment of allocation. Alternatively, trials were considered to be "C" or at high risk of bias if they had serious limitations in the randomisation sequence (quasi‐randomised) or lack of allocation concealment, or small blocked randomisation (<10) or other very serious, crucial methodological limitations such as lack of blinding for a subjective outcome. We explored the impact of the level of bias through undertaking sensitivity analyses ‐ seeSensitivity analysis for information about how the risk of bias was incorporated in the sensitivity analysis.
Measures of treatment effect
Relative treatment effects
For dichotomous data, we present results as a summary risk ratio (RR) with 95% confidence interval (CIs). For continuous data, we used the mean difference (MD) if outcomes are measured in the same way between trials. We used the standardised mean difference (SMD) to combine trials that measured the same outcome, but used different methods. If the target parameter is the effect of change in a continuous measure, such as the change in haemoglobin between baseline and post‐miscarriage, where possible, we accounted for the within‐patient correlation between baseline and post‐miscarriage estimates (Dias 2013). For the network meta‐analysis (NMA,) zero events were handled by deleting the relevant cells. These are summarised in forest plots displaying the results from pairwise, indirect and network (combining direct and indirect) analyses for the comparisons between the different methods of miscarriage management.
Relative treatment ranking
We also estimated the ranking probabilities for all methods of miscarriage management of being at each possible rank for each intervention (conditional on the model and specified vague priors). Then we obtained a treatment hierarchy using the surface under the cumulative ranking curve (SUCRA). SUCRA can also be expressed as a percentage of effectiveness or side effects of a treatment that would be ranked first without uncertainty; the larger the SUCRA the higher its rank among all available methods (Salanti 2011). The probabilities to rank the treatments are estimated under a Bayesian model with flat priors, assuming that the posterior distribution of the parameter estimates is approximated by a normal distribution with mean and variance equal to the frequentist estimates and variance–covariance matrix. Rankings are constructed drawing 1000 samples from their approximate posterior density. For each draw, the linear predictor is evaluated for each study, and the largest linear predictor is noted (White 2011).
Unit of analysis issues
Cluster‐randomised trials
We planned to include cluster‐randomised trials in the analyses along with individually‐randomised trials. We planned to adjust their sample sizes using the methods described in the Handbook (Higgins 2011), using an estimate of the intracluster correlation coefficient (ICC) derived from the trial (if possible), from a similar trial, or from a study of a similar population. If we had used ICCs from other sources, we planned to report this and to conduct sensitivity analyses to investigate the effect of variation in the ICC. Had we identified both cluster‐randomised trials and individually‐randomised trials, we planned to synthesise the relevant information. In cluster‐randomised trials, particular biases to consider include:
• recruitment bias;
• baseline imbalance;
• loss of clusters;
• incorrect analysis; and
• comparability with individually‐randomised trials.
We would have considered it reasonable to combine the results from both cluster‐randomised trials and individually‐randomised trials if there is little heterogeneity between the study designs and the interaction between the effect of intervention and the choice of randomisation unit was considered to be unlikely. We planned to also acknowledge heterogeneity in the randomisation unit and perform a sensitivity analysis to investigate the effects of the randomisation unit. We planned to include cluster‐randomised trials in the analyses along with individually‐randomised trials, but none were found.
Cross‐over trials
Cross‐over trials are not eligible for inclusion in this review.
Multi‐arm trials
We included multi‐arm trials and accounted for the correlation between the effect sizes in the network meta‐analysis. We treated multi‐arm studies as multiple independent comparisons in pairwise meta‐analyses.
Dealing with missing data
For included studies, we noted levels of attrition. We explored the impact of including studies with high levels of missing data in the overall assessment of treatment effect by using sensitivity analysis. We imputed missing standard deviations and errors using standard techniques where possible (Higgins 2011). For all outcomes, we performed analyses, as far as possible, on a modified intention‐to‐treat basis, i.e. we attempted to include all participants randomised to each group in the analyses, and we analysed all participants in the group to which they were allocated, regardless of whether or not they received the allocated intervention. The denominator for each outcome in each trial was the number randomised minus any participants whose outcomes were known to be missing.
Assessment of heterogeneity
Assessment of clinical and methodological heterogeneity
To evaluate the presence of clinical heterogeneity, we examined trial and study population characteristics across all eligible trials that compared each pair of interventions. We assessed the presence of clinical heterogeneity within each pairwise comparison by comparing these characteristics.
Assessment of transitivity across treatment comparisons
We assessed the assumption of transitivity by comparing the distribution of potential effect modifiers across the different pairwise comparisons. In this context we expect that the transitivity assumption will hold assuming the following: 1) the common treatment used to compare different miscarriage management drugs indirectly is similar when it appears in different trials (e.g. misoprostol is administered in a similar way in misoprostol versus suction aspiration trials and in misoprostol versus mifepristone plus misoprostol trials); 2) all pairwise comparisons do not differ with respect to the distribution of effect modifiers (e.g. the design and study characteristics of suction aspiration versus misoprostol trials are similar to misoprostol versus mifepristone plus misoprostol trials).
Assessment of statistical heterogeneity and inconsistency
Assumptions when estimating the heterogeneity
In standard pairwise meta‐analyses we estimated different heterogeneity variances for each pairwise comparison. In the network meta‐analysis, we assumed a common estimate for the heterogeneity variance across the different comparisons.
Measures and tests for heterogeneity
We assessed statistically the presence of heterogeneity within each pairwise comparison using the I² statistic and its 95% CI that measures the percentage of variability that cannot be attributed to random error (Higgins 2002). We based the assessment of statistical heterogeneity in the entire network on the magnitude of the heterogeneity variance parameter (τ2) estimated from the network meta‐analysis models. For dichotomous outcomes we compared the magnitude of the heterogeneity variance with the empirical distribution as derived by Turner (Turner 2012). We also estimated a total I² statistic value for heterogeneity in the network as described elsewhere (Higgins 2002). The certainty of the evidence was downgraded for inconsistency where I² > 60% in line with the World Health Organization standard operating procedures for grading evidence for guidelines (Vogel 2019).
Assessment of statistical inconsistency
The statistical agreement between the various sources of evidence in a network of interventions (consistency) was evaluated by global and local approaches to complement the evaluation of transitivity.
Local approaches for evaluating inconsistency
To evaluate the presence of inconsistency locally we used the loop‐specific approach. This method evaluates the consistency assumption in each closed loop of the network separately as the difference between direct and indirect estimates for a specific comparison in the loop (inconsistency factor) (Veroniki 2013). Then, the magnitude of the inconsistency factors and their 95% CIs can be used to infer about the presence of inconsistency in each loop. We assumed a common heterogeneity estimate within each loop.
Global approaches for evaluating inconsistency
To check the assumption of consistency in the entire network we used the "design‐by‐treatment" model as described by Higgins and colleagues (Higgins 2012). This method accounts for different sources of inconsistency that can occur when studies with different designs (two‐arm trials versus three‐arm trials) give different results as well as disagreement between direct and indirect evidence. Using this approach we inferred about the presence of inconsistency from any source in the entire network based on a Chi² test. We performed the design‐by‐treatment model in STATA using the mvmeta command (StataCorp. 2019).
Inconsistency and heterogeneity are interwoven; to distinguish between these two sources of variability we employed the I² statistic for inconsistency that measures the percentage of variability that cannot be attributed to random error or heterogeneity (within comparison variability).
Assessment of reporting biases
We aimed to minimise the potential impact of these biases by ensuring a comprehensive search for eligible studies and by being alert to duplication of data. If there were 10 or more studies in any of the direct comparisons, we investigated reporting biases (such as publication bias) using funnel plots to explore the possibility of small‐study effects (a tendency for estimates of the intervention effect to be more beneficial in smaller studies) as part of the assessment of the certainty of the direct evidence.
Data synthesis
Methods for direct treatment comparisons
We performed standard pairwise meta‐analyses using a random‐effects model in Review manager software (Revman 5.4) for every treatment comparison (DerSimonian 1986). The random‐effects method (DerSimonian 1986) was used for this analysis to mitigate for the high level of heterogeneity observed. This method incorporates an assumption that the different studies are estimating different, yet related, intervention effects. The standard errors of the study‐specific estimates are therefore adjusted to incorporate a measure of the extent of heterogeneity. This results to wider confidence intervals in the presence of heterogeneity, and corresponding claims of statistical significance are more conservative.
Methods for indirect and mixed comparisons
We initially generated and assessed the network diagrams to determine if a network meta‐analysis was feasible. Then we performed the network meta‐analysis within a frequentist framework using multivariate meta‐analysis estimated by restricted maximum likelihood. All analyses were done using Stata statistical software, release 15 (StataCorp, College Station, TX). We used the network suite of Stata commands designed for this purpose (White 2012; White 2015).
Subgroup analysis and investigation of heterogeneity
For the primary outcomes we had planned to carry out the following pre‐specified subgroup analyses by using the following effect modifiers.
-
gestational age (greater than nine weeks versus less than or equal to nine weeks of gestation);
-
type of miscarriage (incomplete versus missed miscarriage);
-
type of vacuum aspiration device used (electrical versus manual vacuum aspiration);
-
type of healthcare setting (inpatient versus outpatient);
-
dosage, regimen, and route of drug administration (sublingual, rectal, oral).
We assessed subgroup differences by evaluating the relative effects and assessment of model fit for the primary outcome of complete miscarriage.
Sensitivity analysis
For the primary outcomes we had planned to perform sensitivity analysis for the following:
-
overall risk of bias of the studies (restricted to studies at low risk of overall bias);
-
randomisation unit (cluster versus individual);
-
use of placebo versus expectant management.
-
exclusion of quasi‐randomised trials
We assessed differences by evaluating the relative effects and assessment of model fit.
Summary of findings and assessment of the certainty of the evidence
The summary of findings tables present evidence comparing all methods with a reference comparator, expectant management or placebo. Each table describes key features of the evidence relating to a single outcome. There is a table for each important outcome in accordance with the GRADE approach. These outcomes are 1) complete miscarriage, 2) composite outcome of death or serious complication, 3) need for unplanned/emergency surgical procedure, 4) pain scores (visual analogue scale), 5) pelvic inflammatory disease, sepsis or endometritis, 6) days of bleeding, and 7) women's views or satisfaction. We also present tables for two subgroups analyses of the complete miscarriage outcome: 1) missed miscarriage and 2) incomplete miscarriage. We assessed the certainty of the evidence using the GRADE approach as outlined in the GRADE handbook in order to assess the certainty of the body of evidence relating for each outcome for all comparisons. In order to create summary of findings tables, we used GRADEpro GDT, to import data from RevMan 5.4 (RevMan 2014).
We used the GRADE working group’s approach (Brignardello‐Petersen 2018; Puhan 2014) for rating the certainty of the network meta‐analysis effect estimates for all the comparisons and all outcomes. We appraised the certainty of the direct, indirect, and network evidence sequentially (in this order). First, we assessed the certainty of the direct evidence (where available) for a given outcome, and rated the evidence using the standard GRADE approach based on consideration of: study design limitations (risk of bias); inconsistency; imprecision; indirectness and publication bias (Higgins 2011). Study design limitations were assessed using an A, B or C scale with "A" studies being at low risk of bias and "C" studies being at high risk of bias as described before. For objective outcomes, importance was given to method of randomisation, allocation concealment and attrition bias, whereas for subjective outcomes blinding of the assessor was also taken into consideration. On all the network diagrams, of the outcomes where network meta‐analysis was possible, we display the certainty of the direct evidence using a colour‐coded key as outlined in the figure caption. Then we rated the certainty of the indirect evidence for the same given outcomes, and this was determined based on the lower of the certainty ratings of the two direct arms forming the dominant ‘first‐order’ loop in the network diagram for this outcome. Our final step was to determine the certainty of network evidence based on: (i) the higher certainty rating of the direct and indirect evidence, (ii) whether the relevant network exhibited ‘transitivity’, i.e. whether all the comparisons contributing data to the estimate were directly consistent with the PICO question, (iii) consideration of coherence between direct and indirect effect estimates, and (iv) precision of the network effect estimate. At each of these stages, two review authors (JG, AP) independently appraised the certainty ratings for the direct, indirect and network evidence. Disagreements between authors were resolved through discussion and consultation with a third review author (IDG) where necessary.
The certainty of network evidence for each outcome was rated as ‘high’, ‘moderate’, ‘low’ or ‘very low’ in accordance with the GRADE approach.
-
High certainty: we are very confident that the true effect lies close to that of the estimate of the effect.
-
Moderate certainty: we are moderately confident in the effect estimate. The true effect is likely to be close to the estimate of the effect, but there is a possibility that it is substantially different;
-
Low certainty: our confidence in the effect estimate is limited. The true effect may be substantially different from the estimate of the effect;
-
Very low certainty: we have very little confidence in the effect estimate. The true effect is likely to be substantially different from the estimate of effect.
For ease of comparison when interpreting the relative effects of all methods for managing a miscarriage compared to expectant management or placebo, the summary of findings tables include the effect estimate and certainty judgements for each of the direct evidence, indirect evidence and the network meta‐analysis, describing all the findings for a single outcome in each table. The anticipated absolute effects are also included, based on the network effect estimate for each treatment intervention in comparison with expectant management or placebo. The assumed risks in the expectant management or placebo group are based on weighted means of baseline risks from the studies with expectant management or placebo arms in the network meta‐analysis. The corresponding risks in the suction aspiration plus cervical preparation, suction aspiration, dilatation plus curettage, mifepristone plus misoprostol, misoprostol groups (and their 95% CIs) are based on the assumed risk in the expectant management or placebo group and the relative effect of the individual treatment intervention, when compared with the expectant management or placebo group (and its 95% CI) as derived from the network meta‐analysis.
Results
Description of studies
Results of the search
The results of the search are summarised in the PRISMA (Preferred Reporting Items for Systematic Reviews and Meta‐Analyses) flow diagram (Figure 1). The search of Cochrane Pregnancy and Childbirth's (CPC) Trials Register on 9 February 2021 retrieved in total 544 available records. One further record from additional author searches and manual searching of reference lists was obtained. We excluded 127 records as duplicates or based on their title and abstract. We examined the full text of 418 records and included in the network meta‐analysis 78 randomised trials (reported in 118 publications). We contacted the authors from 38 references for additional data or clarifications. We were able to obtain additional data or clarifications from trial authors for nine randomised trials (Characteristics of included studies). We excluded 248 studies (reported in 287 publications) (Characteristics of excluded studies), one trial (reported in one publication) could not be classified (Characteristics of studies awaiting classification) and 12 studies were still ongoing (Characteristics of ongoing studies).
Included studies
This review included 78 randomised trials, published between 1979 and 2021, involving 17,795 women. All studies were individually randomised; there were no cluster‐randomised studies. A number of multi‐arm trials were identified: three four‐arm trials and five three‐arm trials. For the three four‐arm trials as there was randomisation based on setting of care as well as intervention, the arms which had the same intervention were combined for the purposes of the network meta‐analysis. For two of the three‐arm trials, one arm was excluded from the analysis due to reasons detailed in the table of Characteristics of included studies. Most studies were reported in English (86%, 67/78); Four translations were obtained (three Portuguese and one Norwegian). One study was funded by Assistance Publique Hôpitaux de Paris, France (Torre 2012); one study was funded by Committee on Research and Conference Grants, University of Hong Kong (Ngai 2001); two studies were funded by the David and Lucille Packard Foundation (Dabash 2010, Taylor 2011); one study was funded by the Health Services Research Fund of Hong Kong (Chung 1999); one study was funded by the Healthcare Insurers Innovation Foundation, Canada (Hamel 2021); one study was funded by National Institute for Health Research HTA programme, UK (Chu 2020); four studies were funded by National Institutes of Health, USA (Zhang 2005; Davis 2007; Harwood 2008; Schreiber 2018); one study was funded by the Riverside Methodist Hospital Medical Research Foundation, USA (Lister 2005); one study was funded by a South and West NHS Executive research and development grant, UK (Trinder 2006); one study was funded by the Swedish Medical Research Council (Nielsen 1995). All the other 64 studies did not state their source of funding. One study declared consultancy fees from Danco laboratories as a conflict of interest (Schreiber 2018); one study declared the donation of £20,000 from Exelgyn, the manufacturers of mifepristone, which was an intervention used in the trial as a conflict of interest (Trinder 2006); one study declared that two authors had served as consultants to Pfizer as a conflict of interest (Zhang 2005). Ten studies stated that there were no conflicts of interest to declare from any of the authors, and 65 studies did not state whether the authors had any conflicts of interest.
The studies were conducted across 37 countries (including high‐, middle‐ and low‐income countries); there were no multi‐country trials. The median size of the trials was 180 participants (interquartile range (IQR) 206 (94 to 300)). Most studies were single‐centre studies (82%, 64/78); 14 studies were multi‐centre studies (18%, 14/78). Most trials (91%, 71/78) were performed in a hospital setting, four were performed in a community setting (5%), two (3%) in a mixed setting, and one (1%) of unspecified setting. Six of the studies only recruited women with an early first trimester miscarriage (less than or equal to nine weeks of gestation) with the majority (61/78) only specifying a gestational age of less than or equal to 14 weeks of gestation; a specific cut‐off in terms of gestational age was not specified in 11 out of 78 studies. Thirty‐six out of 78 studies were based purely on women with an incomplete miscarriage, 17 studies on women with a missed miscarriage, 19 had a mixed population of women with either a missed or incomplete miscarriage and in six studies the type of miscarriage was not specified.
Of the 78 included studies, 71 (90%) contributed data to the analysis, seven studies did not present the data in a usable form for meta‐analysis or narrative synthesis. Across the 71 trials (158 trial arms) that contributed data for analysis, the following agents were used either as intervention or comparison:
-
51 trial arms (33%) used misoprostol;
-
50 trial arms (32%) used suction aspiration;
-
26 trial arms (16%) used expectant management or placebo;
-
17 trial arms (11%) used dilatation and curettage;
-
11 trial arms (6%) used mifepristone plus misoprostol;
-
3 trial arms (2%) used suction aspiration plus cervical preparation.
Of the 51 trial arms that used misoprostol, the concentrations of the first dose administered were as follows: 19 of 51 (37%) used 800 micrograms, 17 of 51 (33%) used 400 micrograms, 13 of 51 (23%) used 600 micrograms, 1 of 51 (2%) used 200 micrograms, and 1 of 51 (2%) did not specify the dose of misoprostol. The routes of administration used for misoprostol was as follows: 26 of 51 (51%) gave misoprostol vaginally, 19 of 51 (37%) orally, 2 of 51 (4%) vaginally or orally, 2 of 51 (4%) sublingually, and 2 of 51 (4%) did not specify the route of administration.
Of the 11 trial arms that assessed the effectiveness of mifepristone, six of 11 (55%) used a 200 milligram dose of mifepristone, four of 11 (36%) used a 600 milligram dose and one of 11 (9%) used a dose of 400 milligrams. Mifepristone was always taken orally and given in combination with misoprostol, which was taken 24 to 72 hours later. The concentrations of misoprostol administered following mifepristone were as follows: 7 of 11 (64%) used 800 micrograms and 4 of 11 (36%) used 400 micrograms of misoprostol. The routes of administration for misoprostol following mifepristone were as follows: 5 of 11 (46%) gave misoprostol vaginally, 3 of 11 (27%) orally, and 3 of 11 (27%) vaginally or orally.
Of the 59 trials that contributed to the primary outcome, 14 (24%) made the assessment for complete miscarriage on days 1 to 5, 14 (24%) on day 7, 18 (31%) on days 10 to 14 and 9 (15%) over 15 days later. 4 studies (6%) did not specify the timeframe used to assess complete miscarriage.
Excluded studies
We excluded 248 trials (for details see Characteristics of excluded studies). The most common reasons for exclusion were because trials included participants who were over 14 weeks of gestation at the time of recruitment or were based on participants undergoing a termination of pregnancy. Some trials were not randomised, or exclusively investigated doses or routes of administration of the same method of management of miscarriage.
Risk of bias in included studies
We present summaries of the risk of bias of the included studies for each of the domains we assessed across all studies (Figure 2) and for each included study (Figure 3).

Risk of bias graph: review authors' judgements about each risk of bias item presented as percentages across all included studies.

Risk of bias summary: review authors' judgements about each risk of bias item for each included study.
Allocation
Adequate sequence generation was found to have been used in 49 of 78 trials (63%) and these trials were judged to be at low risk of bias. In 29 of 78 trials (37%) the description of sequence generation was not clearly stated and hence they were at unclear risk of bias. In 47 of 78 trials (60%) there was a clear description of adequate allocation concealment. However, in 31 of 78 trials (40%) the description of allocation concealment was inadequate and so these trials were at unclear risk of bias. Many of the trials with inadequate information about sequence generation or allocation concealment were abstracts or other forms of short communications, which had limited word counts. Most of the trials which had inadequate description of random sequence generation also gave inadequate information regarding allocation concealment.
Blinding
Only 9 of 78 trials (12%) had blinding of participants and personnel and hence were judged to be at low risk of bias. Four of 78 trials (5%) had unclear information regarding blinding of patients and personnel and were therefore judged to be at unclear risk of bias with the remaining 65 of 78 trials (83%) unblinded to either patients or personnel or both and therefore at high risk of bias. In the majority of these unblinded trials, the nature of the intervention and comparator, for example with misoprostol versus suction curettage, meant blinding was not practically possible rather than being a result of poor trial design. Blinding of the outcome assessor of the primary outcome of complete miscarriage was inadequately described in 56 of 78 trials (72%) meaning these were judged to be at unclear risk of bias. In 9 of 78 trials (12%) the outcome assessor was unblinded meaning these were at high risk of bias. Only in 12 of 78 trials (15%) was it clearly stated that the outcome assessor was blinded meaning these trials were at low risk of bias.
Incomplete outcome data
There were 66 of 78 trials (85%) that had minimal missing outcome data (less than 10%) and balanced in numbers across intervention groups with similar reasons for missing data across groups, and were therefore at low risk of attrition bias. Nine of 78 trials (12%) were judged to be at high risk of attrition bias due to losing over 10% of their participant population to follow up. Three of 78 trials (3%) were judged to be at unclear risk of attrition bias as not enough information was provided to assess whether or not the handling of incomplete data was appropriate.
Selective reporting
Only eight of 78 trials (10%) pre‐specified all outcomes in publicly available study protocols and were judged to be at low risk of reporting bias. Three of 78 trials (4%) did not report all pre‐specified outcomes as reported in their published protocols or methodology within the main report and were judged to be at high risk of bias for selective reporting. For most trials (67 of 78 trials; 86%), we were unable to identify a published protocol and the risk of reporting bias was judged to be unclear.
Other potential sources of bias
In 73 of 78 trials (94%) there were no other potential sources of bias detected and so these were judged to be at low risk of bias. Five of 78 trials (6%) were judged to be at unclear risk of bias; one because it was not explained why one arm of the trial was greater than 50% larger than the other arm despite random allocation and no indication of randomisation other than in a 1:1 ratio, one because a vaginal lubricant was co‐administered with the vaginal misoprostol for some participants which the authors acknowledge may have affected the rate of absorption of the medication, one because the method of outcome assessment varied between sites where the trial was conducted, and one because the research group accepted a donation of £20,000 from Exelgyn, the manufacturers of mifepristone. The majority of comparisons contained less than 10 studies, therefore investigation of publication bias was not valid. The comparison of suction aspiration vs misoprostol for the outcomes of nausea, vomiting and diarrhoea were downgraded for publication bias.
Overall risk of bias
For the comparison of suction aspiration versus misoprostol, 7 of 23 (30%) trials were judged to be at high overall risk of bias, and 16 of 23 (70%) trials at low overall risk of bias. For the comparison of suction aspiration versus dilatation & curettage, 2 of 5 (40%) trials were judged to be at high overall risk of bias, and 3 of 5 (60%) at low overall risk of bias. For the comparison of misoprostol versus mifepristone plus misoprostol, 2 of 7 (29%) trials were judged to be at high overall risk of bias, and 5 of 7 (71%) at low overall risk of bias. For the comparison of misoprostol versus dilatation & curettage, 2 of 4 (50%) trials were judged to be at high overall risk of bias, and 2 of 4 (50%) at low overall risk of bias. For the comparison of misoprostol versus suction aspiration plus cervical preparation, the single trial was judged to be at high overall risk of bias. For the comparison of misoprostol versus expectant or placebo, 1 of 10 (10%) trials were judged to be at high overall risk of bias, and 9 of 10 (90%) at low overall risk of bias. For the comparison of mifepristone plus misoprostol versus expectant or placebo, 1 of 3 (33%) trials were judged to be at high overall risk of bias, and 2 of 3 (67%) at low overall risk of bias. For the comparison of suction aspiration versus mifepristone plus misoprostol, suction aspiration versus expectant or placebo, and dilatation & curettage versus expectant or placebo, all trials were judged to be at low overall risk of bias.
Effects of interventions
See: Summary of findings 1 Complete miscarriage; Summary of findings 2 Complete miscarriage (missed miscarriage subgroup); Summary of findings 3 Complete miscarriage (incomplete miscarriage subgroup); Summary of findings 4 Composite outcome of death or serious complication; Summary of findings 5 Need for unplanned/emergency surgical procedure; Summary of findings 6 Pain scores (visual analogue scale); Summary of findings 7 Pelvic inflammatory disease, sepsis or endometritis; Summary of findings 8 Days of bleeding; Summary of findings 9 Women’s views/satisfaction
See: summary of findings Table 1 for the main comparison "complete miscarriage" and summary of findings Table 4 for the second primary outcome "composite outcome of death or serious complication". summary of findings Table 5, summary of findings Table 6, summary of findings Table 7, summary of findings Table 8 and summary of findings Table 9, present the effects of interventions from other important secondary outcomes such as "need for unplanned/ emergency surgical procedure", "pain scores (visual analogue scale)", "pelvic inflammatory disease, sepsis or endometritis", "days of bleeding", "women's views or satisfaction" respectively. summary of findings Table 2 and summary of findings Table 3 present the effects of the subgroup analyses of women with a missed miscarriage and women with an incomplete miscarriage respectively for the primary outcome of "complete miscarriage".
Please note that all of the analyses presented in the Data and analyses section relate to the 'direct evidence' and were used as per our methods to grade the evidence. The results from Data and analyses were also used to check the direction of effect in the subgroups, and subgroup analyses are presented for the outcome of complete miscarriage where a high level of global statistical inconsistency and heterogeneity was observed.
The following section presents the results as reported in all of the figures (Figure 4 to Figure 5). The figures present the results from the network diagrams, the forest plots with the pairwise, indirect and network (combining direct and indirect) effect estimates and the cumulative rankograms for all the outcomes with available data. The figures present the results for different methods for managing miscarriage in comparison to expectant management or placebo and different methods for managing miscarriage.
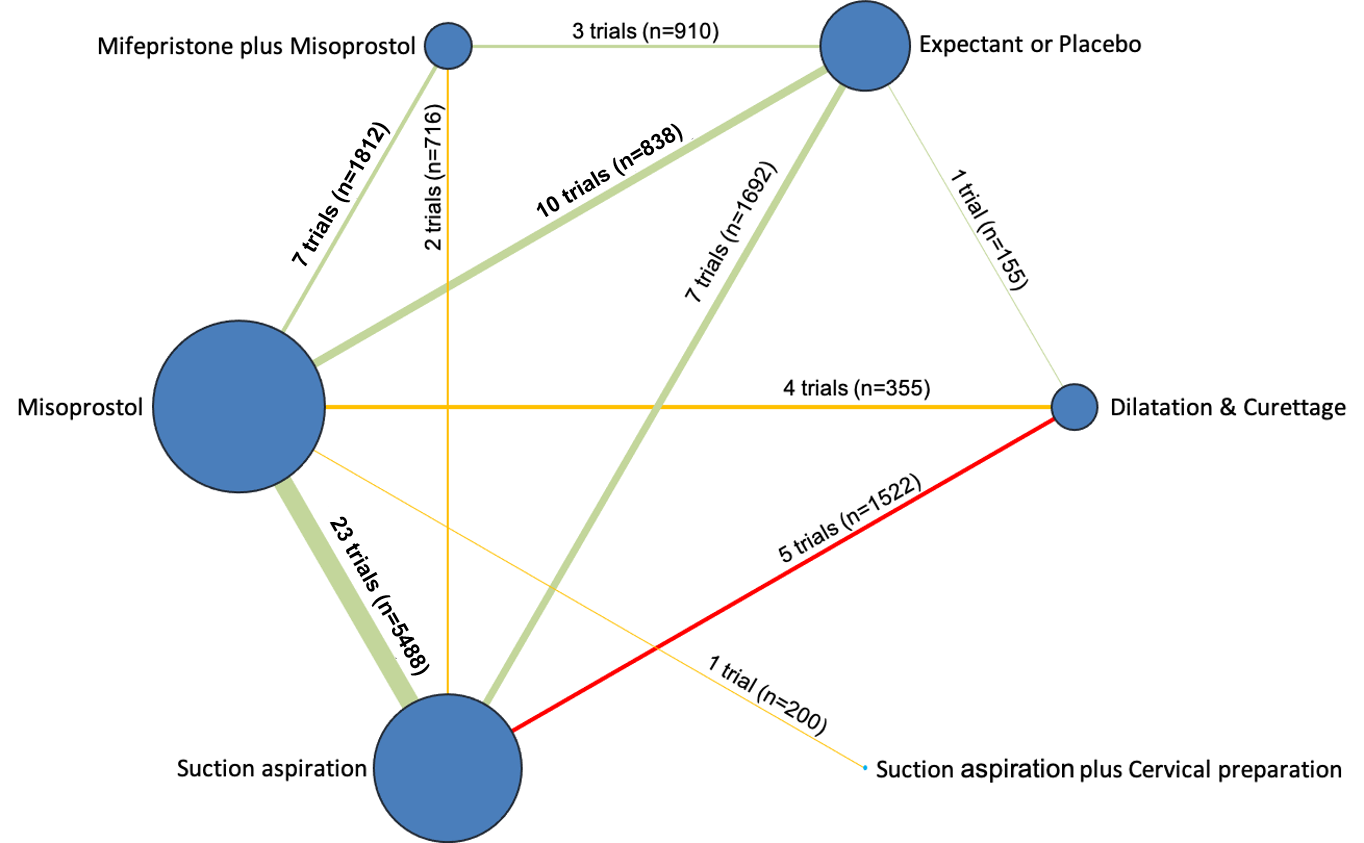
Network diagram for outcome of complete miscarriage. The nodes represent an intervention and their size is proportional to the number of trials comparing this intervention to any other in the network. The lines connecting each pair of interventions represent a direct comparison and are drawn proportional to the number of trials making each direct comparison. Numbers on the lines represent the number of trials and participants for each comparison. The colour of the line is green for high‐certainty evidence; light green for moderate‐certainty evidence; orange for low‐certainty evidence and red for very low‐certainty evidence. Multi‐arm trials contribute to more than one comparison.
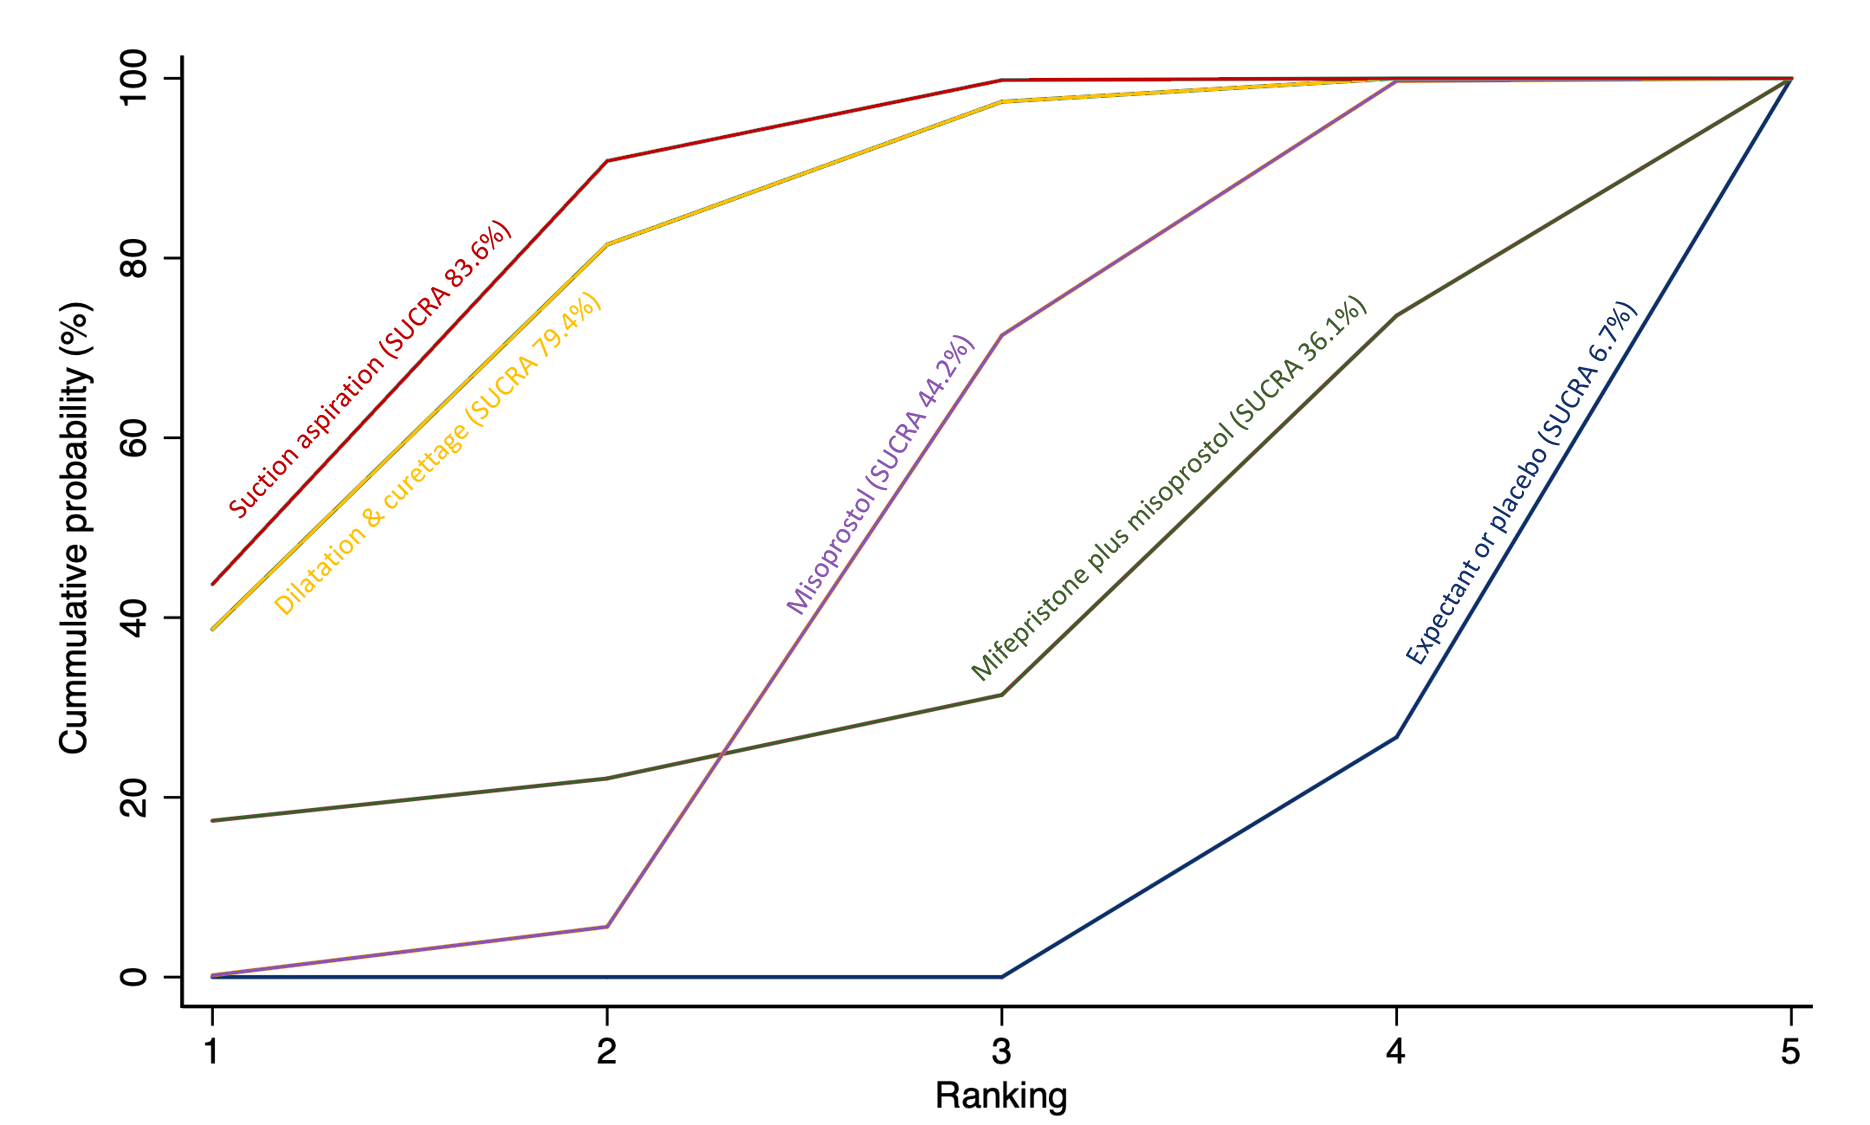
Cumulative rankogram comparing each of the methods of management of a miscarriage for incomplete miscarriage subgroup analysis for the outcome of complete miscarriage. Ranking indicates the cumulative probability of being the best method, the second best, the third best, etc. The x axis shows the relative ranking and the y‐axis the cumulative probability of each ranking. We estimate the SUrface underneath this Cumulative RAnking line (SUCRA); the larger the SUCRA the higher its rank among all available methods.
Primary outcomes
Complete miscarriage
The network diagram for the outcome of complete miscarriage is presented in Figure 4. Misoprostol was the most frequently investigated method of miscarriage management (45 of 63 trial arms [71%]) for this outcome (Figure 4).
Relative effects from the network meta‐analysis of 59 trials, suggested that suction aspiration plus cervical preparation (risk ratio (RR) 2.12, 95% confidence interval (CI) 1.41 to 3.20, low‐certainty evidence), dilatation and curettage (RR 1.49, 95% CI 1.26 to 1.75, low‐certainty evidence), suction aspiration (RR 1.44, 95% CI 1.29 to 1.62, low‐certainty evidence), mifepristone plus misoprostol (RR 1.42, 95% CI 1.22 to 1.66, moderate‐certainty evidence) and misoprostol (RR 1.30, 95% (CI) 1.16 to 1.46, low‐certainty evidence) may be more effective in achieving complete miscarriage compared with expectant management or placebo (Figure 6; summary of findings Table 1).
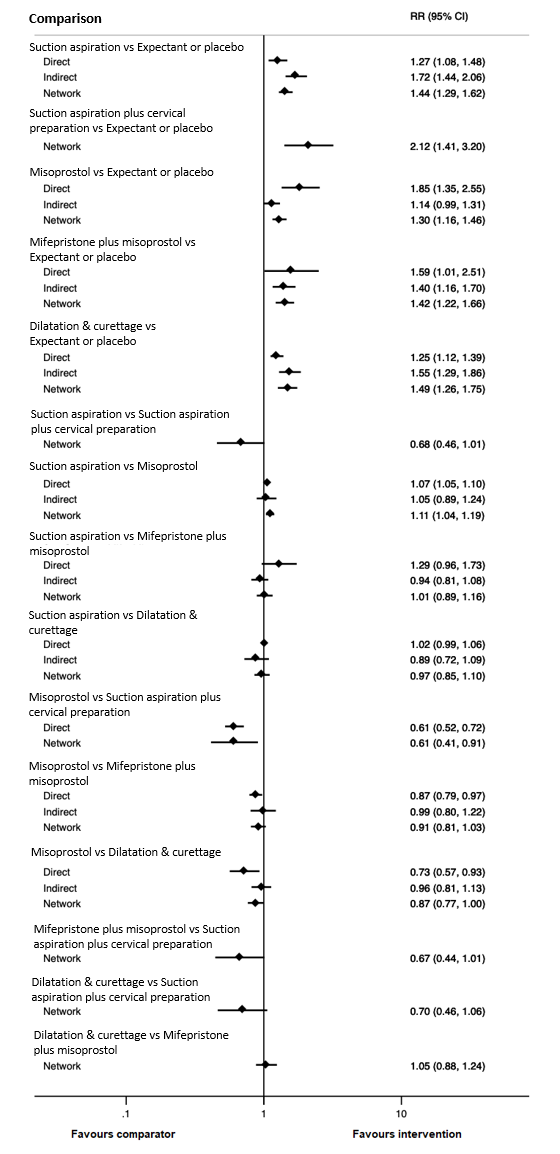
Forest plot with relative risk ratios and 95% CIs from pairwise, indirect and network (combining direct and indirect) analyses for outcome of complete miscarriage.
Based on these results, about 640 per 1000 women having expectant management or placebo would have a complete miscarriage compared with 1000 having suction aspiration plus cervical preparation, 954 for dilatation and curettage, 922 for suction aspiration, 909 for mifepristone plus misoprostol and 832 per 1000 women for misoprostol (summary of findings Table 1).
The cumulative probabilities for each method of managing a miscarriage being at each possible rank for completing a miscarriage are shown in Figure 7. Treatment hierarchies are presented with the surface under the cumulative ranking curve (SUCRA); the larger the SUCRA the higher its rank among all available methods of managing a miscarriage. Ranking indicates the cumulative probability of being the best method of managing a miscarriage, the second best, the third best, etc. A SUCRA of 100% means the method of miscarriage management is the best and a SUCRA of 0% means the method of miscarriage management is the worst. The highest ranked method for managing a miscarriage was suction aspiration plus cervical preparation (SUCRA 98.2%), followed by dilatation and curettage (SUCRA 68.2%), and suction aspiration (SUCRA 58.4%). Mifepristone plus misoprostol ranked fourth (53.2%), followed by misoprostol (SUCRA 22.1%), and expectant management or placebo (SUCRA 0%) coming last.

Cumulative rankogram comparing each of the methods of management of a miscarriage for the outcome of complete miscarriage. Ranking indicates the cumulative probability of being the best method, the second best, the third best, etc. The x axis shows the relative ranking and the y‐axis the cumulative probability of each ranking. We estimate the SUrface underneath this Cumulative RAnking line (SUCRA); the larger the SUCRA the higher its rank among all available methods.
Composite outcome of death or serious complication
The network diagram for the composite outcome of death or serious complications is presented in Figure 8. Misoprostol was the most frequently investigated method of miscarriage management (24 of 37 trial arms [65%]) for this outcome (Figure 8). This outcome was not reported for any trial involving suction aspiration plus cervical preparation.

Network diagram for outcome of composite outcome of death or serious complication. The nodes represent an intervention and their size is proportional to the number of trials comparing this intervention to any other in the network. The lines connecting each pair of interventions represent a direct comparison and are drawn proportional to the number of trials making each direct comparison. Numbers on the lines represent the number of trials and participants for each comparison. The colour of the line is green for high‐certainty evidence; light green for moderate‐certainty evidence; orange for low‐certainty evidence and red for very low‐certainty evidence. Multi‐arm trials contribute to more than one comparison.
Relative effects from the network meta‐analysis of 35 trials suggest that dilatation and curettage (RR 0.43, 95% CI 0.17 to 1.06, low‐certainty evidence), suction aspiration (RR 0.55, 95% CI 0.23 to 1.32, low‐certainty evidence), misoprostol (RR 0.50, 95% CI 0.22 to 1.15, low‐certainty evidence) and mifepristone plus misoprostol (RR 0.76, 95% CI 0.31 to 1.84, low‐certainty evidence) were compatible with a wide range of treatment effects for death and serious complications compared with expectant management or placebo (Figure 9 summary of findings Table 4).
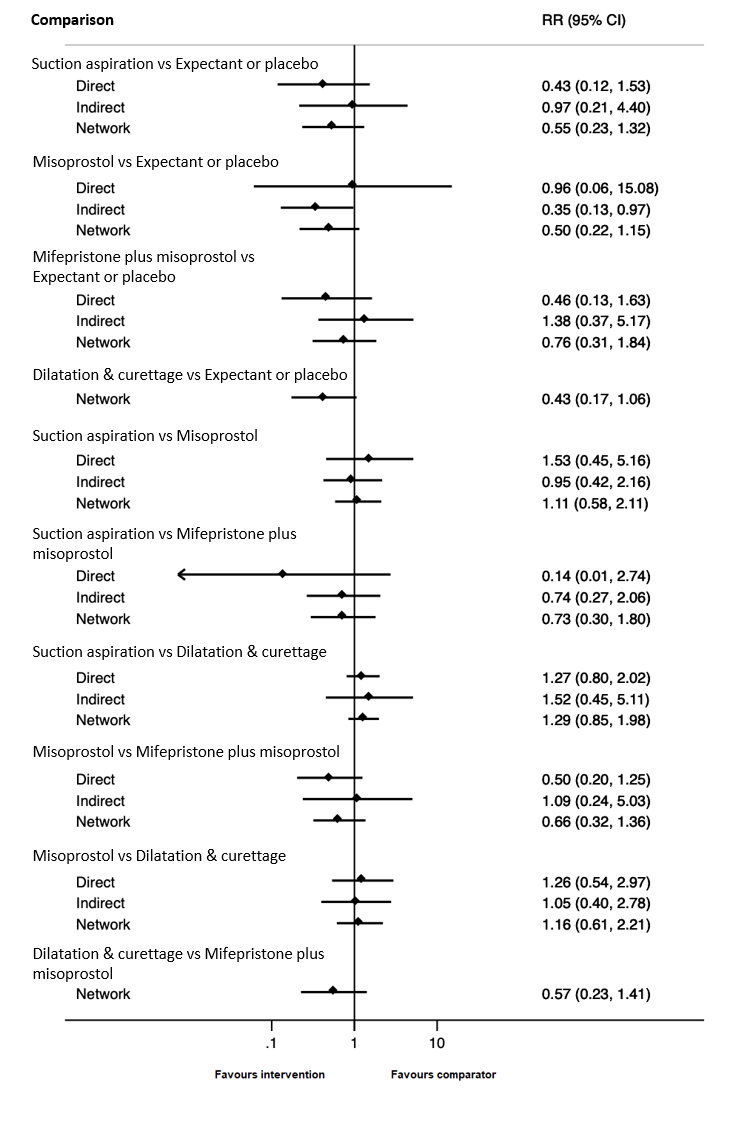
Forest plot with relative risk ratios and 95% CIs from pairwise, indirect and network (combining direct and indirect) analyses for outcome of composite outcome of death or serious complication.
It should be noted that death was rare (no deaths across all trials were reported). The reported complications comprised mainly of blood transfusions, but also uterine perforation, need for further life‐saving procedures such as hysterectomy (not including surgical completion of miscarriage as a second line intervention as this is reported in the secondary outcome of need for unplanned/ emergency surgical procedure), or intensive care unit admission.
Based on these results, about 19 per 1000 women given expectant management or placebo for their miscarriage would experience death or a serious complication compared with 8 per 1000 having dilation and curettage, 10 for suction aspiration, 10 for misoprostol and 14 per 1000 for mifepristone plus misoprostol (summary of findings Table 4).
The cumulative probabilities for each method of managing a miscarriage being at each possible rank for the composite outcome of death or serious complication are shown in Figure 10. The highest ranked method for managing a miscarriage for the composite outcome of death or serious complication was dilatation and curettage (SUCRA 84.4%), followed by misoprostol (SUCRA 70.1%), suction aspiration (SUCRA 52.9%), with mifepristone plus misoprostol (SUCRA 31.2%) ranked fourth and expectant management or placebo (SUCRA 10.9%) last.
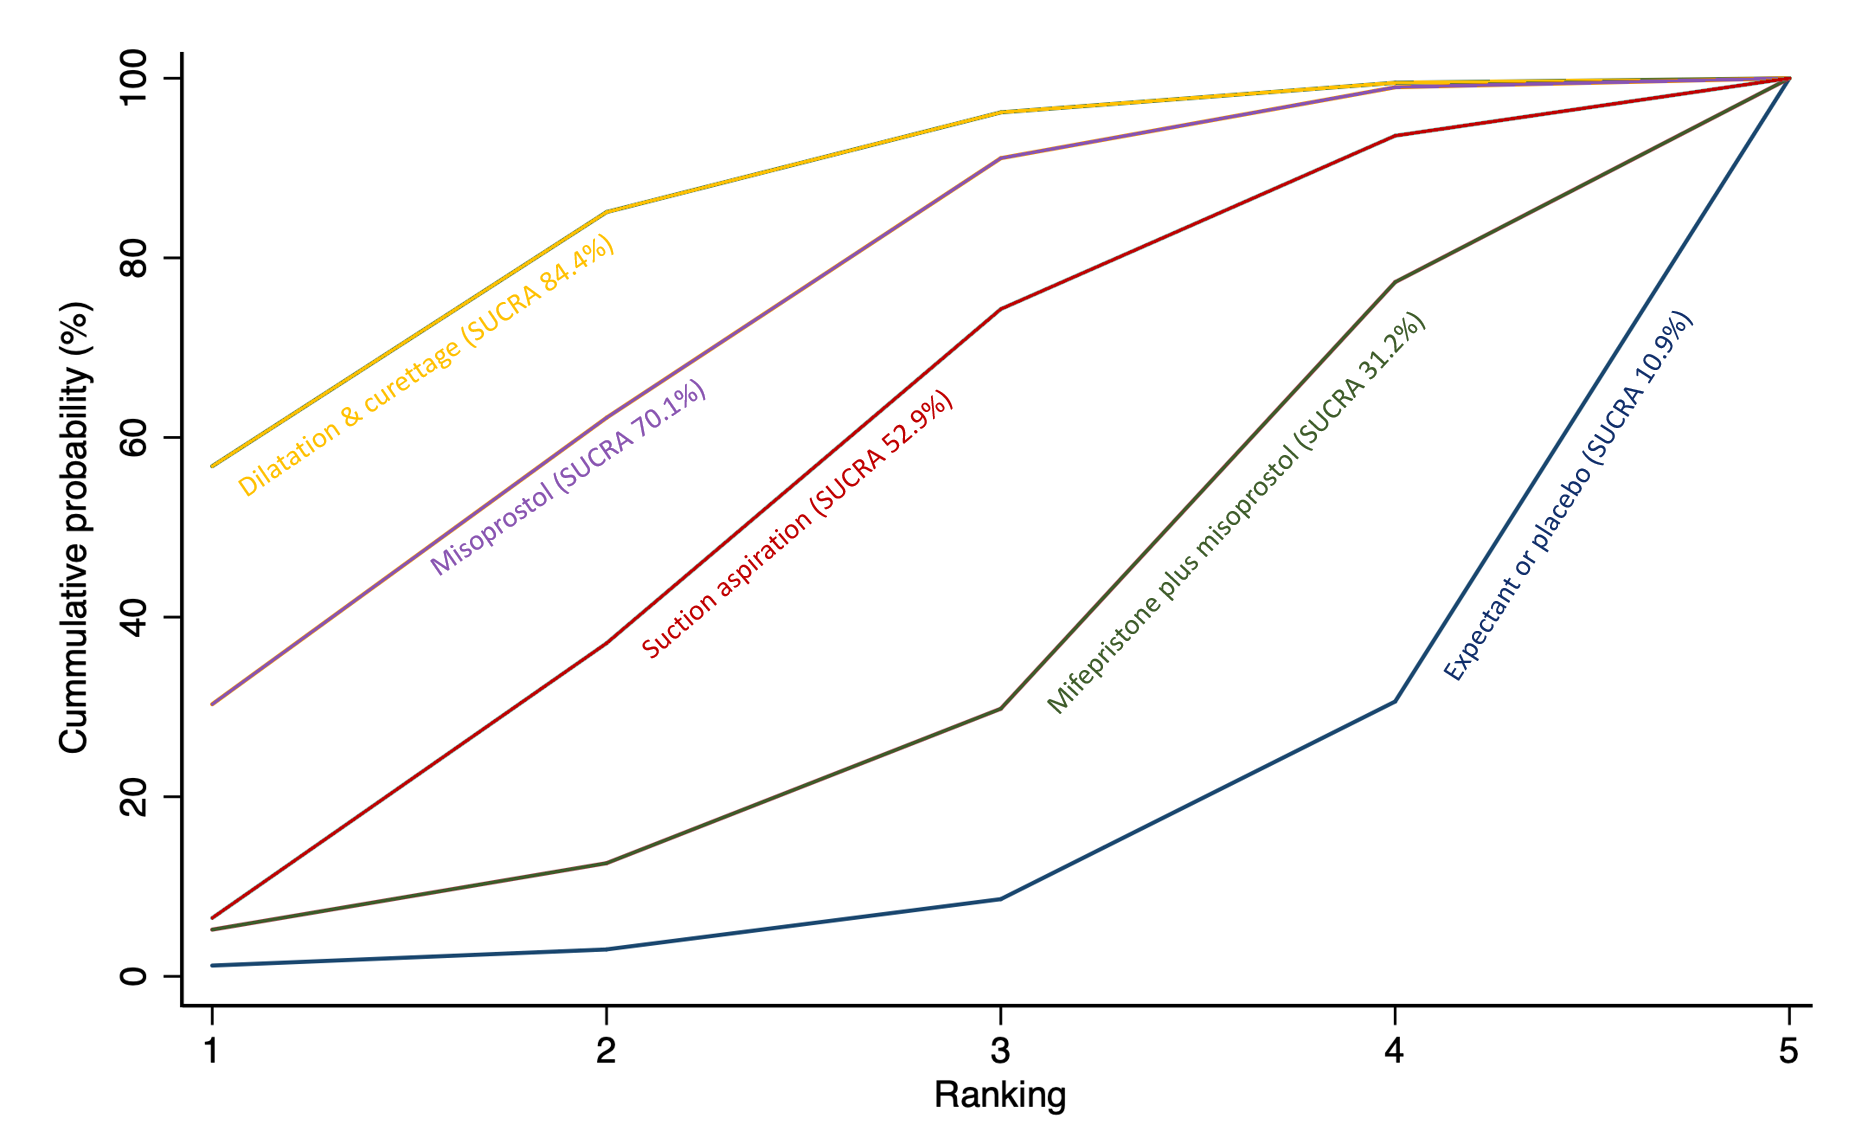
Cumulative rankogram comparing each of the methods of management of a miscarriage for the outcome of composite outcome of death or serious complication. Ranking indicates the cumulative probability of being the best method, the second best, the third best, etc. The x axis shows the relative ranking and the y‐axis the cumulative probability of each ranking. We estimate the SUrface underneath this Cumulative RAnking line (SUCRA); the larger the SUCRA the higher its rank among all available methods.
Secondary Outcomes
Need for unplanned/emergency surgical procedure
The network diagram for the outcome of need for unplanned/ emergency surgical procedure is presented in Figure 11. 30 trial arms contributed towards this outcome. This outcome was not reported for any trial involving suction aspiration plus cervical preparation.

Network diagram for outcome of need for unplanned/ emergency surgical procedure. The nodes represent an intervention and their size is proportional to the number of trials comparing this intervention to any other in the network. The lines connecting each pair of interventions represent a direct comparison and are drawn proportional to the number of trials making each direct comparison. Numbers on the lines represent the number of trials and participants for each comparison. The colour of the line is green for high‐certainty evidence; light green for moderate‐certainty evidence; orange for low‐certainty evidence and red for very low‐certainty evidence. Multi‐arm trials contribute to more than one comparison.
Relative effects from the network meta‐analysis of 28 trials, suggest that suction aspiration (RR 0.37, 95% CI 0.22 to 0.65, moderate‐certainty evidence) probably reduces the need for unplanned/emergency surgical procedures when compared with expectant management or placebo. For mifepristone plus misoprostol (RR 0.64, 95% CI 0.33 to 1.23, low‐certainty evidence) we cannot rule out an important benefit for this outcome. For dilatation and curettage (RR 0.80, 95% CI 0.09 to 7.02, very low‐certainty evidence) and misoprostol (RR 1.04, 95% CI 0.56 to 1.95, low‐certainty evidence), results are compatible with a wide range of treatment effects (Figure 12, summary of findings Table 5).

Forest plot with relative risk ratios and 95% CIs from pairwise, indirect and network (combining direct and indirect) analyses for outcome of need for unplanned/ emergency surgical procedure.
Based on these results, about 120 per 1000 women given expectant management or placebo for their miscarriage would experience unplanned or emergency surgical procedures compared with 44 per 1000 women for suction aspiration, 77 for mifepristone plus misoprostol, 96 for dilatation and curettage and 125 per 1000 women having for misoprostol (summary of findings Table 5).
The cumulative probabilities for each method of managing a miscarriage being at each possible rank for the need for unplanned/emergency surgical procedure are shown in Figure 13. The highest ranked method for managing a miscarriage was suction aspiration (SUCRA 92.6%), followed by mifepristone plus misoprostol (SUCRA 64.8%), with dilatation and curettage (SUCRA 43.1%) ranked third, expectant management or placebo (SUCRA 26.6%) fourth and misoprostol (SUCRA 3.0%) last.

Cumulative rankogram comparing each of the methods of management of a miscarriage for the outcome of need for unplanned/ emergency surgical procedure. Ranking indicates the cumulative probability of being the best method, the second best, the third best, etc. The x axis shows the relative ranking and the y‐axis the cumulative probability of each ranking. We estimate the SUrface underneath this Cumulative RAnking line (SUCRA); the larger the SUCRA the higher its rank among all available methods.
Pain scores (visual analogue scale)
The network diagram for the outcome of pain scores (visual analogue scale) is presented in Figure 14. 13 trials contributed towards this outcome. This outcome was not reported for any trial involving suction curettage plus cervical preparation.

Network diagram for outcome of pain score (visual analogue scale). The nodes represent an intervention and their size is proportional to the number of trials comparing this intervention to any other in the network. The lines connecting each pair of interventions represent a direct comparison and are drawn proportional to the number of trials making each direct comparison. Numbers on the lines represent the number of trials and participants for each comparison. The colour of the line is green for high‐certainty evidence; light green for moderate‐certainty evidence; orange for low‐certainty evidence and red for very low‐certainty evidence. Multi‐arm trials contribute to more than one comparison.
Due to the small number of trials reporting this outcome, network meta‐analysis was not possible, and so were unable to produce network relative effects and a rankogram. Direct evidence is presented only from pairwise meta‐analysis (Data and analyses).
Pairwise meta‐analysis of three trials found misoprostol may cause a slightly higher pain score compared to expectant management or placebo (standardised mean difference (SMD) 0.33, 95% CI 0.08 to 0.57, low‐certainty evidence) (Analysis 8.4). One further trial compared mifepristone plus misoprostol to expectant management or placebo but we cannot rule out a small difference in pain scores for this comparison (SMD 0.14, 95% CI ‐0.21 to 0.50, low‐certainty evidence) (Analysis 10.4).
Pelvic Inflammatory disease, sepsis or endometritis
The network diagram for the outcome of pelvic inflammatory disease, sepsis or endometritis is presented in Figure 15. 41 trial arms contributed towards this outcome. This outcome was not reported for any trial involving suction aspiration plus cervical preparation.
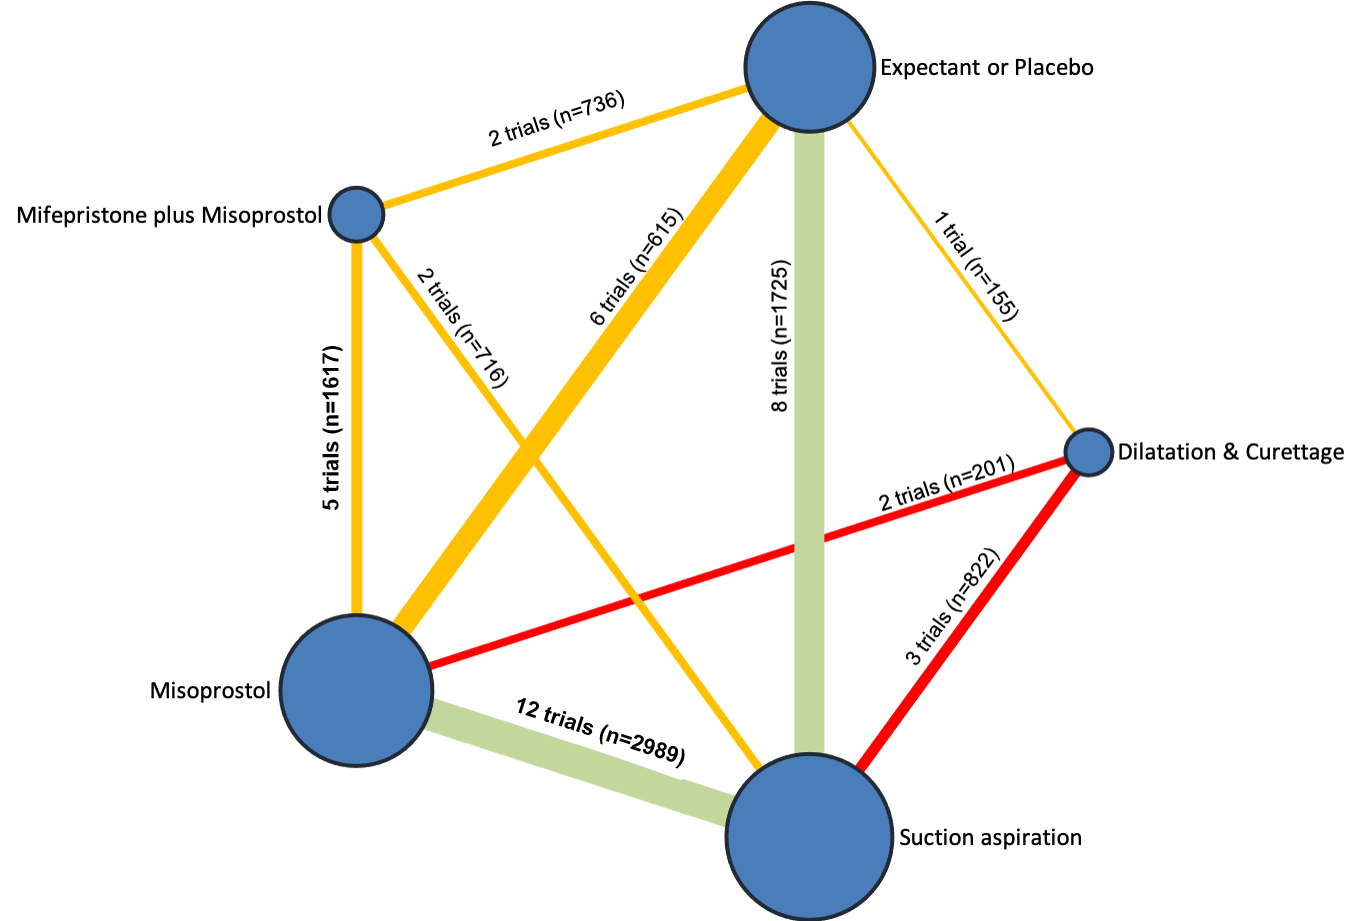
Network diagram for outcome of pelvic inflammatory disease, sepsis or endometritis. The nodes represent an intervention and their size is proportional to the number of trials comparing this intervention to any other in the network. The lines connecting each pair of interventions represent a direct comparison and are drawn proportional to the number of trials making each direct comparison. Numbers on the lines represent the number of trials and participants for each comparison. The colour of the line is green for high‐certainty evidence; light green for moderate‐certainty evidence; orange for low‐certainty evidence and red for very low‐certainty evidence. Multi‐arm trials contribute to more than one comparison.
Relative effects from the network meta‐analysis of 39 trials, suggest that mifepristone plus misoprostol (RR 0.90, 95% CI 0.48 to 1.68, low‐certainty evidence), misoprostol (RR 1.08, 95% CI 0.62 to 1.88, moderate‐certainty evidence) and suction aspiration (RR 1.42, 95% CI 0.88 to 2.28, moderate‐certainty evidence) were compatible with a wide range of treatment effects for pelvic inflammatory disease, sepsis or endometritis when compared with expectant management or placebo. However, dilatation and curettage (RR 1.85, 95% CI 1.05 to 3.25, very low‐certainty evidence) may increase the risk of pelvic inflammatory disease, sepsis or endometritis when compared with expectant management or placebo, but the evidence is very uncertain (Figure 16, summary of findings Table 7).

Forest plot with relative risk ratios and 95% CIs from pairwise, indirect and network (combining direct and indirect) analyses for outcome of pelvic inflammatory disease, sepsis or endometritis.
Based on these results, about 36 per 1000 women given expectant management or placebo for their miscarriage would experience pelvic inflammatory disease, sepsis or endometritis compared with 32 per 1000 women for mifepristone plus misoprostol, 39 for misoprostol, 51 for suction aspiration, and 67 per 1000 women having dilatation and curettage (summary of findings Table 7).
The cumulative probabilities for each method of managing a miscarriage being at each possible rank for pelvic inflammatory disease, sepsis or endometritis are shown in Figure 17. The highest ranked method for managing a miscarriage for the outcome of pelvic inflammatory disease, sepsis or endometritis was mifepristone plus misoprostol (SUCRA 83.4%), followed by expectant management or placebo (SUCRA 71.4%), misoprostol (SUCRA 62.7%), with suction aspiration (SUCRA 29.3%) ranked fourth and dilatation and curettage (SUCRA 3.2%) last.

Cumulative rankogram comparing each of the methods of management of a miscarriage for the outcome of pelvic inflammatory disease, sepsis or endometritis. Ranking indicates the cumulative probability of being the best method, the second best, the third best, etc. The x axis shows the relative ranking and the y‐axis the cumulative probability of each ranking. We estimate the SUrface underneath this Cumulative RAnking line (SUCRA); the larger the SUCRA the higher its rank among all available methods.
Mean volumes of blood loss (millilitres (mL)
The network diagram for the outcome of mean volumes of blood loss (mL) is presented in Figure 18. Four trials contributed towards this outcome. This outcome was not reported for any trial involving suction aspiration plus cervical preparation. Due to the small number of trials reporting this outcome, we were unable to produce network relative effects and a rankogram. Direct evidence is presented only from pairwise meta‐analysis. One trial found suction aspiration may cause smaller volumes of blood loss compared to expectant management or placebo (mean difference (MD) ‐23.00, 95% CI ‐40.41 to ‐5.59).

Network diagram for outcome of mean volumes of blood loss (millilitres). The nodes represent an intervention and their size is proportional to the number of trials comparing this intervention to any other in the network. The lines connecting each pair of interventions represent a direct comparison and are drawn proportional to the number of trials making each direct comparison. Numbers on the lines represent the number of trials and participants for each comparison. Multi‐arm trials contribute to more than one comparison.
Change in haemoglobin measurements before and after the miscarriage
The network diagram for the outcome of change in haemoglobin measurements before and after the miscarriage is presented in Figure 19. 15 trial arms contributed towards this outcome. This outcome was not reported for any trial involving suction aspiration plus cervical preparation.

Network diagram for outcome of change in haemoglobin measurements before and after the miscarriage. The nodes represent an intervention and their size is proportional to the number of trials comparing this intervention to any other in the network. The lines connecting each pair of interventions represent a direct comparison and are drawn proportional to the number of trials making each direct comparison. Numbers on the lines represent the number of trials and participants for each comparison. The colour of the line is green for high‐certainty evidence; light green for moderate‐certainty evidence; orange for low‐certainty evidence and red for very low‐certainty evidence. Multi‐arm trials contribute to more than one comparison.
Relative effects from the network meta‐analysis of 13 trials, suggest that dilatation and curettage (MD 0.50, 95% CI 0.06 to 0.93, low‐certainty evidence) may cause a change in haemoglobin measurement before and after the miscarriage when compared with expectant management or placebo. Misoprostol (MD 0.25, 95% CI ‐0.01 to 0.52, low‐certainty evidence) and mifepristone plus misoprostol (MD 0.23, 95% CI ‐0.23 to 0.70, moderate‐certainty evidence) may make little or no difference to this outcome when compared to expectant management or placebo. Suction aspiration (MD 0.09, 95% CI ‐0.15 to 0.32, very low‐certainty evidence) makes little or no difference to this outcome when compared with expectant management or placebo, but the evidence is very uncertain (Figure 20).

Forest plot with relative risk ratios and 95% CIs from pairwise, indirect and network (combining direct and indirect) analyses for outcome of change in haemoglobin measurements before and after the miscarriage.
The cumulative probabilities for each method of managing a miscarriage being at each possible rank for the outcome of change in haemoglobin measurements before and after the miscarriage are shown in Figure 21. The highest ranked method for managing a miscarriage for the outcome of change in haemoglobin measurements before and after the miscarriage was expectant management or placebo (SUCRA 88.2%), followed by suction aspiration (SUCRA 74.1%), mifepristone plus misoprostol (SUCRA 46.2%), with misoprostol (SUCRA 34.6%) ranked fourth and dilatation and curettage (SUCRA 6.9%) last.
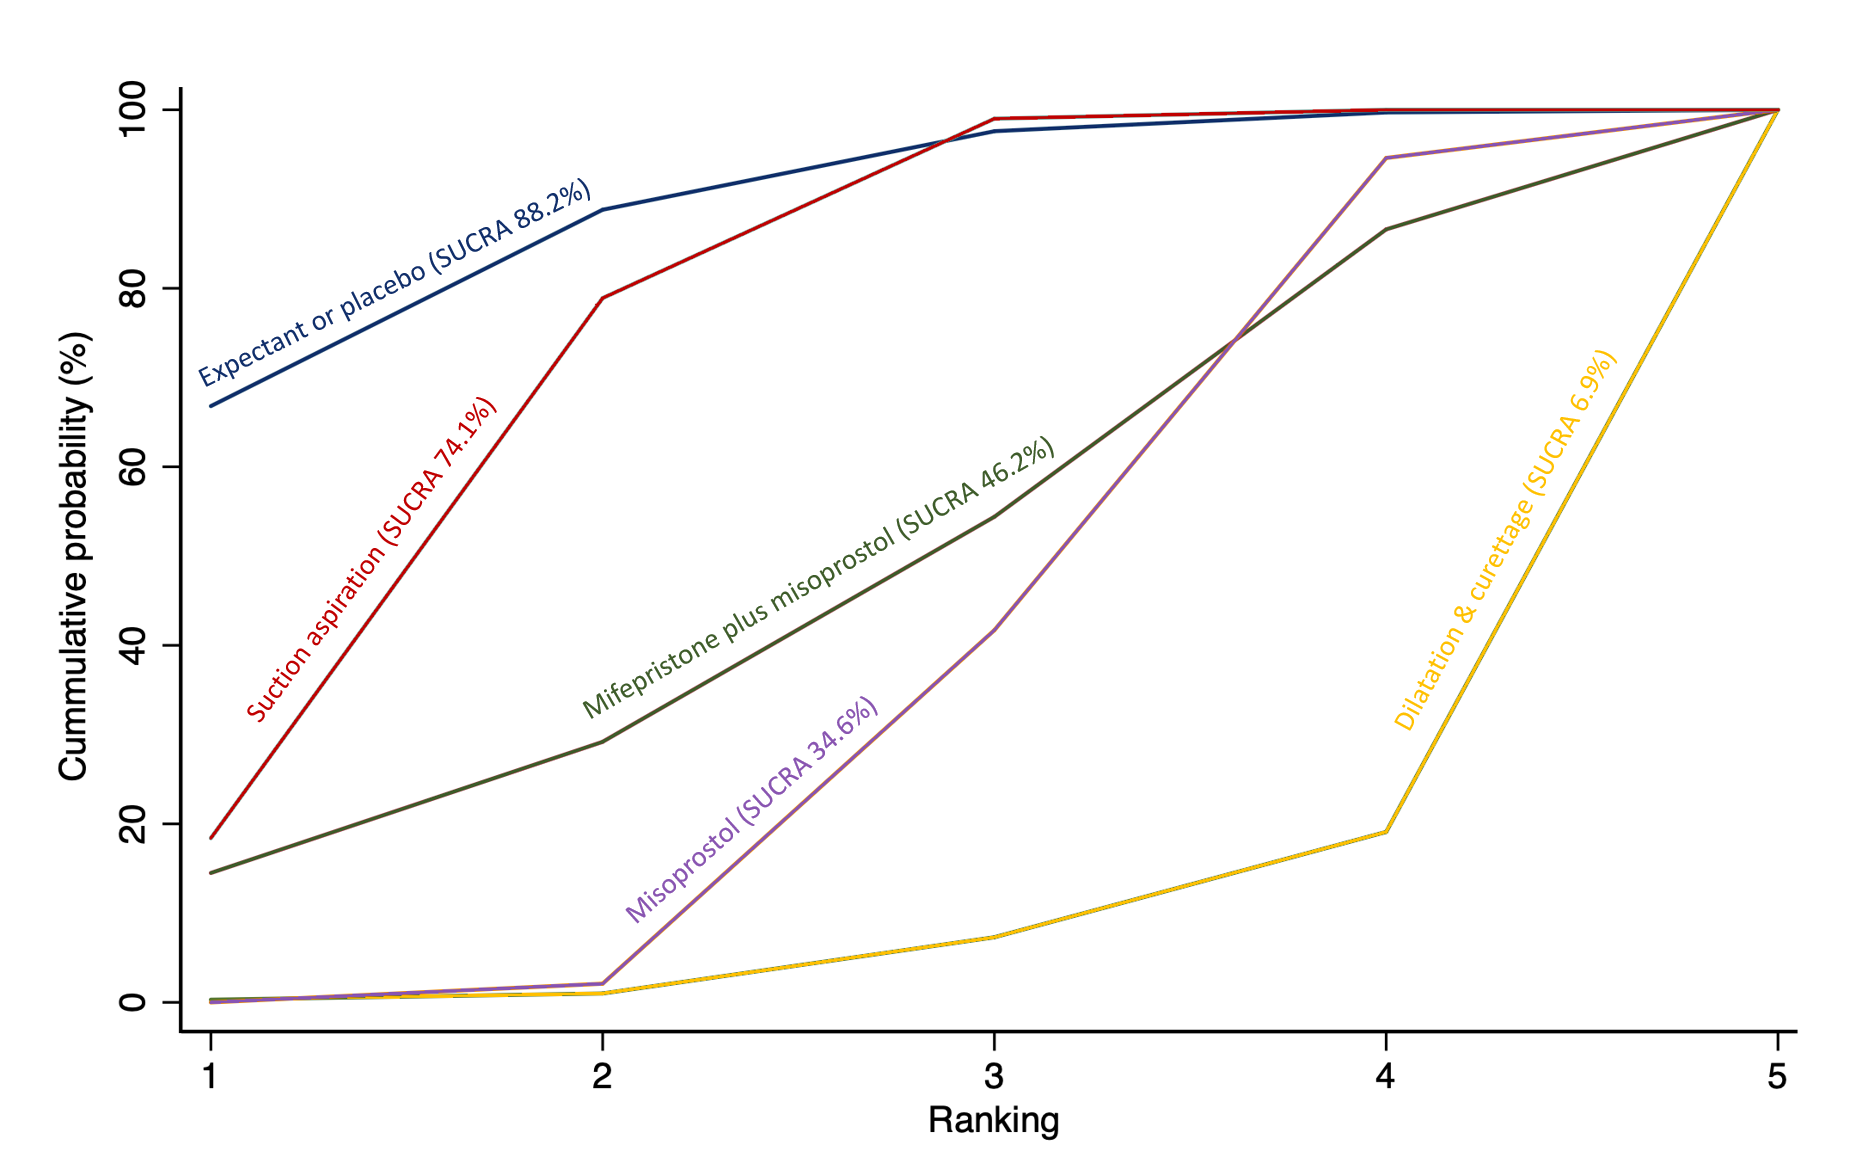
Cumulative rankogram comparing each of the methods of management of a miscarriage for the outcome of change in haemoglobin measurements before and after the miscarriage. Ranking indicates the cumulative probability of being the best method, the second best, the third best, etc. The x axis shows the relative ranking and the y‐axis the cumulative probability of each ranking. We estimate the SUrface underneath this Cumulative RAnking line (SUCRA); the larger the SUCRA the higher its rank among all available methods.
Days of bleeding
The network diagram for the outcome of days of bleeding is presented in Figure 22. 20 trial arms contributed towards this outcome. This outcome was not reported for any trial involving suction aspiration plus cervical preparation.

Network diagram for outcome of days of bleeding. The nodes represent an intervention and their size is proportional to the number of trials comparing this intervention to any other in the network. The lines connecting each pair of interventions represent a direct comparison and are drawn proportional to the number of trials making each direct comparison. Numbers on the lines represent the number of trials and participants for each comparison. The colour of the line is green for high‐certainty evidence; light green for moderate‐certainty evidence; orange for low‐certainty evidence and red for very low‐certainty evidence. Multi‐arm trials contribute to more than one comparison.
Relative effects from the network meta‐analysis of 18 trials suggest that dilatation and curettage (MD ‐1.96, 95% CI ‐3.48 to ‐0.45, low‐certainty evidence) may cause less days of bleeding when compared with expectant management or placebo. Suction aspiration (MD ‐2.00, 95% CI ‐3.01 to ‐0.99, very low‐certainty evidence) may cause less days of bleeding when compared to expectant management or placebo, but the evidence is very uncertain. Misoprostol (MD ‐0.47, 95% CI ‐1.53 to 0.60, very low‐certainty evidence) and mifepristone plus misoprostol (MD ‐0.14, 95% CI ‐1.71 to 1.43, very low‐certainty evidence), were compatible with a wide range of treatment effects for days of bleeding when compared to expectant management or placebo (Figure 23, summary of findings Table 8).
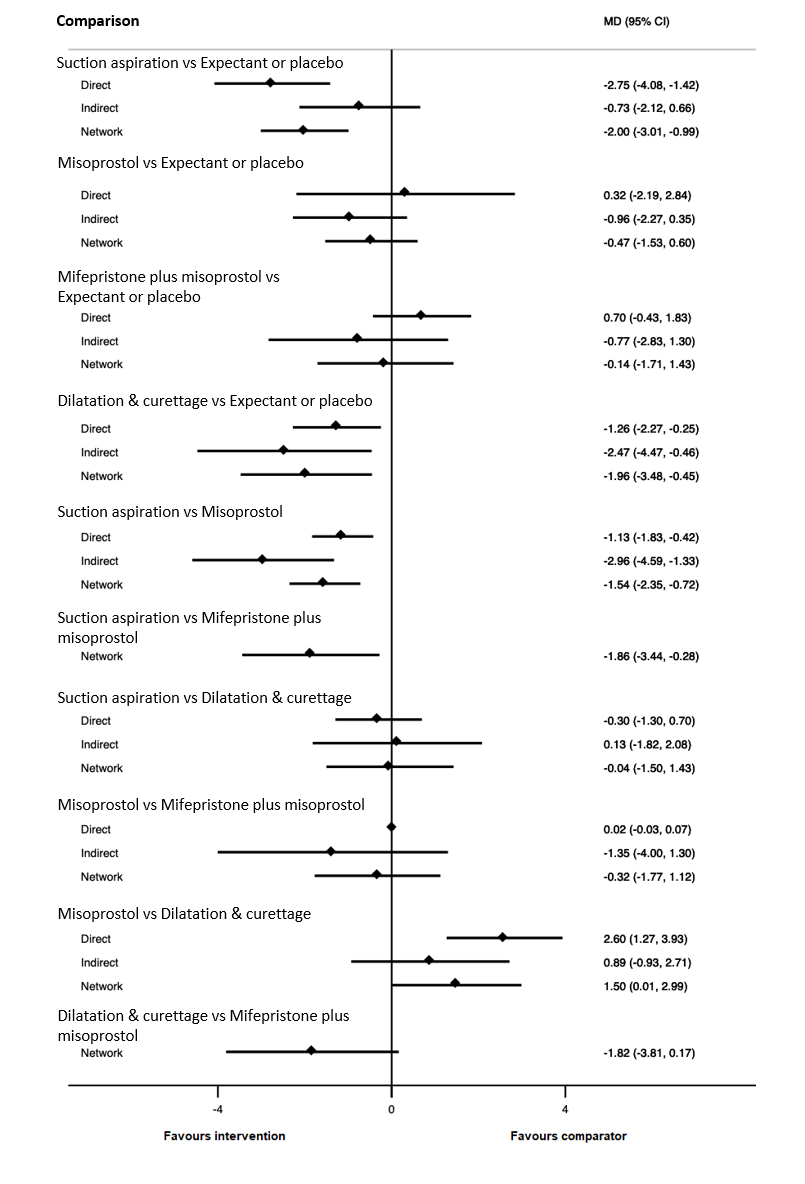
Forest plot with relative risk ratios and 95% CIs from pairwise, indirect and network (combining direct and indirect) analyses for outcome of days of bleeding.
Based on these results, women given expectant management or placebo for their miscarriage, would experience 10 days of bleeding compared with 8 days of bleeding for women having suction aspiration, 8.04 days for women having dilatation and curettage, 9.53 days for women having misoprostol and 9.86 days of bleeding for women having mifepristone plus misoprostol (summary of findings Table 8).
The cumulative probabilities for each method of managing a miscarriage being at each possible rank for the outcome of days of bleeding are shown in Figure 24. The highest ranked method for managing a miscarriage for the outcome of days of bleeding was suction aspiration (SUCRA 87.9%), followed by dilatation and curettage (SUCRA 85.1%), misoprostol (SUCRA 37.2%) with mifepristone plus misoprostol (SUCRA 24.7%) ranked fourth and expectant management or placebo (SUCRA 15.1%) last.
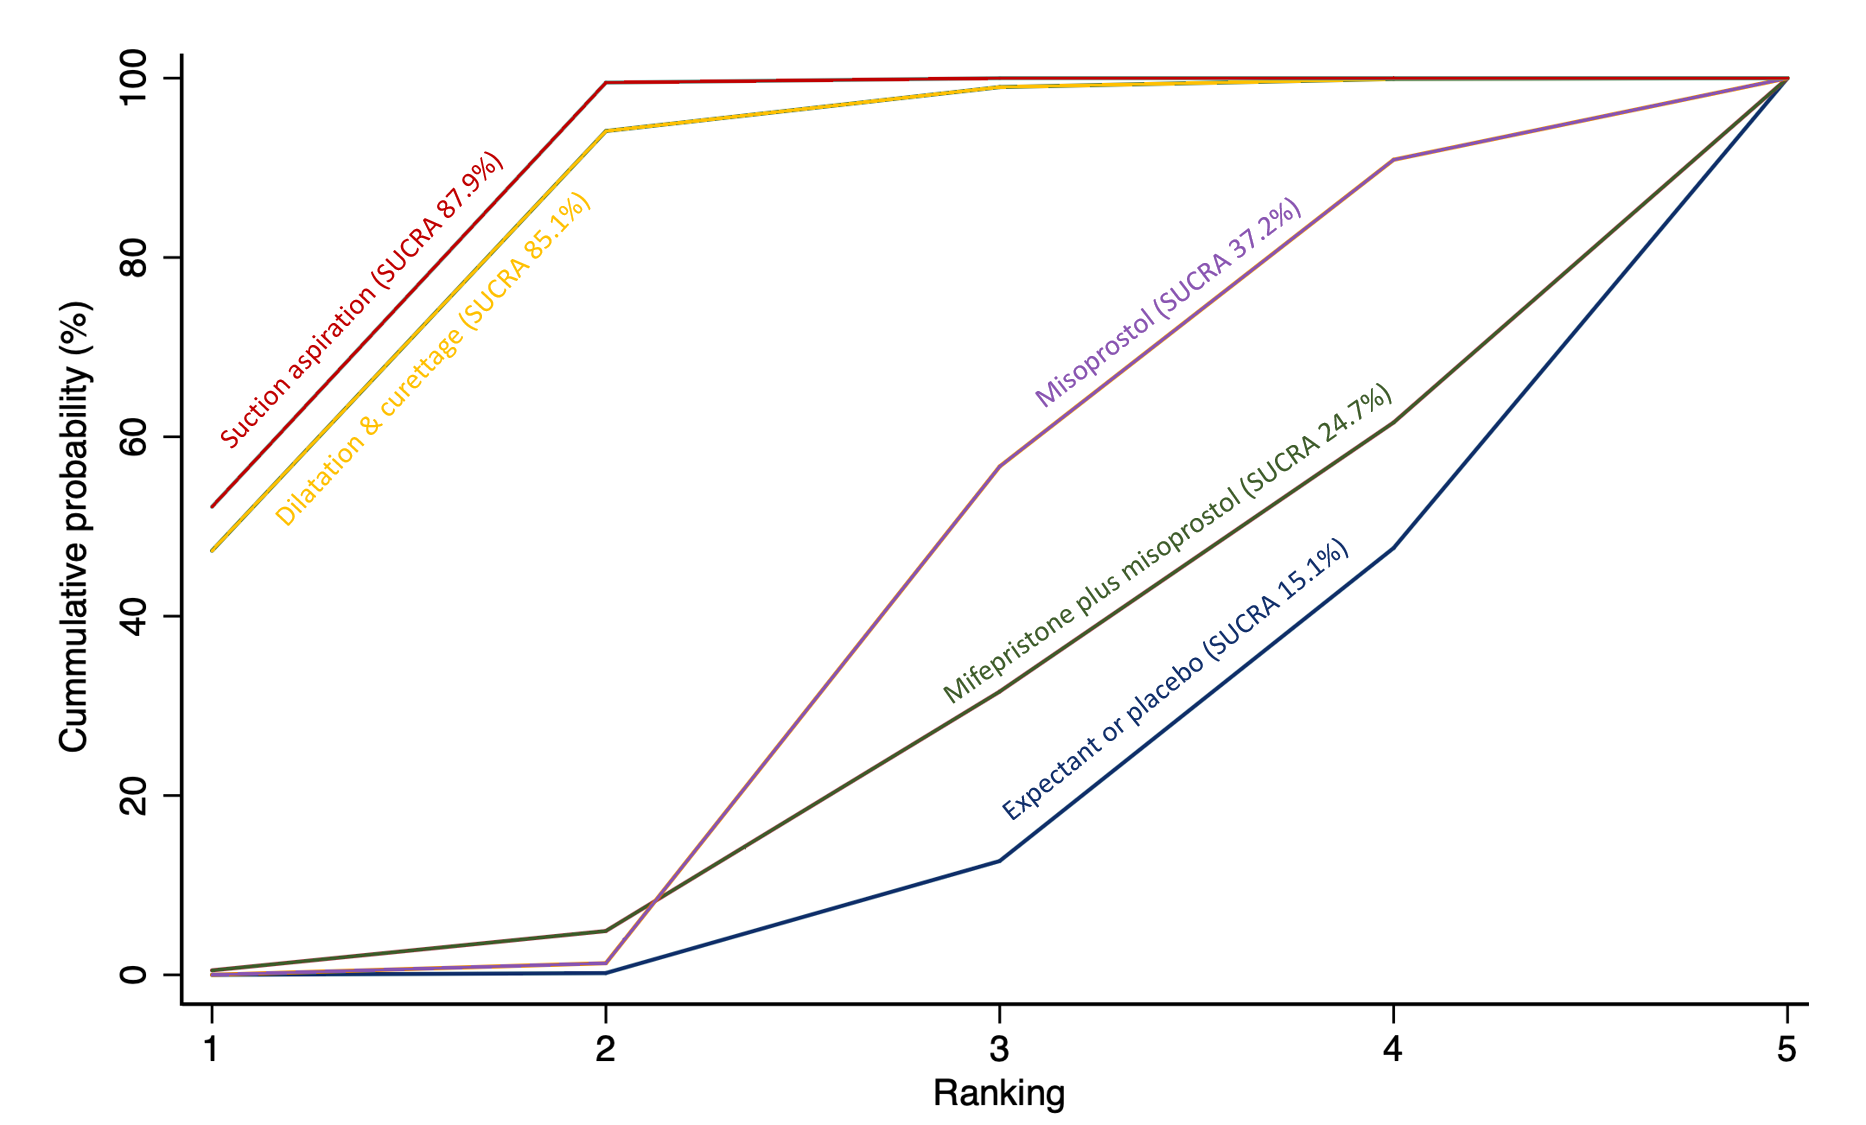
Cumulative rankogram comparing each of the methods of management of a miscarriage for the outcome of days of bleeding. Ranking indicates the cumulative probability of being the best method, the second best, the third best, etc. The x axis shows the relative ranking and the y‐axis the cumulative probability of each ranking. We estimate the SUrface underneath this Cumulative RAnking line (SUCRA); the larger the SUCRA the higher its rank among all available methods.
Cervical Tear
Due to the infrequency at which cervical tears occurred across all studies where it was reported, we were unable to produce a network diagram, network relative effects and a rankogram. Direct evidence is presented only from pairwise meta‐analysis. This outcome was not reported for any trial involving suction aspiration plus cervical preparation.
Only eight trials reported this outcome with five reporting no cervical tears for either intervention it was comparing. The most frequently investigated intervention for this outcome was suction aspiration with seven trials out of eight. Pairwise meta‐analysis suggests that we cannot rule out a substantial harm of suction aspiration compared with misoprostol (3 trials, RR 7.18, 95% CI 0.84 to 61) and substantial benefit for suction aspiration compared with dilatation and curettage (2 trials, RR 0.49, 95% CI 0.20 to 1.18) (Analysis 3.8).
Women's views or satisfaction
There was significant heterogeneity in the methods of reporting women's views or satisfaction across all the studies where it was reported and so we were unable to produce a network diagram, network relative effects and a rankogram. Direct meta‐analysis was also not possible and so results are presented narratively. This outcome was not reported for any trial involving suction aspiration plus cervical preparation.
Twenty‐three trials reported women's views or satisfaction using varying different methods. Four trials (Bagratee 2004; Moodliar 2005; Nielsen 1999; Phusaanantakul 2010) used a visual analogue scale. Eight trials used a five‐point descriptive scale (very satisfied, satisfied, neutral, dissatisfied and very dissatisfied) (Bique 2007; Chigbu 2012; Dabash 2010; Dao 2007; Montesinos 2011; Shwekerela 2007; Taylor 2011; Weeks 2005), and seven trials used a three‐point descriptive scale (satisfied, neutral and dissatisfied) (Chipchase 1997; Dangalla 2012; Demetroulis 2001; Ibiyemi 2018; Lister 2005; Niinimaki 2006; Shuaib 2013.
Overall, all methods of managing a miscarriage were found to be acceptable. The most commonly investigated method of miscarriage management was misoprostol with 18 trials, followed by suction aspiration with 17 trials. The most common comparison was misoprostol versus suction aspiration with 12 trials. Of these 12 trials, Arellano 2009 examined only the side effects of the treatment options with 95% describing the side effects of misoprostol as tolerable, whereas 91% described the side effects of suction aspiration as tolerable. Sahin 2001 described women's dissatisfaction with only one woman out of 40 being dissatisfied with misoprostol, whereas 14 women out of 40 were dissatisfied with suction aspiration. The remaining 10 trials used either a five‐ or three‐point scale of satisfaction. In total, 1389 women out of 1443 (96.3%) were either satisfied or very satisfied with misoprostol and 1350 women out of 1400 (96.4%) were either satisfied or very satisfied with suction aspiration.
Suction aspiration versus expectant management or placebo was the next most common comparison with three trials. Chipchase 1997; and Dangalla 2012 found 92 out of 96 women (98.5%) were satisfied with suction aspiration compared to 97 out of 99 women (98.0%) were satisfied with expectant management or placebo (moderate‐certainty evidence). Nadarajah 2014 used a 10‐point numerical scale and similarly found suction aspiration had a satisfaction score of 7.57 from 175 women and expectant management or placebo also had a 7.57 score from 177 women (moderate‐certainty evidence). Two trials compared misoprostol versus expectant/placebo and misoprostol versus dilatation and curettage respectively (summary of findings Table 9).
Mean duration of hospital stay (days)
The network diagram for the outcome of mean duration of hospital stay (days) is presented in Figure 25. Six trials contributed towards this outcome. This outcome was not reported for any trial involving suction aspiration plus cervical preparation.

Network diagram for outcome of mean duration of hospital stay (days). The nodes represent an intervention and their size is proportional to the number of trials comparing this intervention to any other in the network. The lines connecting each pair of interventions represent a direct comparison and are drawn proportional to the number of trials making each direct comparison. Numbers on the lines represent the number of trials and participants for each comparison. Multi‐arm trials contribute to more than one comparison.
Due to the small number of trials reporting this outcome, network meta‐analysis was not possible for this outcome, and so we were unable to produce a network diagram, network relative effects and a rankogram. Direct evidence is presented only from pairwise meta‐analysis.
Pairwise meta‐analysis of three trials suggests women having suction aspiration probably have a shorter mean duration of hospital stay when compared to dilatation and curettage (MD ‐0.56, 95% CI ‐0.89 to ‐0.23) (Analysis 3.9). One trial shows women having suction aspiration probably have a shorter mean duration of hospital stay when compared to misoprostol (MD ‐0.40, 95% CI ‐0.68 to ‐0.12) (Analysis 1.9). Misoprostol may have a shorter mean duration of hospital stay compared to expectant management or placebo (MD ‐0.10, 95% CI ‐0.19 to ‐0.01) (Analysis 8.8). However, we cannot rule out an important benefit or harm for this outcome for the comparison between suction aspiration versus expectant management or placebo (MD 0.99, 95% CI 0.74 to 1.24) (Analysis 4.9).
Readmission to hospital
The network diagram for the outcome of readmission to hospital is presented in Figure 26. Twelve trial arms contributed towards this outcome. This outcome was not reported for any trial involving suction aspiration plus cervical preparation.

Network diagram for outcome of readmission to hospital. The nodes represent an intervention and their size is proportional to the number of trials comparing this intervention to any other in the network. The lines connecting each pair of interventions represent a direct comparison and are drawn proportional to the number of trials making each direct comparison. Numbers on the lines represent the number of trials and participants for each comparison. The colour of the line is green for high‐certainty evidence; light green for moderate‐certainty evidence; orange for low‐certainty evidence and red for very low‐certainty evidence. Multi‐arm trials contribute to more than one comparison.
Relative effects from the network meta‐analysis of 10 trials suggest that for suction aspiration (RR 0.50, 95% CI 0.21 to 1.15, low‐certainty evidence), mifepristone plus misoprostol (RR 0.56, 95% CI 0.13 to 2.48, low‐certainty evidence), dilatation and curettage (RR 0.32, 95% CI 0.08 to 1.24, very low‐certainty evidence), and misoprostol (RR 1.08, 95% CI 0.40 to 2.96, very low‐certainty evidence) were compatible with a wide range of treatment effects for readmission to hospital when compared to expectant management or placebo (Figure 27).
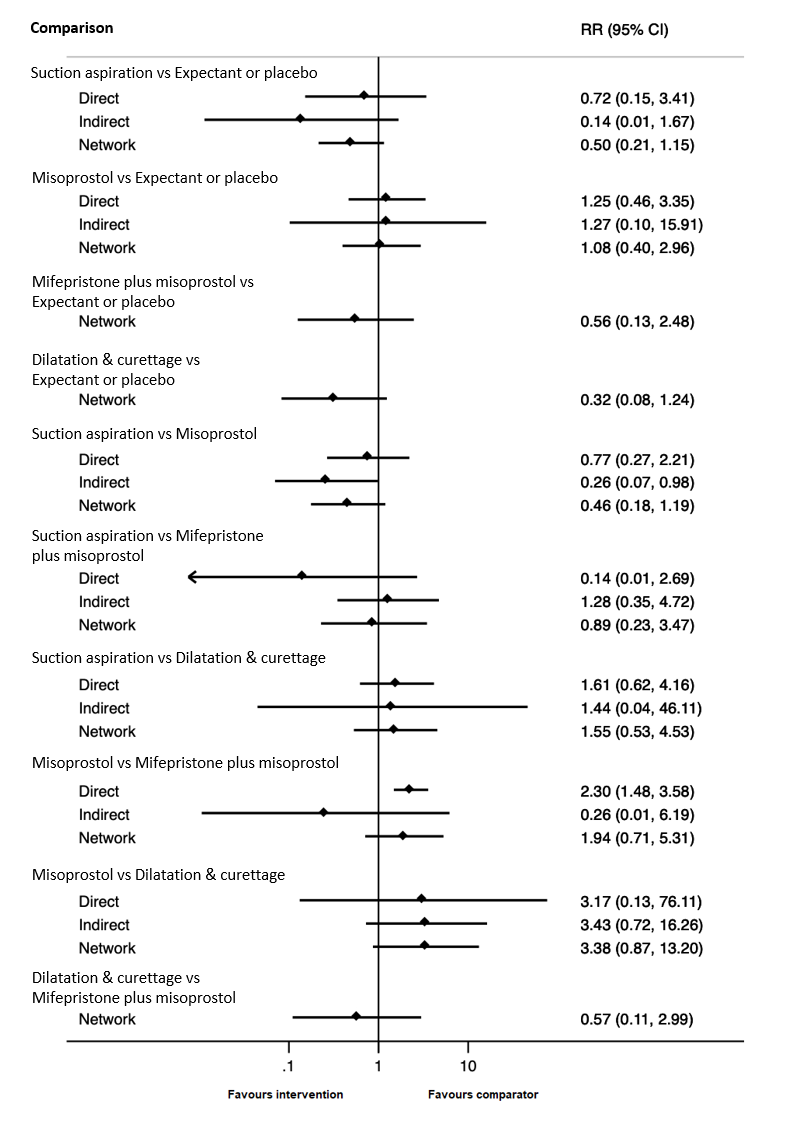
Forest plot with relative risk ratios and 95% CIs from pairwise, indirect and network (combining direct and indirect) analyses for outcome of readmission to hospital.
The cumulative probabilities for each method of managing a miscarriage being at each possible rank for the outcome of readmission to hospital are shown in Figure 28. The highest ranked method for managing a miscarriage for the outcome of readmission to hospital was dilatation and curettage (SUCRA 85.1%), followed by suction aspiration (SUCRA 66.5%), mifepristone plus misoprostol (SUCRA 60.7%) ranked third, expectant management or placebo (SUCRA 21.2%) ranked fourth and misoprostol (SUCRA 16.5%) last.
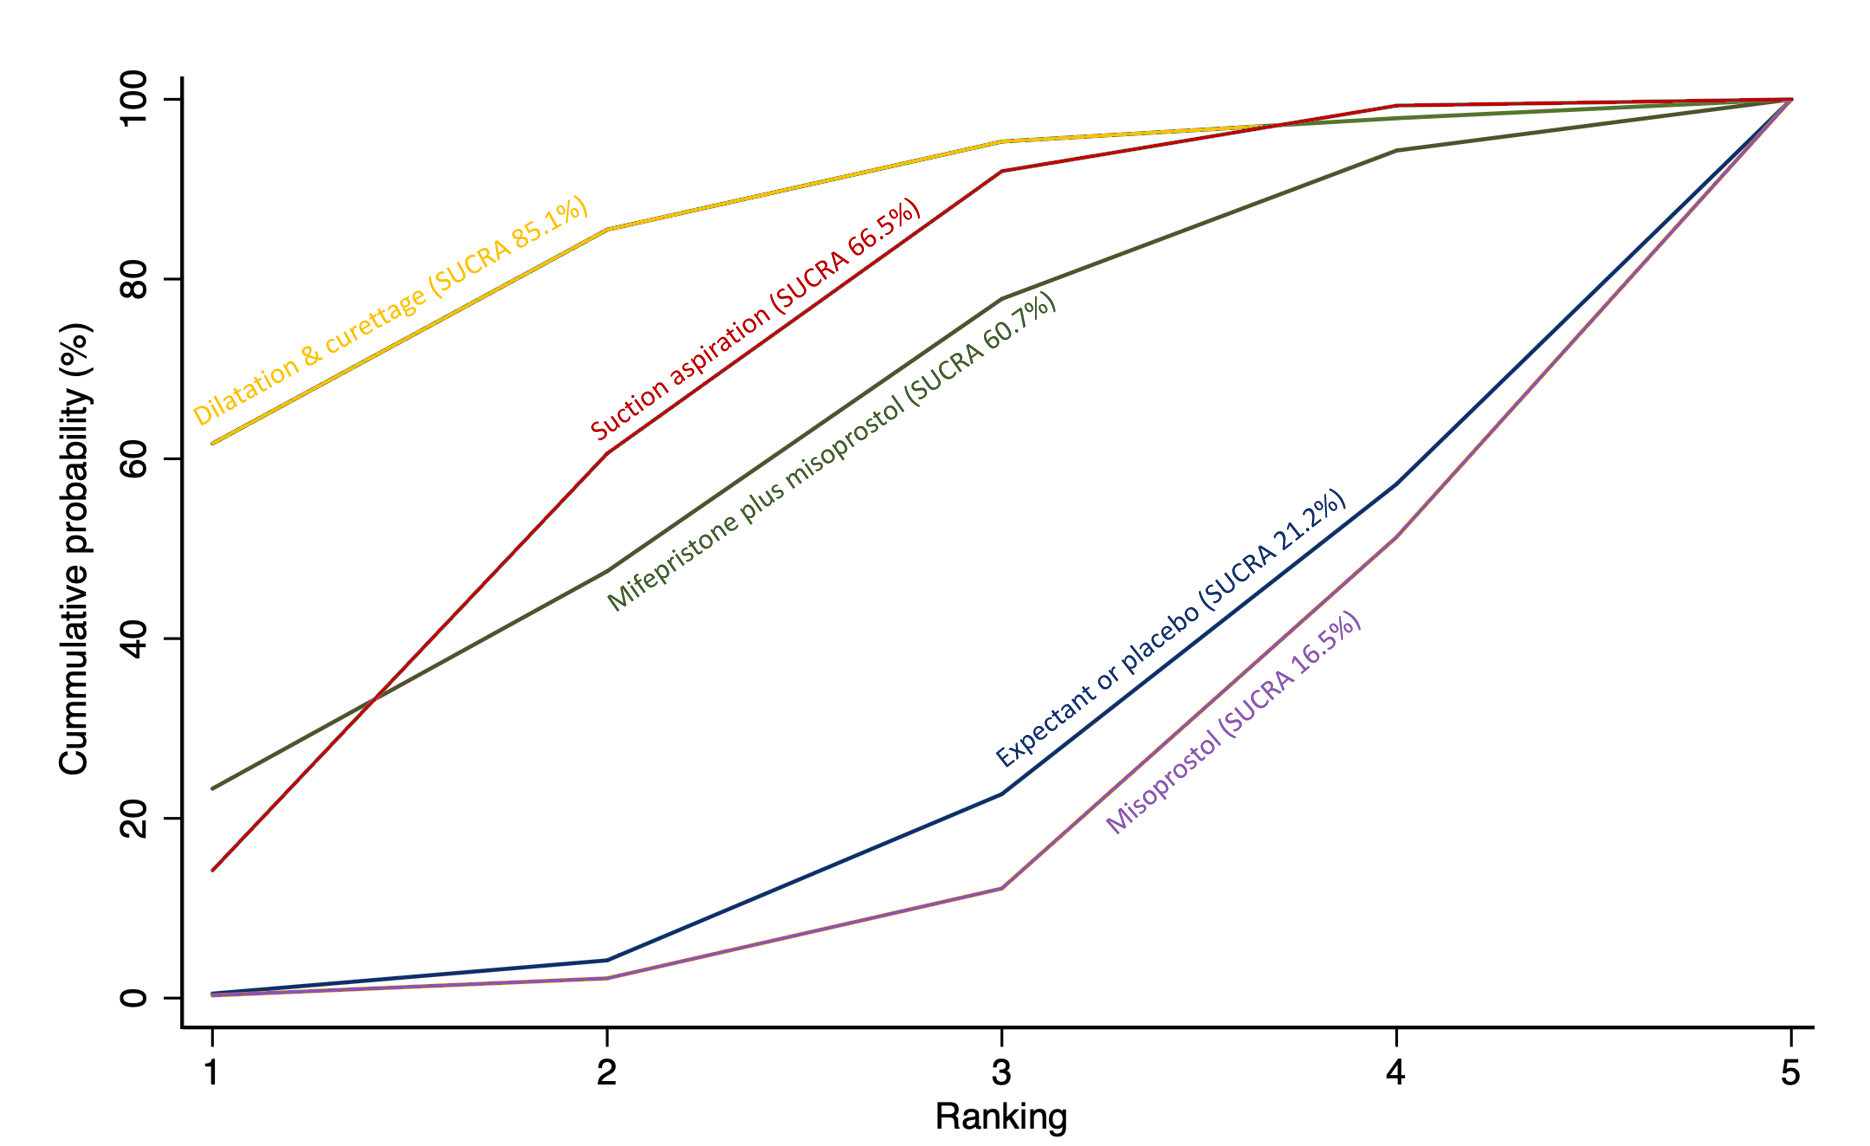
Cumulative rankogram comparing each of the methods of management of a miscarriage for the outcome of readmission to hospital. Ranking indicates the cumulative probability of being the best method, the second best, the third best, etc. The x axis shows the relative ranking and the y‐axis the cumulative probability of each ranking. We estimate the SUrface underneath this Cumulative RAnking line (SUCRA); the larger the SUCRA the higher its rank among all available methods.
Nausea
The network diagram for the outcome of nausea is presented in Figure 29. Twenty‐one trials contributed towards this outcome. This outcome was not reported for any trial involving suction aspiration plus cervical preparation.

Network diagram for outcome of nausea. The nodes represent an intervention and their size is proportional to the number of trials comparing this intervention to any other in the network. The lines connecting each pair of interventions represent a direct comparison and are drawn proportional to the number of trials making each direct comparison. Numbers on the lines represent the number of trials and participants for each comparison. The colour of the line is green for high‐certainty evidence; light green for moderate‐certainty evidence; orange for low‐certainty evidence and red for very low‐certainty evidence. Multi‐arm trials contribute to more than one comparison.
Relative effects from the network meta‐analysis of 21 trials suggests that for misoprostol (RR 1.37, 95% CI 0.70 to 2.69, moderate‐certainty evidence), mifepristone plus misoprostol (RR 1.89, 95% CI 0.62 to 5.72, moderate‐certainty evidence) and dilatation and curettage (RR 4.12, 95% CI 0.13 to 129.62, low‐certainty evidence), suction aspiration (RR 0.68, 95% CI 0.31 to 1.52, very low‐certainty evidence) were compatible with a wide range of treatment effects for nausea when compared to expectant management or placebo (Figure 30).

Forest plot with relative risk ratios and 95% CIs from pairwise, indirect and network (combining direct and indirect) analyses for outcome of nausea.
The cumulative probabilities for each method of managing a miscarriage being at each possible rank for the outcome of nausea are shown in Figure 31. The highest ranked method for managing a miscarriage for the outcome of nausea was suction aspiration (SUCRA 91.6%), followed by expectant management or placebo (SUCRA 65.9%), misoprostol (SUCRA 42.0%) with mifepristone plus misoprostol (SUCRA 27.4%) ranked fourth and dilatation and curettage (SUCRA 23.1%) last.
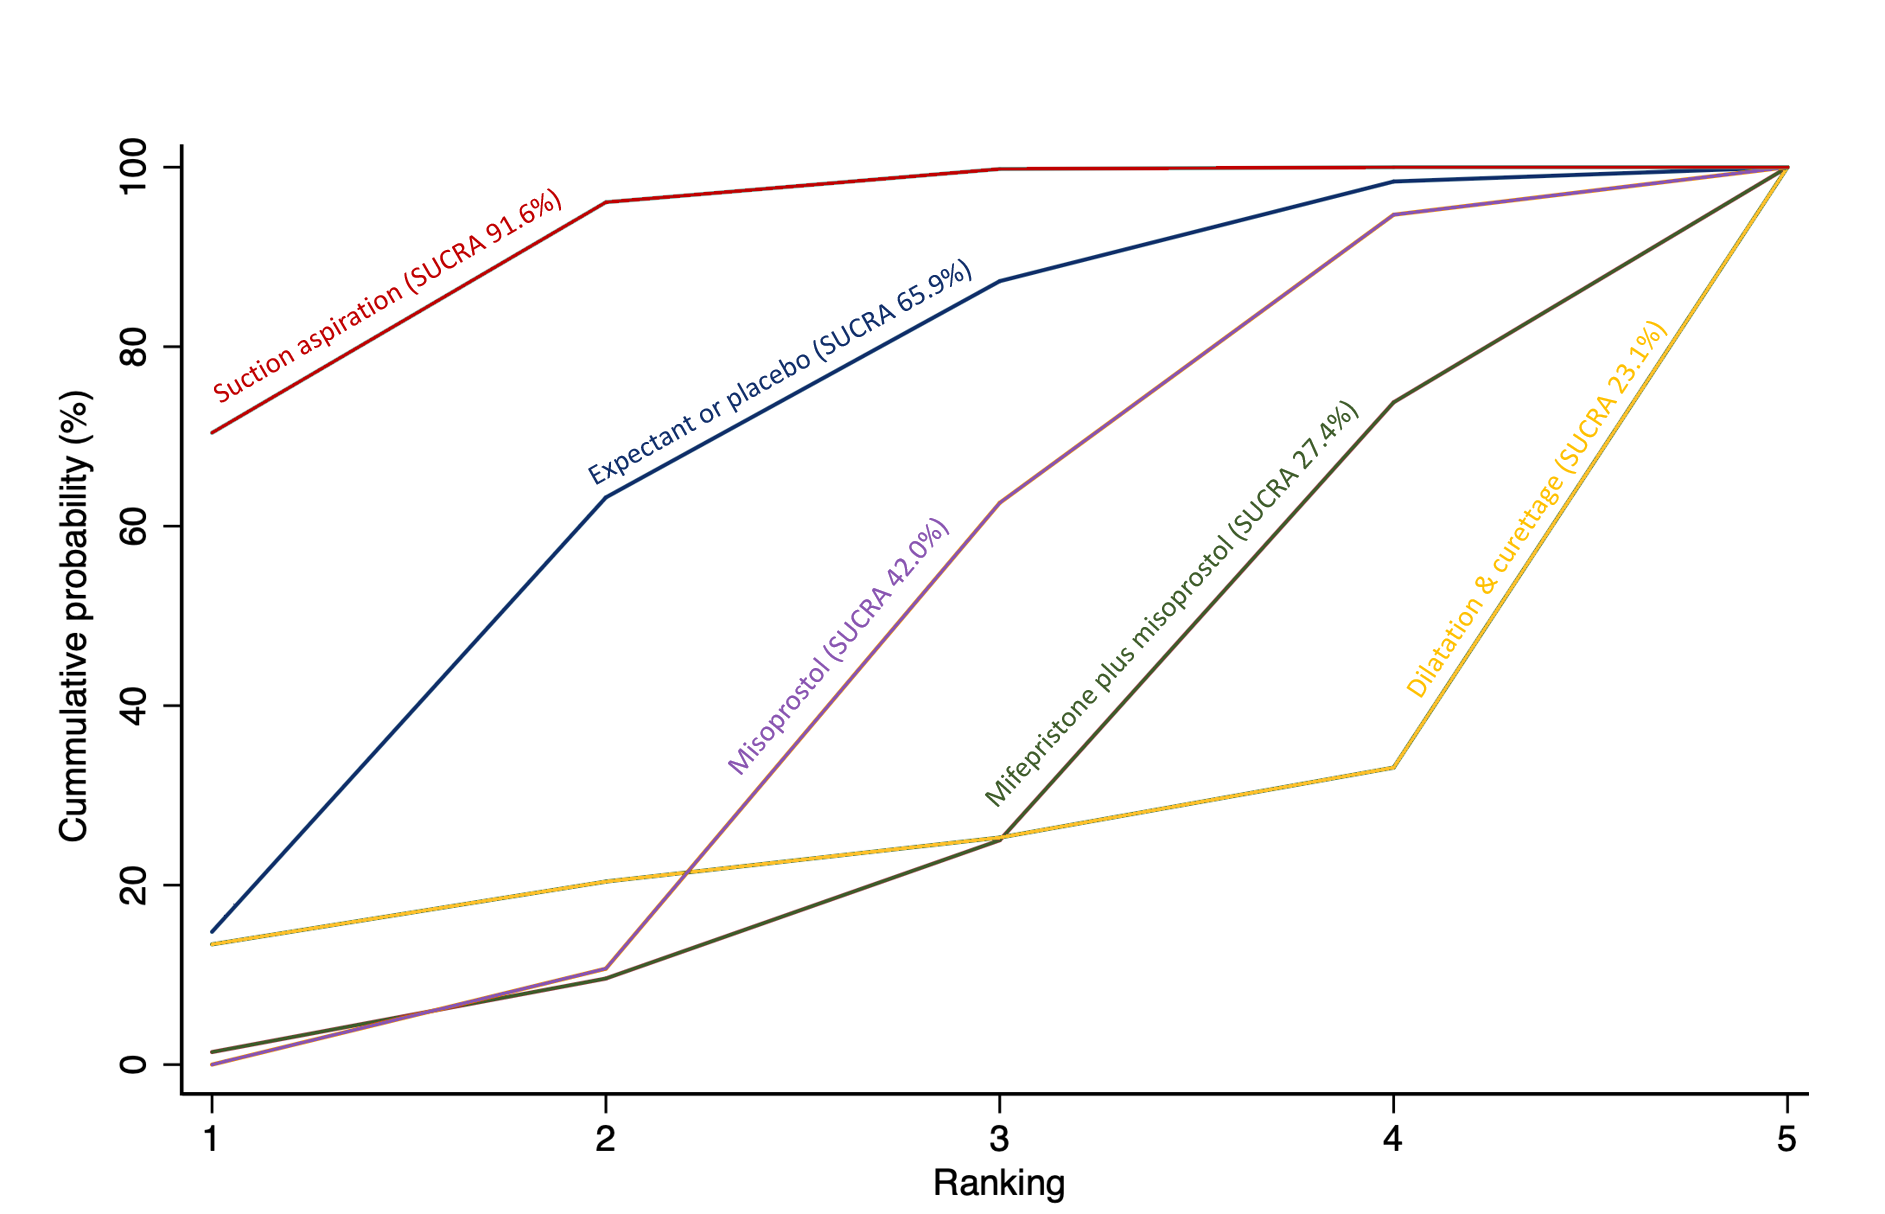
Cumulative rankogram comparing each of the methods of management of a miscarriage for the outcome of nausea. Ranking indicates the cumulative probability of being the best method, the second best, the third best, etc. The x axis shows the relative ranking and the y‐axis the cumulative probability of each ranking. We estimate the SUrface underneath this Cumulative RAnking line (SUCRA); the larger the SUCRA the higher its rank among all available methods.
Following assessment using funnel plots, we identified publication bias for the comparison of suction aspiration versus misoprostol for this outcome of nausea. Funnel plots are not included but can be obtained from the author on request.
Vomiting
The network diagram for the outcome of vomiting is presented in Figure 32. 23 trial arms contributed towards this outcome. This outcome was not reported for any trial involving suction aspiration plus cervical preparation.

Network diagram for outcome of vomiting. The nodes represent an intervention and their size is proportional to the number of trials comparing this intervention to any other in the network. The lines connecting each pair of interventions represent a direct comparison and are drawn proportional to the number of trials making each direct comparison. Numbers on the lines represent the number of trials and participants for each comparison. The colour of the line is green for high‐certainty evidence; light green for moderate‐certainty evidence; orange for low‐certainty evidence and red for very low‐certainty evidence. Multi‐arm trials contribute to more than one comparison.
Relative effects from the network meta‐analysis of 21 trials suggest that for suction aspiration (RR 0.71, 95% CI 0.37 to 1.39, low‐certainty evidence), misoprostol (RR 1.32, 95% CI 0.76 to 2.30, low‐certainty evidence), dilatation and curettage (RR 0.48, 95% CI 0.11 to 2.13, low‐certainty evidence) and mifepristone plus misoprostol (RR 2.32, 95% CI 0.91 to 5.91, low‐certainty evidence) were compatible with a wide range of treatment effects for this outcome when compared with expectant management or placebo (Figure 33).

Forest plot with relative risk ratios and 95% CIs from pairwise, indirect and network (combining direct and indirect) analyses for outcome of vomiting.
The cumulative probabilities for each method of managing a miscarriage being at each possible rank for the outcome of vomiting are shown in Figure 34. The highest ranked method for managing a miscarriage for the outcome of vomiting was dilatation and curettage (SUCRA 85.6%), followed by suction aspiration (SUCRA 78.3%), expectant management or placebo (SUCRA 53.1%) with misoprostol (SUCRA 29.3%) ranked fourth and mifepristone plus misoprostol (SUCRA 3.7%) last.

Cumulative rankogram comparing each of the methods of management of a miscarriage for the outcome of vomiting. Ranking indicates the cumulative probability of being the best method, the second best, the third best, etc. The x axis shows the relative ranking and the y‐axis the cumulative probability of each ranking. We estimate the SUrface underneath this Cumulative RAnking line (SUCRA); the larger the SUCRA the higher its rank among all available methods.
Following assessment using funnel plots, we identified publication bias for the comparison of suction aspiration versus misoprostol for this outcome of vomiting. Funnel plots are not included but can be obtained from the author on request.
Diarrhoea
The network diagram for the outcome of diarrhoea is presented in Figure 35. 20 trial arms contributed towards this outcome. This outcome was not reported for any trial involving suction aspiration plus cervical preparation.
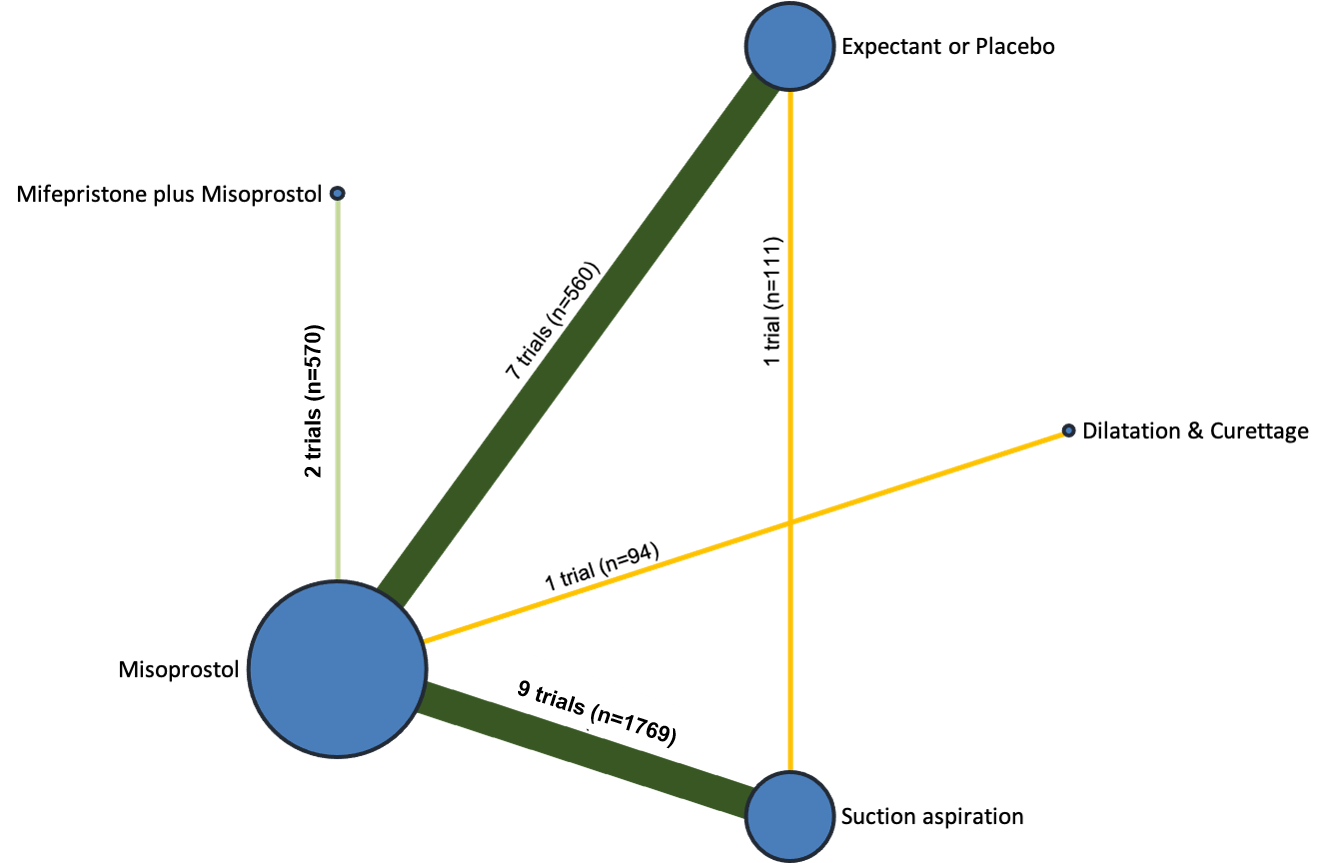
Network diagram for outcome of diarrhoea. The nodes represent an intervention and their size is proportional to the number of trials comparing this intervention to any other in the network. The lines connecting each pair of interventions represent a direct comparison and are drawn proportional to the number of trials making each direct comparison. Numbers on the lines represent the number of trials and participants for each comparison. The colour of the line is green for high‐certainty evidence; light green for moderate‐certainty evidence; orange for low‐certainty evidence and red for very low‐certainty evidence. Multi‐arm trials contribute to more than one comparison.
Relative effects from the network meta‐analysis of 18 trials, suggest that for suction aspiration (RR 0.69, 95% CI 0.42 to 1.12, low‐certainty evidence), misoprostol (RR 1.61, 95% CI 1.11 to 2.32, low‐certainty evidence), mifepristone plus misoprostol (RR 1.47, 95% CI 0.93 to 2.33, low‐certainty evidence), and dilatation and curettage (RR 0.54, 95% CI 0.02 to 13.10, very low‐certainty evidence) are compatible with a wide range of treatment effects for diarrhoea when compared with expectant management or placebo (Figure 36).
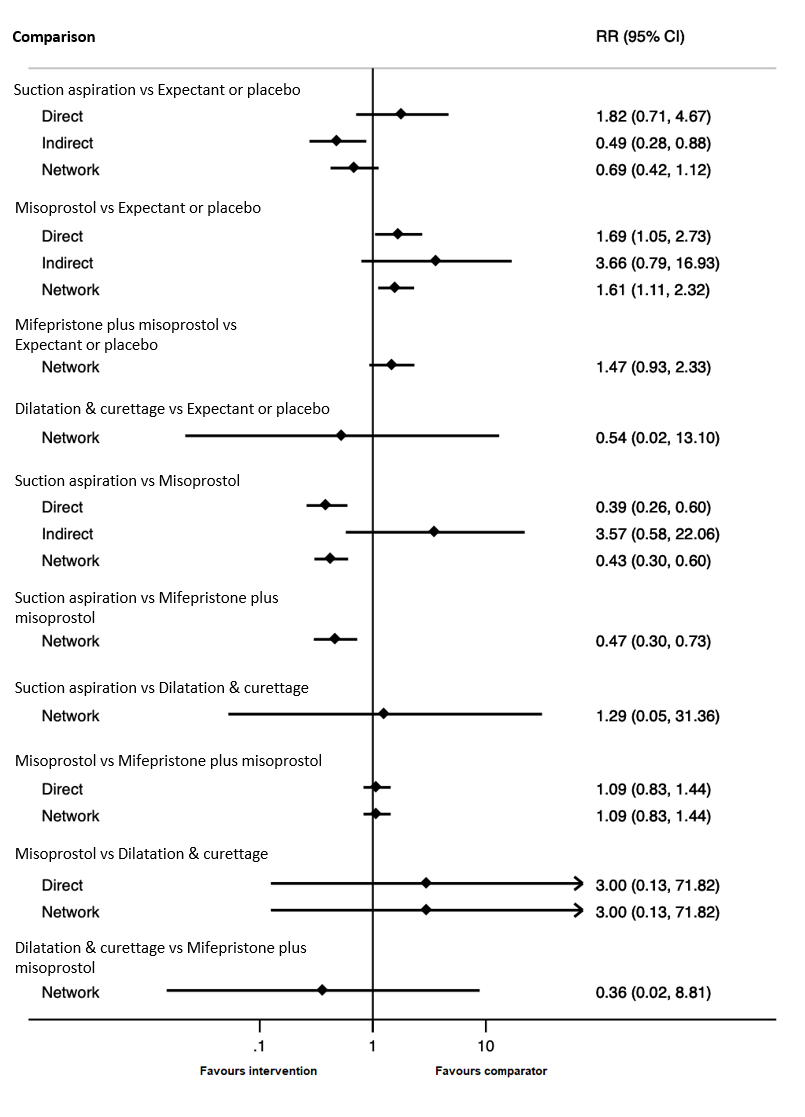
Forest plot with relative risk ratios and 95% CIs from pairwise, indirect and network (combining direct and indirect) analyses for outcome of diarrhoea.
The cumulative probabilities for each method of managing a miscarriage being at each possible rank for the outcome of diarrhoea are shown in Figure 37. The highest ranked method for managing a miscarriage for the outcome of diarrhoea was suction aspiration (SUCRA 85.3%), followed by dilatation and curettage (SUCRA 65.0%), expectant management or placebo (SUCRA 59.6%) with mifepristone plus misoprostol (SUCRA 26.8%) ranked fourth and misoprostol (SUCRA 13.3%) last.
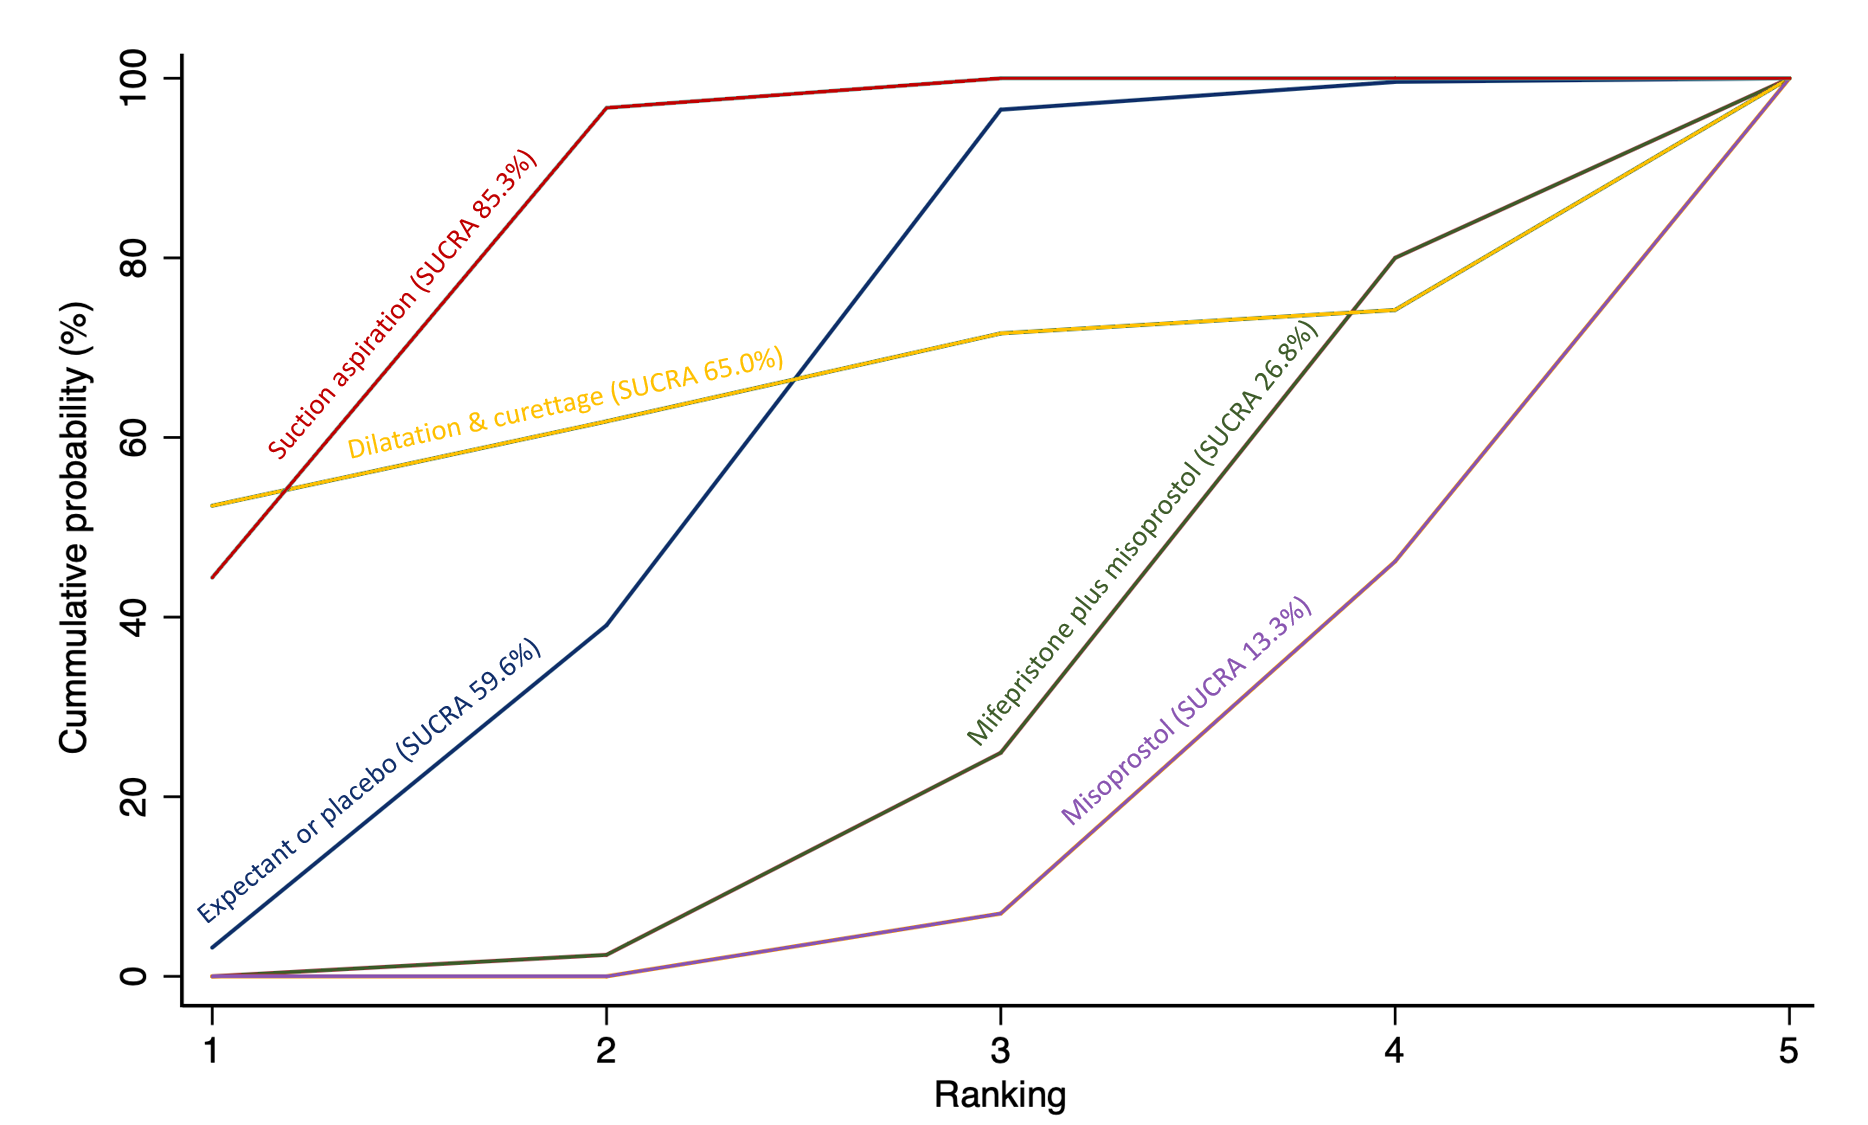
Cumulative rankogram comparing each of the methods of management of a miscarriage for the outcome of diarrhoea. Ranking indicates the cumulative probability of being the best method, the second best, the third best, etc. The x axis shows the relative ranking and the y‐axis the cumulative probability of each ranking. We estimate the SUrface underneath this Cumulative RAnking line (SUCRA); the larger the SUCRA the higher its rank among all available methods.
Following assessment using funnel plots, we identified publication bias for the comparison of suction aspiration versus misoprostol for this outcome of diarrhoea. Funnel plots are not included but can be obtained from the author on request.
Pyrexia
The network diagram for the outcome of pyrexia is presented in Figure 38. 28 trial arms contributed towards this outcome. This outcome was not reported for any trial involving suction aspiration plus cervical preparation.
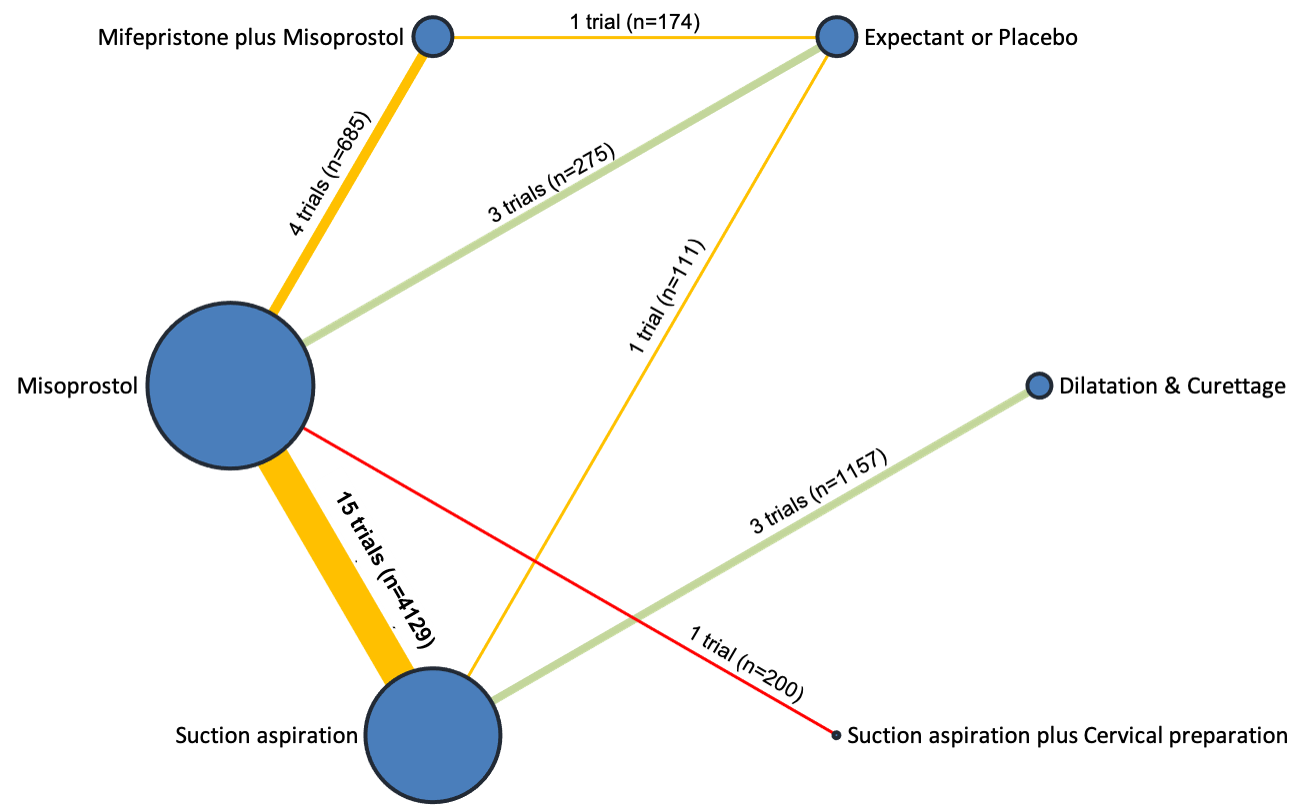
Network diagram for outcome of pyrexia. The nodes represent an intervention and their size is proportional to the number of trials comparing this intervention to any other in the network. The lines connecting each pair of interventions represent a direct comparison and are drawn proportional to the number of trials making each direct comparison. Numbers on the lines represent the number of trials and participants for each comparison. The colour of the line is green for high‐certainty evidence; light green for moderate‐certainty evidence; orange for low‐certainty evidence and red for very low‐certainty evidence. Multi‐arm trials contribute to more than one comparison.
Relative effects from the network meta‐analysis of 26 trials suggest that for misoprostol (RR 3.51, 95% CI 0.98 to 12.53, moderate‐certainty evidence) and dilatation and curettage (RR 1.10, 95% CI 0.23 to 5.19, low‐certainty evidence), suction aspiration (RR 1.36, 95% CI 0.37 to 5.06, very low‐certainty evidence), suction aspiration plus cervical preparation (RR 1.40, 95% CI 0.19 to 10.18, very low‐certainty evidence), and mifepristone plus misoprostol (RR 4.15, 95% CI 0.88 to 19.59, very low‐certainty evidence) were compatible with a wide range of treatment effects for pyrexia when compared with expectant management or placebo (Figure 39).

Forest plot with relative risk ratios and 95% CIs from pairwise, indirect and network (combining direct and indirect) analyses for outcome of pyrexia.
The cumulative probabilities for each method of managing a miscarriage being at each possible rank for the outcome of pyrexia are shown in Figure 40. The highest ranked method for managing a miscarriage for the outcome of pyrexia was expectant management or placebo (SUCRA 75.8%), followed by dilatation and curettage (SUCRA 74.0%), with suction aspiration (SUCRA 62.8%) and suction aspiration plus cervical preparation (SUCRA 60.3%) ranked joint third. Misoprostol (SUCRA 14.8%) ranked fifth with mifepristone plus misoprostol (SUCRA 12.3%) last.
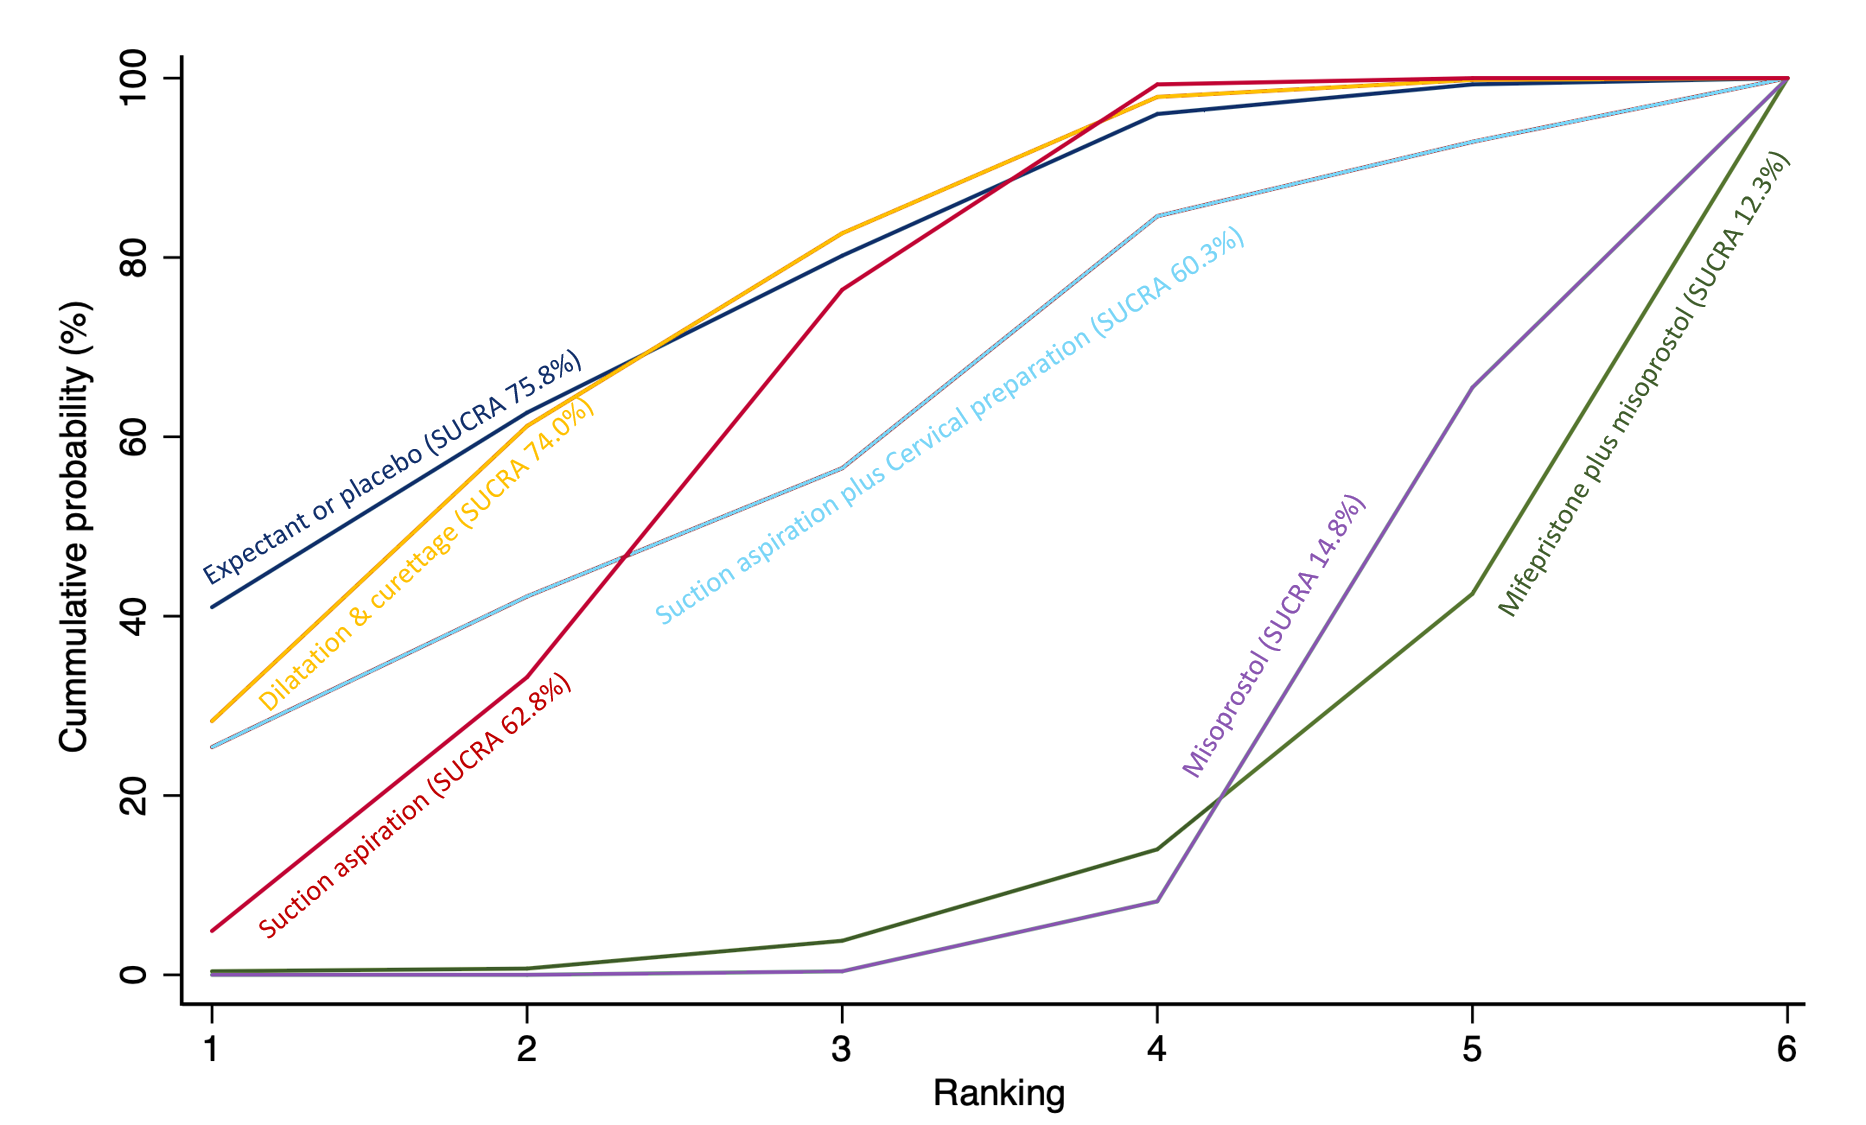
Cumulative rankogram comparing each of the methods of management of a miscarriage for the outcome of pyrexia. Ranking indicates the cumulative probability of being the best method, the second best, the third best, etc. The x axis shows the relative ranking and the y‐axis the cumulative probability of each ranking. We estimate the SUrface underneath this Cumulative RAnking line (SUCRA); the larger the SUCRA the higher its rank among all available methods.
Anxiety score
There were two trials which reported anxiety score. Network meta‐analysis was therefore not possible, and so we were unable to produce a network diagram, network relative effects and a rankogram. Direct evidence is presented only from pairwise meta‐analysis. Both trials (Harwood 2008; Kong 2013) looked at the comparison of suction aspiration versus misoprostol (SMD ‐0.08, 95% CI ‐0.24 to 0.09) (Analysis 1.15), with no difference shown.
Depression Score
There were three trials which reported depression score. Network meta‐analysis was therefore not possible, so we were unable to produce a network diagram, network relative effects and a rankogram. Direct evidence is presented only from pairwise meta‐analysis. Two of the trials were also those that reported anxiety score (Harwood 2008; Kong 2013), and therefore suction aspiration versus misoprostol was the only comparison with more than one trial (SMD ‐0.17, 95% CI ‐0.46 to 0.12) (Analysis 1.16), and no difference was shown. The third trial compared misoprostol versus dilatation and curettage.
Subgroup and sensitivity analysis
Statistical inconsistency
We assessed the global statistical inconsistency for the network meta‐analyses, which are provided in Appendix 2. A significant inconsistency was observed for the outcomes of complete miscarriage (P = 0.00) and days of bleeding (P = 0.017), and therefore the interpretation of these findings require a high degree of caution. The pairwise meta‐analyses also revealed high levels of heterogeneity for the outcome of complete miscarriage which was derived from the type of miscarriage (I2 range 63% to 94%) (Analysis 1.1; Analysis 1.7; Analysis 2.1; Analysis 3.1; Analysis 3.7; Analysis 4.1; Analysis 4.7; Analysis 5.1; Analysis 5.6; Analysis 6.1; Analysis 6.7; Analysis 8.1; Analysis 8.7; Analysis 9.1; Analysis 9.3; Analysis 10.1). For this reason, a subgroup analysis for missed miscarriage and incomplete miscarriage, which have been identified as the major source of inconsistency and heterogeneity, were conducted for the complete miscarriage outcome.
Type of miscarriage
We carried out subgroup analyses for the primary outcome of complete miscarriage and also days of bleeding by type of miscarriage (incomplete miscarriage versus missed miscarriage).
Missed miscarriage subgroup
Complete miscarriage
The network diagram for the missed miscarriage subgroup analysis for the outcome of complete miscarriage is presented in Figure 41. Misoprostol was the most frequently investigated method of miscarriage management (12 of 16 trials [75%]) for this subgroup analysis for the outcome of complete miscarriage (Figure 41). This outcome was not reported for any trial involving suction aspiration plus cervical preparation.
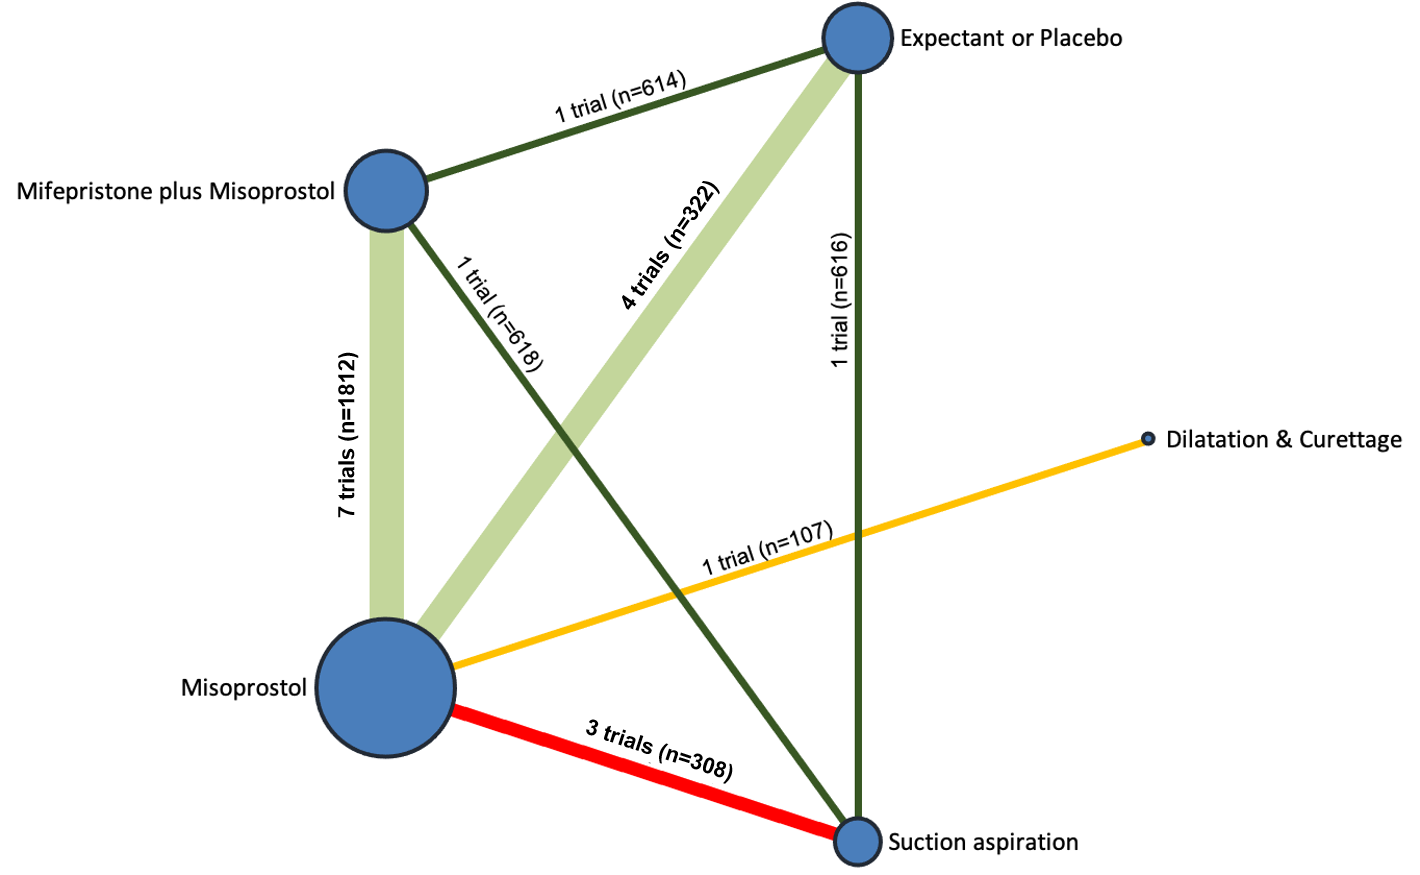
Network diagram for missed miscarriage subgroup analysis of outcome of complete miscarriage. The nodes represent an intervention and their size is proportional to the number of trials comparing this intervention to any other in the network. The lines connecting each pair of interventions represent a direct comparison and are drawn proportional to the number of trials making each direct comparison. Numbers on the lines represent the number of trials and participants for each comparison. The colour of the line is green for high‐certainty evidence; light green for moderate‐certainty evidence; orange for low‐certainty evidence and red for very low‐certainty evidence. Multi‐arm trials contribute to more than one comparison.
Relative effects from the network meta‐analysis of 16 trials, suggest that dilatation and curettage (RR 2.07, 95% CI 1.19 to 3.59, high‐certainty evidence) is more effective in achieving a complete miscarriage compared with expectant management or placebo. Misoprostol (RR 1.67, 95% CI 1.18 to 2.37, low‐certainty evidence), mifepristone plus misoprostol (RR 1.82, 95% CI 1.28 to 2.58, moderate‐certainty evidence) and suction aspiration (RR 2.43, 95% CI 1.69 to 3.49, moderate‐certainty evidence) were probably also more effective in achieving a complete miscarriage compared with expectant management or placebo (Figure 42, summary of findings Table 2).
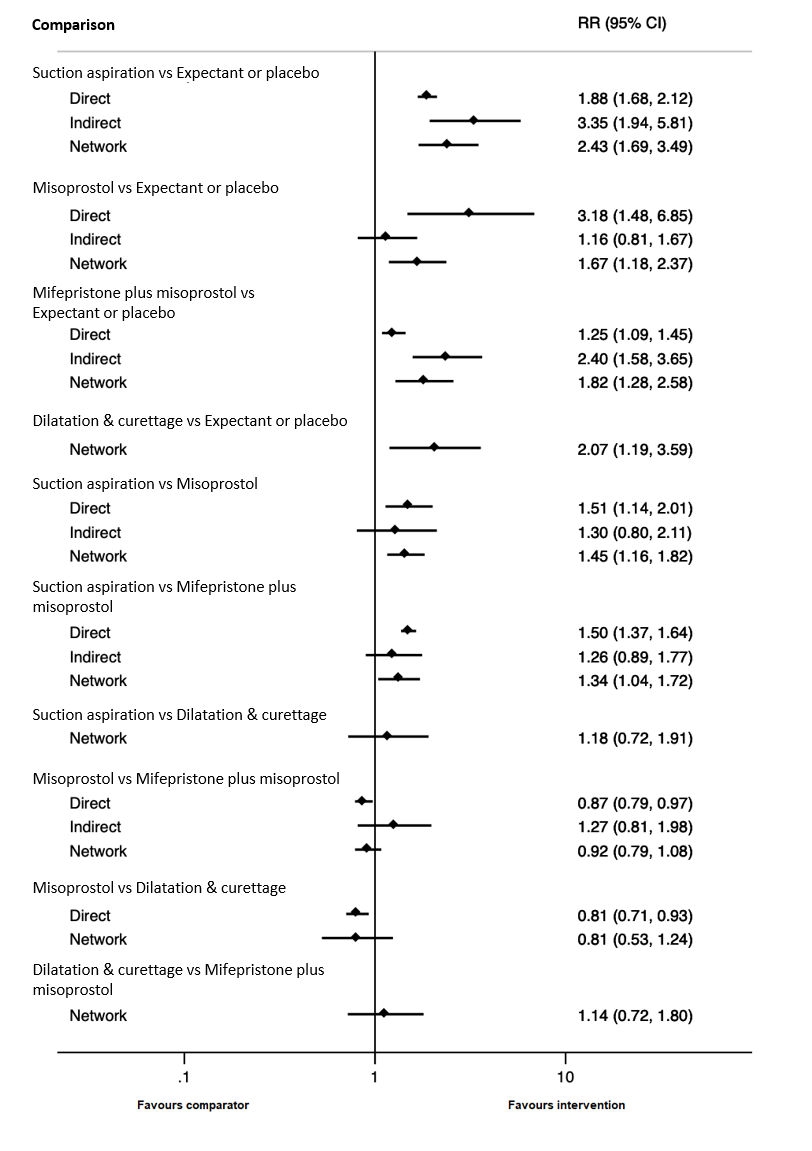
Forest plot with relative risk ratios and 95% CIs from pairwise, indirect and network (combining direct and indirect) analyses for missed miscarriage subgroup of complete miscarriage outcome.
The cumulative probabilities for each method of managing a miscarriage being at each possible rank for completing a miscarriage are shown in Figure 43. The highest ranked method for managing a miscarriage for the outcome of complete miscarriage in the missed miscarriage subgroup was suction curettage (SUCRA 92.7%), followed by dilatation and curettage (SUCRA 70.8%), mifepristone plus misoprostol (SUCRA 53.1%) with misoprostol (SUCRA 33.3%) ranked fourth and expectant management or placebo (SUCRA 0.2%) last.

Cumulative rankogram comparing each of the methods of management of a miscarriage for missed miscarriage subgroup analysis for the outcome of complete miscarriage. Ranking indicates the cumulative probability of being the best method, the second best, the third best, etc. The x axis shows the relative ranking and the y‐axis the cumulative probability of each ranking. We estimate the SUrface underneath this Cumulative RAnking line (SUCRA); the larger the SUCRA the higher its rank among all available methods.
Days of bleeding
The network diagram for the missed miscarriage subgroup analysis for the outcome of days of bleeding is presented in Figure 44.

Network diagram for missed miscarriage subgroup analysis of outcome of days of bleeding. The nodes represent an intervention and their size is proportional to the number of trials comparing this intervention to any other in the network. The lines connecting each pair of interventions represent a direct comparison and are drawn proportional to the number of trials making each direct comparison. Numbers on the lines represent the number of trials and participants for each comparison. The colour of the line is green for high‐certainty evidence; light green for moderate‐certainty evidence; orange for low‐certainty evidence and red for very low‐certainty evidence. Multi‐arm trials contribute to more than one comparison.
Relative effects from the network meta‐analysis of 12 trials, suggest that suction aspiration (RR ‐4.00, 95% CI ‐6.84 to ‐1.16, very low‐certainty evidence), mifepristone plus misoprostol (RR ‐2.32, 95% CI ‐4.60 to ‐0.04, very low‐certainty evidence) and misoprostol (RR ‐2.30, 95% CI ‐4.58 to ‐0.02, very low‐certainty evidence) may cause less days of bleeding when compared to expectant management or placebo, but the evidence is very uncertain (Figure 45).
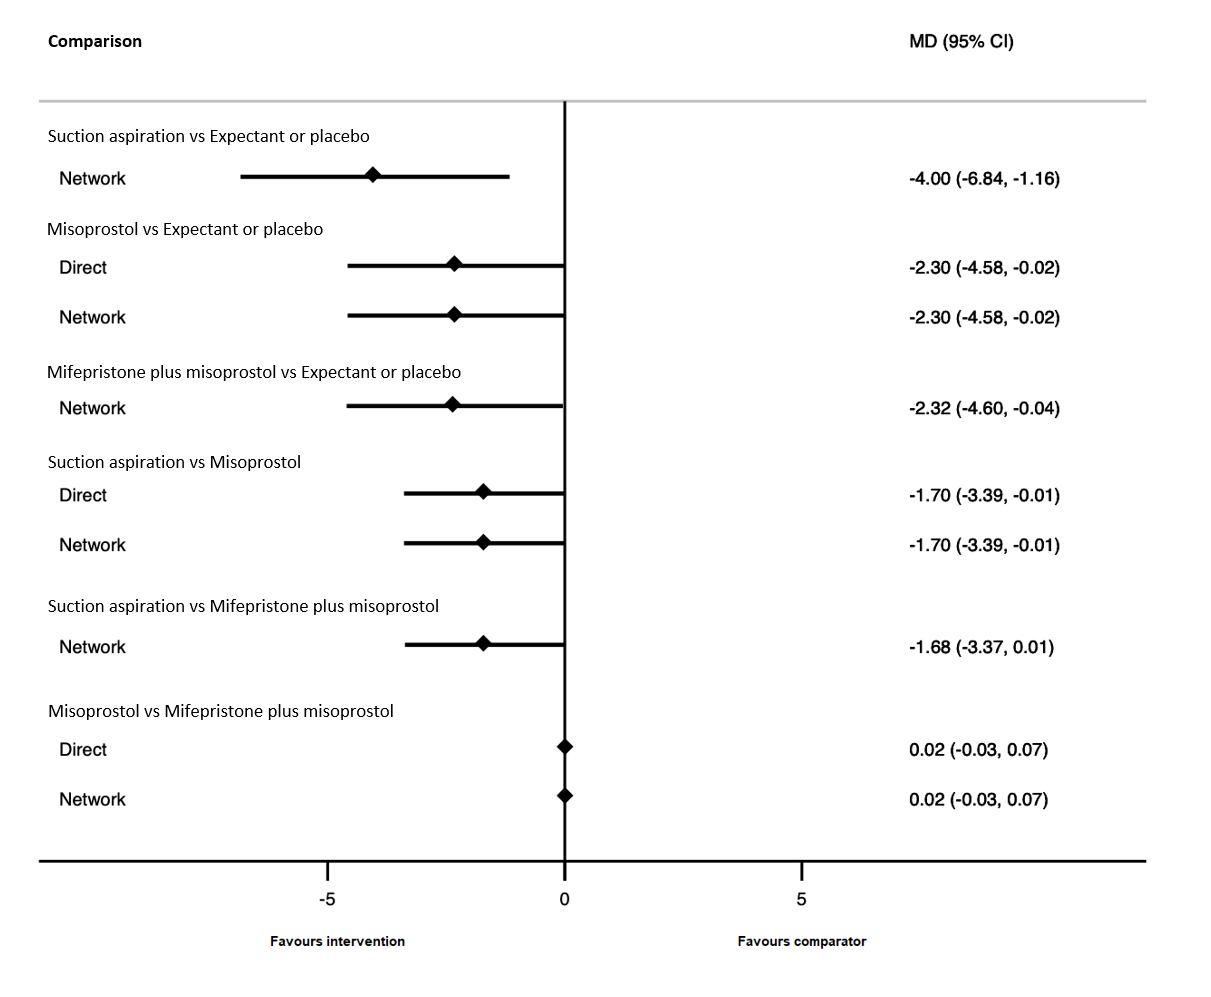
Forest plot with relative risk ratios and 95% CIs from pairwise, indirect and network (combining direct and indirect) analyses for missed miscarriage subgroup of the days of bleeding outcome.
The cumulative probabilities for each method of managing a miscarriage being at each possible rank for the outcome of days of bleeding are shown in Figure 46. The highest ranked method for managing a miscarriage for the outcome of days of bleeding was suction aspiration (SUCRA 97.6%), followed by mifepristone plus misoprostol (SUCRA 60.7%), misoprostol (SUCRA 39.9%) with expectant management or placebo (SUCRA 1.7%) last.

Cumulative rankogram comparing each of the methods of management of a miscarriage for missed miscarriage subgroup analysis for the outcome of days of bleeding. Ranking indicates the cumulative probability of being the best method, the second best, the third best, etc. The x axis shows the relative ranking and the y‐axis the cumulative probability of each ranking. We estimate the SUrface underneath this Cumulative RAnking line (SUCRA); the larger the SUCRA the higher its rank among all available methods.
Incomplete miscarriage subgroup
Compete miscarriage
The network diagram for the incomplete miscarriage subgroup analysis for the outcome of complete miscarriage is presented in Figure 47. Suction curettage was the most frequently investigated method of miscarriage management (18 of 26 trials [69%]) for this subgroup analysis for the outcome of complete miscarriage (Figure 47). This outcome was not reported for any trial involving suction aspiration plus cervical preparation.
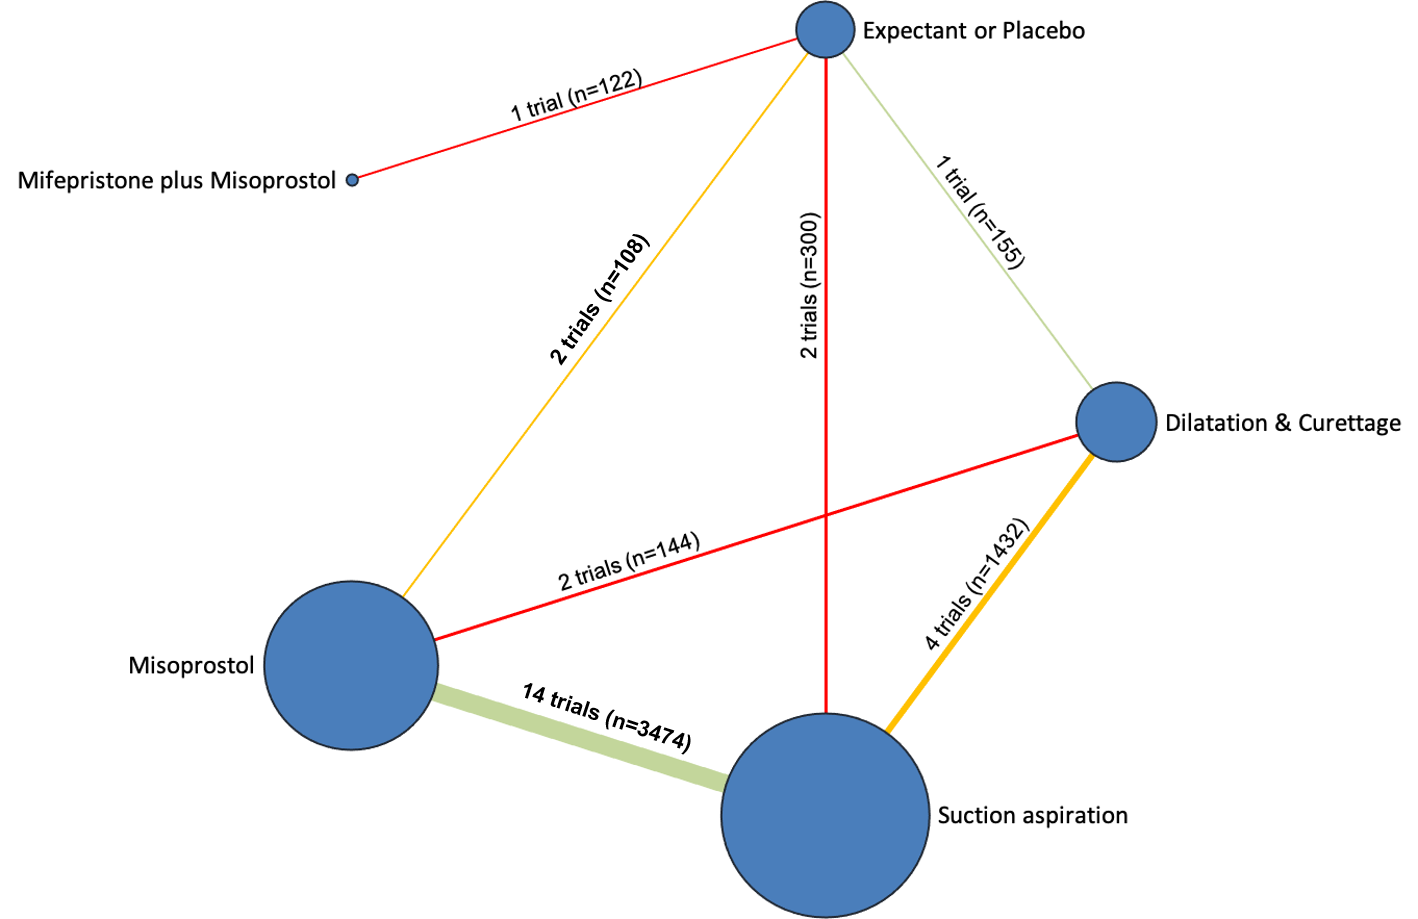
Network diagram for incomplete miscarriage subgroup analysis of outcome of complete miscarriage. The nodes represent an intervention and their size is proportional to the number of trials comparing this intervention to any other in the network. The lines connecting each pair of interventions represent a direct comparison and are drawn proportional to the number of trials making each direct comparison. Numbers on the lines represent the number of trials and participants for each comparison. The colour of the line is green for high‐certainty evidence; light green for moderate‐certainty evidence; orange for low‐certainty evidence and red for very low‐certainty evidence. Multi‐arm trials contribute to more than one comparison.
Relative effects from the network meta‐analysis of 26 trials suggest that misoprostol (RR 1.14, 95% CI 1.03 to 1.25, moderate‐certainty evidence), dilatation and curettage (RR 1.19, 95% CI 1.08 to 1.31, moderate‐certainty evidence) and suction aspiration (RR 1.19, 95% CI 1.09 to 1.31, moderate‐certainty evidence) were probably more effective in achieving a complete miscarriage compared with expectant management or placebo. Mifepristone plus misoprostol (RR 1.08, 95% CI 0.87 to 1.34, very low‐certainty evidence) was compatible with a wide range of treatment effects for the outcome of complete miscarriage compared with expectant management or placebo (Figure 48, summary of findings Table 3).
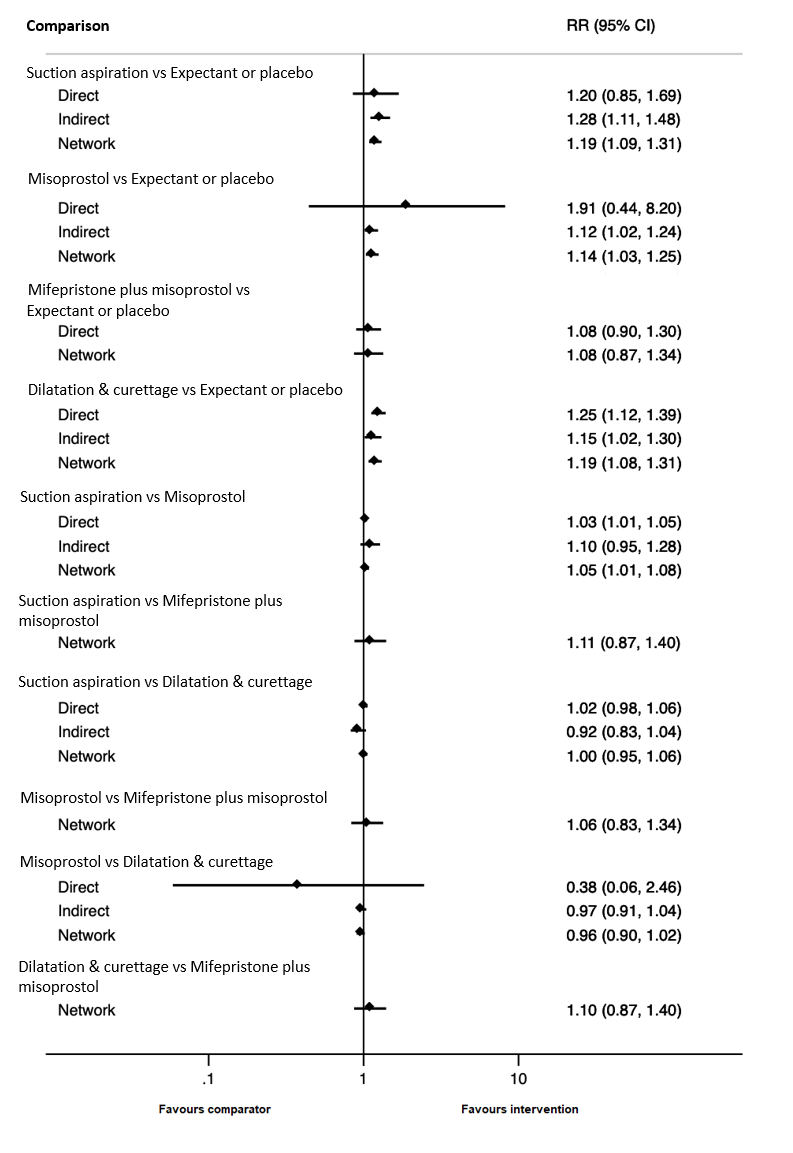
Forest plot with relative risk ratios and 95% CIs from pairwise, indirect and network (combining direct and indirect) analyses for incomplete miscarriage subgroup of complete miscarriage outcome.
The cumulative probabilities for each method of managing a miscarriage being at each possible rank for completing a miscarriage are shown in Figure 5. The highest ranked method for managing a miscarriage for the outcome of complete miscarriage in the incomplete miscarriage subgroup was suction aspiration (SUCRA 83.6%), followed by dilatation and curettage (SUCRA 79.4%), misoprostol (SUCRA 44.2%) with mifepristone plus misoprostol ranked fourth (SUCRA 36.1%) and expectant management or placebo (SUCRA 6.7%) last.
Days of bleeding
The network diagram for the missed miscarriage subgroup analysis for the outcome of days of bleeding is presented in Figure 49.

Network diagram for incomplete miscarriage subgroup analysis of outcome of days of bleeding. The nodes represent an intervention and their size is proportional to the number of trials comparing this intervention to any other in the network. The lines connecting each pair of interventions represent a direct comparison and are drawn proportional to the number of trials making each direct comparison. Numbers on the lines represent the number of trials and participants for each comparison. The colour of the line is green for high‐certainty evidence; light green for moderate‐certainty evidence; orange for low‐certainty evidence and red for very low‐certainty evidence. Multi‐arm trials contribute to more than one comparison.
Relative effects from the network meta‐analysis of 11 trials, suggest that suction aspiration (RR ‐0.86, 95% CI ‐2.51 to 0.79, very low‐certainty evidence), mifepristone plus misoprostol (RR 0.70, 95% CI ‐0.69 to 2.09, very low‐certainty evidence), misoprostol (RR 0.31, 95% CI ‐1.38 to 1.99, very low‐certainty evidence) and dilatation and curettage (RR ‐1.26, 95% CI ‐2.56 to 0.04, very low‐certainty evidence) were compatible with a wide range of treatment effects for days of bleeding when compared with expectant management or placebo, and the evidence is very uncertain (Figure 50).

Forest plot with relative risk ratios and 95% CIs from pairwise, indirect and network (combining direct and indirect) analyses for incomplete miscarriage subgroup of the days of bleeding outcome.
The cumulative probabilities for each method of managing a miscarriage being at each possible rank for the outcome of days of bleeding are shown in Figure 51. The highest ranked method for managing a miscarriage for the outcome of days of bleeding in the missed miscarriage subgroup was dilatation and curettage (SUCRA 92.9%), followed by suction aspiration (SUCRA 75.2%), followed by expectant or placebo (SUCRA 40.6%), misoprostol (SUCRA 25.4%) ranked fourth and mifepristone plus misoprostol (SUCRA 16.0%) last.
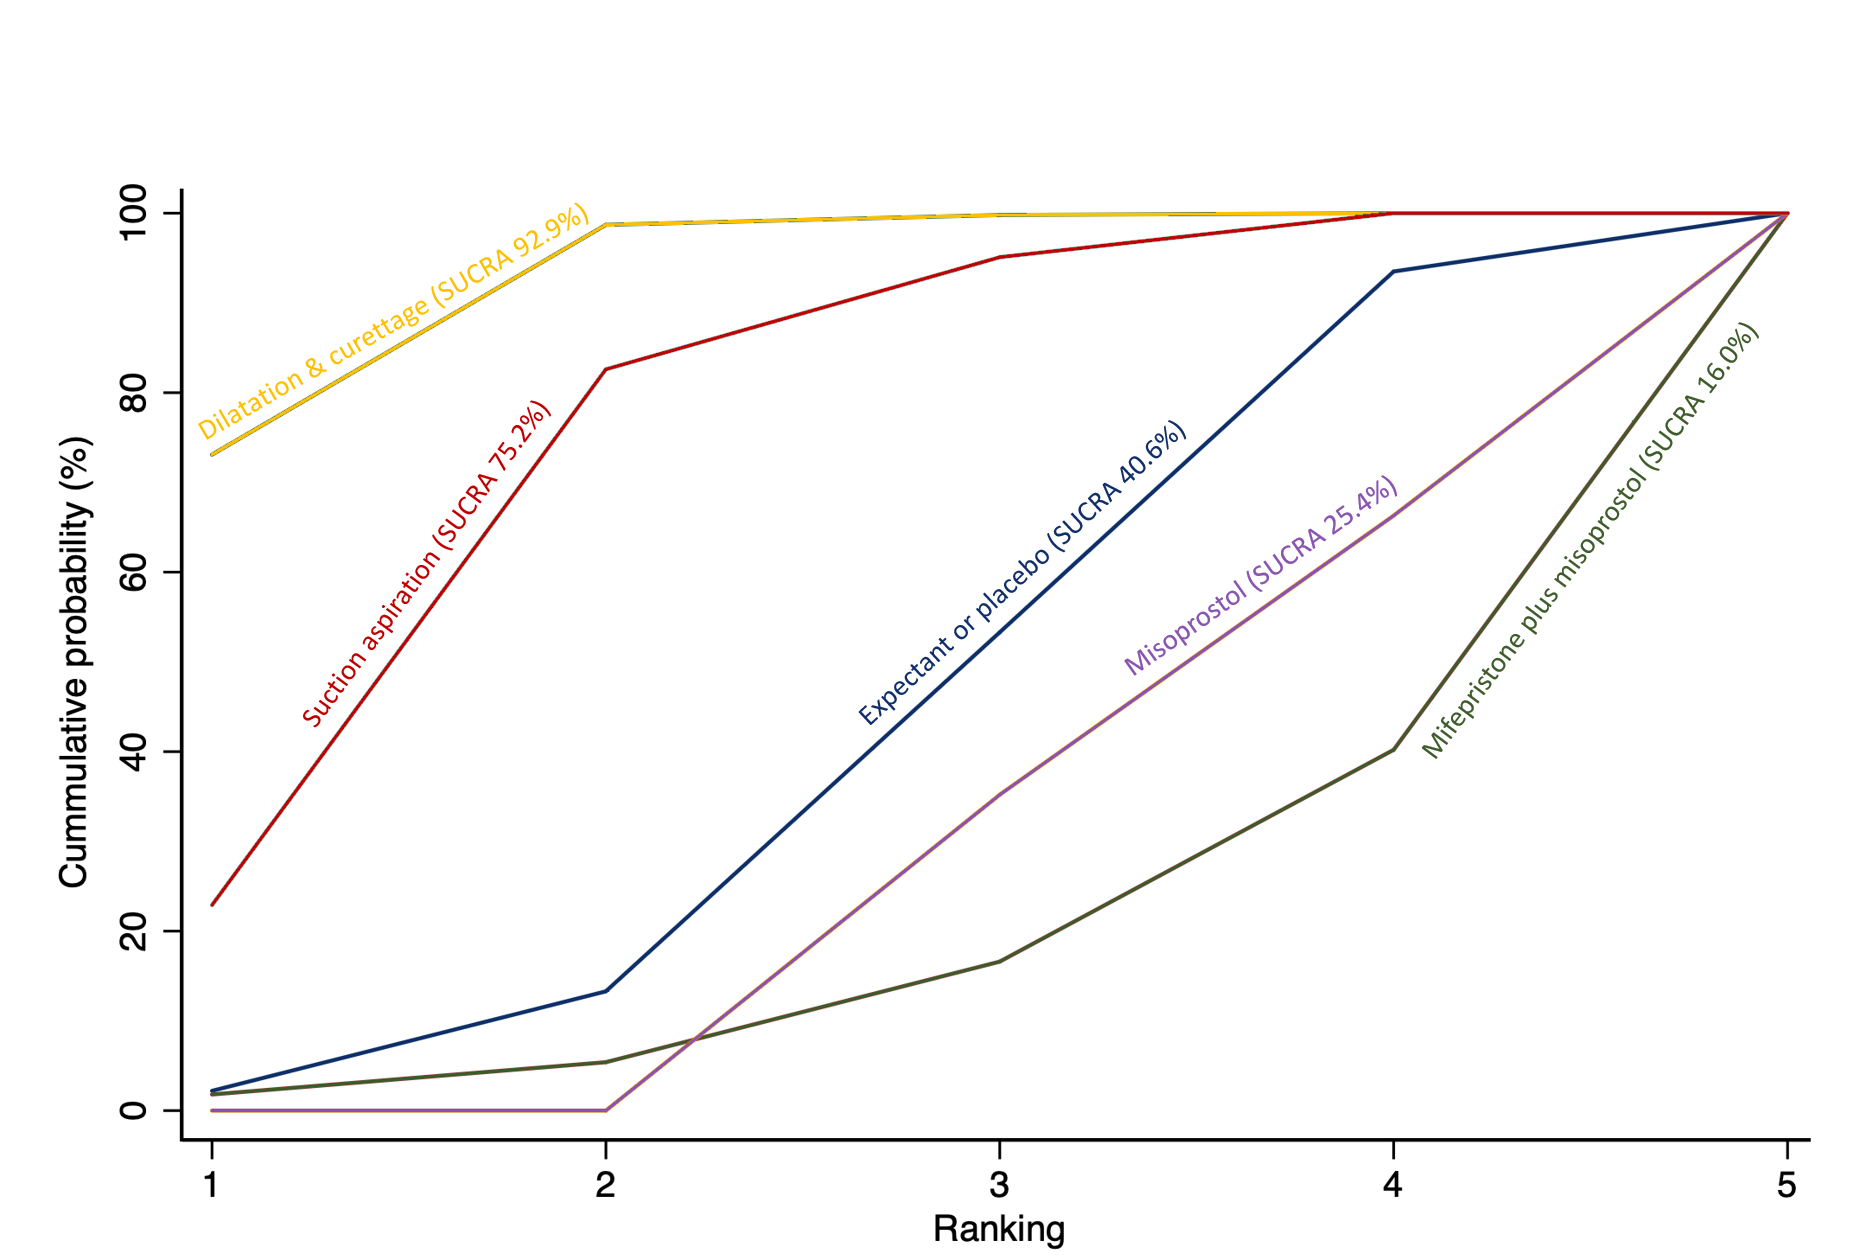
Cumulative rankogram comparing each of the methods of management of a miscarriage for incomplete miscarriage subgroup analysis for the outcome of days of bleeding. Ranking indicates the cumulative probability of being the best method, the second best, the third best, etc. The x axis shows the relative ranking and the y‐axis the cumulative probability of each ranking. We estimate the SUrface underneath this Cumulative RAnking line (SUCRA); the larger the SUCRA the higher its rank among all available methods.
Other subgroup analyses
We had planned on performing a subgroup analyses based on gestation of miscarriage, however, only five trials (Machtinger 2002; Machtinger 2004; Nasreen 2009; Sahin 2001; Stockheim 2006) specified a gestational age of less than or equal to nine weeks. The remaining trials did not differentiate between miscarriages of less than or equal to nine weeks or greater than nine weeks but less than or equal to 14 weeks of gestation. Therefore, this analysis was not possible. We had also planned to perform a subgroup analysis of electric versus manual vacuum aspiration for the suction aspiration intervention, however, 12 trials did not explicitly state the method of suction aspiration, one trial (Zhang 2005) included both electric and manual aspiration in their suction aspiration group depending upon which site the patient was treated at and did not differentiate between them. Therefore this left only four trials (Chung 1999; Dangalla 2012; Demetroulis 2001; Kittiwatanakul 2012), which explicitly used electric vacuum aspiration and 15 trials which explicitly used manual vacuum aspiration and network meta‐analysis was not possible. We had also planned to perform a subgroup analysis based on type of healthcare setting (inpatient versus outpatient). This was not performed as the healthcare setting was not explicitly stated in the vast majority of trials and many of the interventions appeared to have presented the results combining inpatient and outpatient patients. When describing the interventions, authors made judgements on the healthcare settings for the table of characteristics based on the available descriptions in the trials, but a meaningful subgroup analysis was not possible. We had also planned a subgroup analysis based on the dosage, regimen and route of drug administration for the medical interventions. Whilst most of the trials used mifepristone at a similar dose and a similar route of administration, there was significant heterogeneity in terms of the way misoprostol was used for route, dosage and regimen. For this reason, a network meta‐analysis according to the different routes, dosages and regimens of misoprostol was not considered meaningful and was not performed. Finally, we considered performing subgroup analysis for the composite outcome of death and serious complications for the subgroups of missed miscarriage and incomplete miscarriage but only ten and 14 trials, respectively reported the type of miscarriage for this composite outcome and therefore any meaningful network meta‐analysis was judged by the authors not to be possible or relevant.
Sensitivity analysis
We carried out pre‐specified sensitivity analyses by restricting our analyses to studies at low risk of bias and studies that were placebo‐controlled. Sensitivity analyses were also performed according to the choice of relative effect measure (risk ratio (RR) versus odds ratio (OR)) and the statistical model (fixed‐effect versus random‐effects model). The sensitivity analyses show that the overall results are not affected by the above mentioned criteria or decisions.
Discussion
Summary of main results
This review includes 78 randomised trials involving 17,795 women. Most trials were conducted in hospital settings and included women with missed or incomplete miscarriage. Of the 78 included studies, 92% contributed data to the analysis, 8% did not present the data in a usable form for meta‐analysis. Across the 71 trials (158 trial arms), the following methods were used: 33% used misoprostol; 32% used suction aspiration; 16% used expectant management or placebo; 11% used dilatation and curettage; 6% used mifepristone plus misoprostol; and 2% used suction aspiration plus cervical preparation.
Based on relative effects from network meta‐analysis of 59 trials (12,591 women), we found that suction aspiration plus cervical preparation, dilatation and curettage, suction aspiration, mifepristone plus misoprostol and misoprostol may be more effective than expectant management or placebo for achieving a complete miscarriage. The highest ranked surgical method was suction aspiration plus cervical preparation. The highest ranked non‐surgical method was mifepristone plus misoprostol. All surgical methods were ranked higher than medical methods, which in turn were ranked higher than expectant management or placebo.
Based on relative effects from network meta‐analysis of 35 trials (8161 participants), we found that dilatation and curettage, suction aspiration, misoprostol and mifepristone plus misoprostol are compatible with a wide range of treatment effects for death and serious complications when compared with expectant management or placebo. No deaths were reported in the trials that contributed towards this outcome, therefore it was entirely composed of serious complications. The most common serious complications included blood transfusions, uterine perforations, hysterectomies, and intensive care unit admissions. The ranking for most methods was not clear for this outcome due to limited data. However, expectant management or placebo ranked bottom amongst all available methods.
Subgroup analyses revealed important differences for the effectiveness of the available methods for managing the miscarriage according to the type of miscarriage. Specifically, for women with missed miscarriage, relative effects from the network meta‐analysis of 16 trials, suggest that dilatation and curettage is more effective in achieving a complete miscarriage compared with expectant management or placebo. Misoprostol, mifepristone plus misoprostol and suction aspiration are probably also more effective in achieving a complete miscarriage compared with expectant management or placebo. For women with incomplete miscarriage, relative effects from the network meta‐analysis of 26 trials suggest that misoprostol, dilatation and curettage and suction aspiration are probably more effective in achieving a complete miscarriage compared with expectant management or placebo. Mifepristone plus misoprostol is compatible with a wide range of treatment affects for the outcome of complete miscarriage, when compared with expectant management or placebo. The network meta‐analyses for incomplete and missed miscarriages agreed with the overall analysis in that surgical methods were better for providing a definitive treatment for a miscarriage than medical methods, which in turn were better than expectant management/ placebo. However, the relative effects were substantially lessened in women with incomplete miscarriage compared to women with missed miscarriage. Since type of miscarriage (missed and incomplete) appears to be a source of inconsistency and heterogeneity within these data, we acknowledge that the main network meta‐analysis may be unreliable. However, we plan to explore this further in future updates and consider the primary analysis as separate networks for missed and incomplete miscarriage.
Overall completeness and applicability of evidence
This network meta‐analysis provides the relative effectiveness of all methods used in the management of a miscarriage in a coherent and methodologically robust way across important clinical outcomes by combining both direct and indirect evidence, thus increasing the statistical power and confidence in the results. We found that most of the included trials reported our primary outcome of complete miscarriage and provided enough information to allow us to extract a composite outcome of death and serious complications. Most of our secondary outcomes were also reported in enough trials to perform network meta‐analysis. This increased the power across most of our analyses and contributed to the consistency in the rankings across all outcomes related to complete miscarriage such as need for unplanned or emergency surgical procedures, readmissions to hospital and days of bleeding.
We were able to evaluate the impact of the type of miscarriage on the rankings and relative effectiveness of each method of miscarriage management. A high level of statistical inconsistency and heterogeneity was identified within the evidence, therefore subgroup analyses were performed for incomplete and missed miscarriage. Rankings within the subgroups were comparable to the overall rankings. For both incomplete and missed miscarriages, the surgical methods were ranked higher than the medical methods, which in turn were ranked higher than the expectant management or placebo. However, we did find important differences in the effectiveness of the surgical and medical options amongst the two subgroups of women. The relative benefits for women with missed miscarriages undergoing any management method other than expectant management or placebo were far greater compared to women with incomplete miscarriages. This is probably because expectant management or placebo is more likely to be a more effective management option when the process of miscarriage has already started.
Unfortunately, not enough of the included trials differentiated between other effect modifiers such as gestational age of the miscarriage, healthcare setting of the intervention was not clearly stated in most trials and there was too much heterogeneity with regard to different dosages, regimens and routes of drug administration for meaningful results from network meta‐analysis. This was particularly the case with misoprostol and the misoprostol component of mifepristone and misoprostol. Misoprostol depending on the trial was administered orally, vaginally or sublingually, at a dose of 400 mcg or 600 mcg or 800 mcg as a one‐off dose, every four hours or six hours or on a following day (see Characteristics of included studies).
All the trials had wide inclusion criteria, none of the trials had restrictions on age or body mass index or ethnicity. Trials were also conducted across 37 countries, in a mix of high‐, middle‐ and low‐income countries from North America, South America, Europe, Africa and all over Asia. Trials were performed in a wide variety of settings from local clinics to district hospitals and in large tertiary and university hospitals. Many of the trials conducted in low‐ and middle‐income countries also included women who may have had incomplete termination care who presented at inclusion as incomplete miscarriage (Characteristics of included studies). All of this ensures applicability of the evidence worldwide, to any women seeking treatment for a miscarriage of less than or equal to 14 weeks gestation in any healthcare setting including women whose miscarriage may have been induced medically. Both mifepristone and misoprostol are listed in the WHO Model list of essential medicines 2019 (WHO 2019). A vaginal speculum and surgical suction pump (manual or electric) with catheter (which is the basis of suction aspiration) are on the WHO generic essential emergency equipment list (WHO 2012) ensuring they are available around the world for most healthcare settings.
Quality of the evidence
We recognise that there is no single established approach for assessing the certainty of the effect estimates generated by the network meta‐analysis. We applied the rigorous method for appraising the certainty of network evidence as proposed by the GRADE Working group. Overall, the evidence presented varied widely in certainty, and our confidence in the effect estimates ranged from very low to moderate certainty. When we compared the five other methods of miscarriage management versus expectant management or placebo, the certainty of network level evidence for the outcome of complete miscarriage, was either moderate or low. For suction aspiration plus cervical preparation being ranked first, the certainty was low due to downgrading of the indirect evidence for limitations in study design. For dilatation and curettage, suction aspiration and misoprostol being ranked second, third and fifth, the certainty of network level evidence was low due to moderate certainty direct evidence and inconsistency between direct and indirect estimates. The certainty of network level evidence was moderate for mifepristone plus misoprostol (summary of findings Table 1). Evidence for suction aspiration versus misoprostol for the outcomes of nausea, vomiting and diarrhoea were downgraded for publication bias. The certainty of evidence is also affected by inconsistencies between how different studies have reported outcomes.
The GRADE certainty of evidence assessment for the network meta‐analysis for the composite outcome of death and serious complications when comparing the five other methods to expectant management or placebo was low. There was downgrading either due to low certainty direct evidence (no intransitivity or incoherence) or due to low certainty indirect evidence (no intransitivity or incoherence) (summary of findings Table 4).
The risk of bias of the individual studies which contributed to this network meta‐analysis varied, but the majority were judged to be at low risk of bias which included large, well‐conducted and methodologically robust trials (Figure 3). Overall therefore, we feel the risk of bias was low and the sensitivity analysis removing high risk of bias trials, confirmed our conclusion.
Potential biases in the review process
Four of the review authors (AC, AJD, IDG and LB) were involved with the MifeMiso trial (Chu 2020). None of these authors participated in any decisions regarding this trial (i.e. assessment for inclusion/exclusion, trial quality, data extraction) for the purposes of this review or for future updates – these tasks have been carried out by other members of the team who were not directly involved in the trial. The certainty of the evidence was assessed by a team of authors based in different countries. Before we could GRADE the network meta‐analysis evidence, we had to determine the methodology for this process because there is no well‐established approach or accompanying tools such as software. All GRADE assessments were undertaken independently by two individuals (JG and AP) and then re‐assessed independently by a third review author (IDG) who was the arbiter of any disagreements.
The included studies did vary according to when they were conducted. The earliest was in 1979 (Caceres 1979), with a further study conducted in 1981 by the same author (Caceres 1981); nine studies were published in the decade beginning 1990; 32 were published in the decade beginning 2000; and 27 were published in the decade beginning 2010. The actual interventions are unlikely to have changed significantly during this time, however, the general care women receive may well have done, with improvements to efforts used to control side effects such as pain, nausea and vomiting. However, overall 59 out of 70 trials were conducted since 2000 and therefore we believe that there is minimal impact on the network meta‐analysis from this.
A source of heterogeneity and inconsistency was the type of miscarriage as discussed before that we plan to explore this further in future updates and consider the primary analysis as separate networks for missed and incomplete miscarriage.
A further source of heterogeneity was differences in how the primary outcome of complete miscarriage was assessed with some trials assessing the complete miscarriage outcome clinically based on history and examination, whilst others used a combination of ultrasonography to check for an empty uterine cavity and clinical assessment. Another source of heterogeneity was the time point used to assess complete miscarriage. Removing trials which only used clinical examination or ultrasonography, or limiting the analysis to studies that used a specific time point to assess complete miscarriage would have greatly reduced the number of trials available for the network meta‐analysis and hence reduced the strength of our overall findings. Lastly, not all trials reported data on side effects and severity of side effects, hence these analyses were often underpowered or network meta‐analysis was not possible.
Agreements and disagreements with other studies or reviews
There are four Cochrane Reviews listed in the treatment of miscarriage section for the Pregnancy and Childbirth group which are comparable to this review, (Lemmers 2019; Kim 2017; Nanda 2012; Tuncalp 2010). Lemmers 2019 compared misoprostol (with various routes of administration), mifepristone and vaginal gemeprost with surgical management, expectant management, placebo or other different types of medical intervention for miscarriages up to 24 weeks of gestation. Our results agreed that misoprostol was better than placebo and expectant management in accomplishing a complete miscarriage, but less effective when compared to surgical management. Kim 2017 compared vaginal misoprostol with expectant management and misoprostol via any route of administration with surgical evacuation for incomplete miscarriage. Our results agreed that misoprostol was less effective at completing a miscarriage compared to surgical methods. Kim 2017 found no difference when comparing misoprostol with expectant care (based on two studies, 150 women) whereas we found a difference when comparing misoprostol with expectant management or placebo (based on nine studies, 755 women). Nanda 2012 compared expectant management with surgical management for management of a miscarriage. Our results agreed with this review that expectant management was more likely to result in an incomplete miscarriage and that there was a higher need for unplanned surgical treatment with expectant management when compared to surgical management. Tuncalp 2010 compared suction aspiration with dilatation and curettage. Our results agreed with this review that suction aspiration was associated with decreased blood loss when compared with dilatation and curettage. A similar network meta‐analysis on this has previously been conducted (Al Wattar 2019), which concluded that medical treatments for first‐trimester miscarriage have similar effectiveness and side effects compared to surgery. The scope of this review was much smaller, with only 46 trials included, which resulted in lower power and may account for the different conclusion reached.
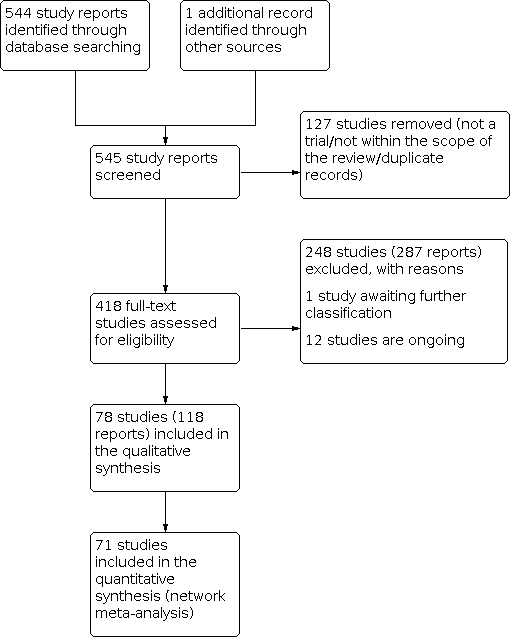
Study flow diagram.

Risk of bias graph: review authors' judgements about each risk of bias item presented as percentages across all included studies.

Risk of bias summary: review authors' judgements about each risk of bias item for each included study.

Network diagram for outcome of complete miscarriage. The nodes represent an intervention and their size is proportional to the number of trials comparing this intervention to any other in the network. The lines connecting each pair of interventions represent a direct comparison and are drawn proportional to the number of trials making each direct comparison. Numbers on the lines represent the number of trials and participants for each comparison. The colour of the line is green for high‐certainty evidence; light green for moderate‐certainty evidence; orange for low‐certainty evidence and red for very low‐certainty evidence. Multi‐arm trials contribute to more than one comparison.

Cumulative rankogram comparing each of the methods of management of a miscarriage for incomplete miscarriage subgroup analysis for the outcome of complete miscarriage. Ranking indicates the cumulative probability of being the best method, the second best, the third best, etc. The x axis shows the relative ranking and the y‐axis the cumulative probability of each ranking. We estimate the SUrface underneath this Cumulative RAnking line (SUCRA); the larger the SUCRA the higher its rank among all available methods.

Forest plot with relative risk ratios and 95% CIs from pairwise, indirect and network (combining direct and indirect) analyses for outcome of complete miscarriage.
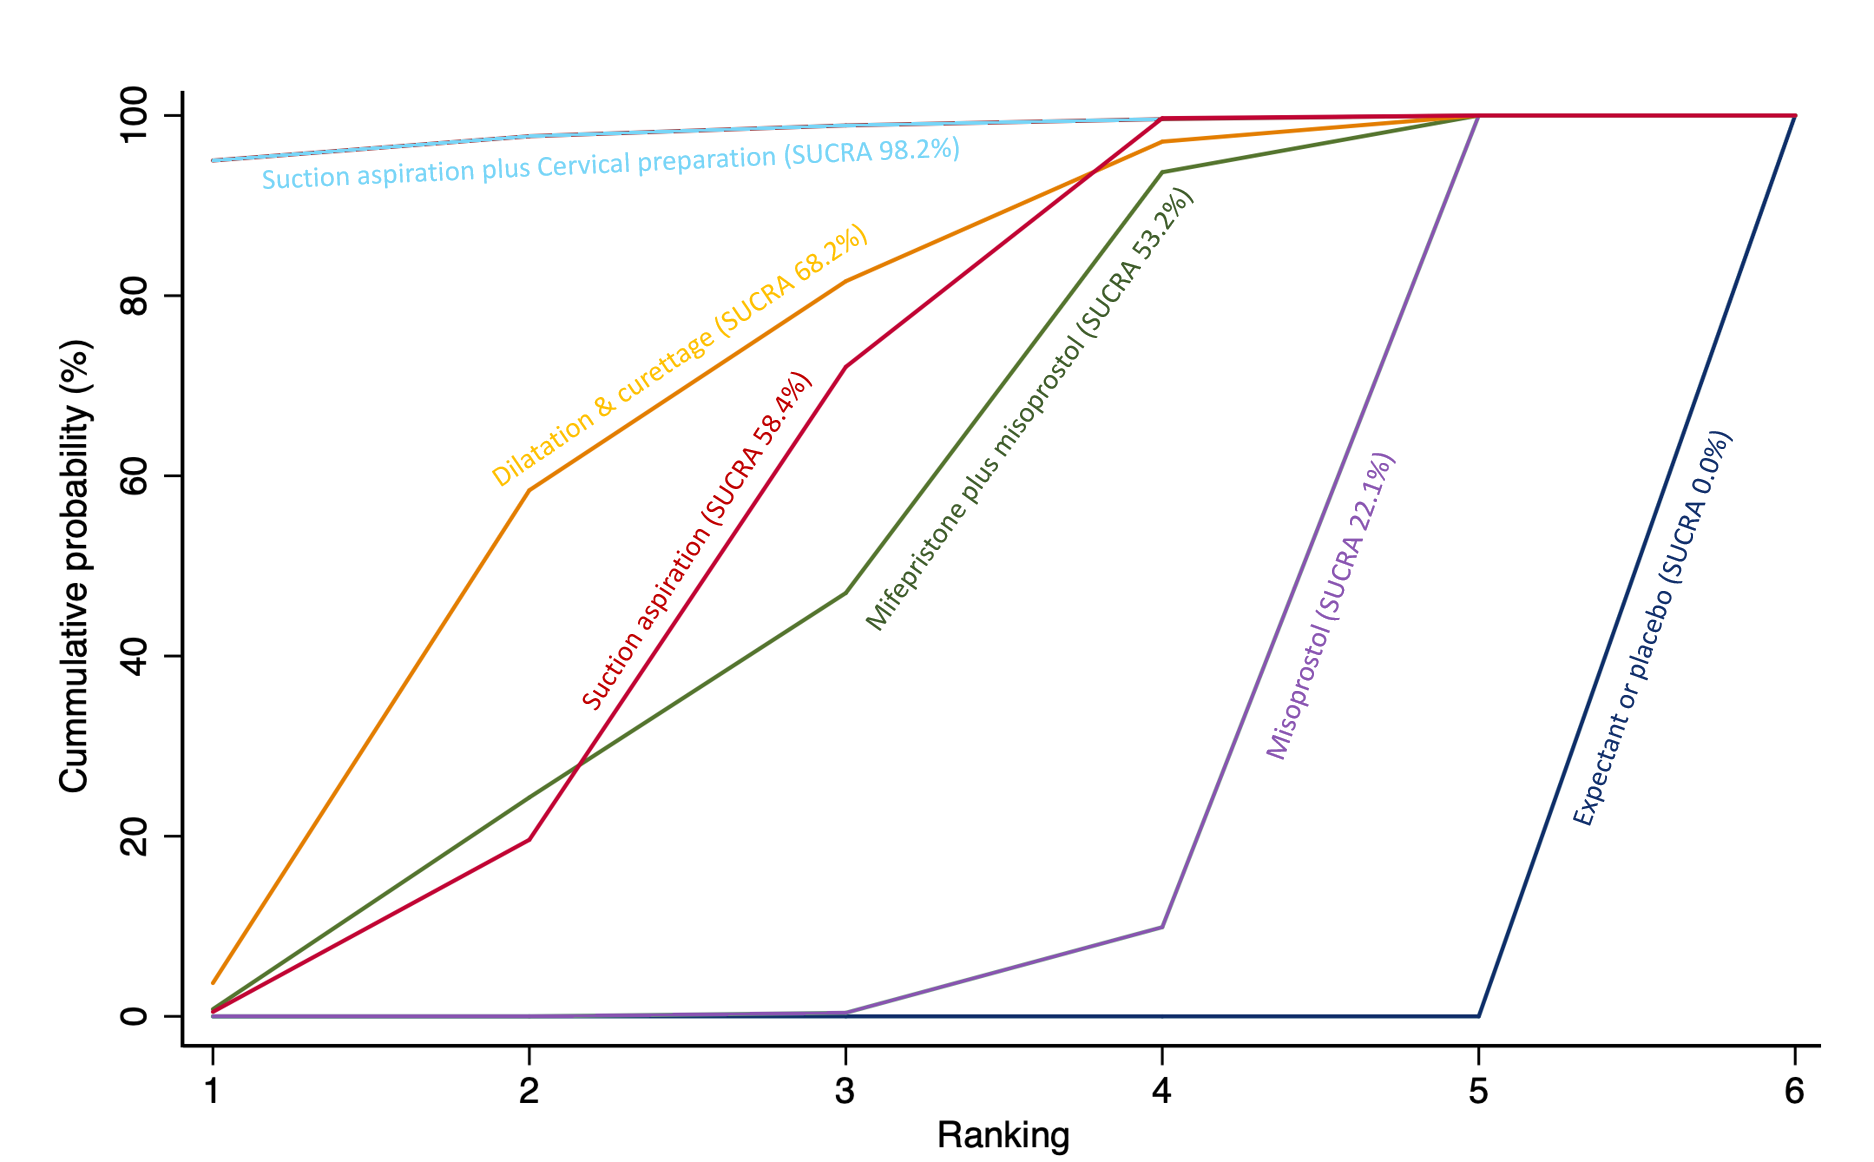
Cumulative rankogram comparing each of the methods of management of a miscarriage for the outcome of complete miscarriage. Ranking indicates the cumulative probability of being the best method, the second best, the third best, etc. The x axis shows the relative ranking and the y‐axis the cumulative probability of each ranking. We estimate the SUrface underneath this Cumulative RAnking line (SUCRA); the larger the SUCRA the higher its rank among all available methods.
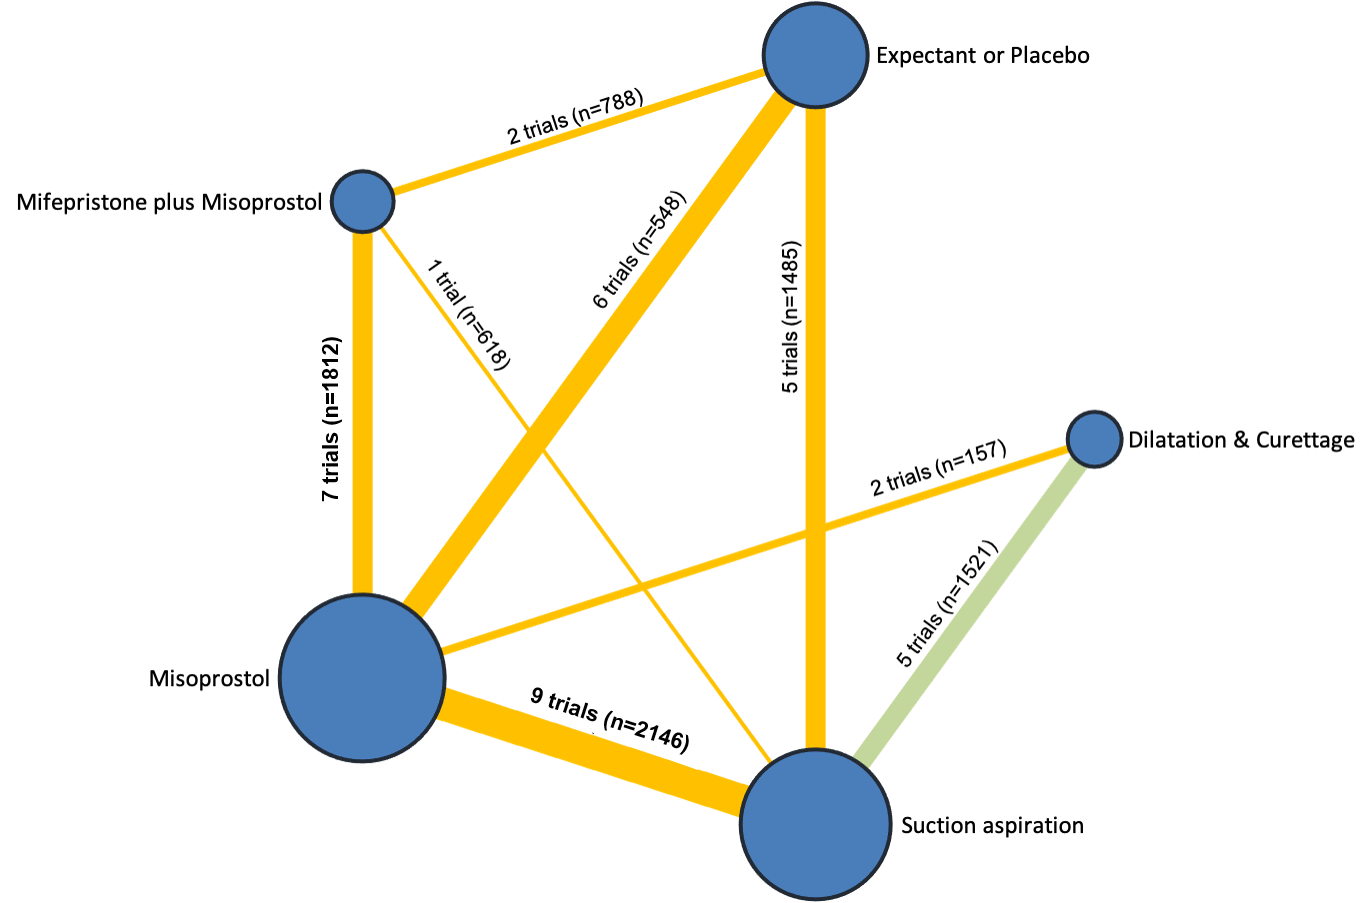
Network diagram for outcome of composite outcome of death or serious complication. The nodes represent an intervention and their size is proportional to the number of trials comparing this intervention to any other in the network. The lines connecting each pair of interventions represent a direct comparison and are drawn proportional to the number of trials making each direct comparison. Numbers on the lines represent the number of trials and participants for each comparison. The colour of the line is green for high‐certainty evidence; light green for moderate‐certainty evidence; orange for low‐certainty evidence and red for very low‐certainty evidence. Multi‐arm trials contribute to more than one comparison.

Forest plot with relative risk ratios and 95% CIs from pairwise, indirect and network (combining direct and indirect) analyses for outcome of composite outcome of death or serious complication.

Cumulative rankogram comparing each of the methods of management of a miscarriage for the outcome of composite outcome of death or serious complication. Ranking indicates the cumulative probability of being the best method, the second best, the third best, etc. The x axis shows the relative ranking and the y‐axis the cumulative probability of each ranking. We estimate the SUrface underneath this Cumulative RAnking line (SUCRA); the larger the SUCRA the higher its rank among all available methods.

Network diagram for outcome of need for unplanned/ emergency surgical procedure. The nodes represent an intervention and their size is proportional to the number of trials comparing this intervention to any other in the network. The lines connecting each pair of interventions represent a direct comparison and are drawn proportional to the number of trials making each direct comparison. Numbers on the lines represent the number of trials and participants for each comparison. The colour of the line is green for high‐certainty evidence; light green for moderate‐certainty evidence; orange for low‐certainty evidence and red for very low‐certainty evidence. Multi‐arm trials contribute to more than one comparison.

Forest plot with relative risk ratios and 95% CIs from pairwise, indirect and network (combining direct and indirect) analyses for outcome of need for unplanned/ emergency surgical procedure.
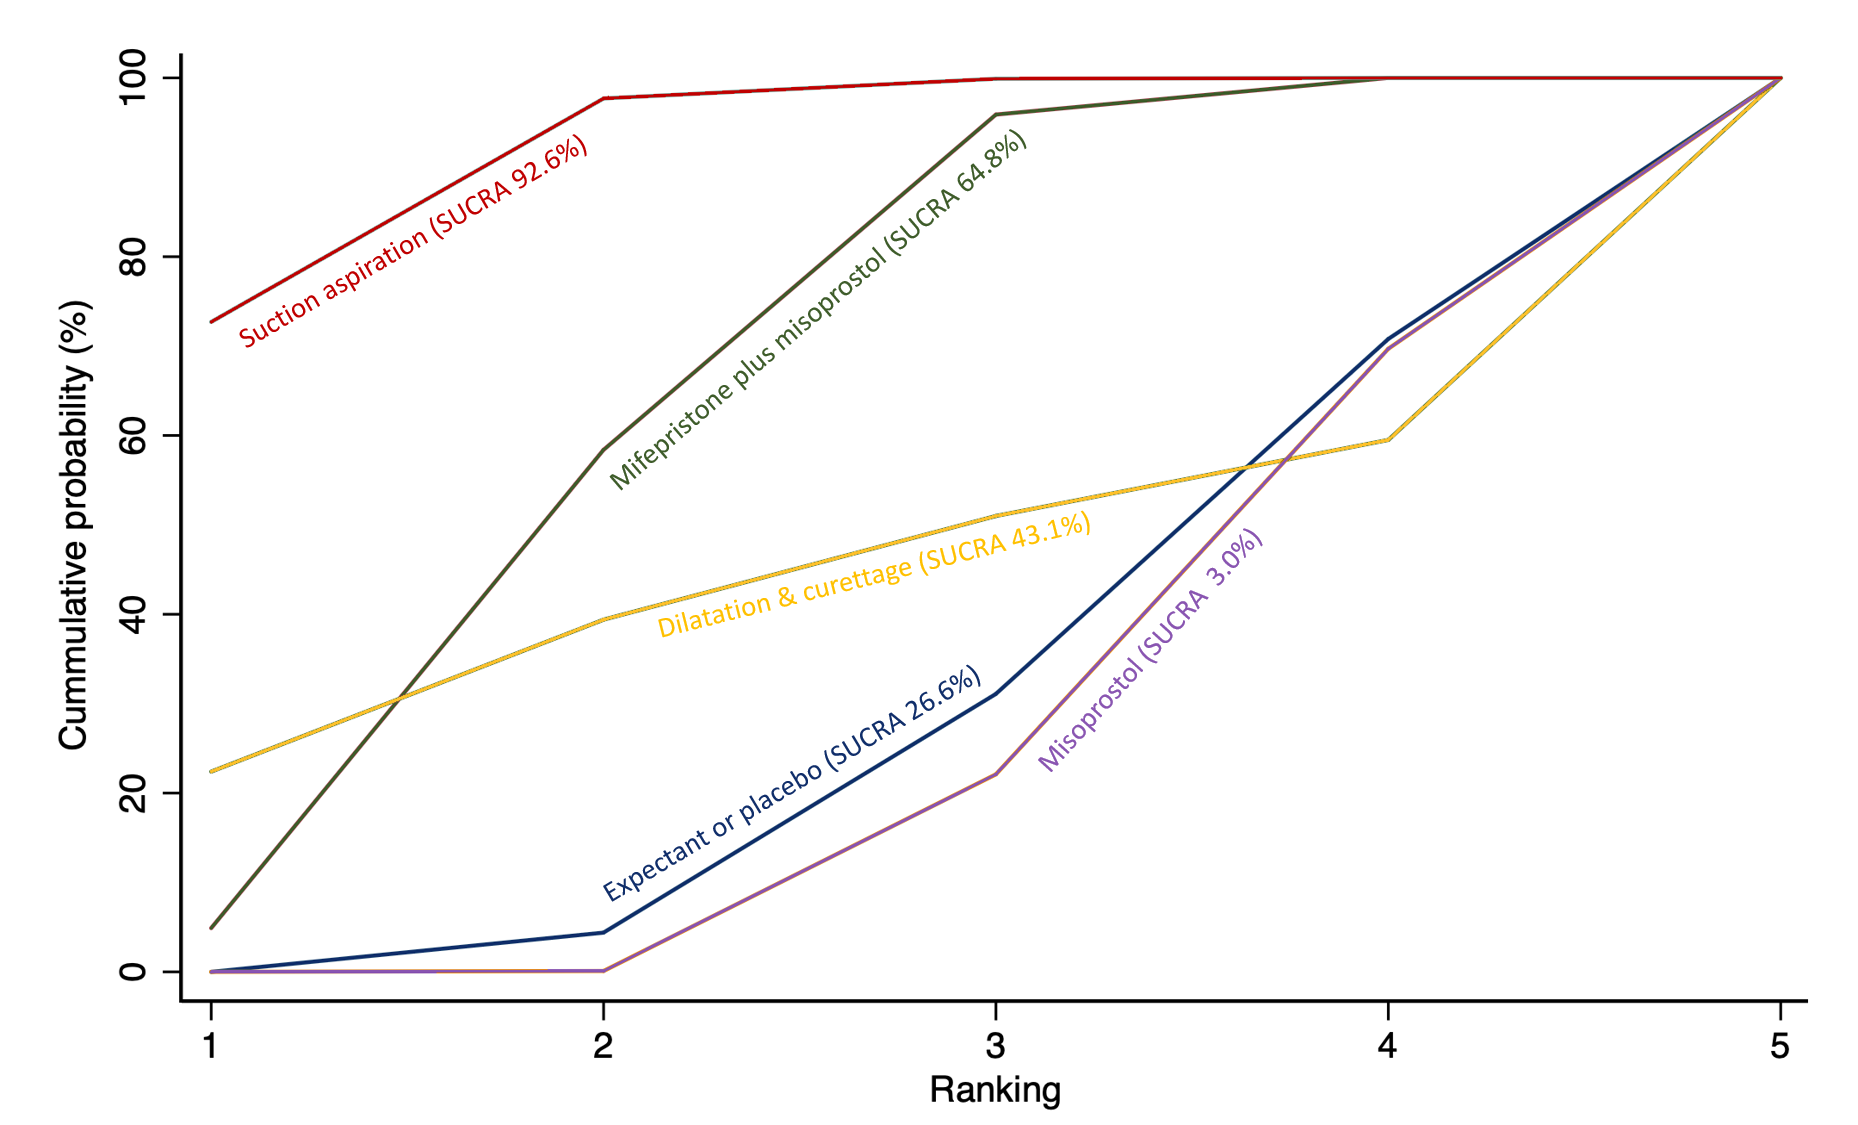
Cumulative rankogram comparing each of the methods of management of a miscarriage for the outcome of need for unplanned/ emergency surgical procedure. Ranking indicates the cumulative probability of being the best method, the second best, the third best, etc. The x axis shows the relative ranking and the y‐axis the cumulative probability of each ranking. We estimate the SUrface underneath this Cumulative RAnking line (SUCRA); the larger the SUCRA the higher its rank among all available methods.
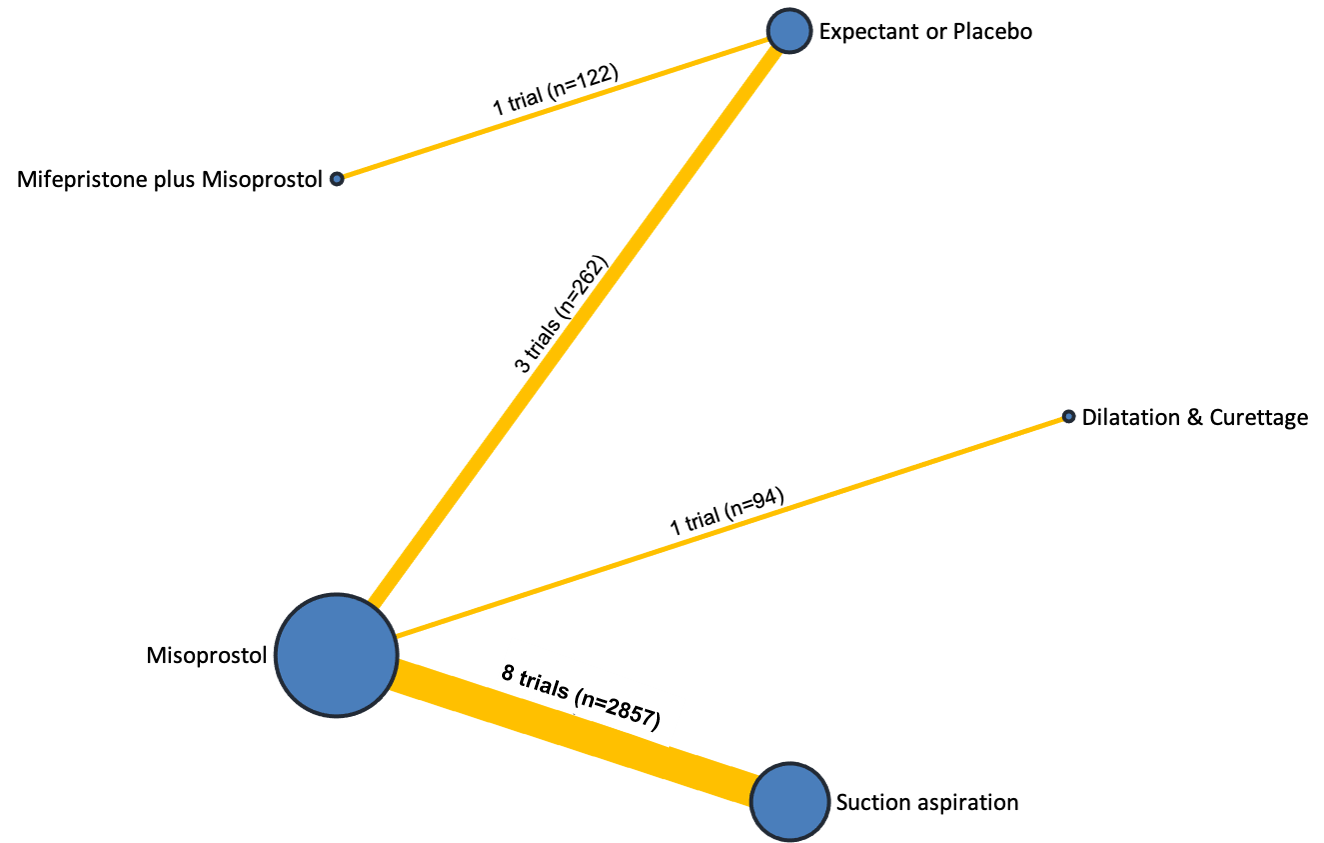
Network diagram for outcome of pain score (visual analogue scale). The nodes represent an intervention and their size is proportional to the number of trials comparing this intervention to any other in the network. The lines connecting each pair of interventions represent a direct comparison and are drawn proportional to the number of trials making each direct comparison. Numbers on the lines represent the number of trials and participants for each comparison. The colour of the line is green for high‐certainty evidence; light green for moderate‐certainty evidence; orange for low‐certainty evidence and red for very low‐certainty evidence. Multi‐arm trials contribute to more than one comparison.

Network diagram for outcome of pelvic inflammatory disease, sepsis or endometritis. The nodes represent an intervention and their size is proportional to the number of trials comparing this intervention to any other in the network. The lines connecting each pair of interventions represent a direct comparison and are drawn proportional to the number of trials making each direct comparison. Numbers on the lines represent the number of trials and participants for each comparison. The colour of the line is green for high‐certainty evidence; light green for moderate‐certainty evidence; orange for low‐certainty evidence and red for very low‐certainty evidence. Multi‐arm trials contribute to more than one comparison.

Forest plot with relative risk ratios and 95% CIs from pairwise, indirect and network (combining direct and indirect) analyses for outcome of pelvic inflammatory disease, sepsis or endometritis.
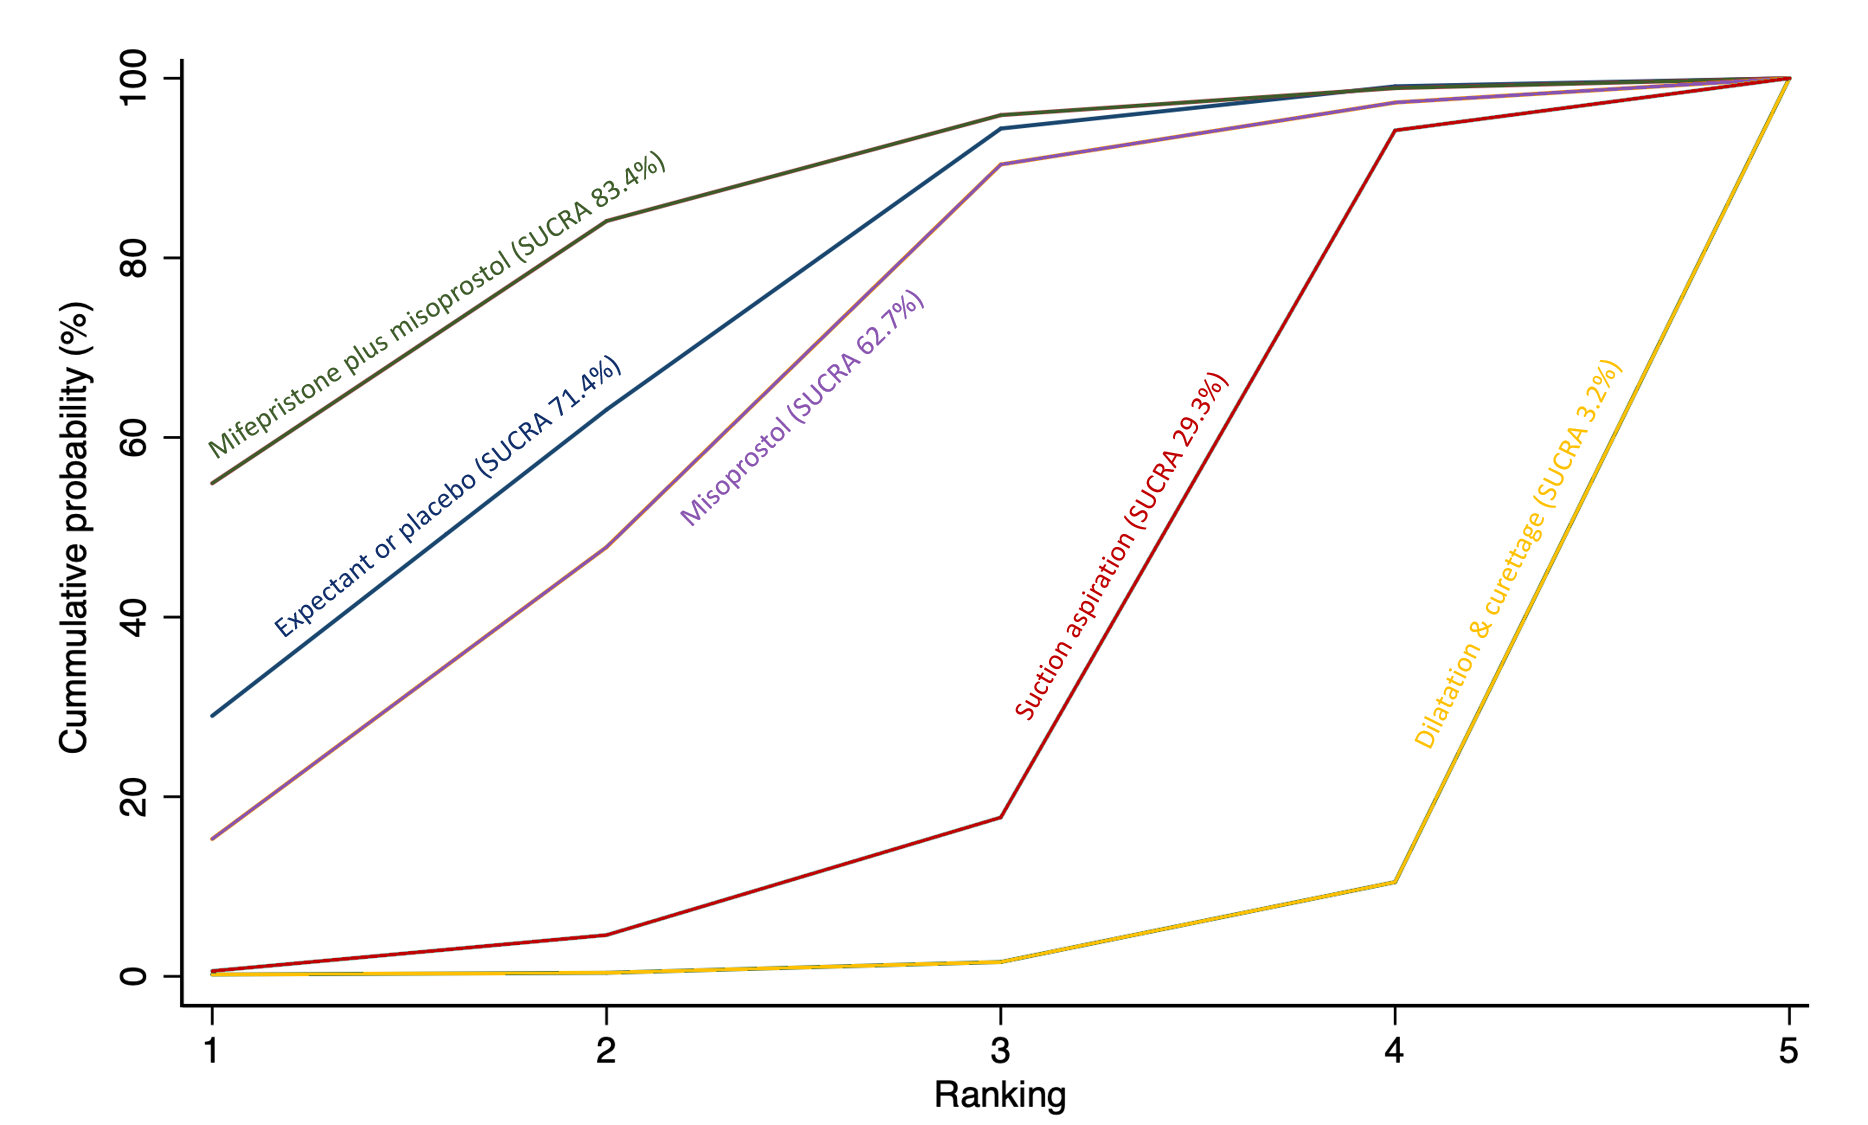
Cumulative rankogram comparing each of the methods of management of a miscarriage for the outcome of pelvic inflammatory disease, sepsis or endometritis. Ranking indicates the cumulative probability of being the best method, the second best, the third best, etc. The x axis shows the relative ranking and the y‐axis the cumulative probability of each ranking. We estimate the SUrface underneath this Cumulative RAnking line (SUCRA); the larger the SUCRA the higher its rank among all available methods.
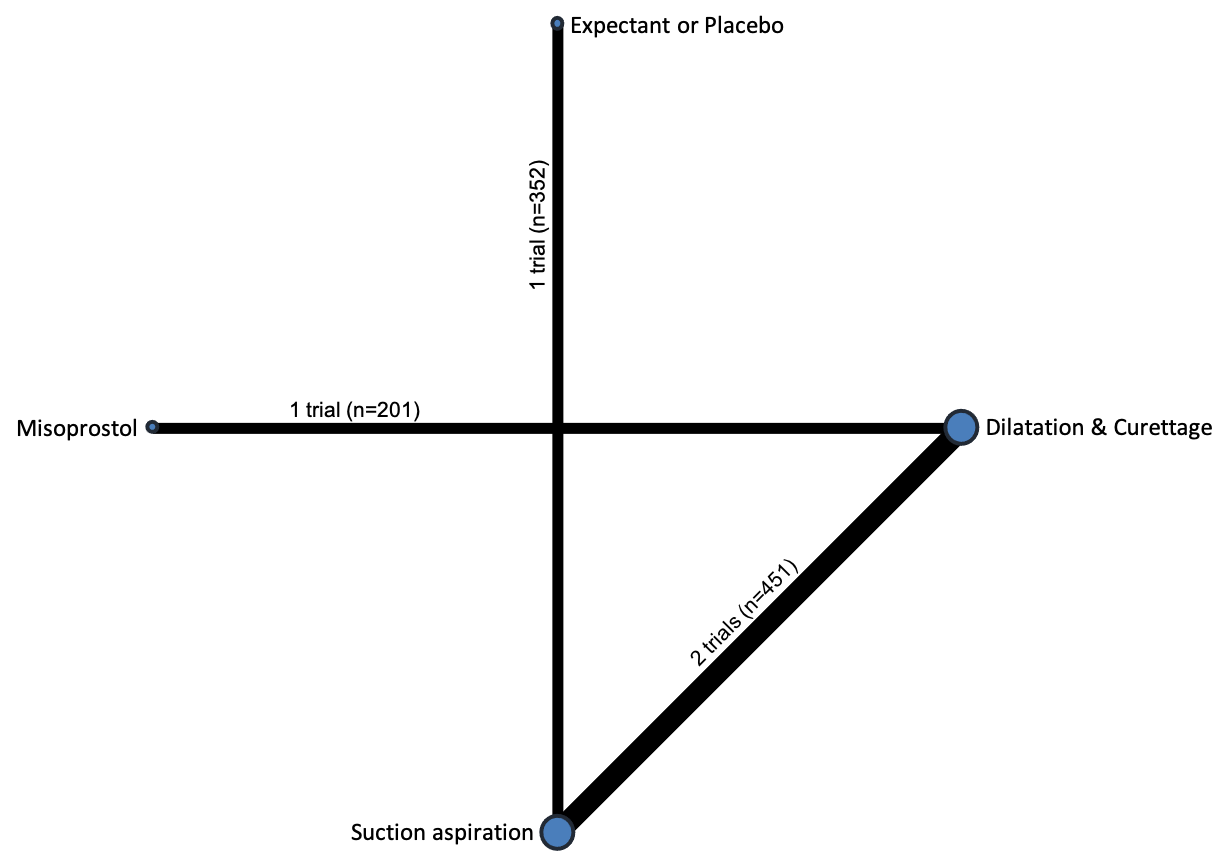
Network diagram for outcome of mean volumes of blood loss (millilitres). The nodes represent an intervention and their size is proportional to the number of trials comparing this intervention to any other in the network. The lines connecting each pair of interventions represent a direct comparison and are drawn proportional to the number of trials making each direct comparison. Numbers on the lines represent the number of trials and participants for each comparison. Multi‐arm trials contribute to more than one comparison.
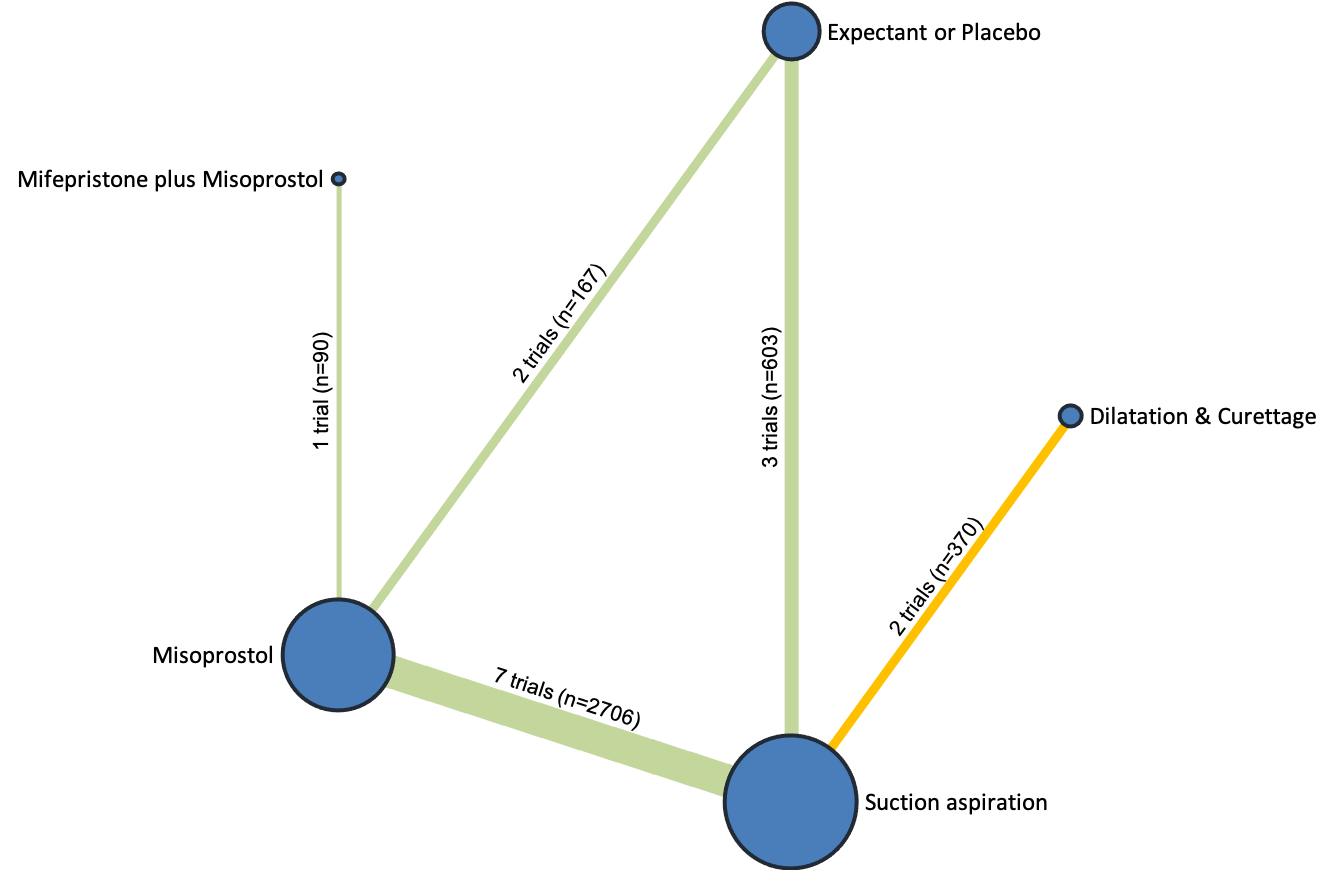
Network diagram for outcome of change in haemoglobin measurements before and after the miscarriage. The nodes represent an intervention and their size is proportional to the number of trials comparing this intervention to any other in the network. The lines connecting each pair of interventions represent a direct comparison and are drawn proportional to the number of trials making each direct comparison. Numbers on the lines represent the number of trials and participants for each comparison. The colour of the line is green for high‐certainty evidence; light green for moderate‐certainty evidence; orange for low‐certainty evidence and red for very low‐certainty evidence. Multi‐arm trials contribute to more than one comparison.

Forest plot with relative risk ratios and 95% CIs from pairwise, indirect and network (combining direct and indirect) analyses for outcome of change in haemoglobin measurements before and after the miscarriage.

Cumulative rankogram comparing each of the methods of management of a miscarriage for the outcome of change in haemoglobin measurements before and after the miscarriage. Ranking indicates the cumulative probability of being the best method, the second best, the third best, etc. The x axis shows the relative ranking and the y‐axis the cumulative probability of each ranking. We estimate the SUrface underneath this Cumulative RAnking line (SUCRA); the larger the SUCRA the higher its rank among all available methods.
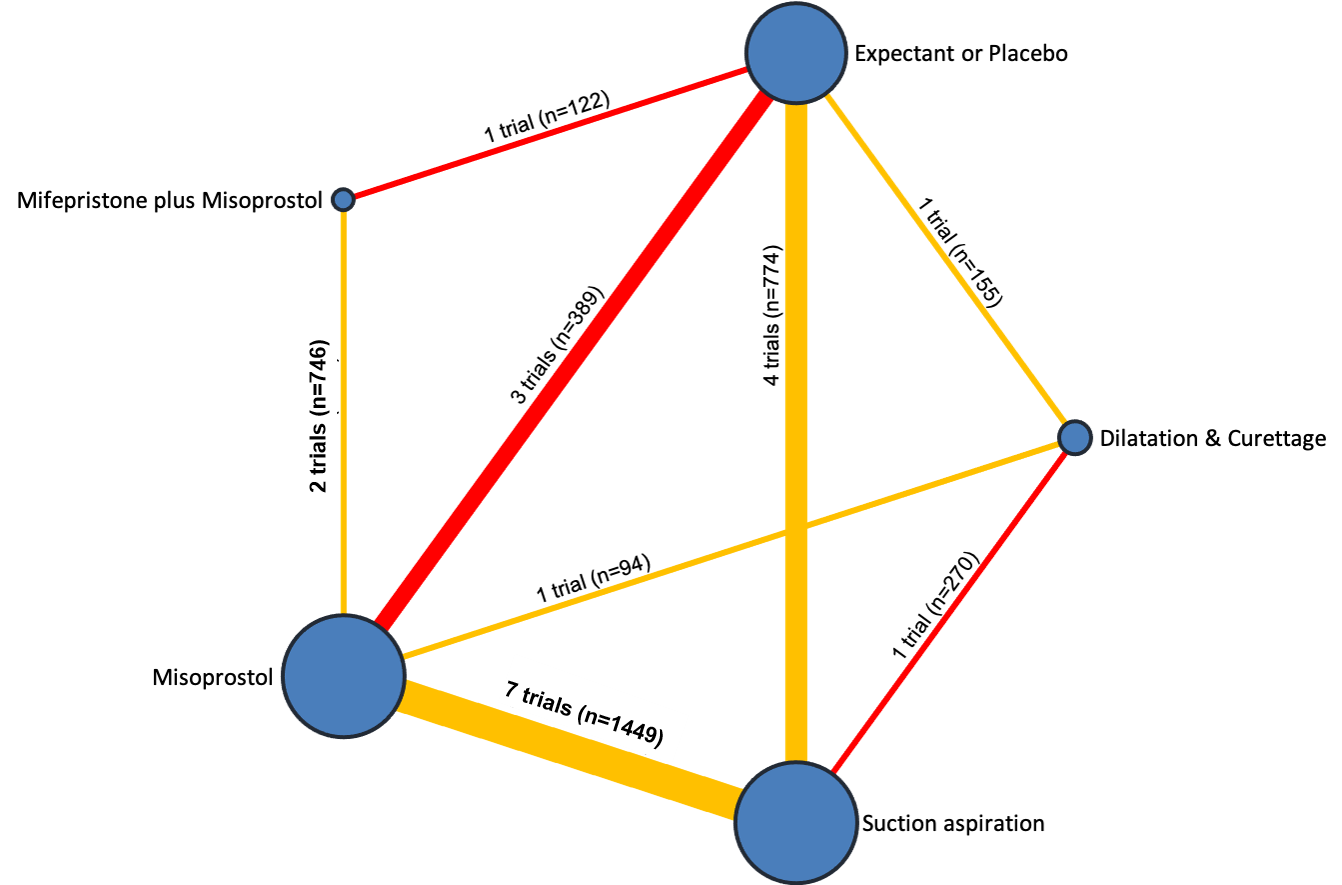
Network diagram for outcome of days of bleeding. The nodes represent an intervention and their size is proportional to the number of trials comparing this intervention to any other in the network. The lines connecting each pair of interventions represent a direct comparison and are drawn proportional to the number of trials making each direct comparison. Numbers on the lines represent the number of trials and participants for each comparison. The colour of the line is green for high‐certainty evidence; light green for moderate‐certainty evidence; orange for low‐certainty evidence and red for very low‐certainty evidence. Multi‐arm trials contribute to more than one comparison.

Forest plot with relative risk ratios and 95% CIs from pairwise, indirect and network (combining direct and indirect) analyses for outcome of days of bleeding.

Cumulative rankogram comparing each of the methods of management of a miscarriage for the outcome of days of bleeding. Ranking indicates the cumulative probability of being the best method, the second best, the third best, etc. The x axis shows the relative ranking and the y‐axis the cumulative probability of each ranking. We estimate the SUrface underneath this Cumulative RAnking line (SUCRA); the larger the SUCRA the higher its rank among all available methods.

Network diagram for outcome of mean duration of hospital stay (days). The nodes represent an intervention and their size is proportional to the number of trials comparing this intervention to any other in the network. The lines connecting each pair of interventions represent a direct comparison and are drawn proportional to the number of trials making each direct comparison. Numbers on the lines represent the number of trials and participants for each comparison. Multi‐arm trials contribute to more than one comparison.
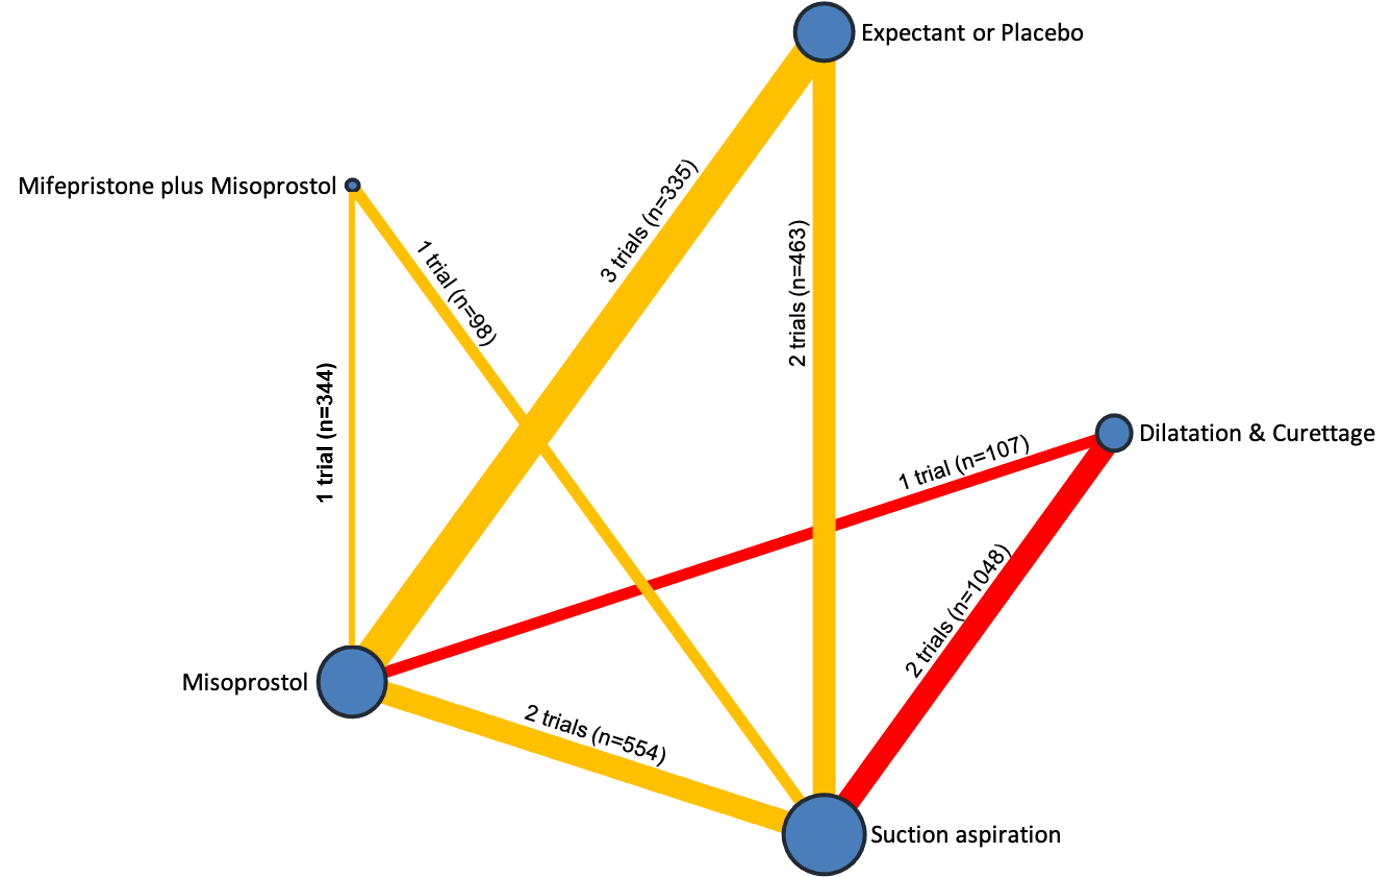
Network diagram for outcome of readmission to hospital. The nodes represent an intervention and their size is proportional to the number of trials comparing this intervention to any other in the network. The lines connecting each pair of interventions represent a direct comparison and are drawn proportional to the number of trials making each direct comparison. Numbers on the lines represent the number of trials and participants for each comparison. The colour of the line is green for high‐certainty evidence; light green for moderate‐certainty evidence; orange for low‐certainty evidence and red for very low‐certainty evidence. Multi‐arm trials contribute to more than one comparison.

Forest plot with relative risk ratios and 95% CIs from pairwise, indirect and network (combining direct and indirect) analyses for outcome of readmission to hospital.

Cumulative rankogram comparing each of the methods of management of a miscarriage for the outcome of readmission to hospital. Ranking indicates the cumulative probability of being the best method, the second best, the third best, etc. The x axis shows the relative ranking and the y‐axis the cumulative probability of each ranking. We estimate the SUrface underneath this Cumulative RAnking line (SUCRA); the larger the SUCRA the higher its rank among all available methods.
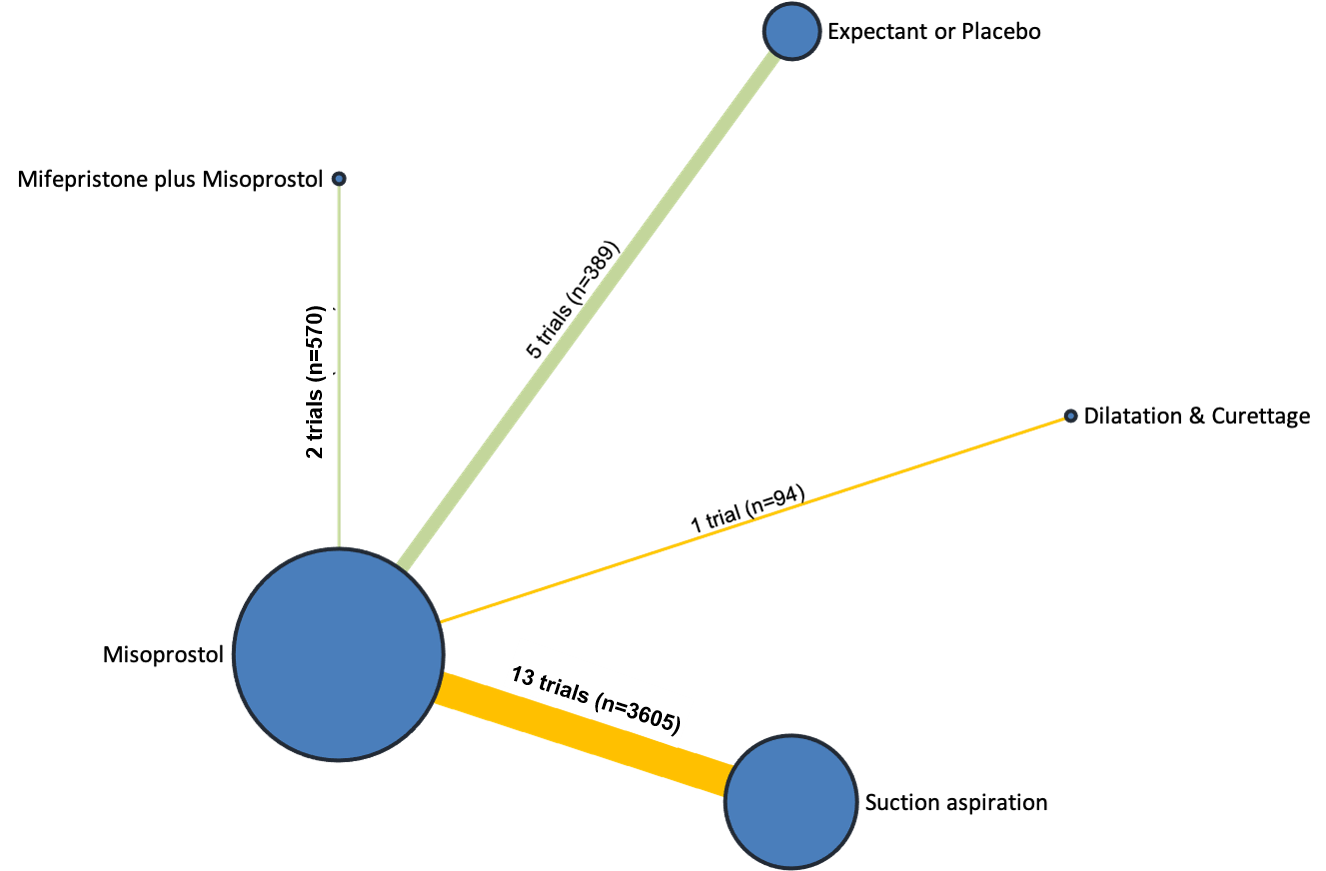
Network diagram for outcome of nausea. The nodes represent an intervention and their size is proportional to the number of trials comparing this intervention to any other in the network. The lines connecting each pair of interventions represent a direct comparison and are drawn proportional to the number of trials making each direct comparison. Numbers on the lines represent the number of trials and participants for each comparison. The colour of the line is green for high‐certainty evidence; light green for moderate‐certainty evidence; orange for low‐certainty evidence and red for very low‐certainty evidence. Multi‐arm trials contribute to more than one comparison.
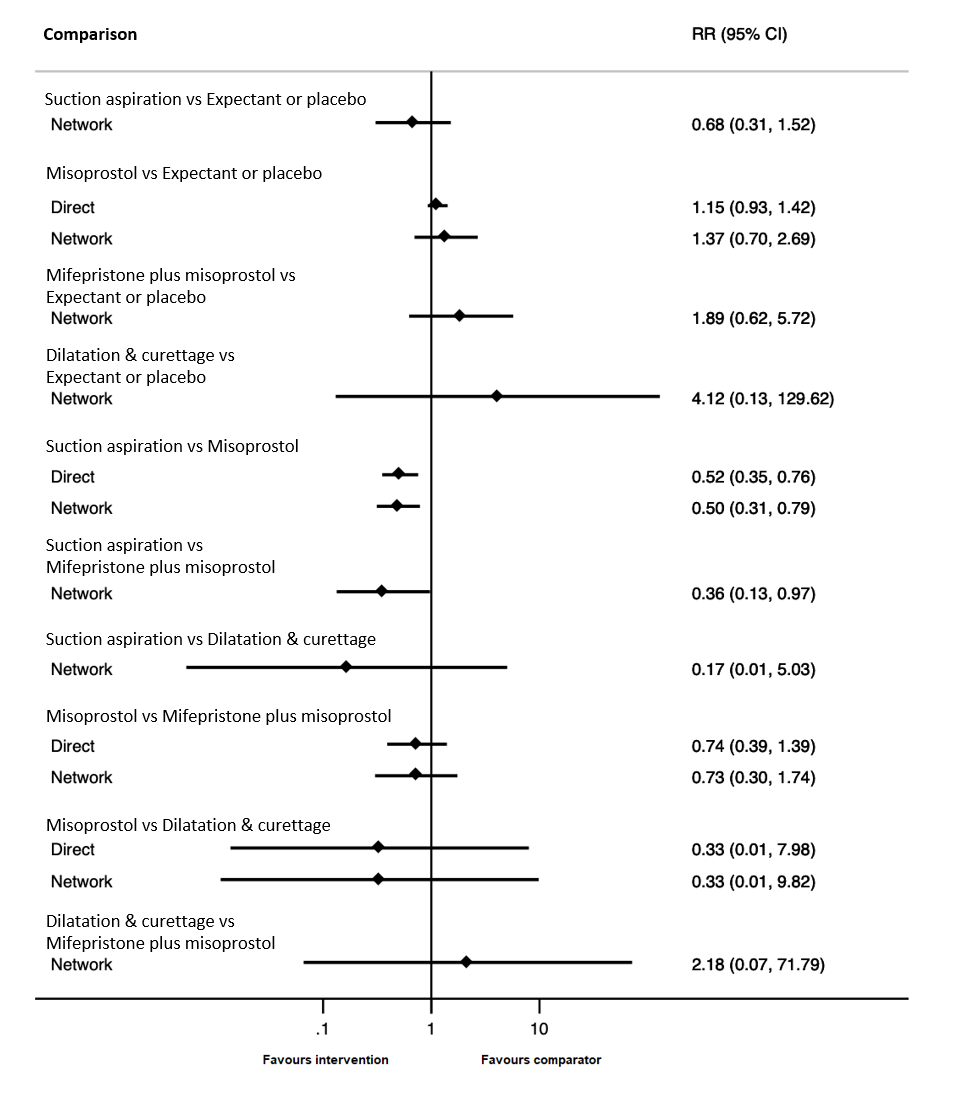
Forest plot with relative risk ratios and 95% CIs from pairwise, indirect and network (combining direct and indirect) analyses for outcome of nausea.

Cumulative rankogram comparing each of the methods of management of a miscarriage for the outcome of nausea. Ranking indicates the cumulative probability of being the best method, the second best, the third best, etc. The x axis shows the relative ranking and the y‐axis the cumulative probability of each ranking. We estimate the SUrface underneath this Cumulative RAnking line (SUCRA); the larger the SUCRA the higher its rank among all available methods.

Network diagram for outcome of vomiting. The nodes represent an intervention and their size is proportional to the number of trials comparing this intervention to any other in the network. The lines connecting each pair of interventions represent a direct comparison and are drawn proportional to the number of trials making each direct comparison. Numbers on the lines represent the number of trials and participants for each comparison. The colour of the line is green for high‐certainty evidence; light green for moderate‐certainty evidence; orange for low‐certainty evidence and red for very low‐certainty evidence. Multi‐arm trials contribute to more than one comparison.

Forest plot with relative risk ratios and 95% CIs from pairwise, indirect and network (combining direct and indirect) analyses for outcome of vomiting.

Cumulative rankogram comparing each of the methods of management of a miscarriage for the outcome of vomiting. Ranking indicates the cumulative probability of being the best method, the second best, the third best, etc. The x axis shows the relative ranking and the y‐axis the cumulative probability of each ranking. We estimate the SUrface underneath this Cumulative RAnking line (SUCRA); the larger the SUCRA the higher its rank among all available methods.

Network diagram for outcome of diarrhoea. The nodes represent an intervention and their size is proportional to the number of trials comparing this intervention to any other in the network. The lines connecting each pair of interventions represent a direct comparison and are drawn proportional to the number of trials making each direct comparison. Numbers on the lines represent the number of trials and participants for each comparison. The colour of the line is green for high‐certainty evidence; light green for moderate‐certainty evidence; orange for low‐certainty evidence and red for very low‐certainty evidence. Multi‐arm trials contribute to more than one comparison.

Forest plot with relative risk ratios and 95% CIs from pairwise, indirect and network (combining direct and indirect) analyses for outcome of diarrhoea.

Cumulative rankogram comparing each of the methods of management of a miscarriage for the outcome of diarrhoea. Ranking indicates the cumulative probability of being the best method, the second best, the third best, etc. The x axis shows the relative ranking and the y‐axis the cumulative probability of each ranking. We estimate the SUrface underneath this Cumulative RAnking line (SUCRA); the larger the SUCRA the higher its rank among all available methods.

Network diagram for outcome of pyrexia. The nodes represent an intervention and their size is proportional to the number of trials comparing this intervention to any other in the network. The lines connecting each pair of interventions represent a direct comparison and are drawn proportional to the number of trials making each direct comparison. Numbers on the lines represent the number of trials and participants for each comparison. The colour of the line is green for high‐certainty evidence; light green for moderate‐certainty evidence; orange for low‐certainty evidence and red for very low‐certainty evidence. Multi‐arm trials contribute to more than one comparison.
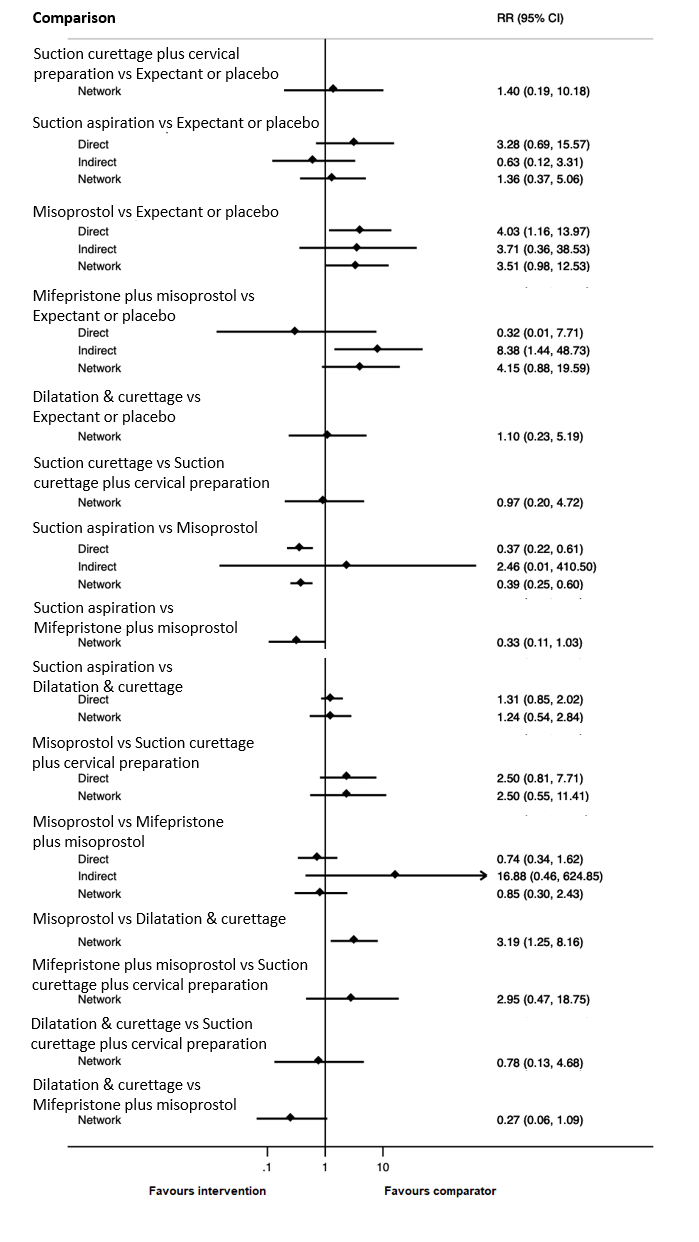
Forest plot with relative risk ratios and 95% CIs from pairwise, indirect and network (combining direct and indirect) analyses for outcome of pyrexia.

Cumulative rankogram comparing each of the methods of management of a miscarriage for the outcome of pyrexia. Ranking indicates the cumulative probability of being the best method, the second best, the third best, etc. The x axis shows the relative ranking and the y‐axis the cumulative probability of each ranking. We estimate the SUrface underneath this Cumulative RAnking line (SUCRA); the larger the SUCRA the higher its rank among all available methods.

Network diagram for missed miscarriage subgroup analysis of outcome of complete miscarriage. The nodes represent an intervention and their size is proportional to the number of trials comparing this intervention to any other in the network. The lines connecting each pair of interventions represent a direct comparison and are drawn proportional to the number of trials making each direct comparison. Numbers on the lines represent the number of trials and participants for each comparison. The colour of the line is green for high‐certainty evidence; light green for moderate‐certainty evidence; orange for low‐certainty evidence and red for very low‐certainty evidence. Multi‐arm trials contribute to more than one comparison.

Forest plot with relative risk ratios and 95% CIs from pairwise, indirect and network (combining direct and indirect) analyses for missed miscarriage subgroup of complete miscarriage outcome.

Cumulative rankogram comparing each of the methods of management of a miscarriage for missed miscarriage subgroup analysis for the outcome of complete miscarriage. Ranking indicates the cumulative probability of being the best method, the second best, the third best, etc. The x axis shows the relative ranking and the y‐axis the cumulative probability of each ranking. We estimate the SUrface underneath this Cumulative RAnking line (SUCRA); the larger the SUCRA the higher its rank among all available methods.
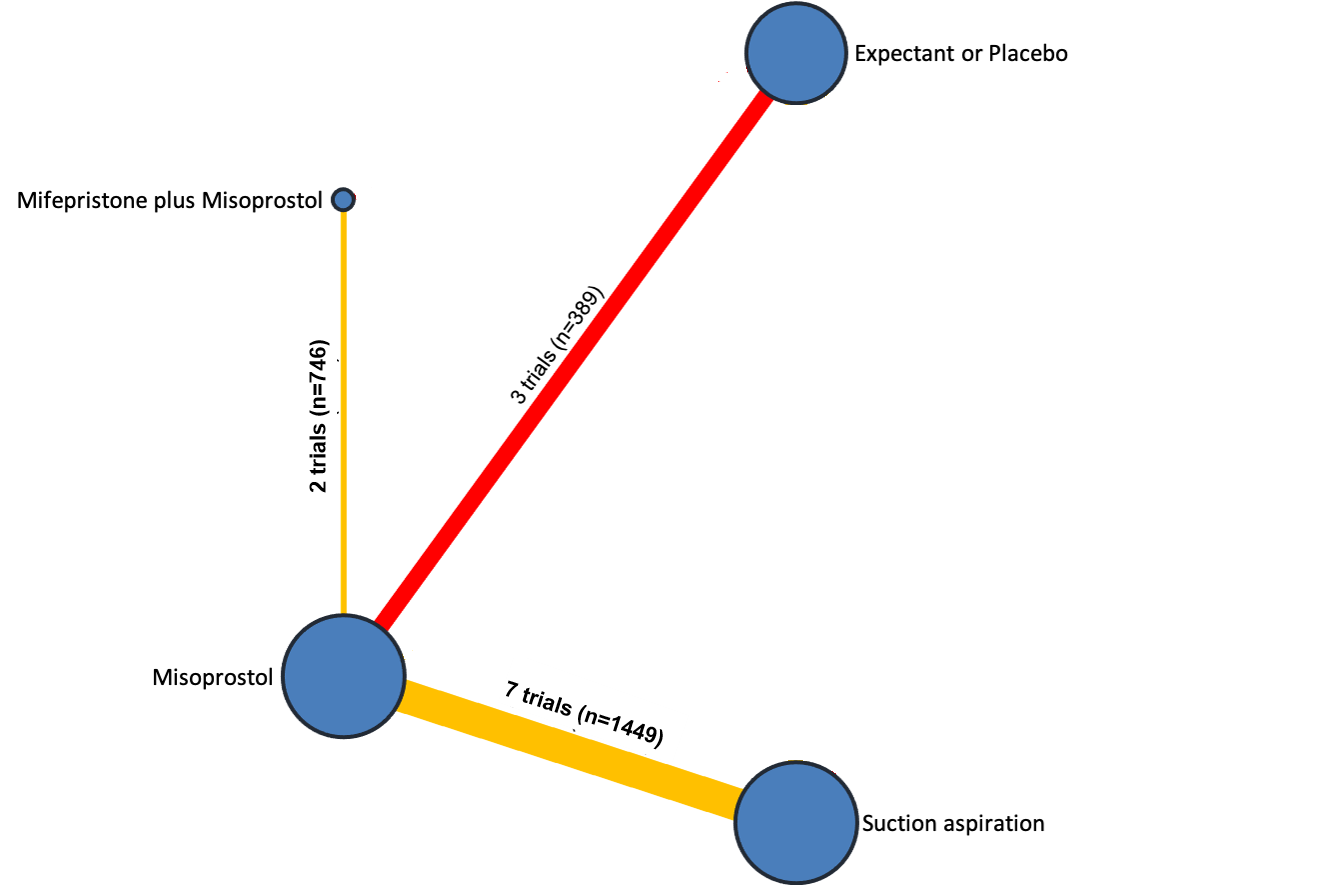
Network diagram for missed miscarriage subgroup analysis of outcome of days of bleeding. The nodes represent an intervention and their size is proportional to the number of trials comparing this intervention to any other in the network. The lines connecting each pair of interventions represent a direct comparison and are drawn proportional to the number of trials making each direct comparison. Numbers on the lines represent the number of trials and participants for each comparison. The colour of the line is green for high‐certainty evidence; light green for moderate‐certainty evidence; orange for low‐certainty evidence and red for very low‐certainty evidence. Multi‐arm trials contribute to more than one comparison.

Forest plot with relative risk ratios and 95% CIs from pairwise, indirect and network (combining direct and indirect) analyses for missed miscarriage subgroup of the days of bleeding outcome.
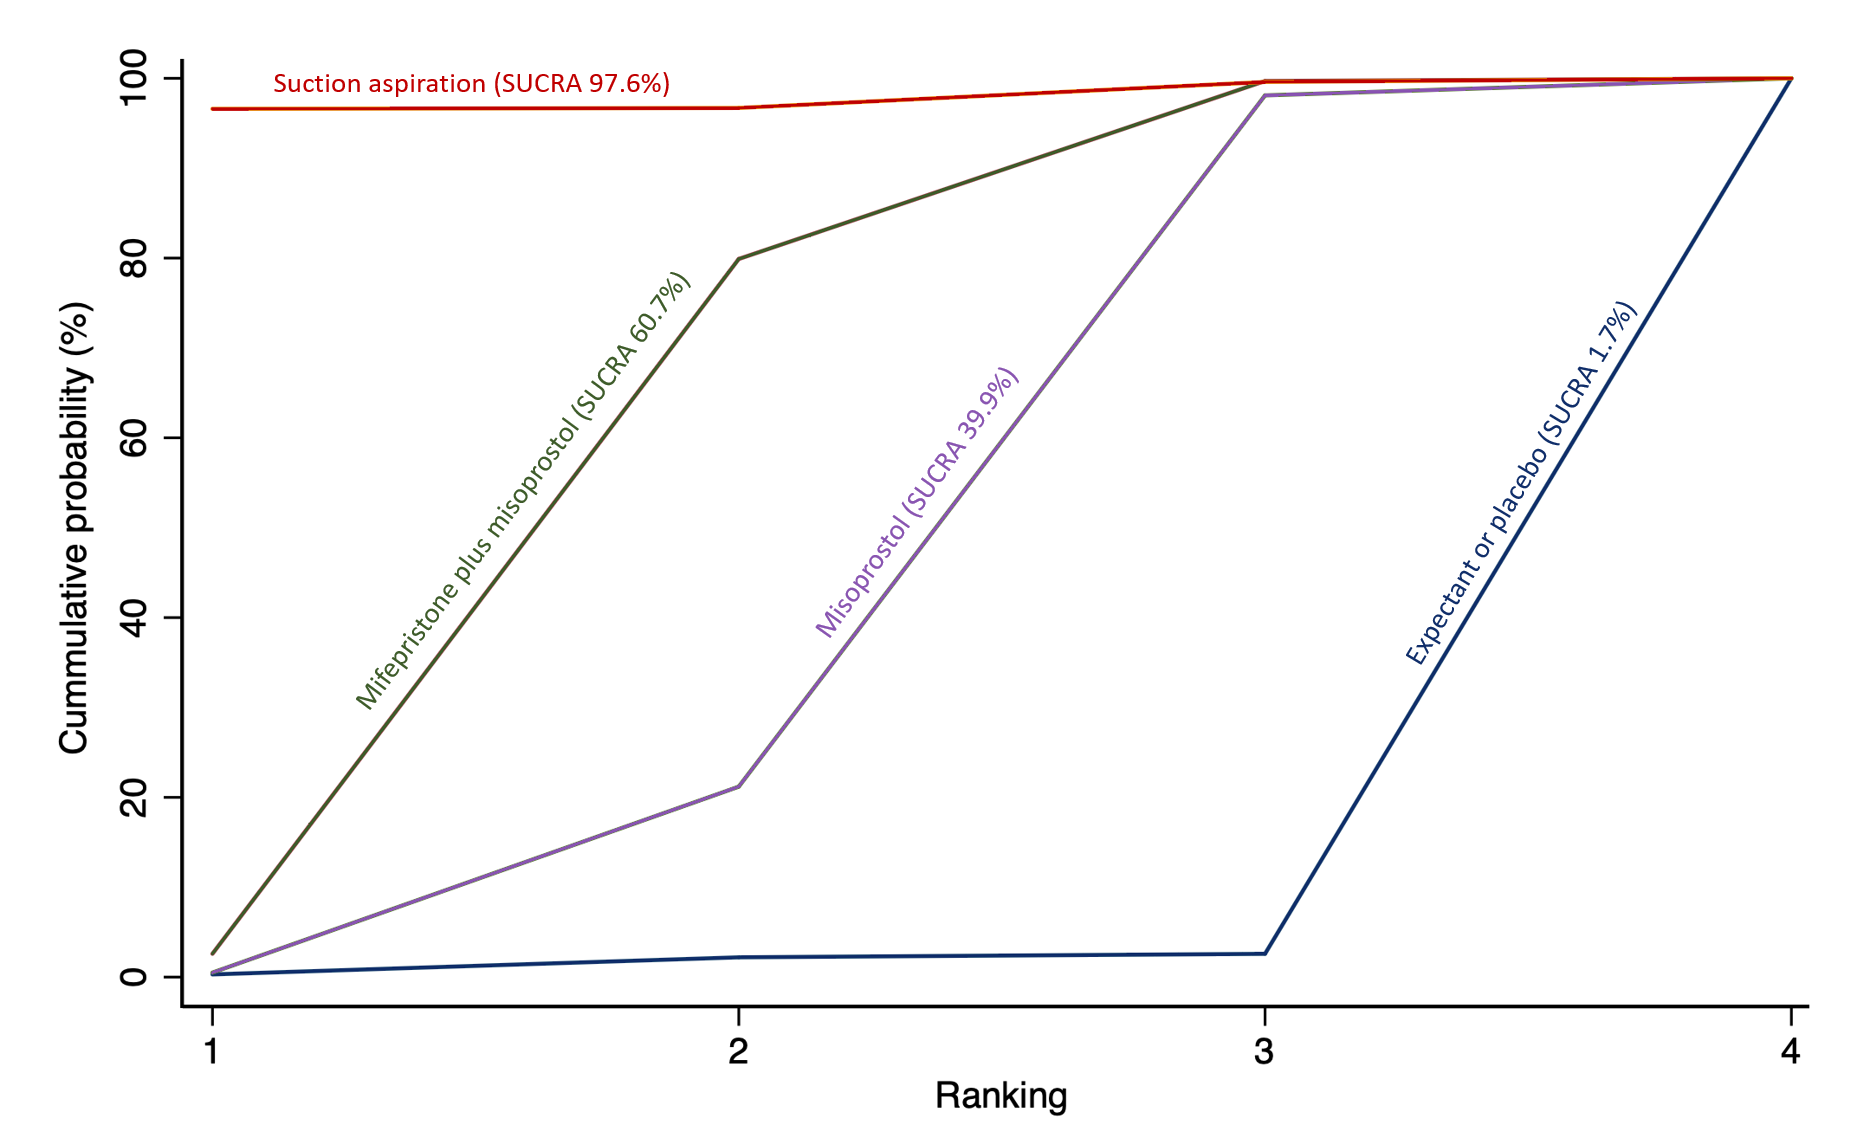
Cumulative rankogram comparing each of the methods of management of a miscarriage for missed miscarriage subgroup analysis for the outcome of days of bleeding. Ranking indicates the cumulative probability of being the best method, the second best, the third best, etc. The x axis shows the relative ranking and the y‐axis the cumulative probability of each ranking. We estimate the SUrface underneath this Cumulative RAnking line (SUCRA); the larger the SUCRA the higher its rank among all available methods.

Network diagram for incomplete miscarriage subgroup analysis of outcome of complete miscarriage. The nodes represent an intervention and their size is proportional to the number of trials comparing this intervention to any other in the network. The lines connecting each pair of interventions represent a direct comparison and are drawn proportional to the number of trials making each direct comparison. Numbers on the lines represent the number of trials and participants for each comparison. The colour of the line is green for high‐certainty evidence; light green for moderate‐certainty evidence; orange for low‐certainty evidence and red for very low‐certainty evidence. Multi‐arm trials contribute to more than one comparison.

Forest plot with relative risk ratios and 95% CIs from pairwise, indirect and network (combining direct and indirect) analyses for incomplete miscarriage subgroup of complete miscarriage outcome.
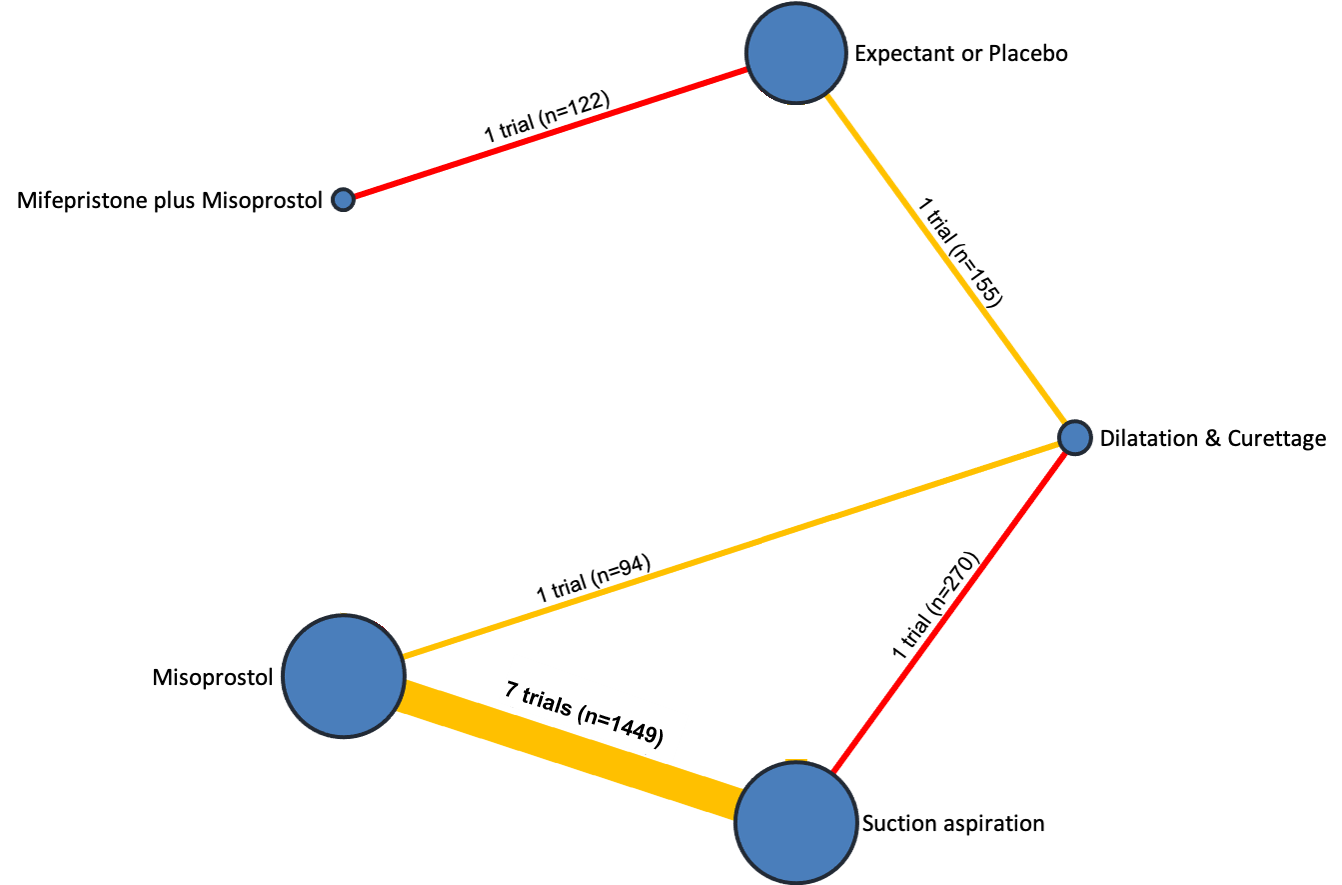
Network diagram for incomplete miscarriage subgroup analysis of outcome of days of bleeding. The nodes represent an intervention and their size is proportional to the number of trials comparing this intervention to any other in the network. The lines connecting each pair of interventions represent a direct comparison and are drawn proportional to the number of trials making each direct comparison. Numbers on the lines represent the number of trials and participants for each comparison. The colour of the line is green for high‐certainty evidence; light green for moderate‐certainty evidence; orange for low‐certainty evidence and red for very low‐certainty evidence. Multi‐arm trials contribute to more than one comparison.
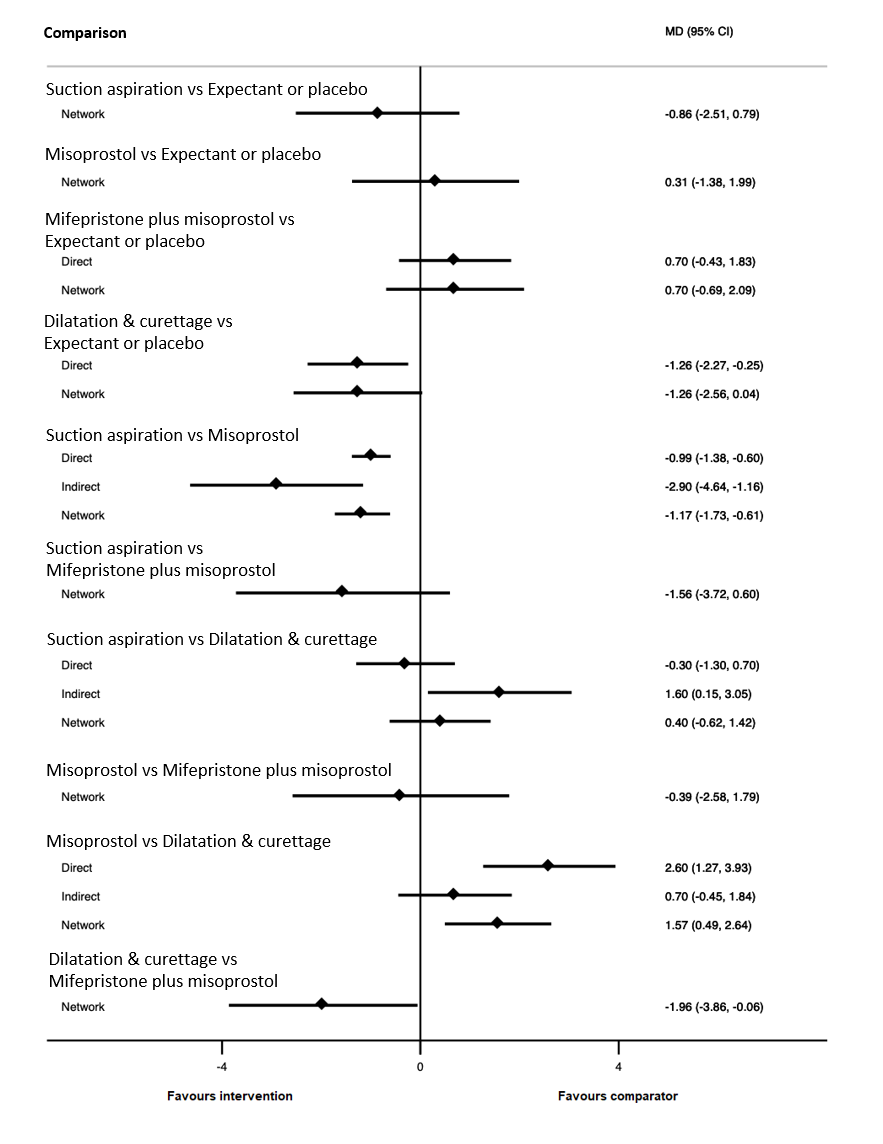
Forest plot with relative risk ratios and 95% CIs from pairwise, indirect and network (combining direct and indirect) analyses for incomplete miscarriage subgroup of the days of bleeding outcome.

Cumulative rankogram comparing each of the methods of management of a miscarriage for incomplete miscarriage subgroup analysis for the outcome of days of bleeding. Ranking indicates the cumulative probability of being the best method, the second best, the third best, etc. The x axis shows the relative ranking and the y‐axis the cumulative probability of each ranking. We estimate the SUrface underneath this Cumulative RAnking line (SUCRA); the larger the SUCRA the higher its rank among all available methods.

Comparison 1: Suction aspiration vs Misoprostol, Outcome 1: Complete Miscarriage

Comparison 1: Suction aspiration vs Misoprostol, Outcome 2: Composite outcome of death or serious complication

Comparison 1: Suction aspiration vs Misoprostol, Outcome 3: Need for unplanned/emergency surgical procedure

Comparison 1: Suction aspiration vs Misoprostol, Outcome 4: Pain score

Comparison 1: Suction aspiration vs Misoprostol, Outcome 5: Pelvic inflammatory disease, sepsis or endometritis

Comparison 1: Suction aspiration vs Misoprostol, Outcome 6: Change in haemoglobin measurements before and after the miscarriage

Comparison 1: Suction aspiration vs Misoprostol, Outcome 7: Days of bleeding

Comparison 1: Suction aspiration vs Misoprostol, Outcome 8: Cervical tear

Comparison 1: Suction aspiration vs Misoprostol, Outcome 9: Mean duration of hospital stay (days)

Comparison 1: Suction aspiration vs Misoprostol, Outcome 10: Re‐admission to hospital

Comparison 1: Suction aspiration vs Misoprostol, Outcome 11: Nausea

Comparison 1: Suction aspiration vs Misoprostol, Outcome 12: Vomiting

Comparison 1: Suction aspiration vs Misoprostol, Outcome 13: Diarrhoea

Comparison 1: Suction aspiration vs Misoprostol, Outcome 14: Pyrexia

Comparison 1: Suction aspiration vs Misoprostol, Outcome 15: Anxiety score

Comparison 1: Suction aspiration vs Misoprostol, Outcome 16: Depression score

Comparison 2: Suction aspiration vs Mifepristone + Misoprostol, Outcome 1: Complete Miscarriage

Comparison 2: Suction aspiration vs Mifepristone + Misoprostol, Outcome 2: Composite outcome of death or serious complication

Comparison 2: Suction aspiration vs Mifepristone + Misoprostol, Outcome 3: Need for unplanned/emergency surgical procedure

Comparison 2: Suction aspiration vs Mifepristone + Misoprostol, Outcome 4: Pelvic inflammatory disease, sepsis or endometritis

Comparison 2: Suction aspiration vs Mifepristone + Misoprostol, Outcome 5: Re‐admission to hospital

Comparison 3: Suction aspiration vs Dilatation & Curettage, Outcome 1: Complete Miscarriage

Comparison 3: Suction aspiration vs Dilatation & Curettage, Outcome 2: Composite outcome of death or serious complication

Comparison 3: Suction aspiration vs Dilatation & Curettage, Outcome 3: Need for unplanned/emergency surgical procedure

Comparison 3: Suction aspiration vs Dilatation & Curettage, Outcome 4: Pelvic inflammatory disease, sepsis or endometritis

Comparison 3: Suction aspiration vs Dilatation & Curettage, Outcome 5: Mean volumes of blood loss (millilitres)

Comparison 3: Suction aspiration vs Dilatation & Curettage, Outcome 6: Change in haemoglobin measurements before and after the miscarriage

Comparison 3: Suction aspiration vs Dilatation & Curettage, Outcome 7: Days of bleeding

Comparison 3: Suction aspiration vs Dilatation & Curettage, Outcome 8: Cervical tear

Comparison 3: Suction aspiration vs Dilatation & Curettage, Outcome 9: Mean duration of hospital stay (days)

Comparison 3: Suction aspiration vs Dilatation & Curettage, Outcome 10: Re‐admission to hospital

Comparison 3: Suction aspiration vs Dilatation & Curettage, Outcome 11: Vomiting

Comparison 3: Suction aspiration vs Dilatation & Curettage, Outcome 12: Pyrexia

Comparison 4: Suction aspiration vs Expectant/ Placebo, Outcome 1: Complete Miscarriage

Comparison 4: Suction aspiration vs Expectant/ Placebo, Outcome 2: Composite outcome of death or serious complication

Comparison 4: Suction aspiration vs Expectant/ Placebo, Outcome 3: Need for unplanned/emergency surgical procedure

Comparison 4: Suction aspiration vs Expectant/ Placebo, Outcome 4: Pelvic inflammatory disease, sepsis or endometritis

Comparison 4: Suction aspiration vs Expectant/ Placebo, Outcome 5: Mean volumes of blood loss (millilitres)

Comparison 4: Suction aspiration vs Expectant/ Placebo, Outcome 6: Change in haemoglobin measurements before and after the miscarriage

Comparison 4: Suction aspiration vs Expectant/ Placebo, Outcome 7: Days of bleeding

Comparison 4: Suction aspiration vs Expectant/ Placebo, Outcome 8: Cervical tear

Comparison 4: Suction aspiration vs Expectant/ Placebo, Outcome 9: Mean duration of hospital stay (days)

Comparison 4: Suction aspiration vs Expectant/ Placebo, Outcome 10: Re‐admission to hospital

Comparison 4: Suction aspiration vs Expectant/ Placebo, Outcome 11: Vomiting

Comparison 4: Suction aspiration vs Expectant/ Placebo, Outcome 12: Diarrhoea

Comparison 4: Suction aspiration vs Expectant/ Placebo, Outcome 13: Pyrexia

Comparison 4: Suction aspiration vs Expectant/ Placebo, Outcome 14: Anxiety score

Comparison 4: Suction aspiration vs Expectant/ Placebo, Outcome 15: Depression score

Comparison 5: Misoprostol vs Mifepristone + Misoprostol, Outcome 1: Complete Miscarriage

Comparison 5: Misoprostol vs Mifepristone + Misoprostol, Outcome 2: Composite outcome of death or serious complication

Comparison 5: Misoprostol vs Mifepristone + Misoprostol, Outcome 3: Need for unplanned/emergency surgical procedure

Comparison 5: Misoprostol vs Mifepristone + Misoprostol, Outcome 4: Pelvic inflammatory disease, sepsis or endometritis

Comparison 5: Misoprostol vs Mifepristone + Misoprostol, Outcome 5: Change in haemoglobin measurements before and after the miscarriage

Comparison 5: Misoprostol vs Mifepristone + Misoprostol, Outcome 6: Days of bleeding

Comparison 5: Misoprostol vs Mifepristone + Misoprostol, Outcome 7: Re‐admission to hospital

Comparison 5: Misoprostol vs Mifepristone + Misoprostol, Outcome 8: Nausea

Comparison 5: Misoprostol vs Mifepristone + Misoprostol, Outcome 9: Vomiting

Comparison 5: Misoprostol vs Mifepristone + Misoprostol, Outcome 10: Diarrhoea

Comparison 5: Misoprostol vs Mifepristone + Misoprostol, Outcome 11: Pyrexia

Comparison 6: Misoprostol vs Dilatation & Curettage, Outcome 1: Complete Miscarriage

Comparison 6: Misoprostol vs Dilatation & Curettage, Outcome 2: Composite outcome of death or serious complication

Comparison 6: Misoprostol vs Dilatation & Curettage, Outcome 3: Need for unplanned/emergency surgical procedure

Comparison 6: Misoprostol vs Dilatation & Curettage, Outcome 4: Pain score

Comparison 6: Misoprostol vs Dilatation & Curettage, Outcome 5: Pelvic inflammatory disease, sepsis or endometritis

Comparison 6: Misoprostol vs Dilatation & Curettage, Outcome 6: Mean volumes of blood loss (millilitres)

Comparison 6: Misoprostol vs Dilatation & Curettage, Outcome 7: Days of bleeding

Comparison 6: Misoprostol vs Dilatation & Curettage, Outcome 8: Cervical tear

Comparison 6: Misoprostol vs Dilatation & Curettage, Outcome 9: Re‐admission to hospital

Comparison 6: Misoprostol vs Dilatation & Curettage, Outcome 10: Vomiting

Comparison 6: Misoprostol vs Dilatation & Curettage, Outcome 11: Nausea

Comparison 6: Misoprostol vs Dilatation & Curettage, Outcome 12: Diarrhoea

Comparison 6: Misoprostol vs Dilatation & Curettage, Outcome 13: Depression score

Comparison 7: Misoprostol vs Suction aspiration + Cervical preparation, Outcome 1: Complete Miscarriage

Comparison 7: Misoprostol vs Suction aspiration + Cervical preparation, Outcome 2: Pyrexia

Comparison 8: Misoprostol vs Expectant/ Placebo, Outcome 1: Complete Miscarriage

Comparison 8: Misoprostol vs Expectant/ Placebo, Outcome 2: Composite outcome of death or serious complication

Comparison 8: Misoprostol vs Expectant/ Placebo, Outcome 3: Need for unplanned/emergency surgical procedure

Comparison 8: Misoprostol vs Expectant/ Placebo, Outcome 4: Pain score

Comparison 8: Misoprostol vs Expectant/ Placebo, Outcome 5: Pelvic inflammatory disease, sepsis or endometritis

Comparison 8: Misoprostol vs Expectant/ Placebo, Outcome 6: Change in haemoglobin measurements before and after the miscarriage

Comparison 8: Misoprostol vs Expectant/ Placebo, Outcome 7: Days of bleeding

Comparison 8: Misoprostol vs Expectant/ Placebo, Outcome 8: Mean duration of hospital stay (days)

Comparison 8: Misoprostol vs Expectant/ Placebo, Outcome 9: Re‐admission to hospital

Comparison 8: Misoprostol vs Expectant/ Placebo, Outcome 10: Nausea

Comparison 8: Misoprostol vs Expectant/ Placebo, Outcome 11: Vomiting

Comparison 8: Misoprostol vs Expectant/ Placebo, Outcome 12: Diarrhoea

Comparison 8: Misoprostol vs Expectant/ Placebo, Outcome 13: Pyrexia

Comparison 8: Misoprostol vs Expectant/ Placebo, Outcome 14: Anxiety score

Comparison 8: Misoprostol vs Expectant/ Placebo, Outcome 15: Depression score

Comparison 9: Dilatation & Curettage vs Expectant/ Placebo, Outcome 1: Complete Miscarriage

Comparison 9: Dilatation & Curettage vs Expectant/ Placebo, Outcome 2: Pelvic inflammatory disease, sepsis or endometritis

Comparison 9: Dilatation & Curettage vs Expectant/ Placebo, Outcome 3: Days of bleeding

Comparison 10: Mifepristone + Misoprostol vs Expectant/ Placebo, Outcome 1: Complete Miscarriage

Comparison 10: Mifepristone + Misoprostol vs Expectant/ Placebo, Outcome 2: Composite outcome of death or serious complication

Comparison 10: Mifepristone + Misoprostol vs Expectant/ Placebo, Outcome 3: Need for unplanned/emergency surgical procedure

Comparison 10: Mifepristone + Misoprostol vs Expectant/ Placebo, Outcome 4: Pain score

Comparison 10: Mifepristone + Misoprostol vs Expectant/ Placebo, Outcome 5: Pelvic inflammatory disease, sepsis or endometritis

Comparison 10: Mifepristone + Misoprostol vs Expectant/ Placebo, Outcome 6: Days of bleeding

Comparison 10: Mifepristone + Misoprostol vs Expectant/ Placebo, Outcome 7: Pyrexia
| Medical and surgical management compared with expectant management or placebo for treating missed early miscarriage | |||||||||
| Patient or population: women with missed miscarriage at ≤14 weeks gestation Settings: hospital or other healthcare facility Intervention: multiple interventions (suction aspiration, misoprostol, dilation and curettage, mifepristone plus misoprostol, suction aspiration plus cervical preparation) Comparison (reference): expectant management or placebo Outcome: complete miscarriage | |||||||||
| Intervention | Network evidence | Direct evidence | Indirect evidence | Illustrative comparative risks* (95% CI) for NMA estimate | |||||
| Relative effect | Certainty of the evidence | Relative effect | Certainty of the evidence | Relative effect | Certainty of the evidence | Risk | Risk | Risk difference | |
| Suction aspiration plus cervical preparation | 2.12 (1.41 to 3.20) | ⊕⊕⊖⊖ LOWa | Not reported by included studies | ‐ | 2.12 (1.41 to 3.20) | ⊕⊕⊖⊖ LOWb | 640 per 1000 | 1000 per 1000 | 360 more per 1,000 (from 182 more to 577 more) |
| Suction aspiration | 1.44 (1.29 to 1.62) | ⊕⊕⊖⊖ LOWc | 1.27 (1.08 to 1.48) | ⊕⊕⊕⊖ MODERATEd | 1.72 (1.44 to 2.06) | ⊕⊕⊕⊖ MODERATEf | 640 per 1000 | 922 per 1000 | 282 more per 1,000 (from 186 more to 397 more) |
| Dilation and curettage | 1.49 (1.26 to 1.75) | ⊕⊕⊖⊖ LOWc | 1.25 (1.12 to 1.39) | ⊕⊕⊕⊖ MODERATEe | 1.55 (1.29 to 1.86) | ⊕⊕⊖⊖ LOWb | 640 per 1000 | 954 per 1000 | 314 more per 1,000 (from 166 more to 480 more) |
| Mifepristone plus misoprostol | 1.42 (1.22 to 1.66) | ⊕⊕⊕⊖ MODERATEg | 1.59 (1.01 to 2.51) | ⊕⊕⊕⊖ MODERATEd | 1.40 (1.16 to 1.70) | ⊕⊕⊕⊖ MODERATEf | 640 per 1000 | 909 per 1000 | 269 more per 1,000 (from 141 more to 422 more) |
| Misoprostol | 1.30 (1.16 to 1.46) | ⊕⊕⊖⊖ LOWc | 1.85 (1.35 to 2.55) | ⊕⊕⊕⊖ MODERATEd | 1.14 (0.99 to 1.31) | ⊕⊕⊕⊖ MODERATEf | 640 per 1000 | 832 per 1000 | 192 more per 1,000 (from 102 more to 294 more) |
| *The basis for the assumed risk (e.g. the median control group risk across studies) is provided in footnotes. The corresponding risk (and its 95% confidence interval) is based on the assumed risk in the comparison group and the relative effect of the intervention (and its 95% CI). | |||||||||
| GRADE Working Group grades of evidence | |||||||||
| a Network evidence downgraded ‐2 due to low certainty indirect evidence (no intransitivity, incoherence, or imprecision) b Indirect evidence downgraded ‐2 due to limitations in study design c Network evidence downgraded ‐2 due to moderate certainty direct evidence and incoherence between direct and indirect estimates (no intransitivity, or imprecision) d Direct evidence downgraded ‐1 due to severe unexplained statistical heterogeneity e Direct evidence downgraded ‐1 due to serious imprecision f Indirect evidence downgraded ‐1 due to severe unexplained statistical heterogeneity g Network evidence downgraded ‐1 due to moderate certainty indirect evidence (no intransitivity, incoherence, or imprecision) | |||||||||
| Medical and surgical management compared with expectant management or placebo for treating missed early miscarriage | |||||||||
| Patient or population: women with missed miscarriage at ≤14 weeks gestation Settings: hospital or other healthcare facility Intervention: multiple interventions (suction aspiration, misoprostol, dilation and curettage, mifepristone plus misoprostol, suction aspiration plus cervical preparation) Comparison (reference): expectant management or placebo Outcome: complete miscarriage | |||||||||
| Intervention | Network evidence | Direct evidence | Indirect evidence | Illustrative comparative risks* (95% CI) for NMA estimate | |||||
| Relative effect | Certainty of the evidence | Relative effect | Certainty of the evidence | Relative effect | Certainty of the evidence | Risk | Risk | Risk difference | |
| Suction aspiration plus cervical preparation | Not estimable | ‐ | Not reported by included studies | ‐ | Not estimable | ‐ | Not estimable | Not estimable | Not estimable |
| Suction aspiration | 2.43 (1.69 to 3.49) | ⊕⊕⊕⊖ MODERATEb | 1.88 (1.68 to 2.12) | ⊕⊕⊕⊕ HIGH | 3.35 (1.94 to 5.81) | ⊕⊖⊖⊖ VERY LOWa | 455 per 1000 | 942 per 1000 | 487 more per 1000 (from 402 more to 580 more) |
| Dilation and curettage | 2.07 (1.19 to 3.59) | ⊕⊕⊕⊕ HIGH | Not reported by included studies | ‐ | Not estimable | ‐ | 455 per 1000 | 1000 per 1000 | 545 more per 1000 (from 313 more to 847 more) |
| Mifepristone plus misoprostol | 1.82 (1.28 to 2.58) | ⊕⊕⊕⊖ MODERATEb | 1.25 (1.09 to 1.45) | ⊕⊕⊕⊕ HIGH | 2.40 (1.58 to 3.65) | ⊕⊕⊕⊖ MODERATEc | 455 per 1000 | 828 per 1000 | 373 more per 1000 (from 127 more to 719 more) |
| Misoprostol | 1.67 (1.18 to 2.37) | ⊕⊕⊖⊖ LOWe | 3.18 (1.48 to 6.85) | ⊕⊕⊕⊖ MODERATEd | 1.16 (0.81 to 1.67) | ⊕⊕⊕⊖ MODERATEc | 455 per 1000 | 760 per 1000 | 305 more per 1000 (from 82 more to 623 more) |
| *The basis for the assumed risk (e.g. the median control group risk across studies) is provided in footnotes. The corresponding risk (and its 95% confidence interval) is based on the assumed risk in the comparison group and the relative effect of the intervention (and its 95% CI). | |||||||||
| GRADE Working Group grades of evidence | |||||||||
| a Indirect evidence downgraded ‐3 due to multiple crucial limitations in study design, severe unexplained statistical heterogeneity and imprecision b Network evidence downgraded ‐1 due to high certainty direct evidence and incoherence between direct and indirect estimates (no intransitivity, or imprecision) c Indirect evidence downgraded ‐1 due to severe unexplained statistical heterogeneity d Direct evidence downgraded ‐1 due to severe unexplained statistical heterogeneity e Network evidence downgraded ‐2 due to moderate certainty indirect evidence and incoherence between direct and indirect estimates (no intransitivity, or imprecision) | |||||||||
| Medical and surgical management compared with expectant management or placebo for treating incomplete early miscarriage | |||||||||
| Patient or population: women with incomplete miscarriage at ≤14 weeks gestation Settings: hospital or other healthcare facility Intervention: multiple interventions (suction aspiration, misoprostol, dilation and curettage, mifepristone plus misoprostol, suction aspiration plus cervical preparation) Comparison (reference): expectant management or placebo Outcome: complete miscarriage | |||||||||
| Intervention | Network evidence | Direct evidence | Indirect evidence | Illustrative comparative risks* (95% CI) for NMA estimate | |||||
| Relative effect | Quality of the evidence | Relative effect | Certainty of the evidence | Relative effect | Certainty of the evidence | Risk | Risk | Risk difference | |
| Suction aspiration plus cervical preparation | Not estimable | ‐ | Not reported by included studies | ‐ | Not estimable | ‐ | Not estimable | Not estimable | Not estimable |
| Suction aspiration | 1.19 (1.09 to 1.31) | ⊕⊕⊕⊖ MODERATEc | 1.20 (0.85 to 1.69) | ⊕⊖⊖⊖ VERY LOWa | 1.28 (1.11 to 1.48) | ⊕⊕⊖⊖ LOWb | 767 per 1000 | 913 per 1000 | 146 more per 1000 (from 69 more to 238 more) |
| Dilation and curettage | 1.19 (1.08 to 1.31) | ⊕⊕⊕⊖ MODERATEf | 1.25 (1.12 to 1.39) | ⊕⊕⊕⊖ MODERATEd | 1.15 (1.02 to 1.30) | ⊕⊖⊖⊖ VERY LOWe | 767 per 1000 | 913 per 1000 | 146 more per 1000 (from 61 more to 238 more) |
| Mifepristone plus misoprostol | 1.08 (0.87 to 1.34) | ⊕⊖⊖⊖ VERY LOWh | 1.08 (0.90 to 1.30) | ⊕⊖⊖⊖ VERY LOWg | Not estimable | ‐ | 767 per 1000 | 828 per 1000 | 61 more per 1000 (from 100 fewer to 261 more) |
| Misoprostol | 1.14 (1.03 to 1.25) | ⊕⊕⊕⊖ MODERATEj | 1.04 (0.70 to 1.54) | ⊕⊕⊖⊖ LOWi | 1.12 (1.02 to 1.24) | ⊕⊖⊖⊖ VERY LOWe | 767 per 1000 | 874 per 1000 | 107 more per 1000 (from 23 more to 192 more) |
| *The basis for the assumed risk (e.g. the median control group risk across studies) is provided in footnotes. The corresponding risk (and its 95% confidence interval) is based on the assumed risk in the comparison group and the relative effect of the intervention (and its 95% CI). | |||||||||
| GRADE Working Group grades of evidence | |||||||||
| a Direct evidence downgraded ‐3 due to multiple crucial limitations in study design, severe unexplained statistical heterogeneity and imprecision b Indirect evidence downgraded ‐2 due to serious imprecision c Network evidence downgraded ‐1 due to low certainty indirect evidence upgraded by 1 as it was downgraded for imprecision d Direct evidence downgraded ‐1 due to serious imprecision e Indirect evidence downgraded ‐3 due to multiple crucial limitations in study design, severe unexplained statistical heterogeneity and imprecision f Network evidence downgraded ‐1 due to moderate certainty direct evidence (no intransitivity, incoherence, or imprecision) g Direct evidence downgraded ‐3 due to multiple crucial limitations in study design and imprecision h Network evidence downgraded ‐3 due to very low certainty direct evidence (no intransitivity, incoherence, or imprecision) i Direct evidence downgraded ‐2 due to serious imprecision j Network evidence downgraded ‐1 due to low certainty direct evidence upgraded by 1 as network evidence is precise | |||||||||
| Medical and surgical management compared with expectant management or placebo for treating early miscarriage | |||||||||
| Patient or population: women with missed or incomplete miscarriage at ≤14 weeks gestation Settings: Hospital Intervention: multiple interventions (suction aspiration, misoprostol, dilation plus curettage, mifepristone plus misoprostol, suction aspiration plus cervical preparation) Comparison (reference): expectant management Outcome: composite outcome of death or serious complication | |||||||||
| Intervention | Network evidence | Direct evidence | Indirect evidence | Illustrative comparative risks* (95% CI) for NMA estimate | |||||
| Relative effect | Certainty of the evidence | Relative effect | Certainty of the evidence | Relative effect | Certainty of the evidence | Risk | Risk | Risk difference | |
| Suction aspiration plus cervical preparation | Not reported by included studies | ‐ | Not reported by included studies | ‐ | Not reported by included studies | ‐ | Not estimable | Not estimable | Not estimable |
| Suction aspiration | 0.55 (0.23 to 1.32) | ⊕⊕⊖⊖ LOWc | 0.43 (0.12 to 1.53) | ⊕⊕⊖⊖ LOWa | 0.97 (0.21 to 4.40) | ⊕⊕⊖⊖ LOWb | 19 per 1000 | 10 per 1000 | 9 fewer per 1000 (from 15 fewer to 6 more) |
| Dilation and curettage | 0.43 (0.17 to 1.06) | ⊕⊕⊖⊖ LOWd | Not reported by included studies | ‐ | 0.43 (0.17 to 1.06) | ⊕⊕⊖⊖ LOWb | 19 per 1000 | 8 per 1000 | 11 fewer per 1000 (from 16 fewer to 1 more) |
| Mifepristone plus misoprostol | 0.76 (0.31 to 1.84) | ⊕⊕⊖⊖ LOWc | 0.46 (0.13 to 1.63) | ⊕⊕⊖⊖ LOWa | 1.38 (0.37 to 5.17) | ⊕⊕⊖⊖ LOWb | 19 per 1000 | 14 per 1000 | 5 fewer per 1000 (from 13 fewer to 16 more) |
| Misoprostol | 0.50 (0.22 to 1.15) | ⊕⊕⊖⊖ LOWd | 0.96 (0.06 to 15.08) | ⊕⊕⊖⊖ LOWa | 0.35 (0.13 to 0.97) | ⊕⊕⊖⊖ LOWb | 19 per 1000 | 10 per 1000 | 9 fewer per 1000 (from 15 fewer to 3 more) |
| *The basis for the assumed risk (e.g. the median control group risk across studies) is provided in footnotes. The corresponding risk (and its 95% confidence interval) is based on the assumed risk in the comparison group and the relative effect of the intervention (and its 95% CI). | |||||||||
| GRADE Working Group grades of evidence | |||||||||
| a Direct evidence downgraded ‐2 due to very serious imprecision b Indirect evidence downgraded ‐2 due to very serious imprecision c Network evidence downgraded ‐2 due to low certainty direct evidence (no intransitivity or incoherence) d Network evidence downgraded ‐2 due to low certainty indirect evidence (no intransitivity or incoherence) | |||||||||
| Medical and surgical management compared with expectant management or placebo for treating early miscarriage | |||||||||
| Patient or population: women with a miscarriage at ≤14 weeks gestation Settings: hospital or other healthcare facility Intervention: multiple interventions (suction aspiration, misoprostol, dilation and curettage, mifepristone plus misoprostol, suction aspiration plus cervical preparation) Comparison (reference): expectant management or placebo Outcome: need for unplanned/emergency surgical procedure | |||||||||
| Intervention | Network evidence | Direct evidence | Indirect evidence | Illustrative comparative risks* (95% CI) for NMA estimate | |||||
| Relative effect | Certainty of the evidence | Relative effect | Certainty of the evidence | Relative effect | Certainty of the evidence | Risk | Risk | Risk difference | |
| Suction aspiration plus cervical preparation | Not estimable | ‐ | Not reported by included studies | ‐ | Not estimable | ‐ | Not estimable | Not estimable | Not estimable |
| Suction aspiration | 0.37 (0.22 to 0.65) | ⊕⊕⊕⊖ MODERATEb | 0.51 (0.30 to 0.87) | ⊕⊕⊕⊕ HIGH | 0.13 (0.05 to 0.35) | ⊕⊕⊖⊖ LOWa | 120 per 1000 | 44 per 1000 | 76 fewer per 1000 (from 42 fewer to 94 fewer) |
| Dilation and curettage | 0.80 (0.09 to 7.02) | ⊕⊖⊖⊖ VERY LOWc | Not reported by included studies | ‐ | Not estimable | ‐ | 120 per 1000 | 96 per 1000 | 24 fewer per 1000 (from 109 fewer to 722 more) |
| Mifepristone plus misoprostol | 0.64 (0.33 to 1.23) | ⊕⊕⊖⊖ LOWe | 0.32 (0.11 to 0.90) | ⊕⊕⊕⊖ MODERATEd | 0.91 (0.43 to 1.93) | ⊕⊕⊖⊖ LOWa | 120 per 1000 | 77 per 1000 | 43 less per 1000 (from 80 fewer to 28 more) |
| Misoprostol | 1.04 (0.56 to 1.95) | ⊕⊕⊖⊖ LOWg | 0.67 (0.23 to 1.95) | ⊕⊕⊖⊖ LOWf | 1.28 (0.61 to 2.66) | ⊕⊕⊖⊖ LOWa | 120 per 1000 | 125 per 1000 | 5 more per 1000 (from 53 fewer to 114 more) |
| *The basis for the assumed risk (e.g. the median control group risk across studies) is provided in footnotes. The corresponding risk (and its 95% confidence interval) is based on the assumed risk in the comparison group and the relative effect of the intervention (and its 95% CI). | |||||||||
| GRADE Working Group grades of evidence | |||||||||
| a Indirect evidence downgraded ‐2 due to serious imprecision b Network evidence downgraded ‐1 due to high certainty direct evidence downgraded due to incoherence c Network evidence downgraded ‐1 due to low certainty indirect loop further downgraded due to imprecision d Direct evidence downgraded ‐1 due to imprecision e Network evidence downgraded ‐1 due to moderate certainty direct evidence downgraded due to incoherence f Direct evidence downgraded ‐2 due to serious imprecision g Network evidence downgraded due to low certainty indirect evidence with imprecision but not further downgraded as indirect evidence previously downgraded for imprecision | |||||||||
| Medical and surgical management compared with expectant management or placebo for treating early miscarriage | |||||
| Patient or population: women with a miscarriage at ≤14 weeks gestation Settings: hospital or other healthcare facility Intervention: multiple interventions (suction aspiration, misoprostol, dilation and curettage, mifepristone plus misoprostol, suction aspiration plus cervical preparation) Comparison (reference): expectant management or placebo Outcome: pain scores (visual analogue scale) | |||||
| Intervention | Anticipated absolute effects* (95% CI) | № of participants | Certainty of the evidence | Comments | |
|---|---|---|---|---|---|
| Risk with standard care | Risk with intervention | ||||
| Suction aspiration plus cervical preparation | The mean pain score was 0 | Not reported by included studies | ‐ | ‐ | |
| Suction aspiration | The mean pain score was 0 | Not reported by included studies | ‐ | ‐ | |
| Dilation and curettage | The mean pain score was 0 | Not reported by included studies | ‐ | ‐ | |
| Mifepristone plus misoprostol | The pain score in the mifepristone plus misoprostol group was on average 0.14 higher (from 0.21 lower to 0.5 higher) than in the expectant management or placebo group | 122 | ⊕⊕⊝⊝ | small effect | |
| Misoprostol | The pain score in the misoprostol group was on average 0.33 higher (from 0.08 lower to 0.57 higher) than in the expectant management or placebo group | 262 | ⊕⊕⊝⊝ | small effect | |
| *The risk in the intervention group (and its 95% confidence interval) is based on the assumed risk in the comparison group and the relative effect of the intervention (and its 95% CI). | |||||
| GRADE Working Group grades of evidence | |||||
| a ‐1 as patient reported outcome b ‐1 due to imprecision | |||||
| Medical and surgical management compared with expectant management or placebo for treating early miscarriage | |||||||||
| Patient or population: women with a miscarriage at ≤14 weeks gestation Settings: Hospital or other healthcare facility Intervention: multiple interventions (suction aspiration, misoprostol, dilation and curettage, mifepristone plus misoprostol, suction aspiration plus cervical preparation) Comparison (reference): expectant management or placebo Outcome: pelvic inflammatory disease, sepsis or endometritis | |||||||||
| Intervention | Network evidence | Direct evidence | Indirect evidence | Illustrative comparative risks* (95% CI) for NMA estimate | |||||
| Relative effect | Certainty of the evidence | Relative effect | Certainty of the evidence | Relative effect | Certainty of the evidence | Risk | Risk | Risk difference | |
| Suction aspiration plus cervical preparation | Not estimable | ‐ | Not reported by included studies | ‐ | Not estimable | ‐ | Not estimable | Not estimable | Not estimable |
| Suction aspiration | 1.42 (0.88 to 2.28) | ⊕⊕⊕⊖ MODERATEc | 1.35 (0.76 to 2.41) | ⊕⊕⊕⊖ MODERATEa | 1.55 (0.66 to 3.68) | ⊕⊕⊖⊖ LOWb | 36 per 1000 | 51 per 1000 | 15 more per 1000 (from 4 fewer to 46 more) |
| Dilation and curettage | 1.85 (1.05 to 3.25) | ⊕⊖⊖⊖ VERY LOWf | 3.30 (0.82 to 13.28) | ⊕⊕⊖⊖ LOWd | 1.65 (0.89 to 3.06) | ⊕⊖⊖⊖ VERY LOWe | 36 per 1000 | 67 per 1000 | 31 more 1000 (from 2 more to 81 more) |
| Mifepristone plus misoprostol | 0.90 (0.48 to 1.68) | ⊕⊕⊖⊖ LOWg | 0.73 (0.30 to 1.80) | ⊕⊕⊖⊖ LOWd | 1.11 (0.47 to 2.64) | ⊕⊕⊖⊖ LOWb | 36 per 1000 | 32 per 1000 | 4 fewer per 1000 (from 19 fewer to 25 more) |
| Misoprostol | 1.08 (0.62 to 1.88) | ⊕⊕⊕⊖ MODERATEc | 1.84 (0.35 to 9.68) | ⊕⊕⊖⊖ LOWd | 1.10 (0.56 to 2.16) | ⊕⊕⊕⊖ MODERATEh | 36 per 1000 | 39 per 1000 | 3 more per 1000 (from 14 fewer to 32 more) |
| *The basis for the assumed risk (e.g. the median control group risk across studies) is provided in footnotes. The corresponding risk (and its 95% confidence interval) is based on the assumed risk in the comparison group and the relative effect of the intervention (and its 95% CI). | |||||||||
| GRADE Working Group grades of evidence | |||||||||
| a Direct evidence downgraded ‐1 due to imprecision b Indirect evidence downgraded ‐2 due to serious imprecision c Network evidence downgraded ‐1 due to moderate certainty direct evidence not further downgraded due to imprecision as direct evidence previously downgraded for imprecision d Direct evidence downgraded ‐2 due to serious imprecision e Indirect evidence downgraded ‐3 due to serious design limitations and imprecision in direct evidence f Network evidence downgraded ‐3 due to very low certainty indirect evidence, further downgraded ‐1 for incoherence but upgraded +1 as network is precise g Network evidence downgraded ‐2 due to low certainty direct evidence, not further downgraded due to imprecision as direct evidence previously downgraded for imprecision h Indirect evidence downgraded ‐1 due to imprecision in direct evidence | |||||||||
| Medical and surgical management compared with expectant management or placebo for treating early miscarriage | |||||||||
| Patient or population: women with a miscarriage at ≤14 weeks gestation Settings: hospital or other healthcare facility Intervention: multiple interventions (suction aspiration, misoprostol, dilation and curettage, mifepristone plus misoprostol, suction aspiration plus cervical preparation) Comparison (reference): expectant management or placebo Outcome: days of bleeding | |||||||||
| Intervention | Network evidence | Direct evidence | Indirect evidence | Illustrative comparative risks* (95% CI) for NMA estimate | |||||
| Mean difference | Certainty of the evidence | Mean difference | Certainty of the evidence | Mean difference | Certainty of the evidence | Risk | Risk | Risk difference | |
| Suction aspiration plus cervical preparation | Not estimable | ‐ | Not reported by included studies | ‐ | Not estimable | ‐ | Not estimable | Not estimable | Not estimable |
| Suction aspiration | ‐2.00 (‐3.01 to ‐0.99) | ⊕⊖⊖⊖ VERY LOWc | ‐2.75 (‐4.08 to ‐1.42) | ⊕⊕⊖⊖ LOWa | ‐0.73 (‐2.12 to 0.66) | ⊕⊖⊖⊖ VERY LOWb | 10 days | 8 days | 2 days less (from 0.99 days less to 3.01 days less) |
| Dilation and curettage | ‐1.96 (‐3.48 to ‐0.45) | ⊕⊕⊖⊖ LOWf | ‐1.26 (‐2.27 to ‐0.25) | ⊕⊕⊖⊖ LOWd | ‐2.47 (‐4.47 to ‐0.46) | ⊕⊖⊖⊖ VERY LOWe | 10 days | 8.04 days | 1.96 days less (from 0.45 days less to 3.48 days less) |
| Mifepristone plus misoprostol | ‐0.14 (‐1.71 to 1.43) | ⊕⊖⊖⊖ VERY LOWh | 0.70 (‐0.43 to 1.83) | ⊕⊖⊖⊖ VERY LOWg | ‐0.77 (‐2.83 to 1.30) | ⊕⊖⊖⊖ VERY LOWb | 10 days | 9.86 days | 0.14 days less (from 1.71 days less to 1.43 days more) |
| Misoprostol | ‐0.47 (‐1.53 to 0.60) | ⊕⊖⊖⊖ VERY LOWk | 0.32 (‐2.19 to 2.84) | ⊕⊖⊖⊖ VERY LOWi | ‐0.96 (‐2.27 to 0.35) | ⊕⊕⊖⊖ LOWj | 10 days | 9.53 days | 0.47 days less (from 1.53 days less to 0.60 days more) |
| *The basis for the assumed risk (e.g. the median control group risk across studies) is provided in footnotes. The corresponding risk (and its 95% confidence interval) is based on the assumed risk in the comparison group and the relative effect of the intervention (and its 95% CI). | |||||||||
| GRADE Working Group grades of evidence | |||||||||
| a Direct evidence downgraded ‐2 due to patient reported outcome and significant heterogeneity b Indirect evidence downgraded ‐4 due to patient reported outcome, significant heterogeneity and serious imprecision c Network evidence downgraded ‐4 due to low certainty direct evidence, further downgraded due to incoherence and not upgraded as direct grade not downgraded for imprecision d Direct evidence downgraded ‐2 due to patient reported outcome and imprecision e Indirect evidence downgraded ‐4 due to very low certainty direct evidence which was due to patient reported outcome, moderate design limitations and serious imprecision f Network evidence downgraded ‐2 due to low certainty direct evidence, further downgraded ‐1 for incoherence but upgraded +1 as network is precise and direct evidence was previously downgraded for imprecision g Direct evidence downgraded ‐3 due to patient reported outcome and serious imprecision h Network evidence downgraded ‐5 due to very low certainty direct evidence, further downgraded due to incoherence but not even further downgraded due to imprecision as direct evidence previously downgraded for imprecision i Direct evidence downgraded ‐4 due to patient reported outcome, significant heterogeneity and serious imprecision j Indirect evidence downgraded ‐2 due to patient reported outcome and significant heterogeneity k Network evidence downgraded ‐3 due to low certainty indirect evidence downgraded ‐1 due to imprecision | |||||||||
| Medical and surgical management compared with expectant management or placebo for treating early miscarriage | ||||
| Patient or population: women with a miscarriage at ≤14 weeks gestation Settings: hospital or other healthcare facility Intervention: multiple interventions (suction aspiration, misoprostol, dilation and curettage, mifepristone plus misoprostol, suction aspiration plus cervical preparation) Comparison (reference): expectant management or placebo Outcome: women's views/ satisfaction | ||||
| Intervention | Narrative synthesis | № of participants | Certainty of the evidence | Comments |
|---|---|---|---|---|
| Suction aspiration plus cervical preparation | Not reported by included studies | (0 RCTs) | ‐ | |
| Suction aspiration | 2 trials described 92 out of 96 women (98.5%) as being satisfied with suction aspiration compared to 97 out of 99 women (98.0%) for expectant management or placebo. 1 trial used a 10 point numerical scale and found suction aspiration had a satisfaction score of 7.57 from 175 women and expectant management or placebo also had a 7.57 score from 177 women. | 547 | ⊕⊕⊕⊝ | |
| Dilatation and curettage | Not reported by included studies | (0 RCTs) | ‐ | |
| Mifepristone plus misoprostol | 1 trial used a visual analogue scale and found Mifepristone plus misoprostol had a score of 28.6 (SD 24.8) from 60 women compared to 25.2 (SD 25.6) from 62 women for expectant management or placebo | 122 | ⊕⊝⊝⊝ | |
| Misoprostol | 1 trial used a visual analogue scale and found misoprostol had a score of 8.9 (+/‐ 1.3) compared to 8.7 (+/‐ 1.5) for expectant management or placebo with 52 women in each arm. 1 trial described 14 out of 16 (87.5%) women as being satisfied with misoprostol compared to 12 out of 16 (75%) women as being satisfied with expectant management or placebo | 136 | ⊕⊕⊝⊝ | |
| GRADE Working Group grades of evidence | ||||
| a‐1 no meta‐analysis possible, narrative synthesis was conducted, estimates are not precise b ‐1 due to design limitations c ‐1 due to imprecision | ||||
| Outcome or subgroup title | No. of studies | No. of participants | Statistical method | Effect size |
| 1.1 Complete Miscarriage Show forest plot | 23 | Risk Ratio (IV, Random, 95% CI) | Subtotals only | |
| 1.1.1 Missed miscarriage | 3 | 308 | Risk Ratio (IV, Random, 95% CI) | 1.51 [1.14, 2.01] |
| 1.1.2 Incomplete miscarriage | 14 | 3474 | Risk Ratio (IV, Random, 95% CI) | 1.03 [1.01, 1.05] |
| 1.1.3 Mixed population | 6 | 1706 | Risk Ratio (IV, Random, 95% CI) | 1.19 [1.06, 1.32] |
| 1.2 Composite outcome of death or serious complication Show forest plot | 9 | 2146 | Risk Ratio (IV, Random, 95% CI) | 1.53 [0.45, 5.16] |
| 1.3 Need for unplanned/emergency surgical procedure Show forest plot | 9 | 1078 | Risk Ratio (IV, Random, 95% CI) | 0.19 [0.10, 0.37] |
| 1.4 Pain score Show forest plot | 8 | 2857 | Std. Mean Difference (IV, Random, 95% CI) | 0.08 [‐0.35, 0.51] |
| 1.5 Pelvic inflammatory disease, sepsis or endometritis Show forest plot | 12 | 2989 | Risk Ratio (IV, Random, 95% CI) | 1.27 [0.67, 2.41] |
| 1.6 Change in haemoglobin measurements before and after the miscarriage Show forest plot | 7 | 2706 | Mean Difference (IV, Random, 95% CI) | ‐0.17 [‐0.29, ‐0.05] |
| 1.7 Days of bleeding Show forest plot | 7 | Mean Difference (IV, Random, 95% CI) | Subtotals only | |
| 1.8 Cervical tear Show forest plot | 5 | 1252 | Risk Ratio (IV, Random, 95% CI) | 7.18 [0.84, 61.00] |
| 1.9 Mean duration of hospital stay (days) Show forest plot | 1 | 635 | Mean Difference (IV, Random, 95% CI) | ‐0.40 [‐0.68, ‐0.12] |
| 1.10 Re‐admission to hospital Show forest plot | 2 | 554 | Risk Ratio (IV, Random, 95% CI) | 0.77 [0.27, 2.21] |
| 1.11 Nausea Show forest plot | 13 | 3605 | Risk Ratio (IV, Random, 95% CI) | 0.52 [0.35, 0.76] |
| 1.12 Vomiting Show forest plot | 13 | 3447 | Risk Ratio (IV, Random, 95% CI) | 0.50 [0.38, 0.68] |
| 1.13 Diarrhoea Show forest plot | 9 | 1769 | Risk Ratio (IV, Random, 95% CI) | 0.39 [0.26, 0.60] |
| 1.14 Pyrexia Show forest plot | 15 | 4129 | Risk Ratio (IV, Random, 95% CI) | 0.37 [0.22, 0.61] |
| 1.15 Anxiety score Show forest plot | 2 | 719 | Std. Mean Difference (IV, Random, 95% CI) | ‐0.08 [‐0.24, 0.09] |
| 1.16 Depression score Show forest plot | 2 | 719 | Std. Mean Difference (IV, Random, 95% CI) | ‐0.17 [‐0.46, 0.12] |
| Outcome or subgroup title | No. of studies | No. of participants | Statistical method | Effect size |
| 2.1 Complete Miscarriage Show forest plot | 2 | Risk Ratio (IV, Random, 95% CI) | Subtotals only | |
| 2.1.1 Missed miscarriage | 1 | 618 | Risk Ratio (IV, Random, 95% CI) | 1.50 [1.37, 1.64] |
| 2.1.2 Mixed population | 1 | 98 | Risk Ratio (IV, Random, 95% CI) | 1.11 [1.01, 1.23] |
| 2.2 Composite outcome of death or serious complication Show forest plot | 1 | 618 | Risk Ratio (IV, Random, 95% CI) | 0.14 [0.01, 2.74] |
| 2.3 Need for unplanned/emergency surgical procedure Show forest plot | 1 | 98 | Risk Ratio (IV, Random, 95% CI) | 1.00 [0.06, 15.54] |
| 2.4 Pelvic inflammatory disease, sepsis or endometritis Show forest plot | 2 | 716 | Risk Ratio (IV, Random, 95% CI) | 2.33 [0.47, 11.44] |
| 2.5 Re‐admission to hospital Show forest plot | 1 | 98 | Risk Ratio (IV, Random, 95% CI) | 0.14 [0.01, 2.69] |
| Outcome or subgroup title | No. of studies | No. of participants | Statistical method | Effect size |
| 3.1 Complete Miscarriage Show forest plot | 5 | Risk Ratio (IV, Random, 95% CI) | Subtotals only | |
| 3.1.1 Incomplete miscarriage | 4 | 1432 | Risk Ratio (IV, Random, 95% CI) | 1.02 [0.98, 1.06] |
| 3.1.2 Mixed population | 1 | 90 | Risk Ratio (IV, Random, 95% CI) | 1.05 [0.94, 1.17] |
| 3.2 Composite outcome of death or serious complication Show forest plot | 5 | 1521 | Risk Ratio (IV, Random, 95% CI) | 1.27 [0.80, 2.02] |
| 3.3 Need for unplanned/emergency surgical procedure Show forest plot | 2 | 693 | Risk Ratio (IV, Random, 95% CI) | 0.33 [0.01, 8.07] |
| 3.4 Pelvic inflammatory disease, sepsis or endometritis Show forest plot | 3 | 822 | Risk Ratio (IV, Random, 95% CI) | 0.77 [0.53, 1.11] |
| 3.5 Mean volumes of blood loss (millilitres) Show forest plot | 2 | 451 | Mean Difference (IV, Random, 95% CI) | ‐11.44 [‐21.49, ‐1.40] |
| 3.6 Change in haemoglobin measurements before and after the miscarriage Show forest plot | 2 | 370 | Mean Difference (IV, Random, 95% CI) | ‐0.41 [‐0.68, ‐0.14] |
| 3.7 Days of bleeding Show forest plot | 1 | 270 | Mean Difference (IV, Random, 95% CI) | ‐0.30 [‐1.30, 0.70] |
| 3.8 Cervical tear Show forest plot | 2 | 558 | Risk Ratio (IV, Random, 95% CI) | 0.49 [0.20, 1.18] |
| 3.9 Mean duration of hospital stay (days) Show forest plot | 3 | 220 | Mean Difference (IV, Random, 95% CI) | ‐0.56 [‐0.89, ‐0.23] |
| 3.10 Re‐admission to hospital Show forest plot | 2 | 1042 | Risk Ratio (IV, Random, 95% CI) | 1.61 [0.62, 4.16] |
| 3.11 Vomiting Show forest plot | 1 | 599 | Risk Ratio (IV, Random, 95% CI) | 2.31 [0.60, 8.85] |
| 3.12 Pyrexia Show forest plot | 3 | 1157 | Risk Ratio (IV, Random, 95% CI) | 1.31 [0.85, 2.02] |
| Outcome or subgroup title | No. of studies | No. of participants | Statistical method | Effect size |
| 4.1 Complete Miscarriage Show forest plot | 7 | Risk Ratio (IV, Random, 95% CI) | Subtotals only | |
| 4.1.1 Missed miscarriage | 1 | 616 | Risk Ratio (IV, Random, 95% CI) | 1.88 [1.68, 2.12] |
| 4.1.2 Incomplete miscarriage | 2 | 300 | Risk Ratio (IV, Random, 95% CI) | 1.20 [0.85, 1.69] |
| 4.1.3 Mixed population | 4 | 776 | Risk Ratio (IV, Random, 95% CI) | 1.18 [1.11, 1.25] |
| 4.2 Composite outcome of death or serious complication Show forest plot | 5 | 1485 | Risk Ratio (IV, Random, 95% CI) | 0.43 [0.12, 1.53] |
| 4.3 Need for unplanned/emergency surgical procedure Show forest plot | 4 | 842 | Risk Ratio (IV, Random, 95% CI) | 0.51 [0.30, 0.87] |
| 4.4 Pelvic inflammatory disease, sepsis or endometritis Show forest plot | 8 | 1725 | Risk Ratio (IV, Random, 95% CI) | 1.35 [0.76, 2.41] |
| 4.5 Mean volumes of blood loss (millilitres) Show forest plot | 1 | 352 | Mean Difference (IV, Random, 95% CI) | ‐23.00 [‐40.41, ‐5.59] |
| 4.6 Change in haemoglobin measurements before and after the miscarriage Show forest plot | 3 | 603 | Mean Difference (IV, Random, 95% CI) | 0.18 [0.10, 0.25] |
| 4.7 Days of bleeding Show forest plot | 4 | Mean Difference (IV, Random, 95% CI) | Subtotals only | |
| 4.8 Cervical tear Show forest plot | 2 | 492 | Risk Ratio (IV, Random, 95% CI) | Not estimable |
| 4.9 Mean duration of hospital stay (days) Show forest plot | 1 | 140 | Mean Difference (IV, Random, 95% CI) | 0.99 [0.74, 1.24] |
| 4.10 Re‐admission to hospital Show forest plot | 2 | 463 | Risk Ratio (IV, Random, 95% CI) | 0.72 [0.15, 3.41] |
| 4.11 Vomiting Show forest plot | 1 | 111 | Risk Ratio (IV, Random, 95% CI) | 0.82 [0.19, 3.50] |
| 4.12 Diarrhoea Show forest plot | 1 | 111 | Risk Ratio (IV, Random, 95% CI) | 1.82 [0.71, 4.67] |
| 4.13 Pyrexia Show forest plot | 1 | 111 | Risk Ratio (IV, Random, 95% CI) | 3.28 [0.69, 15.57] |
| 4.14 Anxiety score Show forest plot | 1 | 111 | Std. Mean Difference (IV, Random, 95% CI) | ‐0.12 [‐0.49, 0.26] |
| 4.15 Depression score Show forest plot | 1 | 111 | Std. Mean Difference (IV, Random, 95% CI) | ‐0.29 [‐0.67, 0.08] |
| Outcome or subgroup title | No. of studies | No. of participants | Statistical method | Effect size |
| 5.1 Complete Miscarriage Show forest plot | 7 | Risk Ratio (IV, Random, 95% CI) | Subtotals only | |
| 5.1.1 Missed miscarriage | 7 | 1812 | Risk Ratio (IV, Random, 95% CI) | 0.87 [0.79, 0.97] |
| 5.2 Composite outcome of death or serious complication Show forest plot | 7 | 1822 | Risk Ratio (IV, Random, 95% CI) | 0.50 [0.20, 1.25] |
| 5.3 Need for unplanned/emergency surgical procedure Show forest plot | 6 | 1527 | Risk Ratio (IV, Random, 95% CI) | 1.55 [1.22, 1.96] |
| 5.4 Pelvic inflammatory disease, sepsis or endometritis Show forest plot | 5 | 1617 | Risk Ratio (IV, Random, 95% CI) | 1.02 [0.54, 1.92] |
| 5.5 Change in haemoglobin measurements before and after the miscarriage Show forest plot | 1 | 90 | Mean Difference (IV, Random, 95% CI) | 0.02 [‐0.18, 0.22] |
| 5.6 Days of bleeding Show forest plot | 2 | Mean Difference (IV, Random, 95% CI) | Subtotals only | |
| 5.7 Re‐admission to hospital Show forest plot | 1 | 344 | Risk Ratio (IV, Random, 95% CI) | 2.30 [1.48, 3.58] |
| 5.8 Nausea Show forest plot | 2 | 570 | Risk Ratio (IV, Random, 95% CI) | 0.74 [0.39, 1.39] |
| 5.9 Vomiting Show forest plot | 1 | 300 | Risk Ratio (IV, Random, 95% CI) | 0.57 [0.36, 0.90] |
| 5.10 Diarrhoea Show forest plot | 2 | 570 | Risk Ratio (IV, Random, 95% CI) | 1.09 [0.83, 1.44] |
| 5.11 Pyrexia Show forest plot | 4 | 685 | Risk Ratio (IV, Random, 95% CI) | 0.74 [0.34, 1.62] |
| Outcome or subgroup title | No. of studies | No. of participants | Statistical method | Effect size |
| 6.1 Complete Miscarriage Show forest plot | 4 | Risk Ratio (IV, Random, 95% CI) | Subtotals only | |
| 6.1.1 Missed miscarriage | 1 | 107 | Risk Ratio (IV, Random, 95% CI) | 0.81 [0.71, 0.93] |
| 6.1.2 Incomplete miscarriage | 1 | 94 | Risk Ratio (IV, Random, 95% CI) | 0.92 [0.83, 1.01] |
| 6.1.3 Mixed population | 2 | 154 | Risk Ratio (IV, Random, 95% CI) | 0.32 [0.07, 1.47] |
| 6.2 Composite outcome of death or serious complication Show forest plot | 2 | 157 | Risk Ratio (IV, Random, 95% CI) | 1.26 [0.54, 2.97] |
| 6.3 Need for unplanned/emergency surgical procedure Show forest plot | 1 | 94 | Risk Ratio (IV, Random, 95% CI) | Not estimable |
| 6.4 Pain score Show forest plot | 1 | 94 | Std. Mean Difference (IV, Random, 95% CI) | 0.51 [0.10, 0.92] |
| 6.5 Pelvic inflammatory disease, sepsis or endometritis Show forest plot | 2 | 201 | Risk Ratio (IV, Random, 95% CI) | 2.12 [0.20, 22.64] |
| 6.6 Mean volumes of blood loss (millilitres) Show forest plot | 1 | 104 | Mean Difference (IV, Random, 95% CI) | 22.30 [4.45, 40.15] |
| 6.7 Days of bleeding Show forest plot | 1 | 94 | Mean Difference (IV, Random, 95% CI) | 2.60 [1.27, 3.93] |
| 6.8 Cervical tear Show forest plot | 1 | 107 | Risk Ratio (IV, Random, 95% CI) | Not estimable |
| 6.9 Re‐admission to hospital Show forest plot | 1 | 107 | Risk Ratio (IV, Random, 95% CI) | 3.17 [0.13, 76.11] |
| 6.10 Vomiting Show forest plot | 1 | 94 | Risk Ratio (IV, Random, 95% CI) | 0.33 [0.01, 7.98] |
| 6.11 Nausea Show forest plot | 1 | 94 | Risk Ratio (IV, Random, 95% CI) | 0.33 [0.01, 7.98] |
| 6.12 Diarrhoea Show forest plot | 1 | 94 | Risk Ratio (IV, Random, 95% CI) | 3.00 [0.13, 71.82] |
| 6.13 Depression score Show forest plot | 1 | 215 | Std. Mean Difference (IV, Random, 95% CI) | ‐0.09 [‐0.36, 0.18] |
| Outcome or subgroup title | No. of studies | No. of participants | Statistical method | Effect size |
| 7.1 Complete Miscarriage Show forest plot | 1 | Risk Ratio (IV, Random, 95% CI) | Subtotals only | |
| 7.2 Pyrexia Show forest plot | 1 | 200 | Risk Ratio (IV, Random, 95% CI) | 2.50 [0.81, 7.71] |
| Outcome or subgroup title | No. of studies | No. of participants | Statistical method | Effect size |
| 8.1 Complete Miscarriage Show forest plot | 10 | Risk Ratio (IV, Random, 95% CI) | Subtotals only | |
| 8.1.1 Missed miscarriage | 4 | 322 | Risk Ratio (IV, Random, 95% CI) | 3.18 [1.48, 6.85] |
| 8.1.2 Incomplete miscarriage | 2 | 108 | Risk Ratio (IV, Random, 95% CI) | 1.91 [0.44, 8.20] |
| 8.1.3 Mixed population | 4 | 408 | Risk Ratio (IV, Random, 95% CI) | 1.45 [0.97, 2.16] |
| 8.2 Composite outcome of death or serious complication Show forest plot | 6 | 548 | Risk Ratio (IV, Random, 95% CI) | 0.96 [0.06, 15.08] |
| 8.3 Need for unplanned/emergency surgical procedure Show forest plot | 5 | 437 | Risk Ratio (IV, Random, 95% CI) | 0.67 [0.23, 1.95] |
| 8.4 Pain score Show forest plot | 3 | 262 | Std. Mean Difference (IV, Random, 95% CI) | 0.33 [0.08, 0.57] |
| 8.5 Pelvic inflammatory disease, sepsis or endometritis Show forest plot | 6 | 615 | Risk Ratio (IV, Random, 95% CI) | 1.84 [0.35, 9.68] |
| 8.6 Change in haemoglobin measurements before and after the miscarriage Show forest plot | 2 | 167 | Mean Difference (IV, Random, 95% CI) | 0.15 [‐0.21, 0.52] |
| 8.7 Days of bleeding Show forest plot | 3 | Mean Difference (IV, Random, 95% CI) | Subtotals only | |
| 8.8 Mean duration of hospital stay (days) Show forest plot | 1 | 184 | Mean Difference (IV, Random, 95% CI) | ‐0.10 [‐0.19, ‐0.01] |
| 8.9 Re‐admission to hospital Show forest plot | 3 | 335 | Risk Ratio (IV, Random, 95% CI) | 1.25 [0.46, 3.35] |
| 8.10 Nausea Show forest plot | 5 | 389 | Risk Ratio (IV, Random, 95% CI) | 1.15 [0.93, 1.42] |
| 8.11 Vomiting Show forest plot | 6 | 506 | Risk Ratio (IV, Random, 95% CI) | 1.37 [0.75, 2.52] |
| 8.12 Diarrhoea Show forest plot | 7 | 560 | Risk Ratio (IV, Random, 95% CI) | 1.69 [1.05, 2.73] |
| 8.13 Pyrexia Show forest plot | 3 | 275 | Risk Ratio (IV, Random, 95% CI) | 4.03 [1.16, 13.97] |
| 8.14 Anxiety score Show forest plot | 1 | 117 | Std. Mean Difference (IV, Random, 95% CI) | ‐0.14 [‐0.51, 0.22] |
| 8.15 Depression score Show forest plot | 1 | 117 | Std. Mean Difference (IV, Random, 95% CI) | 0.08 [‐0.29, 0.44] |
| Outcome or subgroup title | No. of studies | No. of participants | Statistical method | Effect size |
| 9.1 Complete Miscarriage Show forest plot | 1 | Risk Ratio (IV, Random, 95% CI) | Subtotals only | |
| 9.1.1 Incomplete miscarriage | 1 | 155 | Risk Ratio (IV, Random, 95% CI) | 1.25 [1.12, 1.39] |
| 9.2 Pelvic inflammatory disease, sepsis or endometritis Show forest plot | 1 | 155 | Risk Ratio (IV, Random, 95% CI) | 3.30 [0.82, 13.28] |
| 9.3 Days of bleeding Show forest plot | 1 | 155 | Mean Difference (IV, Random, 95% CI) | ‐1.26 [‐2.27, ‐0.25] |
| Outcome or subgroup title | No. of studies | No. of participants | Statistical method | Effect size |
| 10.1 Complete Miscarriage Show forest plot | 3 | Risk Ratio (IV, Random, 95% CI) | Subtotals only | |
| 10.1.1 Missed miscarriage | 1 | 614 | Risk Ratio (IV, Random, 95% CI) | 1.25 [1.09, 1.45] |
| 10.1.2 Incomplete miscarriage | 1 | 122 | Risk Ratio (IV, Random, 95% CI) | 1.08 [0.90, 1.30] |
| 10.1.3 Mixed population | 1 | 174 | Risk Ratio (IV, Random, 95% CI) | 3.44 [2.31, 5.11] |
| 10.2 Composite outcome of death or serious complication Show forest plot | 2 | 788 | Risk Ratio (IV, Random, 95% CI) | 0.43 [0.11, 1.63] |
| 10.3 Need for unplanned/emergency surgical procedure Show forest plot | 2 | 296 | Risk Ratio (IV, Random, 95% CI) | 0.32 [0.11, 0.90] |
| 10.4 Pain score Show forest plot | 1 | 122 | Std. Mean Difference (IV, Random, 95% CI) | 0.14 [‐0.21, 0.50] |
| 10.5 Pelvic inflammatory disease, sepsis or endometritis Show forest plot | 2 | 736 | Risk Ratio (IV, Random, 95% CI) | 0.73 [0.30, 1.80] |
| 10.6 Days of bleeding Show forest plot | 1 | 122 | Mean Difference (IV, Random, 95% CI) | 0.70 [‐0.43, 1.83] |
| 10.7 Pyrexia Show forest plot | 1 | 174 | Risk Ratio (IV, Random, 95% CI) | 0.32 [0.01, 7.71] |