| 1 Aberrant right subclavian artery Show forest plot | 1 | 425 |
|
| 2 Frontomaxillary facial angle >95 percentile Show forest plot | 1 | 242 |
|
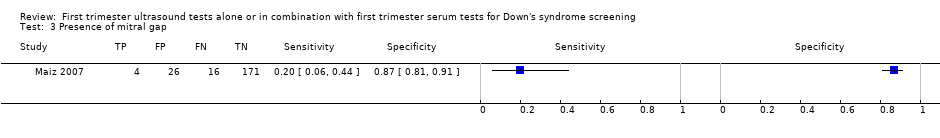
| 3 Presence of mitral gap Show forest plot | 1 | 217 |
|
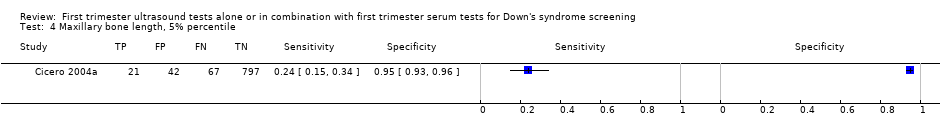
| 4 Maxillary bone length, 5% percentile Show forest plot | 1 | 927 |
|
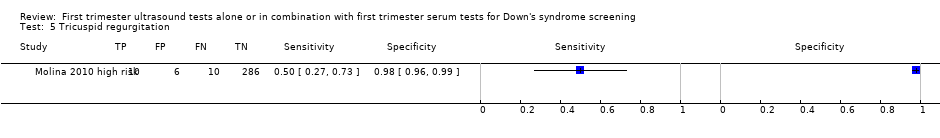
| 5 Tricuspid regurgitation Show forest plot | 1 | 312 |
|
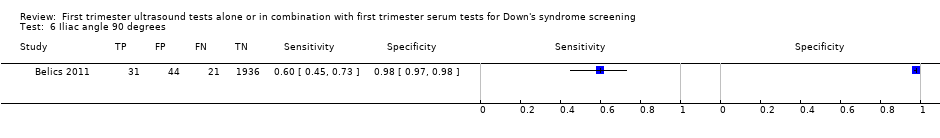
| 6 Iliac angle 90 degrees Show forest plot | 1 | 2032 |
|
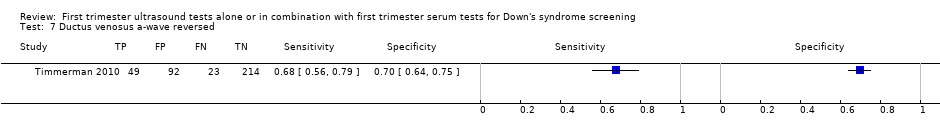
| 7 Ductus venosus a‐wave reversed Show forest plot | 1 | 378 |
|
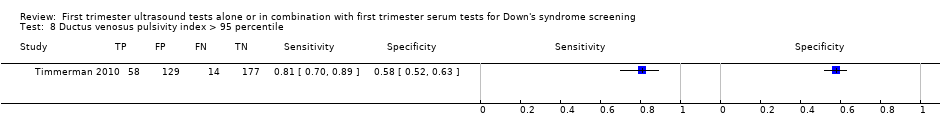
| 8 Ductus venosus pulsivity index > 95 percentile Show forest plot | 1 | 378 |
|
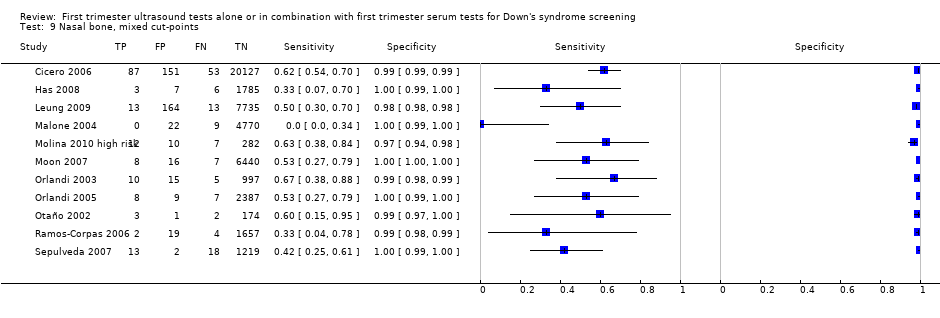
| 9 Nasal bone, mixed cut‐points Show forest plot | 11 | 48279 |
|
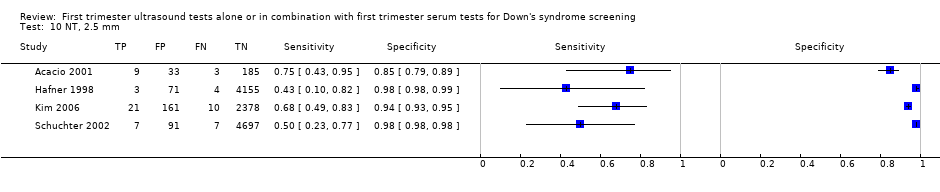
| 10 NT, 2.5 mm Show forest plot | 4 | 11835 |
|
| 11 NT, 3 mm Show forest plot | 6 | 10381 |
|
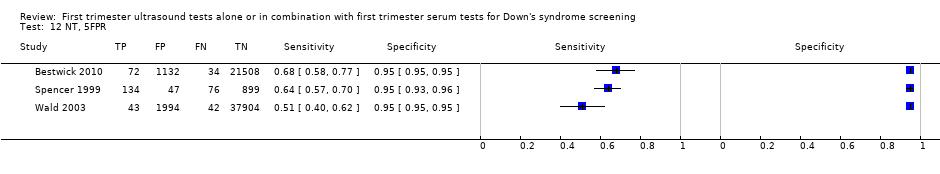
| 12 NT, 5FPR Show forest plot | 3 | 63885 |
|
| 13 NT, mixed cut‐points Show forest plot | 13 | 90978 |
|
| 14 NT and age, risk 1:100 Show forest plot | 1 | 10668 |
|
| 15 NT and age, risk 1:250 Show forest plot | 10 | 79412 |
|
| 16 NT and age, risk 1:300 Show forest plot | 23 | 252811 |
|
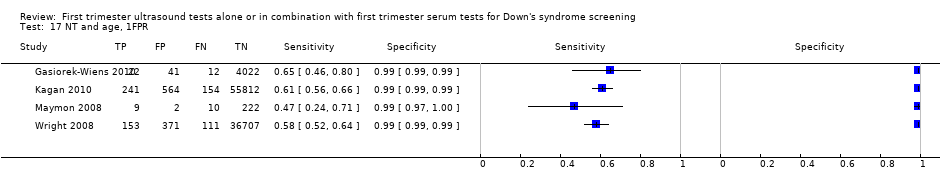
| 17 NT and age, 1FPR Show forest plot | 4 | 98453 |
|
| 18 NT and age, 3FPR Show forest plot | 4 | 98453 |
|
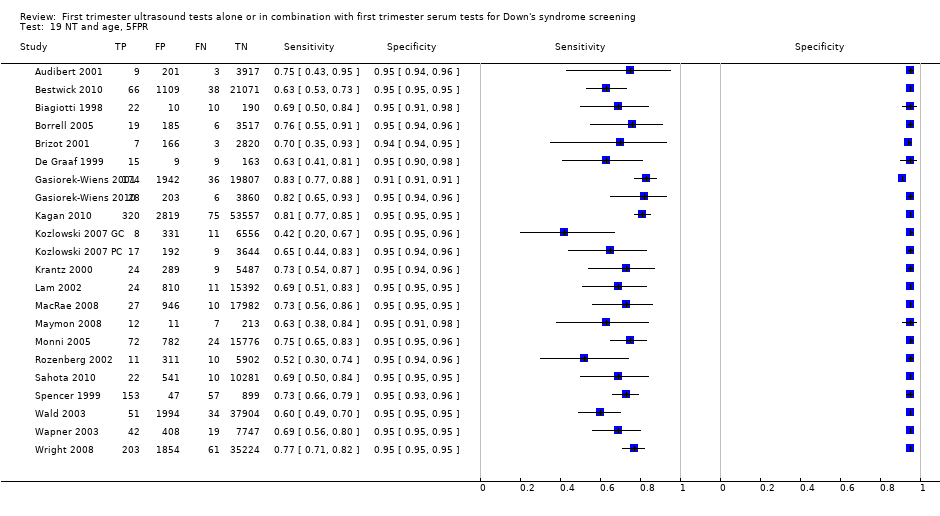
| 19 NT and age, 5FPR Show forest plot | 22 | 288853 |
|
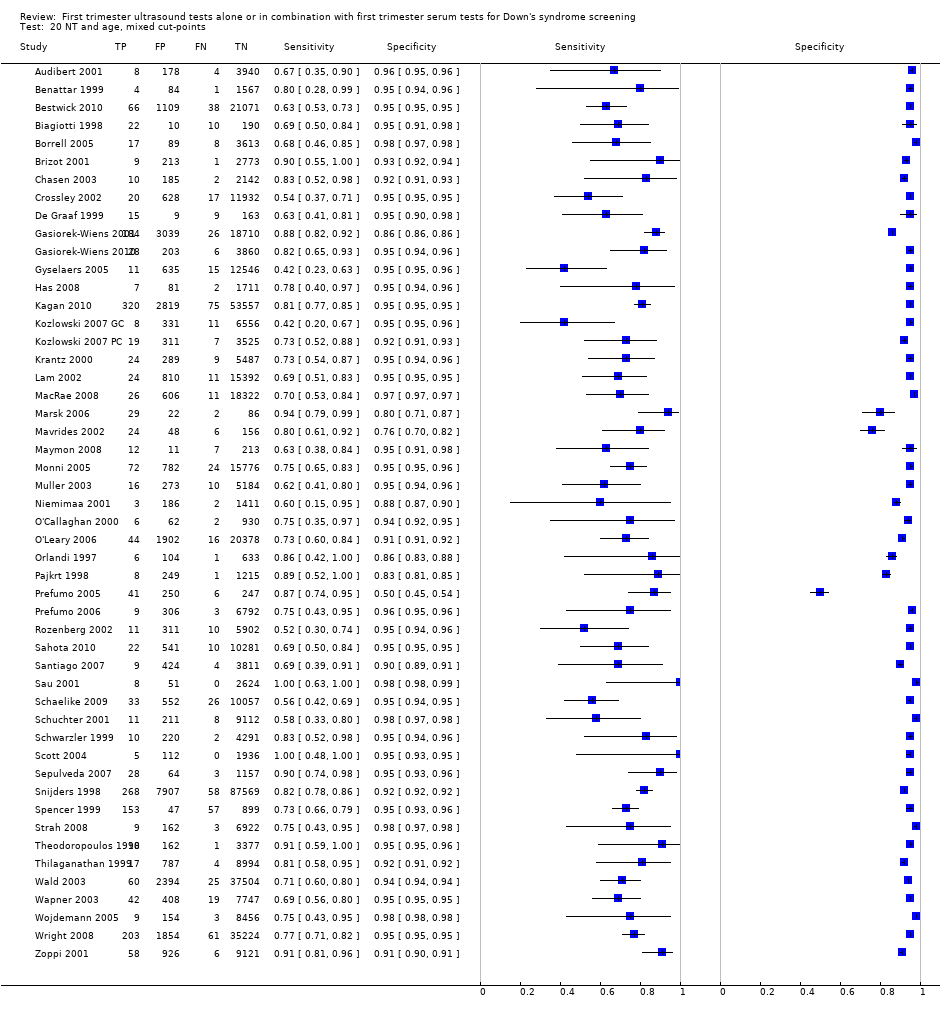
| 20 NT and age, mixed cut‐points Show forest plot | 50 | 530874 |
|
| 21 NT and nasal bone, Absent NB + NT ≥ 95th centile Show forest plot | 1 | 486 |
|
| 22 Ductus and age, risk 1:250 Show forest plot | 1 | 3731 |
|
| 23 Ductus and age, 5FPR Show forest plot | 2 | 3965 |
|
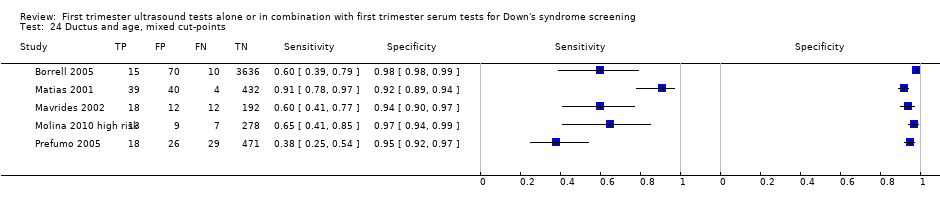
| 24 Ductus and age, mixed cut‐points Show forest plot | 5 | 5331 |
|
| 25 Ductus, NT and age, risk 1:100 Show forest plot | 1 | 19736 |
|
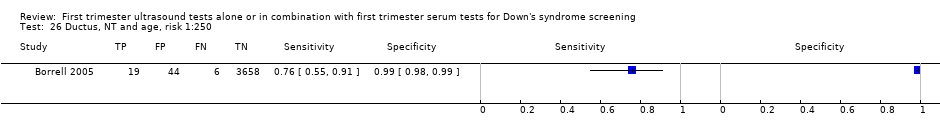
| 26 Ductus, NT and age, risk 1:250 Show forest plot | 1 | 3727 |
|
| 27 Ductus, NT and age, 5FPR Show forest plot | 2 | 3961 |
|
| 28 Ductus, NT and age, mixed cut‐points Show forest plot | 3 | 23697 |
|
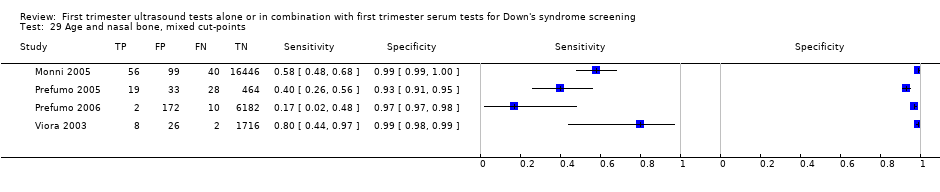
| 29 Age and nasal bone, mixed cut‐points Show forest plot | 4 | 25303 |
|
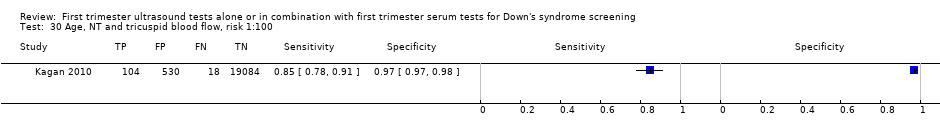
| 30 Age, NT and tricuspid blood flow, risk 1:100 Show forest plot | 1 | 19736 |
|
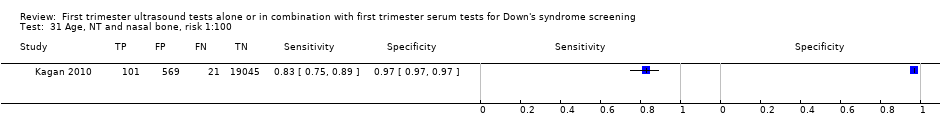
| 31 Age, NT and nasal bone, risk 1:100 Show forest plot | 1 | 19736 |
|
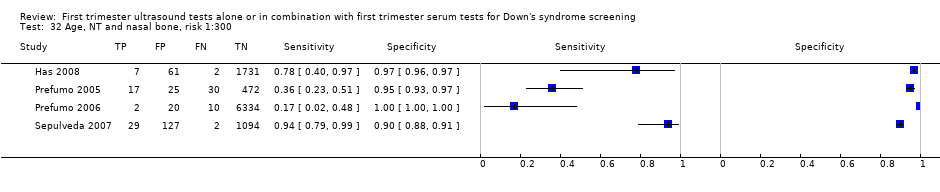
| 32 Age, NT and nasal bone, risk 1:300 Show forest plot | 4 | 9963 |
|
| 33 Age, NT and nasal bone, mixed cut‐points Show forest plot | 5 | 29699 |
|
| 34 Age, NT, nasal bone and ductus, risk NT>1:300 AND abnormal DV flow AND absent NB Show forest plot | 1 | 544 |
|
| 35 Age, NT, nasal bone, free ßhCG and PAPP‐A, 1st trimester, 5FPR Show forest plot | 1 | 20305 |
|
| 36 Age, NT, nasal bone, free ßhCG and PAPP‐A, 1st trimester, mixed cut‐points Show forest plot | 3 | 41842 |
|
| 37 Age, NT and free ßhCG, 1st trimester, 5FPR Show forest plot | 4 | 4986 |
|
| 38 Age, NT and free ßhCG, 1st trimester, risk 1:240 Show forest plot | 1 | 5809 |
|
| 39 Age, NT and free ßhCG, 1st trimester, mixed cut‐points Show forest plot | 5 | 10795 |
|
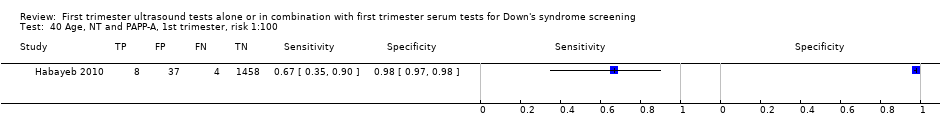
| 40 Age, NT and PAPP‐A, 1st trimester, risk 1:100 Show forest plot | 1 | 1507 |
|
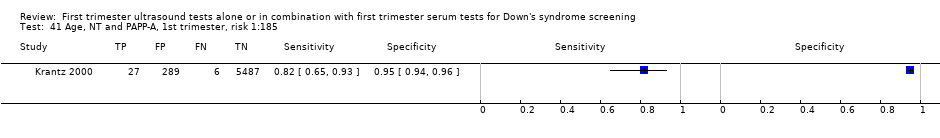
| 41 Age, NT and PAPP‐A, 1st trimester, risk 1:185 Show forest plot | 1 | 5809 |
|
| 42 Age, NT and PAPP‐A, 1st trimester, 5FPR Show forest plot | 3 | 2498 |
|
| 43 Age, NT and PAPP‐A, 1st trimester, mixed cut‐points Show forest plot | 5 | 9814 |
|
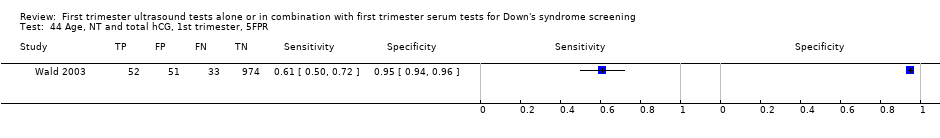
| 44 Age, NT and total hCG, 1st trimester, 5FPR Show forest plot | 1 | 1110 |
|
| 45 Age, NT and AFP, 1st trimester, 5FPR Show forest plot | 1 | 1110 |
|
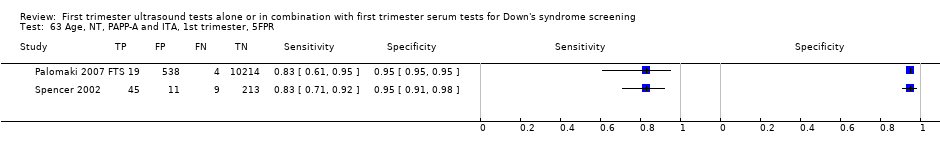
| 46 Age, NT and ITA, 1st trimester, 5FPR Show forest plot | 1 | 278 |
|
| 47 Age, NT and inhibin, 1st trimester, risk 1:100 Show forest plot | 1 | 40 |
|
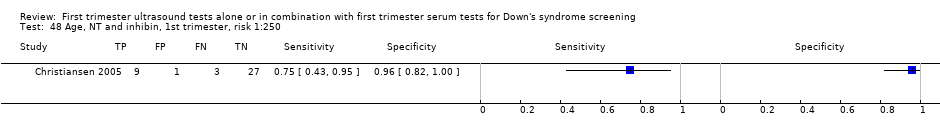
| 48 Age, NT and inhibin, 1st trimester, risk 1:250 Show forest plot | 1 | 40 |
|
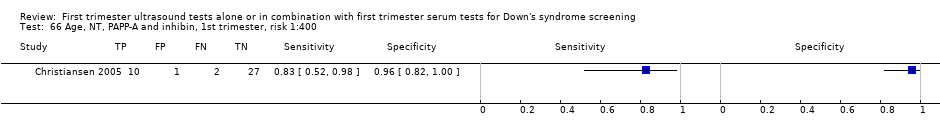
| 49 Age, NT and inhibin, 1st trimester, risk 1:400 Show forest plot | 1 | 40 |
|
| 50 Age, NT and inhibin, 1st trimester, 5FPR Show forest plot | 1 | 1110 |
|
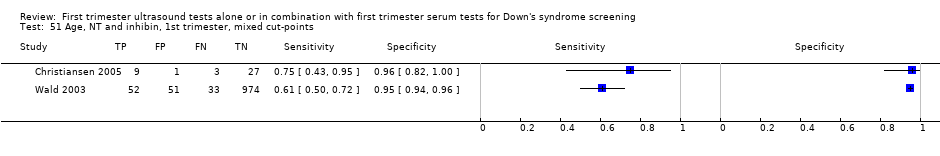
| 51 Age, NT and inhibin, 1st trimester, mixed cut‐points Show forest plot | 2 | 1150 |
|
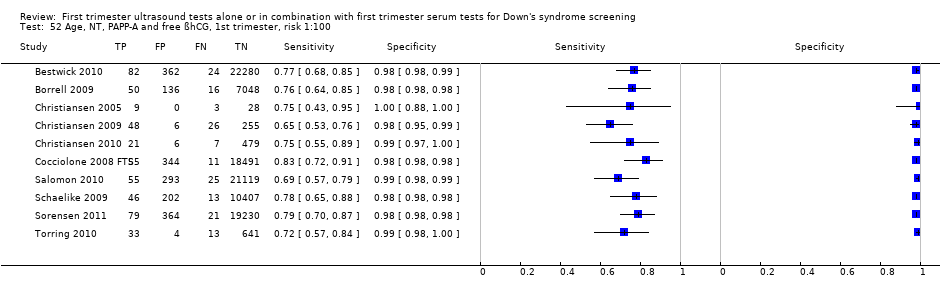
| 52 Age, NT, PAPP‐A and free ßhCG, 1st trimester, risk 1:100 Show forest plot | 10 | 102332 |
|
| 53 Age, NT, PAPP‐A and free ßhCG, 1st trimester, risk 1:150 Show forest plot | 5 | 177643 |
|
| 54 Age, NT, PAPP‐A and free ßhCG, 1st trimester, risk 1:200 Show forest plot | 8 | 135768 |
|
| 55 Age, NT, PAPP‐A and free ßhCG, 1st trimester, risk 1:220 Show forest plot | 1 | 2231 |
|
| 56 Age, NT, PAPP‐A and free ßhCG, 1st trimester, risk 1:250 Show forest plot | 25 | 174712 |
|
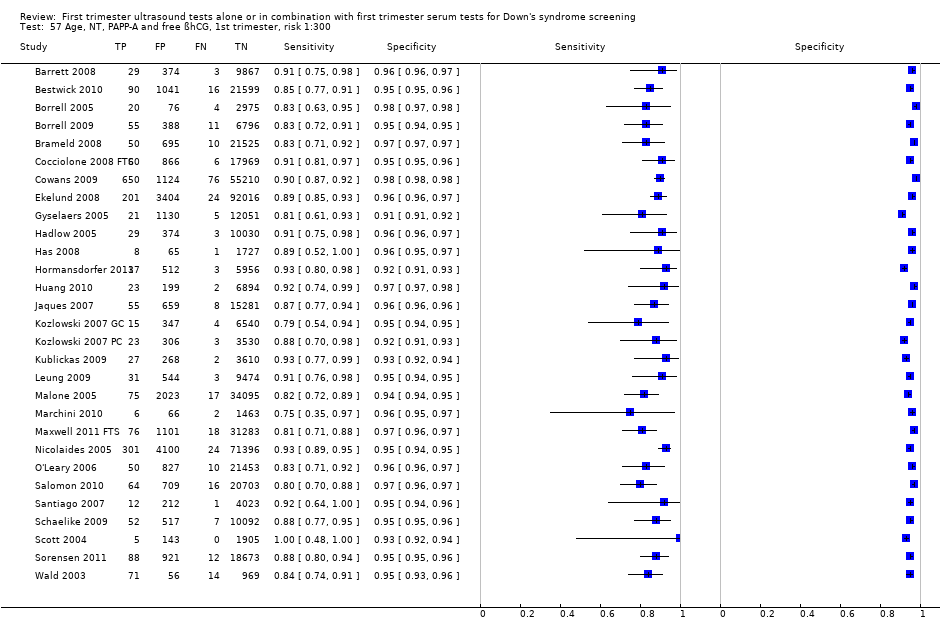
| 57 Age, NT, PAPP‐A and free ßhCG, 1st trimester, risk 1:300 Show forest plot | 29 | 544681 |
|
| 58 Age, NT, PAPP‐A and free ßhCG, 1st trimester, 1FPR Show forest plot | 7 | 88874 |
|
| 59 Age, NT, PAPP‐A and free ßhCG, 1st trimester, 3FPR Show forest plot | 9 | 312680 |
|
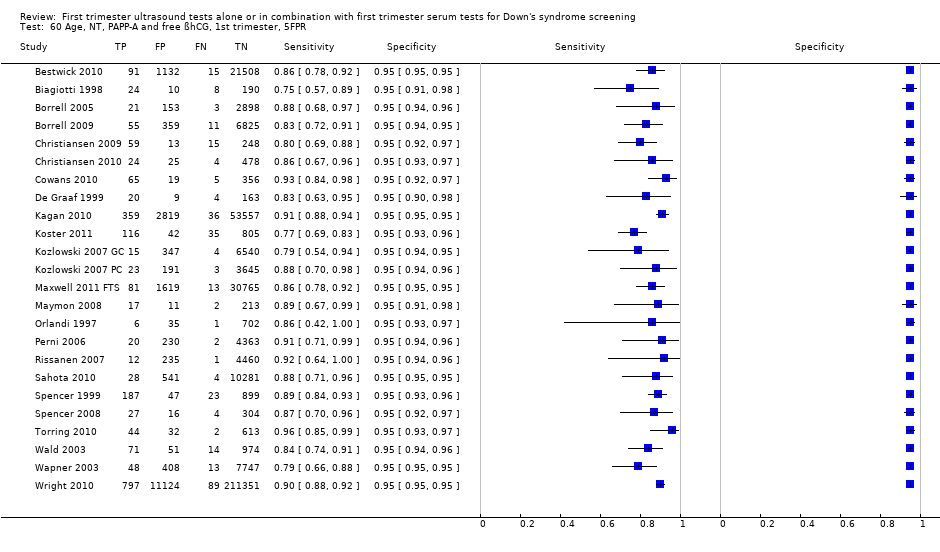
| 60 Age, NT, PAPP‐A and free ßhCG, 1st trimester, 5FPR Show forest plot | 24 | 391874 |
|
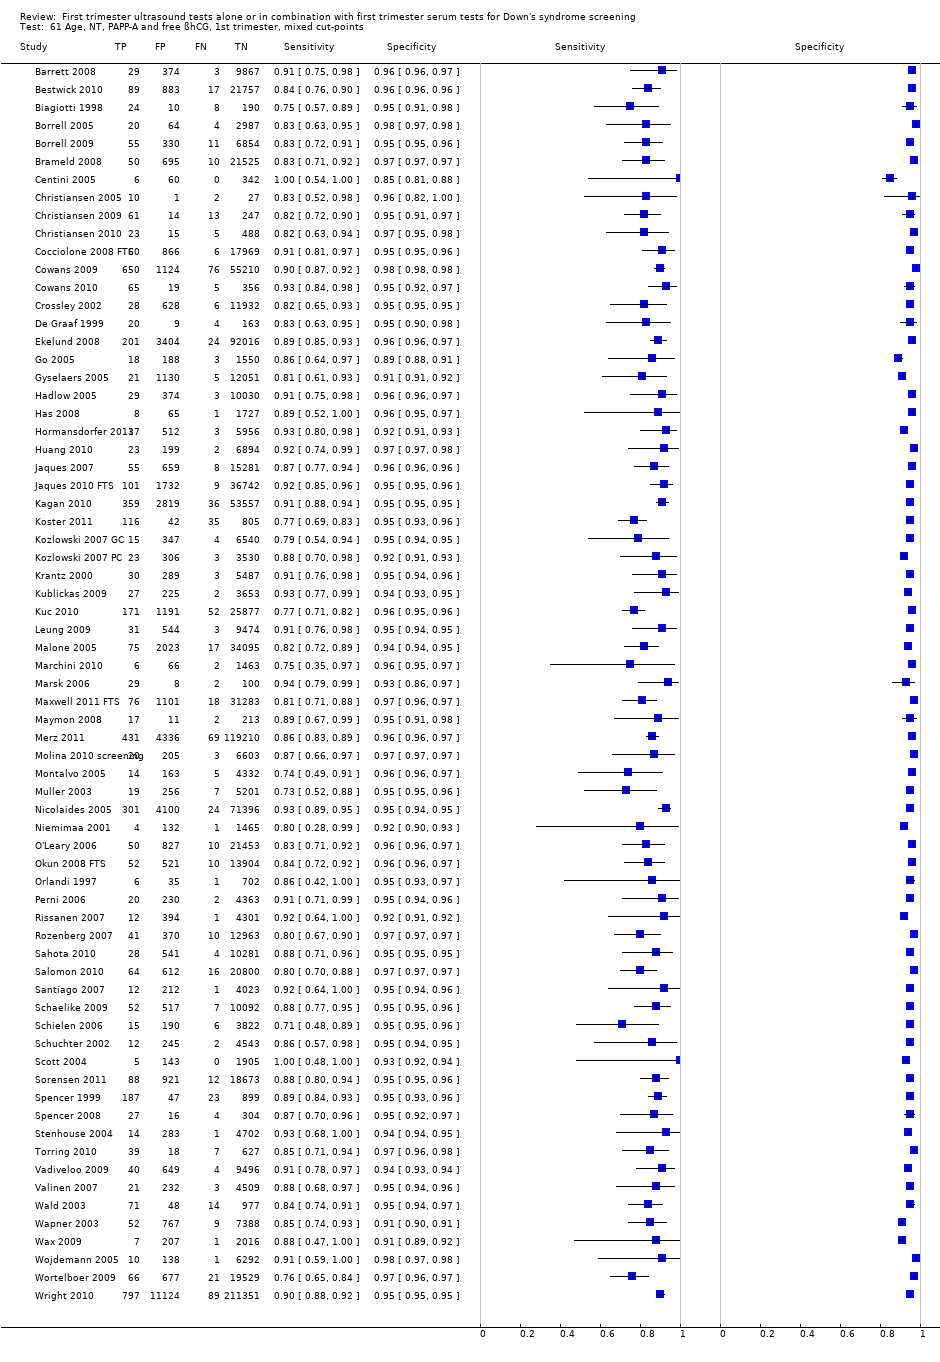
| 61 Age, NT, PAPP‐A and free ßhCG, 1st trimester, mixed cut‐points Show forest plot | 69 | 1173853 |
|
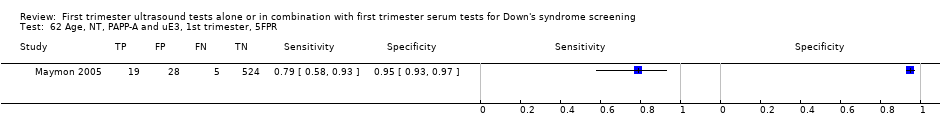
| 62 Age, NT, PAPP‐A and uE3, 1st trimester, 5FPR Show forest plot | 1 | 576 |
|
| 63 Age, NT, PAPP‐A and ITA, 1st trimester, 5FPR Show forest plot | 2 | 11053 |
|
| 64 Age, NT, PAPP‐A and inhibin, 1st trimester, risk 1:100 Show forest plot | 1 | 40 |
|
| 65 Age, NT, PAPP‐A and inhibin, 1st trimester, risk 1:250 Show forest plot | 1 | 40 |
|
| 66 Age, NT, PAPP‐A and inhibin, 1st trimester, risk 1:400 Show forest plot | 1 | 40 |
|
| 67 Age, NT, PAPP‐A and inhibin, 1st trimester, 5FPR Show forest plot | 1 | 1110 |
|
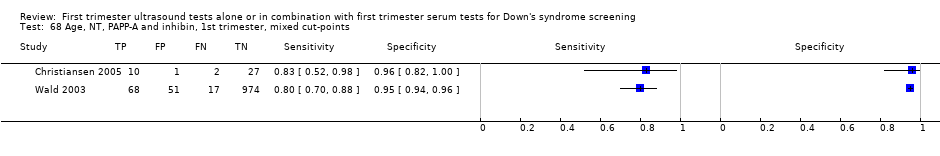
| 68 Age, NT, PAPP‐A and inhibin, 1st trimester, mixed cut‐points Show forest plot | 2 | 1150 |
|
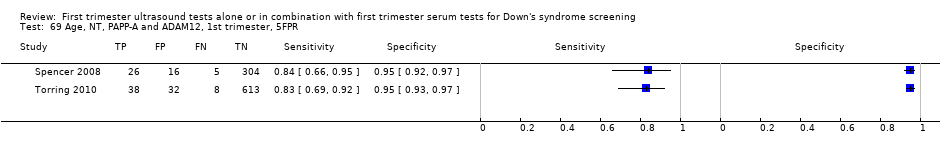
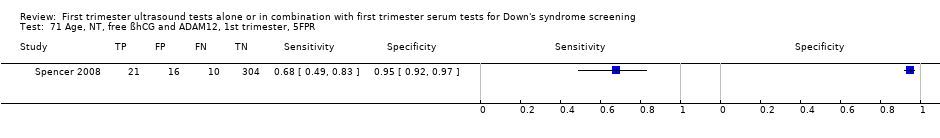
| 69 Age, NT, PAPP‐A and ADAM12, 1st trimester, 5FPR Show forest plot | 2 | 1042 |
|
| 70 Age, NT, PAPP‐A and ADAM12, 1st trimester, risk 1:250 Show forest plot | 1 | 691 |
|
| 71 Age, NT, free ßhCG and ADAM12, 1st trimester, 5FPR Show forest plot | 1 | 351 |
|
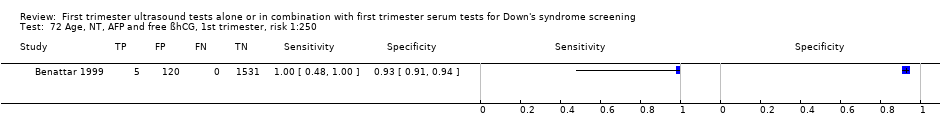
| 72 Age, NT, AFP and free ßhCG, 1st trimester, risk 1:250 Show forest plot | 1 | 1656 |
|
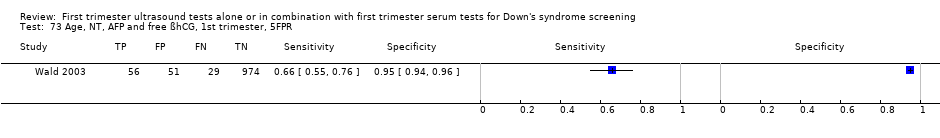
| 73 Age, NT, AFP and free ßhCG, 1st trimester, 5FPR Show forest plot | 1 | 1110 |
|
| 74 Age, NT, AFP and free ßhCG, 1st trimester, mixed cut‐points Show forest plot | 2 | 2766 |
|
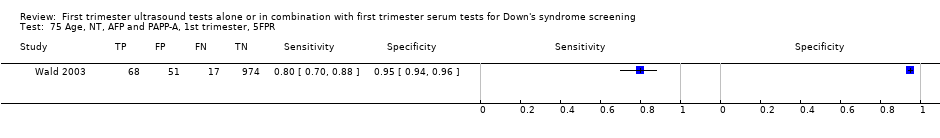
| 75 Age, NT, AFP and PAPP‐A, 1st trimester, 5FPR Show forest plot | 1 | 1110 |
|
| 76 Age, NT, total hCG and PAPP‐A, 1st trimester, 5FPR Show forest plot | 1 | 1110 |
|
| 77 Age, NT, total hCG and inhibin, 1st trimester, 5FPR Show forest plot | 1 | 1110 |
|
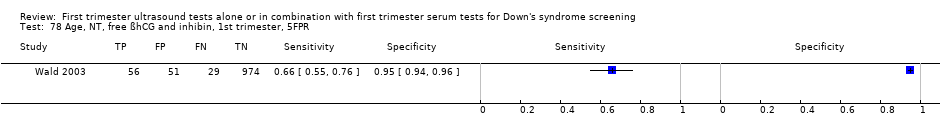
| 78 Age, NT, free ßhCG and inhibin, 1st trimester, 5FPR Show forest plot | 1 | 1110 |
|
| 79 Age, NT, PAPP‐A, free ßhCG, 1st trimester serum, ductus venosus pulsivity index, 5FPR Show forest plot | 1 | 7250 |
|
| 80 Age, free ßhCG and PAPP‐A, if risk 1:42‐1:1000, NT, final 1:250 risk Show forest plot | 1 | 10189 |
|
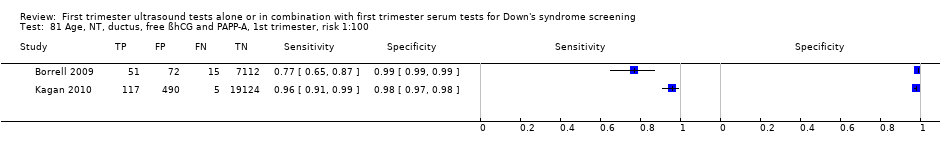
| 81 Age, NT, ductus, free ßhCG and PAPP‐A, 1st trimester, risk 1:100 Show forest plot | 2 | 26986 |
|
| 82 Age, NT, ductus, free ßhCG and PAPP‐A, 1st trimester, risk 1:250 Show forest plot | 2 | 10325 |
|
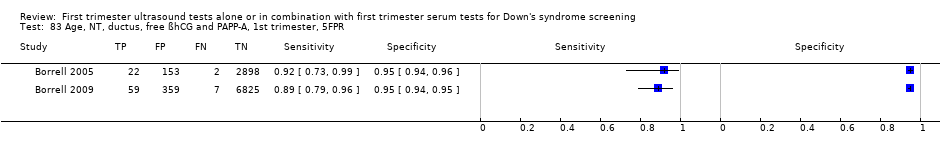
| 83 Age, NT, ductus, free ßhCG and PAPP‐A, 1st trimester, 5FPR Show forest plot | 2 | 10325 |
|
| 84 Age, NT, ductus, free ßhCG and PAPP‐A, 1st trimester, mixed cut‐points Show forest plot | 3 | 30061 |
|
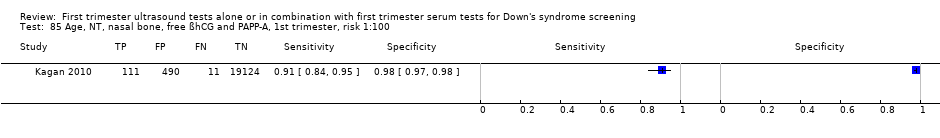
| 85 Age, NT, nasal bone, free ßhCG and PAPP‐A, 1st trimester, risk 1:100 Show forest plot | 1 | 19736 |
|
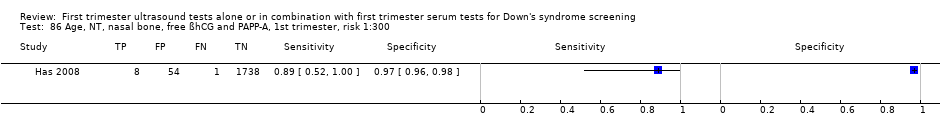
| 86 Age, NT, nasal bone, free ßhCG and PAPP‐A, 1st trimester, risk 1:300 Show forest plot | 1 | 1801 |
|
| 87 Age, NT, tricuspid blood flow, free ßhCG and PAPP‐A, 1st trimester, risk 1:100 Show forest plot | 1 | 19736 |
|
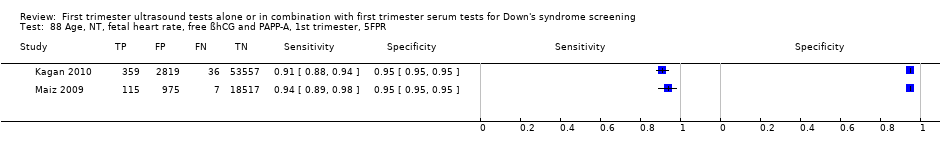
| 88 Age, NT, fetal heart rate, free ßhCG and PAPP‐A, 1st trimester, 5FPR Show forest plot | 2 | 76385 |
|
| 89 Age, NT, fetal heart rate, nasal bone, free ßhCG and PAPP‐A, 1st trimester, risk 1:200 Show forest plot | 1 | 19736 |
|
| 90 age, NT, fetal heart rate, ductus, free ßhCG and PAPP‐A, 1st trimester, 5FPR Show forest plot | 1 | 19614 |
|
| 91 Age, NT, fetal heart rate, tricuspid blood flow, free ßhCG and PAPP‐A,1st trimester, 5FPR Show forest plot | 1 | 19736 |
|
| 92 Age, NT, AFP, free ßhCG and PAPP‐A, 1st trimester, risk 1:250 Show forest plot | 1 | 5483 |
|
| 93 Age, NT, AFP, free ßhCG and PAPP‐A, 1st trimester, 5FPR Show forest plot | 2 | 1306 |
|
| 94 Age, NT, AFP, free ßhCG and PAPP‐A, 1st trimester, mixed cut‐points Show forest plot | 3 | 6789 |
|
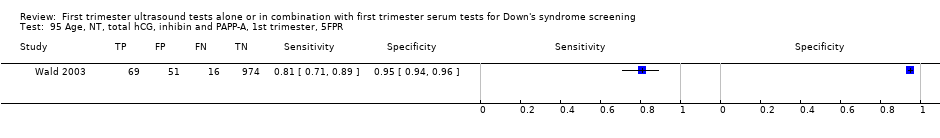
| 95 Age, NT, total hCG, inhibin and PAPP‐A, 1st trimester, 5FPR Show forest plot | 1 | 1110 |
|
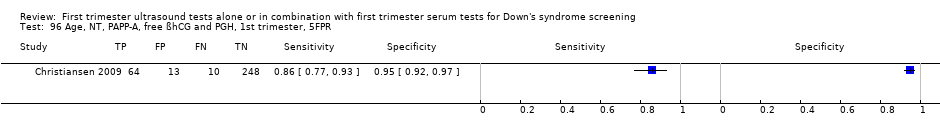
| 96 Age, NT, PAPP‐A, free ßhCG and PGH, 1st trimester, 5FPR Show forest plot | 1 | 335 |
|
| 97 Age, NT, PAPP‐A, free ßhCG and GHBP, 1st trimester, 5FPR Show forest plot | 1 | 335 |
|
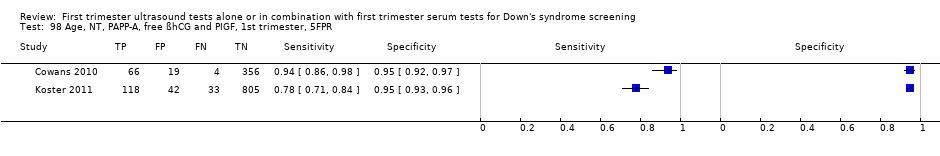
| 98 Age, NT, PAPP‐A, free ßhCG and PIGF, 1st trimester, 5FPR Show forest plot | 2 | 1443 |
|
| 99 Age, NT, PAPP‐A, free ßhCG and total hCG, 1st trimester, 5FPR Show forest plot | 1 | 998 |
|
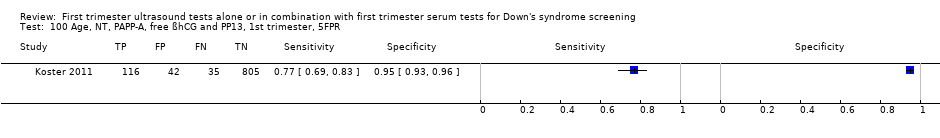
| 100 Age, NT, PAPP‐A, free ßhCG and PP13, 1st trimester, 5FPR Show forest plot | 1 | 998 |
|
| 101 Age, NT, PAPP‐A, free ßhCG and ADAM12, 1st trimester, 5FPR Show forest plot | 4 | 2571 |
|
| 102 Age, NT, PAPP‐A, free ßhCG and ADAM12, 1st trimester, risk 1:250 Show forest plot | 2 | 1222 |
|
| 103 Age, NT, PAPP‐A, free ßhCG and ADAM12, 1st trimester, mixed cut‐points Show forest plot | 4 | 2571 |
|
| 104 Age, NT, free ßhCG, PAPP‐A and inhibin, 1st trimester, risk 1:100 Show forest plot | 1 | 40 |
|
| 105 Age, NT, free ßhCG, PAPP‐A and inhibin, 1st trimester, risk 1:250 Show forest plot | 1 | 40 |
|
| 106 Age, NT, free ßhCG, PAPP‐A and inhibin, 1st trimester, risk 1:400 Show forest plot | 1 | 40 |
|
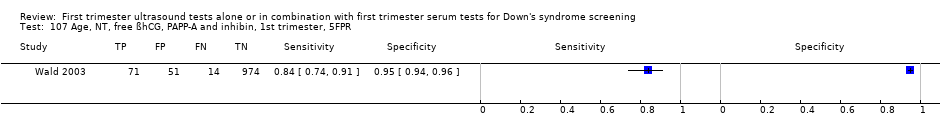
| 107 Age, NT, free ßhCG, PAPP‐A and inhibin, 1st trimester, 5FPR Show forest plot | 1 | 1110 |
|
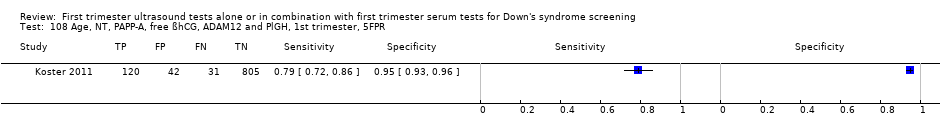
| 108 Age, NT, PAPP‐A, free ßhCG, ADAM12 and PlGH, 1st trimester, 5FPR Show forest plot | 1 | 998 |
|
| 109 Age, NT, total hCG, inhibin, PAPP‐A, AFP and uE3, 1st trimester, 5FPR Show forest plot | 1 | 1110 |
|
| 110 Age, NT, free ßhCG, inhibin, PAPP‐A, AFP and uE3,1st trimester, 5FPR Show forest plot | 1 | 1110 |
|
| 111 Age, NT, PAPP‐A, free ßhCG, ADAM12, total hCG and PlGF, 1st trimester, 5FPR Show forest plot | 1 | 998 |
|
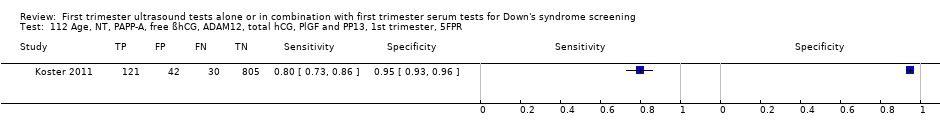
| 112 Age, NT, PAPP‐A, free ßhCG, ADAM12, total hCG, PlGF and PP13, 1st trimester, 5FPR Show forest plot | 1 | 998 |
|
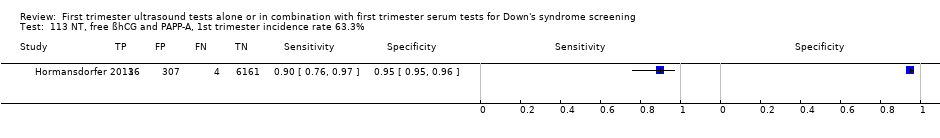
| 113 NT, free ßhCG and PAPP‐A, 1st trimester incidence rate 63.3% Show forest plot | 1 | 6508 |
|
| 114 NT, PAPP‐A, free ßhCG and maternal age ‐ maternal age < 35 years Show forest plot | 5 | 19057 |
|
| 115 NT, PAPP‐A, free ßhCG and maternal age ‐ maternal age ≥ 35 years Show forest plot | 5 | 10980 |
|