Ecografía para el diagnóstico de la discordancia de peso al nacer en embarazos gemelares
Resumen
Antecedentes
Es necesario estandarizar la monitorización en la investigación obstétrica de los embarazos gemelares. La identificación de la discordancia de peso al nacer (DPN), definida como una diferencia en los pesos al nacer de los gemelos, es un fenómeno bien documentado en los embarazos gemelares. La ecografía para el diagnóstico de la DPN fundamenta la toma de decisiones complejas, como la de intervenir médicamente (mediante fotocoagulación con láser) o hacer nacer a los gemelos para evitar la morbilidad fetal o incluso la muerte. La pregunta es: ¿cuál es la precisión de esta medición?
Objetivos
Determinar la exactitud diagnóstica (sensibilidad y especificidad) de la discordancia del peso fetal estimado por ecografía (DPFE) del 20% y el 25% mediante diferentes mediciones ecográficas biométricas estimadas, en comparación con la DPN real como el estándar de referencia en embarazos gemelares.
Métodos de búsqueda
La búsqueda para esta revisión se realizó el 15 de marzo de 2019. Se realizaron búsquedas en CENTRAL, MEDLINE (Ovid), Embase (Ovid), otras siete bases de datos, resúmenes de congresos, listas de referencias y se estableció contacto con expertos. No se aplicaron restricciones de idioma o fecha a las búsquedas electrónicas, ni filtros metodológicos para maximizar la sensibilidad.
Criterios de selección
Se seleccionaron los estudios de tipo cohortes con verificación diferida, que evaluaron la exactitud de las mediciones biométricas mediante ecografía de embarazos gemelares que se habían propuesto para el diagnóstico de la DPN estimada, en comparación con las mediciones de la DPN después del parto como un estándar de referencia. Además, solo se seleccionaron los estudios que consideraron los embarazos gemelares y aplicaron un estándar de referencia para la DPFE para la condición objetivo DPN.
Obtención y análisis de los datos
Se revisaron todos los títulos generados por las búsquedas en las bases de datos electrónicas. Dos autores de la revisión evaluaron de forma independiente los resúmenes de todos los estudios potencialmente relevantes. Se evaluó la elegibilidad de los artículos completos identificados y se extrajeron los datos para crear tablas de 2 × 2. Dos autores de la revisión realizaron de forma independiente la evaluación de la calidad mediante la herramienta QUADAS‐2. Se excluyeron los estudios que no informaron los datos con suficiente detalle para construir tablas de 2 × 2, y cuyos investigadores principales no disponían de esta información. La certeza de la evidencia se evaluó mediante el método GRADE.
Resultados principales
Se incluyeron 39 estudios elegibles con una mediana del tamaño muestral de los estudios de 140. En cuanto al riesgo de sesgo, había muchas afirmaciones poco claras sobre la selección de las pacientes, la prueba índice y el uso de un estándar de referencia adecuado. Veintiún estudios (53%) presentaban problemas metodológicos debido al flujo y al momento de evaluación. En cuanto a la aplicabilidad la mayoría de los estudios tuvieron pocos problemas.
Ecografía para el diagnóstico de la DPN en embarazos gemelares con un corte del 20%
Veintidós estudios proporcionaron datos de una DPN del 20% y la estimación general de la sensibilidad fue 0,51 (IC del 95%: 0,42 a 0,60) y la estimación general de la especificidad fue 0,91 (IC del 95%: 0,89 a 0,93) (8005 embarazos gemelares; evidencia de certeza muy baja).
Ecografía para el diagnóstico de la DPN en embarazos gemelares con un corte del 25%
Dieciocho estudios proporcionaron datos de una DPN del 25%. La estimación general de la sensibilidad fue 0,46 (IC del 95%: 0,26 a 0,66) y la estimación general de la especificidad fue 0,93 (IC del 95%: 0,89 a 0,96) (6471 embarazos gemelares; evidencia de certeza muy baja).
Los análisis de subgrupos fueron posibles para la DPM del 20% y del 25%. La precisión diagnóstica no difirió significativamente entre la estimación por la circunferencia abdominal y la longitud del fémur, pero la longitud del fémur tuvo una tendencia hacia una mayor sensibilidad y especificidad. No fue posible realizar análisis de subgrupos por el sexo de los gemelos, la corionicidad o la edad gestacional debido a los datos insuficientes.
Conclusiones de los autores
Evidencia de certeza muy baja indica que la DPFE identificada por ecografía tiene una baja sensibilidad pero una buena especificidad en la detección de la DPN en embarazos gemelares. El valor diagnóstico de la DPFE no está claro; esta revisión indica que no hay evidencia suficiente para apoyar este índice como única medida para la toma de decisiones clínicas al evaluar el pronóstico de los gemelos con discordancia en el crecimiento. Es necesario evaluar la precisión diagnóstica de otras medidas, como el índice de líquido amniótico y los índices resistivos Doppler de la arteria umbilical, en combinación con la ecografía para la intervención clínica. Futuros estudios bien diseñados podrían evaluar también el impacto de la corionicidad, el sexo y la edad gestacional en la precisión diagnóstica de la ecografía para la DPFE.
Resumen en términos sencillos
Ecografía durante el embarazo para predecir las diferencias de peso al nacer entre gemelos
Antecedentes
Las diferencias de peso al nacer de más del 20% en los gemelos se asocian con desenlaces deficientes para la madre y el recién nacido. Los médicos miden las diferencias de peso fetal estimadas mediante ecografía antes del parto y las comparan con las diferencias de peso de los recién nacidos. En esta revisión se resumieron los datos sobre si las mediciones ecográficas son lo suficientemente precisas para predecir las diferencias de peso al nacer en los gemelos.
Características de los estudios
Se buscaron en las bases de datos médicas hasta marzo de 2019 estudios que compararan las mediciones ecográficas con las diferencias de peso al nacer y se identificaron 39 estudios. Veintidós estudios proporcionaron datos sobre diferencias de peso al nacer del 20% y 18 estudios proporcionaron datos sobre diferencias de peso al nacer del 25%.
Calidad de la evidencia
La calidad de los estudios individuales se evaluó mediante una herramienta llamada "Quality Assessment of Diagnostic Accuracy Studies" (QUADAS‐2) y la calidad global mediante un método recomendado llamado GRADE para conocer la fiabilidad de la evidencia.
Resultados clave
Se encontró que la estimación ecográfica de las diferencias de peso fetal en comparación con las diferencias de peso al nacer no era fiable. Como promedio, la ecografía detectó diferencias de peso al nacer del 20% y el 25% sólo la mitad de las veces. La calidad de la evidencia fue muy baja.
No hay evidencia suficiente que apoye el uso de la ecografía como única medida para detectar las diferencias de peso al nacer en los gemelos, o los desenlaces deficientes. Es necesario evaluar la precisión diagnóstica de otras medidas, como el volumen de líquido amniótico (el líquido que rodea a los fetos en el útero) o los estudios Doppler (que utilizan ondas sonoras para detectar el movimiento de la sangre en los vasos sanguíneos de los fetos y el cordón umbilical) en combinación con la ecografía para fundamentar las decisiones clínicas. Futuros estudios bien diseñados también podrían investigar el impacto de si los fetos comparten una placenta (o no), el sexo de los fetos y la edad gestacional (tiempo desde el último período menstrual de la mujer), en la precisión diagnóstica de la ecografía para las diferencias estimadas de peso al nacer.
Authors' conclusions
Summary of findings
| Sensitivity | 0.51 (95% CI 0.42 to 0.60) | Prevalencesa | 18% | 15% | 28% | ||||||
|---|---|---|---|---|---|---|---|---|---|---|---|
| Specificity | 0.91 (95% CI 0.89 to 0.93) | ||||||||||
| Outcome | No. of studies and participants | Study design | Factors that may decrease certainty | Effect per 1000 women tested | |||||||
| Risk of bias | Indirectness | Inconsistency | Imprecision | Publication bias | Pretest probability of 18% | Pretest probability of 15% | Pretest probability of 28% | Test accuracy (certainty of the evidence) | |||
| True positives (women with diagnosis of birth weight discordance) | 22 studies, | Cohort‐type studies with delayed verification (cohort type accuracy study) | Very seriousb | Not serious | Very seriousc | Not serious | None | 92 (76 to 108) | 77 (63 to 90) | 143 (118 to 168) | ⊕⊝⊝⊝ |
| False negatives (women incorrectly classified as not having diagnosis of birth weight discordance) | 88 (72 to 104) | 73 (60 to 87) | 137 (112 to 162) | ||||||||
| True negatives | 22 studies, 6453 participants | Cohort‐type studies with delayed verification (cohort type accuracy study) | Very seriousb | Not serious | Very seriousc | Not serious | None | 746 (730 to 763) | 774 (757 to 791) | 655 (641 to 670) | ⊕⊝⊝⊝ |
| False positives | 74 (57 to 90) | 76 (59 to 93) | 65 (50 to 79) | ||||||||
| CI: confidence interval. | |||||||||||
| Sensitivity | 0.46 (95% CI 0.26 to 0.66) | Prevalencesa | 19% | 9% | 27% | ||||||
|---|---|---|---|---|---|---|---|---|---|---|---|
| Specificity | 0.93 (95% CI 0.89 to 0.96) | ||||||||||
| Outcome | No. of studies and participants | Study design | Factors that may decrease certainty | Effect per 1000 women tested | |||||||
| Risk of bias | Indirectness | Inconsistency | Imprecision | Publication bias | Pretest probability of 19% | Pretest probability of 9% | Pretest probability of 27% | Test accuracy (certainty of the evidence) | |||
| True positives (women with diagnosis of birth weight discordance) | 18 studies, | Cohort‐type studies with delayed verification (cohort type accuracy study) | Very seriousb | Not serious | Very seriousc | Not serious | None | 87 (49 to 125) | 41 (23 to 59) | 124 (70 to 178) | ⊕⊝⊝⊝ |
| False negatives (women incorrectly classified as not having diagnosis of birth weight discordance) | 103 (65 to 141) | 49 (31 to 67) | 146 (92 to 200) | ||||||||
| True negatives | 18 studies | Cohort‐type studies with delayed verification (cohort type accuracy study) | Very seriousb | Not serious | Very seriousc | Not serious | None | 753 (721 to 778) | 846 (810 to 874) | 679 (650 to 701) | ⊕⊝⊝⊝ |
| False positives | 57 (32 to 89) | 64 (36 to 100) | 51 (29 to 80) | ||||||||
| CI: confidence interval. | |||||||||||
Background
Target condition being diagnosed
Birth weight discordance (BWD), defined as a difference in the birth weights of twins, is a well‐documented phenomenon in twin pregnancies (Bagchi 2006; Mahony 2006). Estimated fetal weight discordance (EFWD) estimated by ultrasound is measured using the formula: ((larger twin estimated weight – smaller twin estimated weight)/larger twin estimated weight) × 100. EFWD of 20% or greater has been shown to have significant impact on fetal and perinatal outcomes. Growth discordance may occur as a physiological BWD, when both twins are appropriate‐for‐gestational‐age, or as pathological BWD when at least one twin is small‐for‐gestational age (Appleton 2007).
BWD is one of the major risk factors for adverse fetal, neonatal and maternal outcomes (Demissie 2002; Kilic 2006; Wen 2006). Demissie and colleagues found that the odds ratio of fetal death varied from 1.26 to 12.75 and the odds ratio of neonatal death varied from 1.02 to 3.43, depending on the degree of BWD. Kilic and colleagues reported higher frequency of mortality, sepsis, polycythaemia, hypoglycaemia, anaemia and respiratory distress syndrome among discordant twins. Wen and coworkers reported higher odds of maternal hypertension, eclampsia and other medical complications associated with BWD. Depending on the chorionicity, degree of discordance and the threshold used, BWD occurs in about 15% to 30% of twin gestations (Lewi 2008; Lopriore 2012; Miller 2012). Fetal growth abnormalities are associated with multiple conditions that affect fetal or neonatal well‐being, such as twin‐to‐twin transfusion syndrome (TTTS), chromosomal aberrations or structural defects. Excluding these conditions, discordant growth by itself is recognized as an independent risk factor for adverse perinatal outcomes (Mazhar 2010; Morin 2011; Suzuki 2009). BWD of 20% and 25% are the most common thresholds used in the literature to identify adverse perinatal outcomes (Jahanfar 2016a). One study suggested that BWD of 30% and greater is significantly associated with adverse perinatal outcomes irrespective of chorionicity (Jahanfar 2016b).
Several mechanisms have been proposed for growth discordance of fetuses exposed to the same intrauterine environment (Victoria 2001). For monochorionic (MC) twin pregnancies, the mechanism is explained through conditions such as TTTS and intrauterine growth retardation (IUGR). These two conditions result in greater risk of fetal and neonatal mortality compared to dichorionic (DC) twins. Technology is available to manage TTTS including amnio‐reduction and septotomy (Behrendt 2016), hence monitoring is usually started as early as 20 weeks.
In the case of DC twin pregnancies, intrauterine growth restriction and placenta pathology can cause growth discordance. Abnormal cord insertion and insufficient placental implantation in the uterine wall are other proposed mechanisms for BWD. These conditions are non‐treatable; hence, the main management is to determine fetal well‐being and decide the optimal time for delivery to save the growth discordant twins.
If the accuracy of ultrasound in assessing the 20% to 25% cut‐off is known, it helps the complex decision making that the clinician goes through in deciding whether to intervene medically (via laser photo coagulation) or deliver the twins to avoid fetal morbidities or even death.
Index test(s)
Ultrasound has been an important tool in the diagnosis of BWD since 1972 (Hoopmann 2011; Woo 1939). Diagnostic ultrasound is a sophisticated electronic technology, which utilizes pulses of high‐frequency sound to produce an image. In the past, before ultrasound became available, abdominal palpation was used, which is extremely poor for detecting growth discordance. Radiological examination is not recommended since it is not safe for the fetus.
Diagnosis of EFWD can be made via two modalities of ultrasound.
-
A series of diagnostic two‐dimensional (2D) ultrasound examinations is used to assess fetal growth of both twins; identify chorionicity; and diagnose problems with cord, amnion layers, congenital abnormalities and TTTS. Doppler ultrasound is used to detect abnormal blood flow patterns in fetal/placenta circulation which may indicate poor fetal prognosis (Alfirevic 2003).
-
Three‐dimensional (3D) ultrasound to facilitate the assessment of the placenta, such as surface‐rendered imaging and volume measurement, quantitative and qualitative assessments of the vascularization, and blood flow of the placenta (Hata 2011).
The standard diagnostic test for fetal growth discordance is ultrasound. Growth discordance can be estimated by measuring crown rump length (CRL: the distance measured from the top of the head to the bottom of the buttocks) at or before 12 weeks of gestation (Tai 2007). Later, during the second and third trimesters, other ultrasound measures such as biparietal diameter (BPD), abdominal circumference (AC) and femur length (FL) are used to estimate fetal weight and calculate the degree of BWD (Simoes 2011).
It is still unclear whether first or second trimester findings can accurately predict BWD, what sonographic parameters assessed at each trimester are reliable to assess for discordance or whether any particular ultrasound modality (e.g. 2D or 3D) is superior to the other.
Apart from EFWD, information on chorionicity is essential for the management of a twin pregnancy for the following reasons.
-
MC twins are at greater risk of fetal morbidity and mortality due to shared vascularization.
-
If monochorionicity is suspected at early ultrasound screening, subsequent screening should be serially scheduled during the second and third trimester.
Early ultrasound detection narrows down the differential diagnosis for the underlying causes such as placenta sharing and subsequent vascular anastomosis as an underlying cause of EFWD. Better prognosis is expected for DC twin pregnancies as they do not share placentas (Miller 2012). In simpler terms, MC twins have higher risk of complications and should be assessed separately.
Second trimester ultrasound screening, from 16 to 24 weeks' gestation is useful in measuring AC, amniotic fluid pockets, identification of dividing membrane between amniotic sacs and umbilical artery Doppler studies (Giles 1998; Rizzo 1993).
Third trimester ultrasound, after 24 weeks' gestation, aims at identifying discordance or insufficient fetal growth. Identification of a discordant twin is crucial if one of the twin pairs is small‐for‐gestational age rather than both being appropriate‐for‐gestational‐age.
It should be noted that there is overlap in the use of these diagnostic tests from one trimester to another.
The standard of practice is to identify the growth discordance in twin pregnancies using ultrasound (2D or 3D, or both) using measurements (CRL, BPD, AC or FL) in either early (for CRL) or late pregnancy (for BPD, AC and FL) and compare with the actual birth weight. Since EFWD of 20% and 25% are associated with adverse perinatal outcomes, we studied the diagnostic accuracy of ultrasound at those threshold values.
Clinical pathway
In the management of a twin pregnancy, evaluation of fetal growth is particularly important because growth restriction and prematurity are major causes of morbidity and mortality reported in twins compared with a singleton pregnancy (Adegbite 2004). Most clinicians start monitoring MC twins for growth delay and discordant growth from 18 weeks' gestation every two to three weeks. Each twin's growth, amniotic volume and fetal bladder volume are monitored for signs of oligohydramnios or polyhydramnios. in contrast, in DC twins, fetal growth monitoring by ultrasound usually begins after 20 weeks of gestation every four to six weeks as fetal growth deceleration leading to discordance is optimally detected between 20 and 28 weeks of gestation (Gonzalez‐Quintero 2003).
When discordant growth is identified in the absence of TTTS or congenital abnormalities, intensive fetal monitoring of fetal well‐being is employed until delivery becomes indicated. In mildly discordant twins, expectant management by frequent fetal assessment is preferable to preterm delivery, given the limitation of ultrasound diagnosis of growth discordance. In one large non‐randomized study of 2399 twin pregnancies, the sonographic diagnosis of discordance greater than 25% was a poor predictor of BWD, fetal loss after 22 weeks' and 28 weeks' gestation, perinatal death and preterm birth before 34 weeks of gestation (D'Antonio 2014). In complicated twin pregnancies, in particular those with fetal growth restriction and discordant growth, fetal well‐being assessment by a non‐stress test (NST), biophysical profile (BPP), amniotic fluid index (AFI) measurement and Doppler velocimetry may be useful to identify which fetuses would benefit from early delivery (Devoe 1995).
Ideally, a diagnostic test is expected to correctly identify all patients with the assessed condition and to exclude all patients without it; that is, to have a sensitivity and specificity of 100%. In practice, however, it is extremely rare to find a test with equally high sensitivity and specificity, when compared to the current gold standard (BWD). For most tests, there is usually a trade‐off between the measures. An approach to the test might vary depending on the clinical context, which relates to the consequences of missed diagnosis and magnitude of subsequent interventions if the test is positive. If clinical priority would be to avoid missed diagnosis, an adequate test in that case would be expected to have a high sensitivity (low false‐negative results), with lower specificity (higher number of false‐positive results). Thus, no woman with a growth discordant twin pregnancy is missed by a test, but some still get unnecessary interventions (intensive surveillance, early delivery, consequential issues pertaining to prematurity such as admission to the neonatal intensive care unit, costs associated with care for the premature baby and increased distress for parents). An alternative approach gives priority to a test that avoids unnecessary invasive interventions. In this scenario, the emphasis should be on a high specificity (close to 100%) with lower sensitivity (preferably above 50%), which will rule out growth discordance of the twins, but will not detect some women with this condition. Ruling out growth discordance eliminates the need for further clinical intervention. Ideally, a test with high sensitivity and specificity is most useful in a clinical setting, which will help in efficient patient counselling and ongoing pregnancy management. Improving the selection of patients who might benefit from interventions such as laser coagulation or amnioreduction or early delivery would be of considerable benefit to neonates, mothers, families and the community.
Rationale
Guidelines provide conflicting advice about the time, frequency and type of ultrasound measurements that reliably diagnose growth discordance. According to the American College of Obstetricians and Gynecologists (ACOG), growth discordance is defined as a difference of AC of 20 mm or estimated fetal weight (EFW) difference of 20% (ACOG Committee 2004). The Society of Obstetricians and Gynecologists of Canada recommends that the EFW be derived from bi‐parietal diameter with AC or a combination of AC and FL (Okun 2000). ACOG does not provide recommendations on the frequency of ultrasound examinations for twins while the green guideline from the Royal College of Obstetricians and Gynecologists advocates screening ultrasound for MC twins every two to three weeks from 16 weeks’ gestation onwards (NICE 2011).
For DC twins, the issues related to feto‐placental perfusion leading to growth discordance can be clarified by screening ultrasound. However, there are no guidelines on the optimal gestation at which to start screening, or the frequency and gestations for subsequent screenings. Moreover, gender is an important factor that has interaction with BWD and perinatal outcomes (Melamed 2009; Miller 2012). Identifying the gender mix by ultrasound improves predictability of antenatal outcomes (Di 2007). Thus, the accuracy of ultrasound to identify gender is also crucial. As a part of this review, we investigated the impact of gender on BWD as a confounding factor.
The variation in recommendations made in the guidelines arises from the fact that the ability to estimate abnormal growth is challenging. It is not clear if the antenatal prediction of a critical BWD by fetal weight estimation formulae ((birth weight of heavier twin – birth weight of lighter twin)/birth weight of heavier twin) two to three weeks prior to delivery (Caravello 1997), provides an accurate estimation of BWD (Kalish 2003; Klam 2003; van Mieghem 2009). The pooled sensitivity for ultrasound prediction of BWD of 25% or greater, in three studies, was 63% for a false‐positive rate of 2% (Caravello 1997; Diaz‐Garcia 2010; Gernt 2001).
The existing uncertainties are further complicated by an inconclusive predictive value of early (first‐second trimester) versus late detection (two to three weeks prior to delivery) of growth discordance, use of different sonographic estimates (AC versus FL), and reliance on the retrospective nature of study designs and small sample sizes of existing literature. Literature suggests that biometric measurements of EFWD at early gestation or during the second trimester have significantly different precisions (Banks 2008; Tai 2007). Moreover, the efficacy of a single biometric measurement, such as CRL or AC with or without other measurement(s), in predicting BWD, is controversial (Banks 2008; Bhide 2009; Chamberlain 1991; Chitkara 1985). The most popular current methods for predicting discordant growth in twin gestations have limited accuracy when held to a standard for discordance that requires a birth weight difference of at least 20% (Caravello 1997), as sonography tends to underestimate the degree of discordance (Chang 2006).
We reviewed and summarized the evidence for the diagnostic accuracy of antenatal ultrasound for EFWD compared to the BWD to inform clinical practice.
Objectives
To determine the diagnostic accuracy (sensitivity and specificity) of ultrasound estimated fetal weight discordance (EFWD) of 20% and 25% using different estimated biometric ultrasound measurements compared with the actual BWD as the reference standard in twin pregnancies.
Secondary objectives
To explore heterogeneity related to gestational age, sex and chorionicity. We planned to perform subgroup analyses for:
-
assessing the sensitivity and specificity of available diagnostic ultrasound tests in subgroups of twin pregnancies at various gestational ages by week (less than 28 weeks, 28 to 32 weeks, 32 to 36 weeks and more than 36 weeks);
-
assessing the sensitivity and specificity of each diagnostic ultrasound test in twin pregnancies with same‐sex versus opposite‐sex twins;
-
assessing the sensitivity and specificity of each diagnostic ultrasound test in dichorionic diamniotic versus monochorionic diamniotic twins.
We anticipate the following potential sources of heterogeneity.
-
Clinical factors: characteristics of study population (gestational age, chorionicity, inclusion of high‐risk pregnancy complicated by underlying maternal–fetal conditions, breastfeeding).
-
Methodological factors: study design (patient selection, prospective versus retrospective studies, time of test performance (time between index test and reference standard), clinical settings (tertiary centre versus community health care), multiple testing versus single testing for diagnosis of high‐risk pregnancy complicated by maternal–fetal conditions).
-
Other factors: geographic area (high‐, middle‐ and low‐income countries), year of publication.
Methods
Criteria for considering studies for this review
Types of studies
We included cohort‐type studies with delayed verification design that assessed EFWD of 20% compared to BWD of 20% and EFWD of 25% compared to BWD of 25%. We included only studies that reported both the index test and reference standard.
Participants
Twin pregnancies with ultrasound measurements to determine EFWD at any stage of pregnancy. The twin pregnancies included any type of chorionicity, any type of conception, and any maternal age and body mass index. We excluded pregnancies with inappropriate comparisons that were likely to distort an assessment of the diagnostic value of antenatal ultrasound (e.g. pregnancies that includes twins with one stillbirth, or other multiple pregnancies such as triplets or quadruplets).
Index tests
Any type of biometric measurements assessing EFWD, when either used as a single measurement, combinations or defined formulas, inclusive of CRL, BPD, AC and FL. The measurements were eligible if performed using transabdominal or transvaginal ultrasound, machines of any brand based on 2D or 3D ultrasound methods.
Target conditions
The target condition was BWD in twin pregnancies, which occurs when there is a disparity in birth weight between the larger and smaller infants of a twin set. For this review, we included studies that had investigated growth discordance of 20% or greater and growth discordance of 25% or greater.
Reference standards
Ultrasound EFWD of 20% was used to diagnose a prespecified BWD of 20% and an ultrasound EFWD of 25% was used to diagnose a prespecified BWD of 25%. BWD was calculated using the formula: ((larger estimated weight – smaller estimated weight)/larger estimated weight) × 100 and was categorized as those below or above a 20% threshold. Birth weight was accepted as estimated by using either electronic or mechanical scales of any type (bench‐top, portable, hanging, compact or not identified) from any manufacturer. Measurements were considered if performed in the hospital (labour ward, nursery or newborn intensive care unit) by trained medical personnel (doctor, nurse, midwife, paramedic). We included only the measurements performed within seven days of birth. Where available, the data on scale calibration, and whether baby was wet or dried before weighing were recorded and incorporated in the QUADAS‐2 quality assessment tool.
Search methods for identification of studies
We adopted a comprehensive search of multiple sources for eligible studies. We searched for unpublished and published studies using databases and conference proceedings as outlined below.
A librarian developed the search strategy following the recommendations in the Cochrane Handbook for Systematic Reviews of Diagnostic Test Accuracy (de Vet 2013). The searches were not limited to particular types of study design or have language or publication date restrictions. The search strategy incorporated words in the title, abstract, text words across the record and the subject headings. The search strategies for major databases are presented in Appendix 1.
Electronic searches
We searched the following electronic databases from inception to March 2020.
-
Cochrane Central Register of Controlled Trials (CENTRAL; 2020, Issue 3) via the Cochrane Library.
-
MEDLINE via Ovid (from 1946).
-
Embase via Ovid (from 1980).
-
CINAHL (from 1982).
-
ISI Web of Science Core Collection (from 1900).
-
Trip Database (from 1997).
-
PubMed Systematic Reviews subset (from 1946).
-
DARE and NHS EED via the University of York (1994 to 2015).
-
HTA (2003 to 2018).
-
Prospero via the University of York (2011).
Searching other resources
Additional searches included:
-
a hand search of Australasian Journal of Ultrasound in Medicine (2009); Canadian Journal of Medical Sonography (2013), the reference lists of all the included studies and the seminal reviews from the field; and
-
communication with at least five experts in the field asking them to review our reference list and identify any studies that may be missing.
Data collection and analysis
We performed data extraction and handling, assessment of methodological quality and statistical analyses based on the recommendations of the Diagnostic Test Accuracy (DTA) group and their Internet‐based tutorials (methods.cochrane.org/sdt/dta-author-training-online-learning).
Selection of studies
One review author scanned the titles of studies identified by our search to remove any clearly irrelevant articles and scanned the titles and abstracts of the remaining studies to select potentially relevant articles. Two review authors independently reviewed full‐text versions of the articles selected by title and abstract and assessed their eligibility for inclusion. We resolved any disagreements by discussion and, if necessary, with a third review author, who was an expert in the field and in methodological aspects of Cochrane systematic reviews.
When we identified the reports that updated previous publications of the same study population at different recruitment points, the earlier records were classified as excluded. The most complete data set that superseded previous publications were used to avoid double counting participants or studies.
We retrieved missing data by contacting the authors of identified studies directly to clarify the study eligibility. Potentially relevant studies in languages other than English were translated where possible.
For excluded studies, we documented the reasons for exclusion with details of which criteria were not met. We produced Characteristics of included studies, Characteristics of excluded studies and Characteristics of studies awaiting classification tables.
A single failed eligibility criterion was sufficient for a study to be excluded from the review.
Data extraction and management
We used a structured, piloted form to extract data from included studies. Two review authors independently extracted study characteristics and resolved disagreements by discussion. If disagreements persisted, a third review author resolved the issues. We extracted information on: author, year of publication, journal; study design; timing of data collection (prospective, retrospective); setting (inpatients, outpatients); study population (age, parity, obesity); type of index test and reference standard and data on index and reference test operators. We used the reported number of true positives (TP), false negatives (FN), true negatives (TN) and false positives (FP) to construct a 2 × 2 table for each index test. If these values were not reported, we attempted to reconstruct the 2 × 2 tables from the summary estimates presented in the article. We entered data into Review Manager 5, and used this to graphically display the quality assessment, study level data as forest plots and summary estimates as summary receiver operating characteristics (SROC) plots with studies and summary points (Review Manager 2014).
Assessment of methodological quality
We used the Quality Assessment of Diagnostic Test Accuracy Studies‐2 (QUADAS‐2) to assess the methodological quality of included studies. The QUADAS‐2 tool was applied in four phases: summarize the review question, tailor the tool and produce review‐specific guidance, construct a flow diagram for the primary study, and judge bias and applicability (Whiting 2011). Each paper was judged at 'low', 'high' or 'unclear' risk of bias for each of four domains, and concerns about applicability were assessed in three domains. The review‐specific QUADAS‐2 tool and explanatory document are presented in Appendix 2. Two review authors independently piloted the review‐specific tool to rate three of the included studies. The tool was utilized if there was a high level of agreement at the pilot stage. Similarly, two review authors independently applied the QUADAS‐2 tool to the full text of each study. We resolved disagreements by discussion, or if needed, by a third review author. We used Review Manager 5 to construct methodological quality summary graphs (Review Manager 2014).
We assessed the certainty of evidence and reported it according to GRADE for diagnostic test studies (Schünemann 2019; Schünemann 2020a; Schünemann 2020b). We used GRADEpro software to generate 'Summary of findings' tables (GRADEpro GDT).
The prevalences for assessing pretest probability were the median, lower and higher quartiles of the prevalences of the target condition (BWD) in the included studies (Oerbekke 2020).
Statistical analysis and data synthesis
We performed statistical analyses following recommendations presented in Chapter 10 of the Cochrane Handbook for Systematic Reviews of Diagnostic Test Accuracy (Macaskill 2013).
The unit of analysis in the included studies was twin pregnancy, rather than twins themselves, as BWD is a single calculated measure estimated using biometric measurements of two fetuses. We extracted the absolute counts of TP, FP, FN and TN from each study. TP was defined as ultrasound positive for EFWD greater than or equal to 20% or 25% by biometric ultrasound measurements (CRL, AC, FL) confirmed by BWD of greater than or equal to 20% or 25% after birth. FP was defined as ultrasound positive for EFWD, as defined above, without BWD after birth. FN was a negative ultrasound for EFWD of greater than or equal to 20% or 25% with the diagnosis of BWD of greater than or equal to 20 or 25%. Finally, TN was a negative ultrasound for EFWD of 20% or 25% and without BWD of 20% or 25% after birth.
Two review authors extracted the counts separately and discussed disagreements before engaging a third review author to resolve any disagreements. We then transferred the data into Review Manager 5 to produce plots and estimates (Review Manager 2014).
We used the counts (TP, FP, FN and TN) to construct 2 × 2 tables to estimate sensitivity and specificity with 95% confidence intervals (CIs) for each study. We plotted estimates of the sensitivities and specificities, with their 95% CIs, in forest plots (Chu 2006). The results of the index tests were dichotomous (positive or negative). The bivariate random‐effects approach enabled us to calculate the summary estimates of sensitivity and specificity with 95% CI) (Deeks 2019; Macaskill 2013). The bivariate model also deals with variation beyond chance in sensitivity and specificity between studies and any correlation that may exist between sensitivity and specificity. We calculated summary estimates of sensitivity and specificity using 'xtmelogit' using ‘metandi’ and MIDAS packages (Dwamena 2009; Harbord 2007; Harbord 2009) for Stata (Stata Corp, College Station, TX). We generated forest plots with 95% CIs for sensitivity and specificity and SROC plots in Review Manager 5 (Review Manager 2014).
When a meta‐analysis was possible, we planned to use test‐level covariates in the bivariate logit‐normal model to identify statistically significant differences but there were insufficient data for covariates of sex and chorionicity. We planned to stratify our analysis using categories of gestational age (below or equal to 24 weeks of gestation, below or equal to 32 weeks of gestation, below or equal to 37 weeks of gestation). However, the data were too variable, and the recorded gestational age was presented as ranges rather than one cut‐off point for gestational age. Hence, we decided not to pool the data in respect of gestational age. We calculated positive (LR+) and negative (LR–) likelihood ratios by using summary sensitivity and specificity.
Investigations of heterogeneity
We investigated heterogeneity for the diagnostic tests where there were sufficient data (more than 10 included studies). Steps taken were as follows.
We planned to start the investigation of heterogeneity through visual examination of the forest plots by grouping according to covariates all the items listed as potential sources of heterogeneity (e.g. type of ultrasound, year of publication, geographic areas (high‐income versus low‐ and middle‐income countries), consecutive enrolment, blinding of the operators to clinical data, modifications applied to the widely accepted method of imaging techniques (such as 2D and 3D acquisition), number of index test operators and missing data. There were insufficient data to allow grouping according to the above covariates.
We planned to investigate heterogeneity by meta‐regression if data were available for the covariates; type of ultrasound (2D, 3D), gender determination (yes/no), gestational age (continuous variable), type of study (prospective versus retrospective), chorionicity determination (yes/no), estimated BWD threshold (10% or greater versus 20% or greater) and time frame between index test and delivery. There were insufficient data to allow grouping according to the above covariates.
We planned to investigate methodological sources of heterogeneity using meta‐regression analysis. These were to be listed as verification bias, incorporation bias, diagnostic review bias, and clinical review bias. Prespecified variables were inclusive of clinical settings (tertiary centre versus community health care) and high‐risk pregnancy complicated by underlying maternal–fetal conditions (yes/no). Maternal complications included hypertensive disorders, gestational diabetes and antepartum haemorrhage. Fetal complications includes TTTS, major structural congenital anomalies, stillbirth of one twin and IUGR. We were unable to perform meta‐regression analyses for the above‐mentioned covariates due to lack of data.
Sensitivity analyses
We planned to conduct sensitivity analyses based on 'type of study design' (prospective versus retrospective study designs) and the individual quality items of QUADAS‐2 tool, but sufficient data were not available.
Assessment of reporting bias
We did not plan to use funnel plots to evaluate the impact of publication bias or other biases associated with small studies, because, according to Leeflang and colleagues, the tests commonly used in interventional systematic reviews for publication bias are not useful for diagnostic testing reviews (Leeflang 2008). Deeks and colleagues verified that the use of an asymmetric effective sample size plot to detect publication bias lacks power in situations where sample variability is present (Deeks 2005). We attempted to use unpublished data to minimise reporting bias.
Results
Results of the search
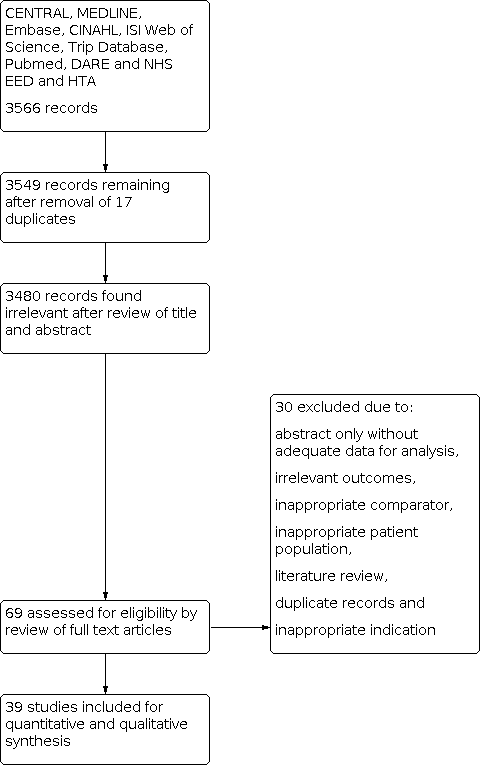
Results of database searches to March 2019 yielded 3566 records. Of these, we removed 17 duplicates and 3480 records at the title and abstract level (Figure 1). Of the remaining 69 articles, we excluded 30 at full paper screening due to a variety of reasons (abstract only, irrelevant outcomes, inappropriate comparator, inappropriate patient population, literature review, duplicate records and inappropriate indication; see Characteristics of excluded studies table). We finally included 39 studies, all of which evaluated the index test of EFWD by ultrasound measurements compared to the reference standard of actual birth weight measured at birth (Bimson 2012; Bimson 2014a; Bimson 2014b; Blickstein 1989; Blickstein 1996; Caravello 1997; Chamberlain 1991; Chang 2006; Chauhan 1995; Crane 1980; D'Antonio 2013a; D'Antonio 2014; Danon 2008; Diaz‐Garcia 2010; Fox 2011; Hehir 2017; Hill 1994; Hoopmann 2011; Jensen 1995; Johansen 2014; Kalish 2003; Kim 2015; Klam 2005; Machado 2007; MacLean 1992; Murray 2014; Nakayama 2014; O'Connor 2013; Reberdao 2010; Sayegh 1993; Secher 1985; Shahshahan 2011; Simoes 2011; Storlazzi 1987; van de Waarsenburg 2015; van Mieghem 2009; Watson 1991; Zipori 2016; Zuckerwise 2015).

PRISMA flow diagram outlining the study selection process.
The list and details of the included studies are presented in the Characteristics of included studies table. The 39 eligible studies had a median sample size of 140 and range of 38 to 2161 women per study. Of these studies, 16 were conducted in Europe, seven in Asia, 14 in North America and two in other geographical areas. Nine studies were conducted at university hospitals, eight studies were at tertiary centres, 11 studies were conducted in hospitals, six studies were conducted at other settings and five studies did not indicate their settings. Three studies were published prior to 1990, eight were published between 1991 and 2000, eight between 2001 and 2010, and the remaining 14 after 2010. All studies used ultrasound by 2D, and none evaluated EFWD using 3D ultrasound.
Methodological quality of included studies
We assessed all 39 studies using the QUADAS‐2 framework (Figure 2; Figure 3). All studies were observational cohort‐type studies with delayed verification. From the studies that reported BWD, four received financial support. There were no studies whose authors declared a conflict of interest. Thirty‐one studies gave no information on either of these two potential biases.

QUADAS‐2 risk of bias and applicability concerns graph including review authors' judgements about each domain presented as percentages across included studies.
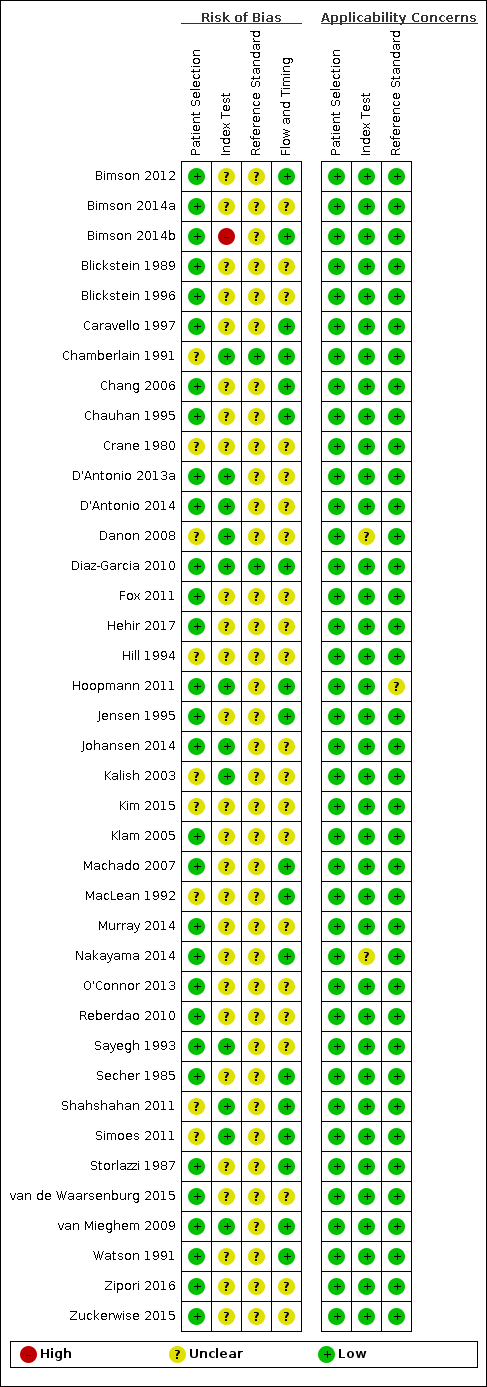
QUADAS‐2 risk of bias and applicability concerns summary including review authors’ judgements about each domain for each included study.
In terms of risk of bias, there were many unclear statements regarding patient selection, index test, use of proper reference standard, and flow and timing elements of the studies. In terms of applicability, most studies were high quality, and there was low concern. There was one study at high risk of bias based on the judgments made about the index test. There were no studies at high risk of bias based on the judgements made about the reference standard, and, in 37 (90%), the risk was unclear. Twenty‐one studies (53%) were of methodological concern due to flow and timing.
We judged 36 studies (92%) at low concern of applicability concerns in all three domains (Figure 3). Two studies had an unclear risk of bias for the index test (Danon 2008; Nakayama 2014), and one study with an unclear risk of bias for a reference standard (Hoopmann 2011).
We used the GRADE approach to evaluate the certainty of the evidence. For both diagnostic performance of ultrasound at 20% and 25% BWD, the certainty of evidence was downgraded one level for risk of bias and two levels for inconsistency to give a final estimation of very low certainty of evidence.
Findings
1. Diagnostic performance of ultrasound (20% difference in birth weight as reference)
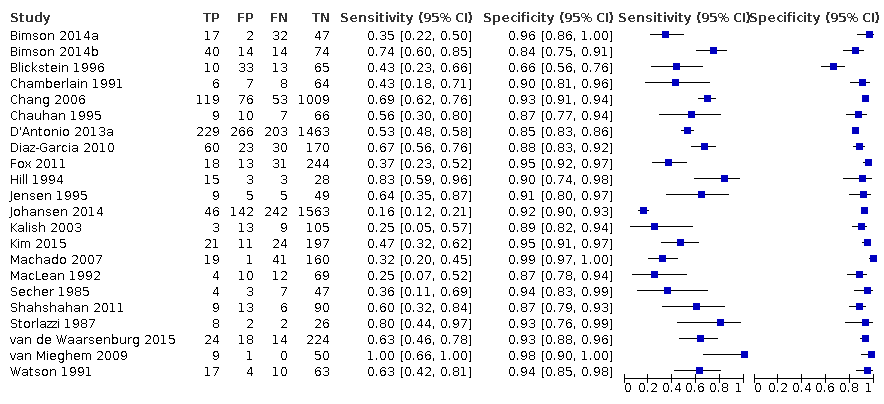
Twenty‐two studies that estimated EFWD by ultrasound measurements provided data for a discordance of equal to or greater than 20% (Bimson 2014a; Bimson 2014b; Blickstein 1996; Chamberlain 1991; Chang 2006; Chauhan 1995; D'Antonio 2013a; Diaz‐Garcia 2010; Fox 2011; Hill 1994; Jensen 1995; Johansen 2014; Kalish 2003; Kim 2015; Machado 2007; MacLean 1992; Secher 1985; Shahshahan 2011; Storlazzi 1987; van de Waarsenburg 2015; van Mieghem 2009; Watson 1991). Median BWD of 20% prevalence across the studies was 18% (range 9% to 50%). The findings and certainty of evidence are detailed in summary of findings Table 1.
Study level estimates of sensitivities and specificities are shown in Figure 4.

A forest plot representing study level sensitivities and specificities that used an estimated fetal weight discordance (EFWD) of 20%.
The sensitivities ranged between 16% and 100%, whereas the specificities ranged between 66% and 99%. The summary estimate of sensitivity was 0.51 (95% CI 0.42 to 0.60), and the summary estimate of specificity was 0.91 (95% CI 0.89 to 0.93) (Table 1). The summary receiver operating plot with the summary point is illustrated in Figure 5. Most of the studies on the SROC plot were close to the Y axis indicating high specificity but variable sensitivity. The confidence regions were narrow for specificity but not sensitivity. The large prediction region indicated the variability of the diagnostic accuracy of future studies. The LR+ for EFWD by ultrasound was 5.9 (95% CI 4.3 to 8.1), and for LR– was 0.53 (95% CI 0.44 to 0.64).
| Groups | No. of studies | Sensitivity (95% CI) | Specificity (95% CI) | LR+ | LR– |
|---|---|---|---|---|---|
| BWD of 20% | 22 | 0.51 (0.42 to 0.60) | 0.91 (0.89 to 0.93) | 5.9 (4.3 to 8.1) | 0.53 (0.44 to 0.64) |
| EFWD by AC | 7 | 0.57 (0.48 to 0.66) | 0.84 (0.72 to 0.92) | 3.6 (1.8 to 7.4) | 0.51 (0.38 to 0.68) |
| EFWD by FL | 7 | 0.60 (0.53 to 0.67) | 0.87 (0.84 to 0.90) | 4.6 (3.4 to 6.1) | 0.46 (0.38 to 0.56) |
| BWD of 25% | 18 | 0.46 (0.26 to 0.66) | 0.93 (0.89 to 0.96) | 6.7 (3.0 to 14.9) | 0.58 (0.39 to 0.88) |
| EFWD by AC | 7 | 0.42 (0.27 to 0.58) | 0.88 (0.76 to 0.94) | 3.3 (1.6 to 6.9) | 0.67 (0.51 to 0.87) |
| EFWD by FL | 4 | 0.55 (0.44 to 0.65) | 0.91 (0.89 to 0.92) | 5.8 (4.3 to 7.9) | 0.50 (0.40 to 0.64) |
AC: abdominal circumference; BWD: birth weight discordance; CI: confidence interval; EFWD: estimated fetal weight discordance; FL: femur length; LR+: likelihood ratio of a positive test; LR–: likelihood ratio of a negative test.

Summary receiver operating characteristic plot of studies assessing the accuracy of ultrasound based on an estimated fetal weight discordance (EFWD) of 20%. Each study is represented as an ellipse with size of the ellipse adjusted to the sample size of the study. The filled circle represents the summary point indicating summary sensitivity and specificity of the meta‐analytic estimate. Dotted closed line represents 95% confidence region and the dashed line represents the 95% prediction region around the summary point.
Subgroup analyses of the 20% discordance based on measurements by abdominal circumference versus femur length
Of the 22 studies that reported estimates with 20% cut‐off, seven used AC (Blickstein 1996; Chamberlain 1991; Chauhan 1995; D'Antonio 2013a; Diaz‐Garcia 2010; Hill 1994; Storlazzi 1987) (Figure 6). Median disease prevalence across the studies was 26.3 (range 15.3 to 36.7). For AC as a measurement for EFWD, the summary estimates of sensitivity was 0.57 (95% CI 0.48 to 0.66), and the summary estimate of specificity was 0.84 (95% CI 0.72 to 0.92) (Table 1). The LR+ for EFWD by ultrasound was 3.6 (95% CI 1.8 to 7.4), and for LR– was 0.51 (95% CI 0.38 to 0.68).
A forest plot representing sensitivities and specificities of the studies that used ultrasound abdominal circumference to detect estimated fetal weight discordance (EFWD) of 20%. FN: false negative; FP: false positive; TN: true negative; TP: true positive.
Among the 22 studies that reported estimates with 20% difference in birth weight as reference, seven studies used FL for EFWD (Chamberlain 1991; Chauhan 1995; D'Antonio 2013a; Diaz‐Garcia 2010; Hill 1994; Storlazzi 1987; Watson 1991). The study level sensitivity and specificity for ultrasound using FL are depicted in Figure 7. For FL as a measurement for EFWD, the summary estimate of sensitivity was 0.60 (95% CI 0.53 to 0.67), and the summary estimate of specificity was 0.87 (95% CI 0.84 to 0.90) (Table 1). LR+ was 4.6 (3.4 to 6.1), and LR– was 0.46 (0.38 to 0.56).

A forest plot representing sensitivities and specificities of the studies that used femoral length by ultrasound to detect estimated fetal weight discordance (EFWD) of 20%. FN: false negative; FP: false positive; TN: true negative; TP: true positive.
No subgroup analyses were possible based on gestational age, sex discordance or chorionicity due to lack of sufficient data for analysis.
2. Diagnostic performance of ultrasound (25% difference in birth weight as reference)
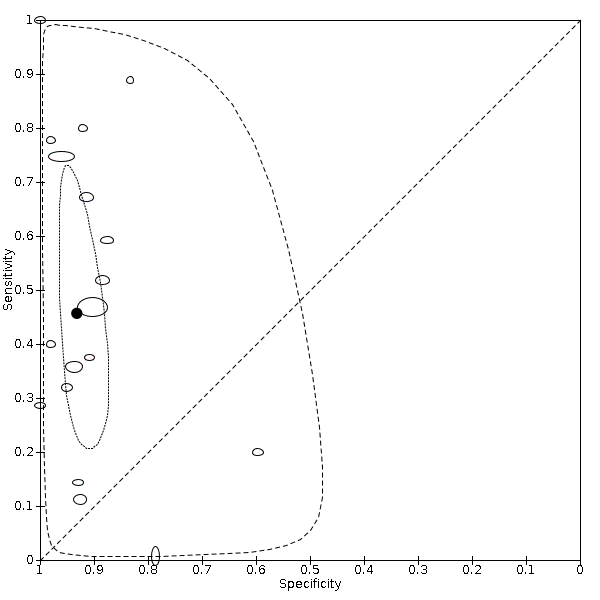
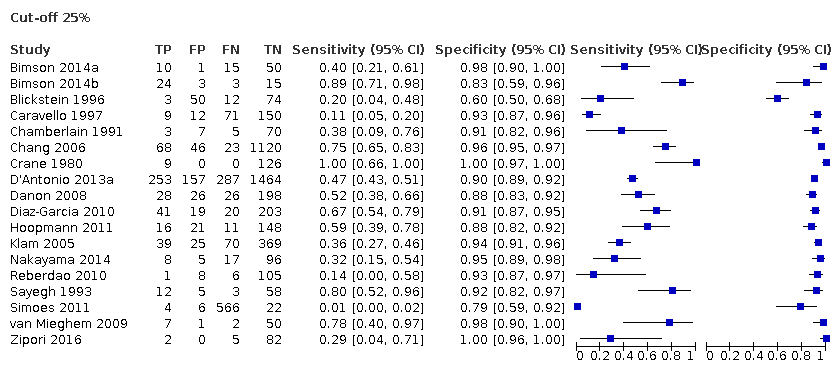
Eighteen studies that EFWD by ultrasound measurements provided data using a 25% difference in birth weight as reference (Bimson 2014a; Bimson 2014b; Blickstein 1996; Caravello 1997; Chamberlain 1991; Chang 2006; Crane 1980; D'Antonio 2013a; Danon 2008; Diaz‐Garcia 2010; Hoopmann 2011; Klam 2005; Nakayama 2014; Reberdao 2010; Sayegh 1993; Simoes 2011; van Mieghem 2009; Zipori 2016). Study level estimates of sensitivities and specificities are shown in Figure 8. The sensitivities ranged between 1% and 100% whereas the specificities ranged between 79% and 100%. The summary estimate of sensitivity was 0.46 (95% CI 0.26 to 0.66), and the summary estimate of specificity was 0.93 (95% CI 0.89 to 0.96) (Table 1). The summary receiver operating plot along with the summary point is illustrated in Figure 9. Most of the studies on the SROC plot were close to the Y axis indicating high specificity but variable sensitivity. The confidence regions were narrow for specificity but not sensitivity. The large prediction region indicated the variability of the diagnostic accuracy of future studies. The LR+ for EFWD by ultrasound was 6.7 (95% CI 3.0 to 14.9) and for LR– was 0.58 (95% CI 0.39 to 0.88). Findings and the certainty of evidence (very low) are detailed in the summary of findings Table 2.

A forest plot representing sensitivities and specificities of all the studies that used an estimated fetal weight discordance (EFWD) of 25%. FN: false negative; FP: false positive; TN: true negative; TP: true positive.

Summary receiver operating characteristic plot of studies assessing the accuracy of ultrasound based on an estimated fetal weight discordance (EFWD) of 25%. Each study is represented as an ellipse with size of the ellipse adjusted to the sample size of the study. The filled circle represents the summary point indicating summary sensitivity and specificity of the meta‐analytic estimate. Dotted closed line represents 95% confidence region and the dashed line represents the 95% prediction region around the summary point.
Subgroup analyses of the 25% discordance based on measurements of abdominal circumference measurement versus femur length
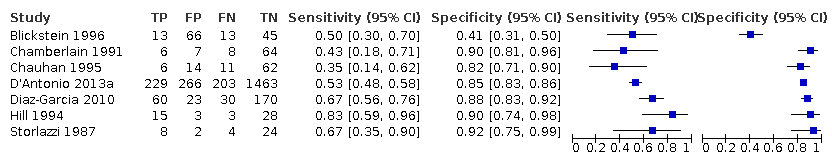
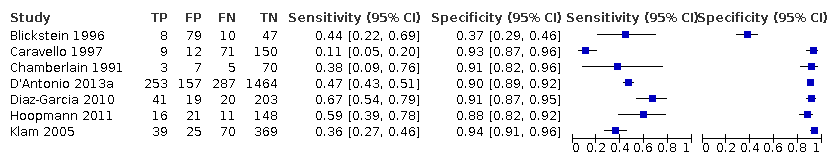
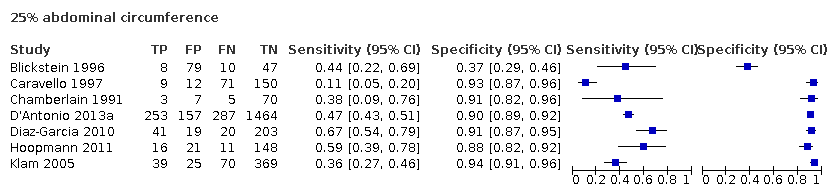
Among the studies that reported estimates with 25% difference in birth weight as reference, seven studies used AC (Blickstein 1996; Caravello 1997; Chamberlain 1991; D'Antonio 2013a; Diaz‐Garcia 2010; Hoopmann 2011; Klam 2005). Study level sensitivity and specificity for ultrasound using AC are depicted in Figure 10. The pooled estimate of sensitivity was 0.42 (95% CI 0.27 to 0.58) whereas that of the specificity was 0.88 (95% CI 0.76 to 0.94) (Table 1). LR+ was 3.3 (95% CI 1.6 to 6.9) and LR– was 0.67 (95% CI 0.51 to 0.87).

A forest plot representing sensitivities and specificities of the studies that used ultrasound abdominal circumference to detect estimated fetal weight discordance (EFWD) of 25%. FN: false negative; FP: false positive; TN: true negative; TP: true positive.
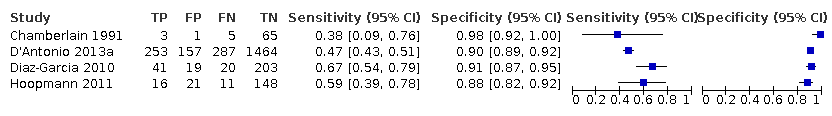
Among the studies that reported estimates with 25% difference in birth weight as reference, we only found four studies used FL (Chamberlain 1991; D'Antonio 2013a; Diaz‐Garcia 2010; Hoopmann 2011). Study level sensitivity and specificity for ultrasound using FL are depicted in Figure 11. The pooled estimate of sensitivity was 0.55 (95% CI 0.44 to 0.65) whereas that of the specificity was 0.91 (95% CI 0.89 to 0.92) (Table 1). LR+ was 5.8 (95% CI 4.3 to 7.9) and LR– was 0.50 (95% CI 0.40 to 0.64).

A forest plot representing sensitivities and specificities of the studies that used ultrasound femoral length to detect estimated fetal weight discordance (EFWD) of 25%. FN: false negative; FP: false positive; TN: true negative; TP: true positive.
No subgroup analyses were possible based on gestational age, sex discordance or chorionicity due to lack of sufficient data for analysis.
Discussion
Summary of main results
We evaluated the diagnostic accuracy of EFWD of 20% and 25% using biometric ultrasound measurements compared with BWD as the reference standard. We identified 39 studies that matched our inclusion criteria. The summary estimate of sensitivity was 0.51 (95% CI 0.42 to 0.60), and the summary estimate of specificity was 0.91 (95% CI 0.89 to 0.93) at 20% discordance in BWD (Table 1). The summary estimate of sensitivity was 0.46 (95% CI 0.26 to 0.66), and the summary estimate of specificity was 0.93 (95% CI 0.89 to 0.96) at 25% discordance in BWD. Sensitivity and specificity did not differ substantively between the two cut‐off points (20% and 25%). We found that there was high variability in sensitivity ranging from 0.1 to 1.0 but specificity was high with tight ranges for both 20% and 25% discordances in BWD. The certainty of the evidence was very low due to high risk of bias in the included studies and inconsistency.
Subgroup analyses were possible for ultrasound measurements using AC and FL for both 20% and 25% discordance in BWD. The sensitivities and specificities were not substantially different between these subgroups for both discordance cut‐offs, but sensitivity and specificity were marginally better in studies that used FL for EFWD estimation. No subgroup analyses were possible based on gestational age, sex discordance or chorionicity due to lack of sufficient data for analysis.
Overall, this systematic review found very low‐certainty evidence that ultrasound EFWD discordance between twins has poor sensitivity but good specificity in predicting actual BWD and suggested that FL performs slightly better than AC.
Leombroni 2017 reviewed limited data sources (PubMed, Embase and CINAHL) and fewer studies (20). The review authors could not perform comprehensive data synthesis for each AC discordance cut‐off and were unable to report data on FL measurement. They concluded that the optimal diagnostic performance of AC discordance was for prediction of BW discordance of 25% or greater, with a sensitivity of 70.8% and specificity of 86.4%. Our findings suggest that there was no difference in ultrasound diagnosis of EFWD between 20% and 25% discordance.
Strengths and weaknesses of the review
The strength of this review is implementing a comprehensive search in a variety of databases and a large number of publications reviewed. We followed the standard recommendations of the Cochrane DTA (methods.cochrane.org/sdt/). We provide the most up‐to‐date overall assessment of ultrasound in predicting BWD in twins.
There are several limitations to this review.
-
We found considerable heterogeneity in sensitivity of the EFWD measurement by ultrasound. The low sensitivity of EFWD would miss a significant number of twins with BWD, which would be clinically consequential. However, twins often have regular screening so a missed diagnosis in one scan could potentially be detected in a subsequent scan.
-
We were able to analyze only two cut‐off points (20% and 25%).
-
Lack of stratification by gestational age; gestational age at ultrasound examination is of great importance when assessing the predictive accuracy of ultrasound for growth discordance. We were unable to pool the data based on different gestational age due to the large variation in the extracted data. According to the literature, growth discrepancy in twins usually occurs in the third trimester (Puccio 2014). Hence, an ultrasound assessment performed early in pregnancy cannot reliably predict discordance.
-
Unable to conduct a subgroup analysis based on chorionicity due to the failure of included studies in reporting chorionicity. Since the pathophysiology of growth discordance differs in MC and DC twins, lack of chorionicity information in our analysis may be reflected in the predictive accuracy of ultrasound in identifying twins affected by abnormal growth.
-
Studies included in the analysis used different EFWD formulae (Hadlock, Shepard, Ferrero) to predict fetal weight, and some studies did not specify which formula they used to measure AC or FL. The absence of stratification according to each specific ultrasound weight formula might have hypothetically changed the approximation of EFW for each twin, consequently affecting the estimated EFWD.
-
It is also worth noting that some of the included studies are old; hence the technology used at the time may not have created as sharp an image as the new ultrasound machine.
Applicability of findings to the review question
Performing ultrasound on 1000 twin pregnancies to detect BWD of 20% or more with a median prevalence of BWD of 18% and using a summary sensitivity of 0.51 and specificity of 0.91, 88 women will miss a correct diagnosis (FN) and miss a chance to have beneficial interventions while 74 women will be diagnosed FP and may be subject to unnecessary medical interventions. The FN rate increases as the prevalence increases from 18% and more women will have a missed diagnosis but the FP rate decreases (summary of findings Table 1).
Similarly, performing ultrasound on 1000 twin pregnancies to detect BWD of 25% or more with a median prevalence of BWD of 19% and using a summary sensitivity of 0.46 and specificity of 0.93, 103 women will miss a correct diagnosis (FN) and miss a chance to have beneficial interventions while 57 women will be diagnosed FP and may be subject to unnecessary interventions (summary of findings Table 2).
BWD is associated with adverse perinatal outcomes in twin pregnancy (Jahanfar 2017a). Therefore, it is crucial to measure EFWD during routine ultrasound examinations. Our findings suggest that ultrasound EFWD has low sensitivity but good specificity in detecting discordance in actual BWD. There are a few points to consider when interpreting the result of this review. First, the reference standard that we used in this review (BWD) is a reliable reference standard, and so the findings are applicable to the review question. However, it should be noted that the tests were performed in a health clinic or tertiary hospitals, and our findings are, therefore, applicable only in these settings. Publications selected for this review included twin pregnancies with viable fetuses. Hence, the results of our review are not applicable to pregnancies with stillbirth, triplets or quadruplets. We were careful not to include the studies that did not define BWD or did not report the EFWD formula as identified by our review ((larger estimated weight – smaller estimated weight)/larger estimate weight) × 100). In addition, we included only the measurements performed within seven days of birth and measured by a healthcare professional using either electronic or mechanical scales. Examinations included in the analysis were 2D ultrasounds performed during any stage of pregnancy. Since the test works best in the third trimester, it is unlikely that it would be useful for identifying and treating TTTS.
PRISMA flow diagram outlining the study selection process.

QUADAS‐2 risk of bias and applicability concerns graph including review authors' judgements about each domain presented as percentages across included studies.

QUADAS‐2 risk of bias and applicability concerns summary including review authors’ judgements about each domain for each included study.
A forest plot representing study level sensitivities and specificities that used an estimated fetal weight discordance (EFWD) of 20%.

Summary receiver operating characteristic plot of studies assessing the accuracy of ultrasound based on an estimated fetal weight discordance (EFWD) of 20%. Each study is represented as an ellipse with size of the ellipse adjusted to the sample size of the study. The filled circle represents the summary point indicating summary sensitivity and specificity of the meta‐analytic estimate. Dotted closed line represents 95% confidence region and the dashed line represents the 95% prediction region around the summary point.

A forest plot representing sensitivities and specificities of the studies that used ultrasound abdominal circumference to detect estimated fetal weight discordance (EFWD) of 20%. FN: false negative; FP: false positive; TN: true negative; TP: true positive.

A forest plot representing sensitivities and specificities of the studies that used femoral length by ultrasound to detect estimated fetal weight discordance (EFWD) of 20%. FN: false negative; FP: false positive; TN: true negative; TP: true positive.

A forest plot representing sensitivities and specificities of all the studies that used an estimated fetal weight discordance (EFWD) of 25%. FN: false negative; FP: false positive; TN: true negative; TP: true positive.
Summary receiver operating characteristic plot of studies assessing the accuracy of ultrasound based on an estimated fetal weight discordance (EFWD) of 25%. Each study is represented as an ellipse with size of the ellipse adjusted to the sample size of the study. The filled circle represents the summary point indicating summary sensitivity and specificity of the meta‐analytic estimate. Dotted closed line represents 95% confidence region and the dashed line represents the 95% prediction region around the summary point.
A forest plot representing sensitivities and specificities of the studies that used ultrasound abdominal circumference to detect estimated fetal weight discordance (EFWD) of 25%. FN: false negative; FP: false positive; TN: true negative; TP: true positive.
A forest plot representing sensitivities and specificities of the studies that used ultrasound femoral length to detect estimated fetal weight discordance (EFWD) of 25%. FN: false negative; FP: false positive; TN: true negative; TP: true positive.


20% abdominal circumference

25% abdominal circumference

| Sensitivity | 0.51 (95% CI 0.42 to 0.60) | Prevalencesa | 18% | 15% | 28% | ||||||
|---|---|---|---|---|---|---|---|---|---|---|---|
| Specificity | 0.91 (95% CI 0.89 to 0.93) | ||||||||||
| Outcome | No. of studies and participants | Study design | Factors that may decrease certainty | Effect per 1000 women tested | |||||||
| Risk of bias | Indirectness | Inconsistency | Imprecision | Publication bias | Pretest probability of 18% | Pretest probability of 15% | Pretest probability of 28% | Test accuracy (certainty of the evidence) | |||
| True positives (women with diagnosis of birth weight discordance) | 22 studies, | Cohort‐type studies with delayed verification (cohort type accuracy study) | Very seriousb | Not serious | Very seriousc | Not serious | None | 92 (76 to 108) | 77 (63 to 90) | 143 (118 to 168) | ⊕⊝⊝⊝ |
| False negatives (women incorrectly classified as not having diagnosis of birth weight discordance) | 88 (72 to 104) | 73 (60 to 87) | 137 (112 to 162) | ||||||||
| True negatives | 22 studies, 6453 participants | Cohort‐type studies with delayed verification (cohort type accuracy study) | Very seriousb | Not serious | Very seriousc | Not serious | None | 746 (730 to 763) | 774 (757 to 791) | 655 (641 to 670) | ⊕⊝⊝⊝ |
| False positives | 74 (57 to 90) | 76 (59 to 93) | 65 (50 to 79) | ||||||||
| CI: confidence interval. | |||||||||||
| Sensitivity | 0.46 (95% CI 0.26 to 0.66) | Prevalencesa | 19% | 9% | 27% | ||||||
|---|---|---|---|---|---|---|---|---|---|---|---|
| Specificity | 0.93 (95% CI 0.89 to 0.96) | ||||||||||
| Outcome | No. of studies and participants | Study design | Factors that may decrease certainty | Effect per 1000 women tested | |||||||
| Risk of bias | Indirectness | Inconsistency | Imprecision | Publication bias | Pretest probability of 19% | Pretest probability of 9% | Pretest probability of 27% | Test accuracy (certainty of the evidence) | |||
| True positives (women with diagnosis of birth weight discordance) | 18 studies, | Cohort‐type studies with delayed verification (cohort type accuracy study) | Very seriousb | Not serious | Very seriousc | Not serious | None | 87 (49 to 125) | 41 (23 to 59) | 124 (70 to 178) | ⊕⊝⊝⊝ |
| False negatives (women incorrectly classified as not having diagnosis of birth weight discordance) | 103 (65 to 141) | 49 (31 to 67) | 146 (92 to 200) | ||||||||
| True negatives | 18 studies | Cohort‐type studies with delayed verification (cohort type accuracy study) | Very seriousb | Not serious | Very seriousc | Not serious | None | 753 (721 to 778) | 846 (810 to 874) | 679 (650 to 701) | ⊕⊝⊝⊝ |
| False positives | 57 (32 to 89) | 64 (36 to 100) | 51 (29 to 80) | ||||||||
| CI: confidence interval. | |||||||||||
| Groups | No. of studies | Sensitivity (95% CI) | Specificity (95% CI) | LR+ | LR– |
|---|---|---|---|---|---|
| BWD of 20% | 22 | 0.51 (0.42 to 0.60) | 0.91 (0.89 to 0.93) | 5.9 (4.3 to 8.1) | 0.53 (0.44 to 0.64) |
| EFWD by AC | 7 | 0.57 (0.48 to 0.66) | 0.84 (0.72 to 0.92) | 3.6 (1.8 to 7.4) | 0.51 (0.38 to 0.68) |
| EFWD by FL | 7 | 0.60 (0.53 to 0.67) | 0.87 (0.84 to 0.90) | 4.6 (3.4 to 6.1) | 0.46 (0.38 to 0.56) |
| BWD of 25% | 18 | 0.46 (0.26 to 0.66) | 0.93 (0.89 to 0.96) | 6.7 (3.0 to 14.9) | 0.58 (0.39 to 0.88) |
| EFWD by AC | 7 | 0.42 (0.27 to 0.58) | 0.88 (0.76 to 0.94) | 3.3 (1.6 to 6.9) | 0.67 (0.51 to 0.87) |
| EFWD by FL | 4 | 0.55 (0.44 to 0.65) | 0.91 (0.89 to 0.92) | 5.8 (4.3 to 7.9) | 0.50 (0.40 to 0.64) |
| AC: abdominal circumference; BWD: birth weight discordance; CI: confidence interval; EFWD: estimated fetal weight discordance; FL: femur length; LR+: likelihood ratio of a positive test; LR–: likelihood ratio of a negative test. | |||||
| Test | No. of studies | No. of participants |
| 1 Cut‐off 20% Show forest plot | 22 | 8005 |
| 2 20% abdominal circumference Show forest plot | 7 | 2846 |
| 3 20% femur length Show forest plot | 7 | 2791 |
| 4 Cut‐off 25% Show forest plot | 18 | 6471 |
| 5 25% abdominal circumference Show forest plot | 7 | 3614 |
| 6 25% femur length Show forest plot | 4 | 2714 |