Ultraschall zur Diagnose von Unterschieden beim Geburtsgewicht bei Zwillingsschwangerschaften
Information
- DOI:
- https://doi.org/10.1002/14651858.CD012553.pub2Copy DOI

- Database:
-
- Cochrane Database of Systematic Reviews
- Version published:
-
- 09 March 2021see what's new
- Type:
-
- Diagnostic
- Stage:
-
- Review
- Cochrane Editorial Group:
-
Cochrane Pregnancy and Childbirth Group
- Copyright:
-
- Copyright © 2021 The Cochrane Collaboration. Published by John Wiley & Sons, Ltd.
Article metrics
Altmetric:
Cited by:
Authors
Contributions of authors
SJ: conceptualized the idea, wrote the review, incorporated reviewers' comments, and edited the text.
JH: made clinical recommendations.
SH: made clinical recommendations.
IA: made methodological and analytical recommendations.
MN: helped with the screening process.
CR: helped with quality assessment and data extraction.
MP: reviewed and revised the final draft, reanalyzed data including subgroup analyses, assisted in making revisions according to the DTA editorial team.
Sources of support
Internal sources
-
DTA group, Other
DTA group provided technical support
External sources
-
No sources of support supplied
Declarations of interest
SJ: none.
JH: none.
SH: none.
IA: none.
MN: none.
CR: none.
MP: none.
Acknowledgements
As part of the prepublication editorial process, the review has been commented on by three peers (an editor and two referees who are external to the editorial team) and a member of the Pregnancy and Childbirth Group's international panel of consumers. The authors are grateful to the following peer reviewers for their time and comments: Gabriele Saccone, Department of Neuroscience, Reproductive Sciences and Dentistry, School of Medicine, University of Naples Federico II, Naples, Italy; Alexis Shub, Mercy Hospital for Women, Melbourne, Australia.
We thank Ursula Ellis for preparing the search strategies for this review. We also thank Vicki Nisenblat for her contribution to the protocol for this review.
This project was supported by the National Institute for Health Research (NIHR), via Cochrane Infrastructure funding to Cochrane Pregnancy and Childbirth. The views and opinions expressed herein are those of the authors and do not necessarily reflect those of the Evidence Synthesis Programme, the NIHR, National Health Service (NHS) or the Department of Health and Social Care.
Version history
| Published | Title | Stage | Authors | Version |
| 2021 Mar 09 | Ultrasound for diagnosis of birth weight discordance in twin pregnancies | Review | Shayesteh Jahanfar, Jacqueline J Ho, Sharifah Halimah Jaafar, Iosief Abraha, Mohaddesseh Noura, Cassandra R Ross, Mohan Pammi | |
| 2017 Mar 03 | Ultrasound for diagnosis of birth weight discordance in twin pregnancies | Protocol | Shayesteh Jahanfar, Jacqueline J Ho, Sharifah Halimah Jaafar, Iosief Abraha, Vicki Nisenblat, Ursula M Ellis, Mohaddesseh Noura | |
Differences between protocol and review
We were unable to identify an adequate number of papers looking into 18% or 30% BWD. Therefore, we analyzed the cut‐off points of 20% and 25%.
We reanalyzed data using MIDAS package in STATA.
Keywords
MeSH
Medical Subject Headings (MeSH) Keywords
Medical Subject Headings Check Words
Female; Humans; Pregnancy;
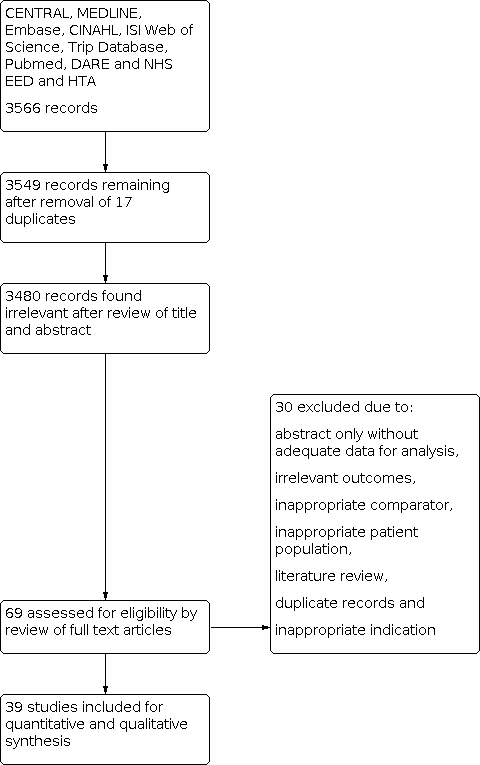
PRISMA flow diagram outlining the study selection process.

QUADAS‐2 risk of bias and applicability concerns graph including review authors' judgements about each domain presented as percentages across included studies.
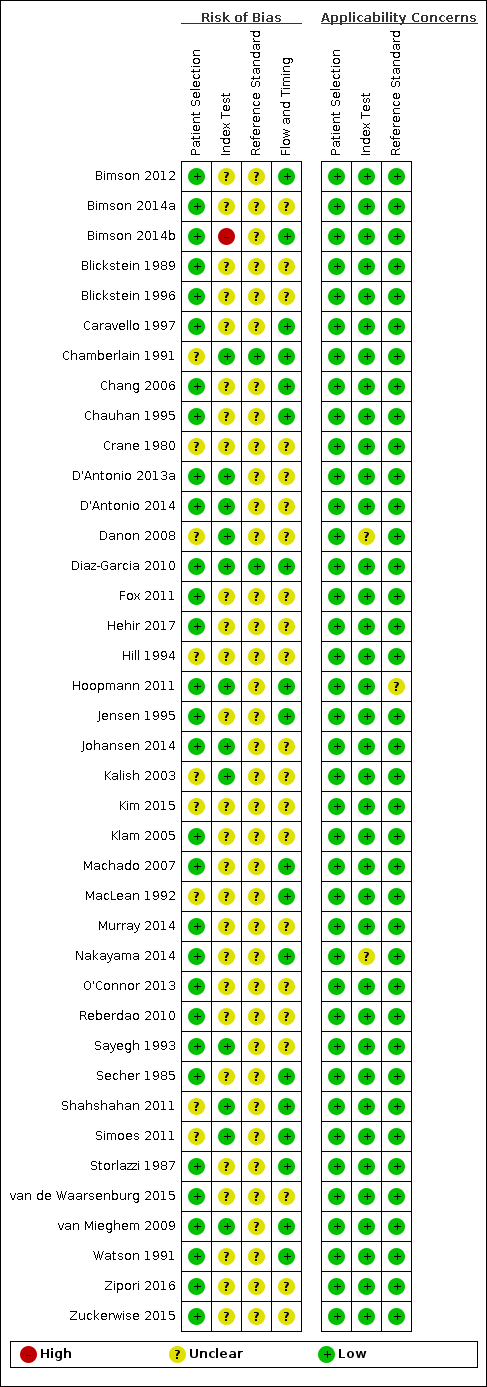
QUADAS‐2 risk of bias and applicability concerns summary including review authors’ judgements about each domain for each included study.

A forest plot representing study level sensitivities and specificities that used an estimated fetal weight discordance (EFWD) of 20%.

Summary receiver operating characteristic plot of studies assessing the accuracy of ultrasound based on an estimated fetal weight discordance (EFWD) of 20%. Each study is represented as an ellipse with size of the ellipse adjusted to the sample size of the study. The filled circle represents the summary point indicating summary sensitivity and specificity of the meta‐analytic estimate. Dotted closed line represents 95% confidence region and the dashed line represents the 95% prediction region around the summary point.
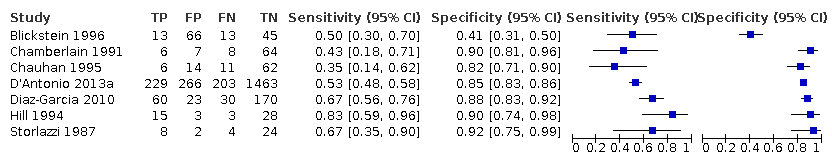
A forest plot representing sensitivities and specificities of the studies that used ultrasound abdominal circumference to detect estimated fetal weight discordance (EFWD) of 20%. FN: false negative; FP: false positive; TN: true negative; TP: true positive.

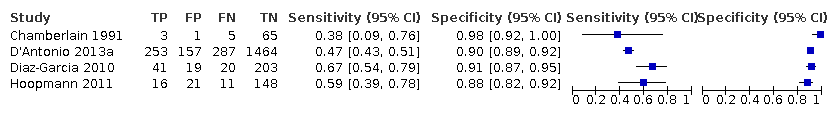
A forest plot representing sensitivities and specificities of the studies that used femoral length by ultrasound to detect estimated fetal weight discordance (EFWD) of 20%. FN: false negative; FP: false positive; TN: true negative; TP: true positive.

A forest plot representing sensitivities and specificities of all the studies that used an estimated fetal weight discordance (EFWD) of 25%. FN: false negative; FP: false positive; TN: true negative; TP: true positive.

Summary receiver operating characteristic plot of studies assessing the accuracy of ultrasound based on an estimated fetal weight discordance (EFWD) of 25%. Each study is represented as an ellipse with size of the ellipse adjusted to the sample size of the study. The filled circle represents the summary point indicating summary sensitivity and specificity of the meta‐analytic estimate. Dotted closed line represents 95% confidence region and the dashed line represents the 95% prediction region around the summary point.

A forest plot representing sensitivities and specificities of the studies that used ultrasound abdominal circumference to detect estimated fetal weight discordance (EFWD) of 25%. FN: false negative; FP: false positive; TN: true negative; TP: true positive.
A forest plot representing sensitivities and specificities of the studies that used ultrasound femoral length to detect estimated fetal weight discordance (EFWD) of 25%. FN: false negative; FP: false positive; TN: true negative; TP: true positive.


| Sensitivity | 0.51 (95% CI 0.42 to 0.60) | Prevalencesa | 18% | 15% | 28% | ||||||
|---|---|---|---|---|---|---|---|---|---|---|---|
| Specificity | 0.91 (95% CI 0.89 to 0.93) | ||||||||||
| Outcome | No. of studies and participants | Study design | Factors that may decrease certainty | Effect per 1000 women tested | |||||||
| Risk of bias | Indirectness | Inconsistency | Imprecision | Publication bias | Pretest probability of 18% | Pretest probability of 15% | Pretest probability of 28% | Test accuracy (certainty of the evidence) | |||
| True positives (women with diagnosis of birth weight discordance) | 22 studies, | Cohort‐type studies with delayed verification (cohort type accuracy study) | Very seriousb | Not serious | Very seriousc | Not serious | None | 92 (76 to 108) | 77 (63 to 90) | 143 (118 to 168) | ⊕⊝⊝⊝ |
| False negatives (women incorrectly classified as not having diagnosis of birth weight discordance) | 88 (72 to 104) | 73 (60 to 87) | 137 (112 to 162) | ||||||||
| True negatives | 22 studies, 6453 participants | Cohort‐type studies with delayed verification (cohort type accuracy study) | Very seriousb | Not serious | Very seriousc | Not serious | None | 746 (730 to 763) | 774 (757 to 791) | 655 (641 to 670) | ⊕⊝⊝⊝ |
| False positives | 74 (57 to 90) | 76 (59 to 93) | 65 (50 to 79) | ||||||||
| CI: confidence interval. | |||||||||||
| Sensitivity | 0.46 (95% CI 0.26 to 0.66) | Prevalencesa | 19% | 9% | 27% | ||||||
|---|---|---|---|---|---|---|---|---|---|---|---|
| Specificity | 0.93 (95% CI 0.89 to 0.96) | ||||||||||
| Outcome | No. of studies and participants | Study design | Factors that may decrease certainty | Effect per 1000 women tested | |||||||
| Risk of bias | Indirectness | Inconsistency | Imprecision | Publication bias | Pretest probability of 19% | Pretest probability of 9% | Pretest probability of 27% | Test accuracy (certainty of the evidence) | |||
| True positives (women with diagnosis of birth weight discordance) | 18 studies, | Cohort‐type studies with delayed verification (cohort type accuracy study) | Very seriousb | Not serious | Very seriousc | Not serious | None | 87 (49 to 125) | 41 (23 to 59) | 124 (70 to 178) | ⊕⊝⊝⊝ |
| False negatives (women incorrectly classified as not having diagnosis of birth weight discordance) | 103 (65 to 141) | 49 (31 to 67) | 146 (92 to 200) | ||||||||
| True negatives | 18 studies | Cohort‐type studies with delayed verification (cohort type accuracy study) | Very seriousb | Not serious | Very seriousc | Not serious | None | 753 (721 to 778) | 846 (810 to 874) | 679 (650 to 701) | ⊕⊝⊝⊝ |
| False positives | 57 (32 to 89) | 64 (36 to 100) | 51 (29 to 80) | ||||||||
| CI: confidence interval. | |||||||||||
| Groups | No. of studies | Sensitivity (95% CI) | Specificity (95% CI) | LR+ | LR– |
|---|---|---|---|---|---|
| BWD of 20% | 22 | 0.51 (0.42 to 0.60) | 0.91 (0.89 to 0.93) | 5.9 (4.3 to 8.1) | 0.53 (0.44 to 0.64) |
| EFWD by AC | 7 | 0.57 (0.48 to 0.66) | 0.84 (0.72 to 0.92) | 3.6 (1.8 to 7.4) | 0.51 (0.38 to 0.68) |
| EFWD by FL | 7 | 0.60 (0.53 to 0.67) | 0.87 (0.84 to 0.90) | 4.6 (3.4 to 6.1) | 0.46 (0.38 to 0.56) |
| BWD of 25% | 18 | 0.46 (0.26 to 0.66) | 0.93 (0.89 to 0.96) | 6.7 (3.0 to 14.9) | 0.58 (0.39 to 0.88) |
| EFWD by AC | 7 | 0.42 (0.27 to 0.58) | 0.88 (0.76 to 0.94) | 3.3 (1.6 to 6.9) | 0.67 (0.51 to 0.87) |
| EFWD by FL | 4 | 0.55 (0.44 to 0.65) | 0.91 (0.89 to 0.92) | 5.8 (4.3 to 7.9) | 0.50 (0.40 to 0.64) |
| AC: abdominal circumference; BWD: birth weight discordance; CI: confidence interval; EFWD: estimated fetal weight discordance; FL: femur length; LR+: likelihood ratio of a positive test; LR–: likelihood ratio of a negative test. | |||||
| Test | No. of studies | No. of participants |
| 1 Cut‐off 20% Show forest plot | 22 | 8005 |
| 2 20% abdominal circumference Show forest plot | 7 | 2846 |
| 3 20% femur length Show forest plot | 7 | 2791 |
| 4 Cut‐off 25% Show forest plot | 18 | 6471 |
| 5 25% abdominal circumference Show forest plot | 7 | 3614 |
| 6 25% femur length Show forest plot | 4 | 2714 |