Pharmacological interventions for treating chronic prostatitis/chronic pelvic pain syndrome
Abstract
Background
Chronic prostatitis/chronic pelvic pain syndrome (CP/CPPS) is a common disorder in which the two main clinical features are pelvic pain and lower urinary tract symptoms. There are currently many approaches for its management, using both pharmacological and non‐pharmacological interventions. The National Institute of Health ‐ Chronic Prostatitis Symptom Index (NIH‐CPSI) score is a validated measure commonly used to measure CP/CPPS symptoms. We considered a 25% decrease of NIH‐CPSI baseline score or a six‐point reduction as MCID.
Objectives
To assess the effects of pharmacological therapies for chronic prostatitis/chronic pelvic pain syndrome.
Search methods
We performed a comprehensive search using CENTRAL, MEDLINE, Embase, PsycINFO, CINAHL, trial registries, grey literature and conference proceedings, with no restrictions on the language of publication or publication status. The date of the latest search of all databases was July 2019.
Selection criteria
We included randomised controlled trials. Inclusion criteria were men with a diagnosis of CP/CPPS. We included all available pharmacological interventions compared to placebo or in head‐to‐head comparisons.
Data collection and analysis
Two review authors independently assessed study eligibility, extracted data, and assessed the risks of bias of included studies. We assessed the quality of the evidence (QoE) using the GRADE approach.
Main results
We included 99 unique studies in 9119 men with CP/CPPS, with assessments of 16 types of pharmacological interventions. Unless stated otherwise, our comparisons were based on short‐term follow‐up (less than 12 months). Most studies did not specify their funding sources; 21 studies reported funding from pharmaceutical companies.
1. Alpha blockers: (24 studies, 2061 participants). We are uncertain about the effects of these drugs on prostatitis symptoms when compared to placebo at short‐term follow‐up (mean difference (MD) in total NIH‐CPSI score −5.01, 95% confidence interval (CI) −7.41 to −2.61; 18 studies, 1524 participants, very low QoE) and at long‐term follow‐up (MD −5.60, 95% CI −10.89 to −0.32; 4 studies, 235 participants, very low QoE). Alpha blockers may be associated with an increased incidence of adverse events, such as dizziness and postural hypotension (risk ratio (RR) 1.60, 95% CI 1.09 to 2.34; 19 studies, 1588 participants; low QoE). Alpha blockers probably result in little to no difference in sexual dysfunction, quality of life and anxiety and depression (moderate to low QoE).
2. 5‐alpha reductase inhibitors (5‐ARI): (2 studies, 177 participants). Finasteride probably reduces prostatitis symptoms compared to placebo (NIH‐CPSI score MD −4.60, 95% CI −5.43 to −3.77; 1 study, 64 participants; moderate QoE) and may not be associated with an increased incidence of adverse events (low QoE). There was no information on sexual dysfunction, quality of life or anxiety and depression.
3. Antibiotics: (6 studies, 693 participants). Antibiotics (quinolones) may reduce prostatitis symptoms compared to placebo (NIH‐CPSI score MD −2.43, 95% CI −4.72 to −0.15; 5 studies, 372 participants; low QoE) and are probably not associated with an increased incidence in adverse events (moderate QoE). Antibiotics probably result in little to no difference in sexual dysfunction and quality of life (moderate QoE). There was no information on anxiety or depression.
4. Anti‐inflammatories: (7 studies, 585 participants). Anti‐inflammatories may reduce prostatitis symptoms compared to placebo (NIH‐CPSI scores MD −2.50, 95% CI −3.74 to −1.26; 7 studies, 585 participants; low QoE) and may not be associated with an increased incidence in adverse events (low QoE). There was no information on sexual dysfunction, quality of life or anxiety and depression.
5. Phytotherapy: (7 studies, 551 participants). Phytotherapy may reduce prostatitis symptoms compared to placebo (NIH‐CPSI scores MD −5.02, 95% CI −6.81 to −3.23; 5 studies, 320 participants; low QoE) and may not be associated with an increased incidence in adverse events (low QoE). Phytotherapy may not improve sexual dysfunction (low QoE). There was no information on quality of life or anxiety and depression.
6. Botulinum toxin A (BTA): Intraprostatic BTA injection (1 study, 60 participants) may cause a large reduction in prostatitis symptom (NIH‐CPSI scores MD −25.80, 95% CI −30.15 to −21.45), whereas pelvic floor muscle BTA injection (1 study, 29 participants) may not reduce prostatitis symptoms (low QoE). Both comparisons used a placebo injection. These interventions may not be associated with an increased incidence in adverse events (low QoE). There was no information on sexual dysfunction, quality of life or anxiety and depression.
7. Allopurinol: (2 studies, 110 participants). Allopurinol may result in little to no difference in prostatitis symptoms and adverse events when compared to placebo (low QoE). There was no information on sexual dysfunction, quality of life or anxiety and depression.
8. Traditional Chinese medicine (TCM): (7 studies, 835 participants); TCM may reduce prostatitis symptoms (NIH‐CPSI score, MD ‐3.13, 95% CI ‐4.99 to ‐1.28; low QoE) and may not be associated with an increased incidence in adverse events (low QoE). TCM probably does not improve sexual dysfunction (moderate QoE) and may not improve symptoms of anxiety and depression (low QoE). There was no information on quality of life.
The most frequent reasons for downgrading the QoE were study limitations, inconsistency and imprecision. We found few trials with active comparators.
Authors' conclusions
We found low‐ to very low‐quality evidence that alpha blockers, antibiotics, 5‐ARI, anti‐inflammatories, phytotherapy, intraprostatic BTA injection, and traditional Chinese medicine may cause a reduction in prostatitis symptoms without an increased incidence of adverse events in the short term, except for alpha blockers which may be associated with an increase in mild adverse events. We found few trials with active comparators and little evidence of the effects of these drugs on sexual dysfunction, quality of life or anxiety and depression. Future clinical trials should include a full report of their methods, including adequate masking, consistent assessment of all patient‐important outcomes, including potential treatment‐related adverse events, and appropriate sample sizes.
PICO
Plain language summary
Intervention for treating chronic prostatitis and chronic pelvic pain in men
Review question
What are the effects of medical therapies in men with longstanding pain and discomfort around their prostate and pelvis, so‐called chronic prostatitis/chronic pelvic pain syndrome (CP/CPPS)?
Background
CP/CPPS is a common disorder in which men feel pelvic pain or have bothersome symptoms (or both of these) when urinating. Its cause is unknown and there are many different treatments for this condition.
Study characteristics
The evidence was current to July 2019. We found 96 studies that were conducted between 1983 and 2016 in 8646 men with CP/CPPS, with assessment of 16 types of pharmacological interventions. These therapies were given to men in an outpatient setting. Most studies did not specify their funding sources; 21 studies reported funding from pharmaceutical companies.
Key results
Alpha blockers: we are uncertain about the effects of alpha blockers on prostatitis symptoms. Alpha blockers may increase side‐effects, for example dizziness and low blood pressure. Alpha blockers probably result in little to no difference in sexual problems, quality of life or anxiety and depression.
5‐alpha reductase inhibitors (5‐ARI): 5‐ARI probably reduce prostatitis symptoms and may not be associated with more side effects than seen in men taking a placebo. There was no information on sexual problems, quality of life or anxiety and depression.
Antibiotics: antibiotics may reduce prostatitis symptoms and are probably not associated with side effects. Antibiotics probably result in little to no difference in sexual problems and quality of life. There was no information on anxiety and depression.
Anti‐inflammatories: anti‐inflammatories may reduce prostatitis symptoms and may not be associated with side effects. There was no information on sexual problems, quality of life or anxiety and depression.
Phytotherapy: phytotherapy may reduce prostatitis symptoms and may not be associated with side effects. Phytotherapy may not improve sexual problems. There was no information on quality of life and anxiety and depression.
Botulinum toxin A (BTA): the injection of this toxin into the prostate may cause a large reduction in prostatitis symptoms, but if it is applied to muscles of the pelvis, BTA may not cause this effect. These injections may not be associated with side effects. There was no information on sexual problems, quality of life or anxiety and depression.
Allopurinol: allopurinol may result in little to no difference in prostatitis symptoms and may not be associated with side effects. There was no information on sexual problems, quality of life or anxiety and depression.
Traditional Chinese Medicine (TCM): TCM may reduce prostatitis symptoms and may not be associated with side effects. TCM probably does not improve sexual problems and it may not improve symptoms of anxiety and depression. There was no information on quality of life.
Quality of the evidence
The quality of the evidence was low to very low in most cases, meaning that there is much uncertainty surrounding the results. The most frequent problems detected in the included studies were an inadequate design, a small sample size and a short follow‐up time (usually 12 weeks).
Authors' conclusions
Summary of findings
| Alpha blockers compared to placebo for chronic prostatitis/chronic pelvic pain syndrome | |||||
| Patient or population: men with chronic prostatitis/chronic pelvic pain syndrome Some comparisons included alpha blockers as add‐on therapy to medical therapy (e.g. antibiotics) versus medical therapy alone. | |||||
| Outcomes | № of participants | Quality of the evidence | Relative effect | Anticipated absolute effects* (95% CI) | |
| Risk with placebo | Risk difference with alpha‐blockers | ||||
| Prostatitis symptoms A decrease of 25% or 6 points is considered an important improvement | 1524 | ⊕⊝⊝⊝ | ‐ | The mean prostatitis symptoms ranged from 12.1 to 24.14 | MD 5.01 lower |
| Prostatitis symptoms | 253 (4 RCTs) | ⊕⊝⊝⊝ | ‐ | The mean prostatitis symptoms ranged from 18.7 to 22.24 | MD 5.6 lower |
| Prostatitis symptoms: 'responders' | 721 | ⊕⊝⊝⊝ | RR 1.23 | Study population | |
| 477 per 1000 | 110 more per 1000 | ||||
| Adverse events Any adverse event | 1588 | ⊕⊕⊝⊝ | RR 1.60 | Study population | |
| 94 per 1000 | 56 more per 1000 | ||||
| Sexual dysfunction | 452 | ⊕⊕⊕⊝ | ‐ | The mean sexual dysfunction ranged from 16.1 to 18.4 | MD 0.26 higher |
| Quality of life | 421 | ⊕⊕⊕⊝ | ‐ | The mean quality of life ranged from 41 to 46 | MD 0.15 higher |
| Anxiety and depression | 232 | ⊕⊕⊝⊝ | ‐ | The mean anxiety and depression was 12.8 | MD 1.1 lower |
| *The risk in the intervention group (and its 95% confidence interval) is based on the assumed risk in the comparison group and the relative effect of the intervention (and its 95% CI). | |||||
| GRADE Working Group grades of evidence | |||||
| aDowngraded one level due to study limitations: unclear or high risk of bias in most domains in most studies. | |||||
| 5‐alpha reductase inhibitors compared to placebo for chronic prostatitis/chronic pelvic pain syndrome | |||||
| Patient or population: men with chronic prostatitis/chronic pelvic pain syndrome | |||||
| Outcomes | № of participants | Quality of the evidence | Relative effect | Anticipated absolute effects* (95% CI) | |
| Risk with placebo | Risk difference with 5 alpha reductase inhibitors | ||||
| Prostatitis symptoms A decrease of 25% or 6 points is considered an important improvement | 64 | ⊕⊕⊕⊝ | ‐ | The mean prostatitis symptoms was 21.7 | MD 4.6 lower |
| Prostatitis symptoms: 'responders' | 64 | ⊕⊕⊝⊝ | RR 2.13 | Study population | |
| 152 per 1000 | 171 more per 1000 | ||||
| Adverse events | 105 | ⊕⊕⊝⊝ | RR 0.87 | Study population | |
| 163 per 1000 | 21 fewer per 1000 | ||||
| Sexual dysfunction ‐ not reported | ‐ | ‐ | ‐ | ‐ | ‐ |
| Quality of life ‐ not reported | ‐ | ‐ | ‐ | ‐ | ‐ |
| Anxiety and depression ‐ not reported | ‐ | ‐ | ‐ | ‐ | ‐ |
| *The risk in the intervention group (and its 95% confidence interval) is based on the assumed risk in the comparison group and the relative effect of the intervention (and its 95% CI). | |||||
| GRADE Working Group grades of evidence | |||||
| aDowngraded one level due to high risk of bias: unclear or high risk of bias in most domains in the main study of this comparison. | |||||
| Antibiotic therapy compared to placebo for chronic prostatitis/chronic pelvic pain syndrome | |||||
| Patient or population: men with chronic prostatitis/chronic pelvic pain syndrome Some comparisons included antibiotics as add‐on therapy to medical therapy (e.g. alpha blockers) versus medical therapy alone | |||||
| Outcomes | № of participants | Quality of the evidence | Relative effect | Anticipated absolute effects* (95% CI) | |
| Risk with placebo | Risk difference with antibiotic therapy | ||||
| Prostatitis symptoms A decrease of 25% or 6 points is considered an important improvement | 372 | ⊕⊕⊝⊝ | ‐ | The mean prostatitis symptoms ranged from 8.6 to 18.2 | MD 2.43 lower |
| Prostatitis symptoms: 'responders' | 178 | ⊕⊕⊝⊝ | RR 1.12 | Study population | |
| 286 per 1000 | 34 more per 1000 | ||||
| Adverse events | 336 | ⊕⊕⊕⊝ | RR 1.01 | Study population | |
| 213 per 1000 | 2 more per 1000 | ||||
| Sexual dysfunction | 77 | ⊕⊕⊕⊝ | ‐ | The mean sexual dysfunction was 16.8 | MD 0.4 higher |
| Quality of life | 87 | ⊕⊕⊕⊝ | ‐ | The mean quality of life was 44.3 | MD 3.9 lower |
| Anxiety and depression ‐ not reported | ‐ | ‐ | ‐ | ‐ | ‐ |
| *The risk in the intervention group (and its 95% confidence interval) is based on the assumed risk in the comparison group and the relative effect of the intervention (and its 95% CI). | |||||
| GRADE Working Group grades of evidence | |||||
| aDowngraded one level due to inconsistency: statistical heterogeneity 75%. | |||||
| Anti‐inflammatories compared to placebo for chronic prostatitis/chronic pelvic pain syndrome | |||||
| Patient or population: men with chronic prostatitis/chronic pelvic pain syndrome | |||||
| Outcomes | № of participants | Quality of the evidence | Relative effect | Anticipated absolute effects* (95% CI) | |
| Risk with control | Risk difference with anti‐inflammatories | ||||
| Prostatitis symptoms A decrease of 25% or 6 points is considered an important improvement | 585 | ⊕⊕⊝⊝ | ‐ | The mean prostatitis symptoms ranged from 8.6 to 19.5 | MD 2.5 lower |
| Prostatitis symptoms: 'responders' | 82 | ⊕⊕⊝⊝ | RR 1.44 | Study population | |
| 91 per 1000 | 40 more per 1000 | ||||
| Adverse events | 540 | ⊕⊕⊝⊝ | RR 1.27 | Study population | |
| 98 per 1000 | 26 more per 1000 | ||||
| Sexual dysfunction ‐ not reported | ‐ | ‐ | ‐ | ‐ | ‐ |
| Quality of life ‐ not reported | ‐ | ‐ | ‐ | ‐ | ‐ |
| Anxiety and depression ‐ not reported | ‐ | ‐ | ‐ | ‐ | ‐ |
| *The risk in the intervention group (and its 95% confidence interval) is based on the assumed risk in the comparison group and the relative effect of the intervention (and its 95% CI). | |||||
| GRADE Working Group grades of evidence | |||||
| aDowngraded one level due to high risk of bias: unclear or high risk of bias in most domains in most studies. | |||||
| Phytotherapy compared to placebo for chronic prostatitis/chronic pelvic pain syndrome | |||||
| Patient or population: men with chronic prostatitis/chronic pelvic pain syndrome | |||||
| Outcomes | № of participants | Quality of the evidence | Relative effect | Anticipated absolute effects* (95% CI) | |
| Risk with placebo or other agents | Risk difference with phytotherapy | ||||
| Prostatitis symptoms A decrease of 25% or 6 points is considered an important improvement | 320 | ⊕⊕⊝⊝ | ‐ | The mean prostatitis symptoms ranged from 10.3 to 14.5 | MD 5.02 lower |
| Prostatitis symptoms: 'responders' | 224 | ⊕⊕⊕⊝ | RR 1.78 | Study population | |
| 384 per 1000 | 299 more per 1000 | ||||
| Adverse events | 540 | ⊕⊕⊝⊝ | RR 1.13 | Study population | |
| 41 per 1000 | 5 more per 1000 | ||||
| Sexual dysfunction | 48 | ⊕⊕⊝⊝ | ‐ | The mean sexual dysfunction was 18.5 | MD 3.5 higher |
| Quality of life ‐ not reported | ‐ | ‐ | ‐ | ‐ | ‐ |
| Anxiety and depression ‐ not reported | ‐ | ‐ | ‐ | ‐ | ‐ |
| *The risk in the intervention group (and its 95% confidence interval) is based on the assumed risk in the comparison group and the relative effect of the intervention (and its 95% CI). | |||||
| GRADE Working Group grades of evidence | |||||
| aDowngraded one level due to high risk of bias: unclear or high risk of bias in most domains in most studies. | |||||
| Botulinum toxin A compared to placebo for chronic prostatitis/chronic pelvic pain syndrome | |||||
| Patient or population: men with chronic prostatitis/chronic pelvic pain syndrome | |||||
| Outcomes | № of participants | Quality of the evidence | Relative effect | Anticipated absolute effects* (95% CI) | |
| Risk with placebo | Risk difference with botulinum toxin A | ||||
| Prostatitis symptoms Subgroup: Intraprostatic injection, participants age > 50 years old, basal NIH‐CPSI score > 30 Assessed with: NIH‐CPSI score. Benefit is indicated by lower scores A decrease of 25% or 6 points is considered an important improvement | 60 | ⊕⊕⊝⊝ | ‐ | The mean prostatitis symptoms ‐ Intraprostatic injection was 36.37 | MD 25.8 lower |
| Prostatitis symptoms Subgroup: Pelvic floor muscles injection, participants age < 50 years old, basal NIH‐CPSI score < 30 | 29 | ⊕⊕⊝⊝ | ‐ | The mean prostatitis symptoms ‐ Pelvic floor muscles injection was 27.8 | MD 2.6 lower |
| Adverse events | 89 | ⊕⊕⊝⊝ | RR 5.00 | Study population | |
| 22 per 1000 | 87 more per 1000 | ||||
| Sexual dysfunction ‐ not reported | ‐ | ‐ | ‐ | ‐ | ‐ |
| Quality of life ‐ not reported | ‐ | ‐ | ‐ | ‐ | ‐ |
| Anxiety and depression ‐ not reported | ‐ | ‐ | ‐ | ‐ | ‐ |
| *The risk in the intervention group (and its 95% confidence interval) is based on the assumed risk in the comparison group and the relative effect of the intervention (and its 95% CI). | |||||
| GRADE Working Group grades of evidence | |||||
| aDowngraded one level due to unclear risk of bias (random sequence generation). | |||||
| Allopurinol compared to placebo for chronic prostatitis/chronic pelvic pain syndrome | |||||
| Patient or population: men with chronic prostatitis/chronic pelvic pain syndrome | |||||
| Outcomes | № of participants | Quality of the evidence | Relative effect | Anticipated absolute effects* (95% CI) | |
| Risk with placebo | Risk difference with allopurinol | ||||
| Prostatitis symptoms A decrease of 25% or 6 points is considered an important improvement | 56 | ⊕⊕⊝⊝ | ‐ | The mean prostatitis symptoms was 17.21 | MD 0.21 lower |
| Adverse events Follow‐up: 3 months | 110 | ⊕⊕⊝⊝ | ‐ | No adverse events were observed in the included studies | |
| Sexual dysfunction ‐ not reported | ‐ | ‐ | ‐ | ‐ | ‐ |
| Quality of life ‐ not reported | ‐ | ‐ | ‐ | ‐ | ‐ |
| Anxiety and depression ‐ not reported | ‐ | ‐ | ‐ | ‐ | ‐ |
| *The risk in the intervention group (and its 95% confidence interval) is based on the assumed risk in the comparison group and the relative effect of the intervention (and its 95% CI). | |||||
| GRADE Working Group grades of evidence | |||||
| aDowngraded one level due to imprecision: confidence interval includes appreciable benefits and harms.˜ | |||||
| Traditional Chinese Medicine compared to placebo for chronic prostatitis/chronic pelvic pain syndrome | |||||
| Patient or population: men with chronic prostatitis/chronic pelvic pain syndrome Some comparisons included antibiotics, alpha blockers and other Western medications as co‐interventions | |||||
| Outcomes | № of participants | Quality of the evidence | Relative effect | Anticipated absolute effects* (95% CI) | |
| Risk with placebo or usual care | Risk difference with Traditional Chinese medicine | ||||
| Prostatitis symptoms A decrease of 25% or 6 points is considered an important improvement | 835 | ⊕⊕⊝⊝ | ‐ | The mean prostatitis symptoms ranged from 11.17 to 15.02 | MD 3.13 lower |
| Adverse events | 584 | ⊕⊕⊝⊝ | RR 1.34 | Study population | |
| 29 per 1000 | 10 more per 1000 | ||||
| Sexual dysfunction | 88 | ⊕⊕⊕⊝ | ‐ | The mean sexual dysfunction was 14.93 | MD 0.27 higher |
| Quality of life ‐ not reported | ‐ | ‐ | ‐ | ‐ | ‐ |
| Anxiety and depression: anxiety | 88 | ⊕⊕⊝⊝ | ‐ | The mean anxiety and depression: anxiety was 23.3 | MD 9.5 lower |
| Anxiety and depression: depression | 88 | ⊕⊕⊝⊝ | ‐ | The mean anxiety and depression: depression was 24.07 | MD 7.84 lower |
| *The risk in the intervention group (and its 95% confidence interval) is based on the assumed risk in the comparison group and the relative effect of the intervention (and its 95% CI). | |||||
| GRADE Working Group grades of evidence | |||||
| aDowngraded one level due to inconsistency: high statistical heterogeneity (> 80%). Some of this inconsistency might be explained by the differences between the interventions under this comparison. | |||||
Background
Description of the condition
Prostatitis is a common disorder affecting 1.8% of men in the USA (Suskind 2013), while 10% to 14% of men in Europe and the USA suffer from prostatitis‐like symptoms (Bajpayee 2012). This health problem motivates one per cent of primary care visits and eight per cent of urology consultations in the USA (Collins 1998). Only 5 to 10 per cent of prostatitis cases have a bacterial origin (Bartoletti 2007; De La Rosette 1993). This disorder can affect men of all ages and ethnic origins, but it is more common in younger men with a mean age at onset of 42 years old (Schaeffer 2002). The two main clinical features of prostatitis are pelvic pain and lower urinary tract symptoms, although there is a wide range of clinical presentations (Nickel 1999).
The National Institutes of Health (NIH) classification identifies four types of prostatitis (Nickel 1999): types I and II, being acute and chronic bacterial prostatitis respectively; type III, chronic prostatitis/chronic pelvic pain syndrome (CP/CPPS); and type IV, asymptomatic prostatitis. It remains unclear whether type III can be linked in all cases to prostatic involvement (True 1999), hence the alternate denomination (Chronic Pelvic Pain Syndrome). CP/CPPS is sub‐classified as type IIIa (inflammatory), and type IIIb (non‐inflammatory), depending on the presence of inflammatory cells in prostatic secretions.
CP/CPPS is defined when pelvic pain is present for at least three of the preceding six months and no other identifiable causes have been detected (Nickel 1999). Other symptoms include obstructive or irritative voiding difficulties, ejaculatory pain, and haematospermia. Men affected by CP/CPPS have a significantly decreased quality of life, and the level of pelvic pain is strongly associated with sexual dysfunction (Trinchieri 2007; Walz 2007). CP/CPPS is associated with other functional somatic syndromes such as irritable bowel syndrome, interstitial cystitis, chronic fatigue syndrome and fibromyalgia (Rodriguez 2009; Suskind 2013). Diagnosis is usually based on the man's history, physical examination, urinalysis and the two‐ or four‐glass test (Nickel 2012). Further investigations are performed when considering differential diagnosis.
There are different theories about the aetiology and pathophysiology of CP/CPPS, as follows.
-
Infection: bacterial DNA is detected in a significant proportion of men with CP/CPPS (Hou 2012). A previous history of sexually‐transmitted infection is more frequent in men with CP/CPPS (Pontari 2005). Nevertheless, the isolation of uropathogenic bacteria in prostatic fluids is similar to controls (Nickel 2003a).
-
Inflammation/autoimmunity: elevated concentrations of pro‐inflammatory cytokines (interleukin 1, tumour necrosis factor, interferon‐γ) and of autoimmunity activity (T‐cell proliferation responses to prostate antigens) is found in men suffering from CP/CPPS and in animal models (Pontari 2004).
-
Neuropsychological factors: the central nervous system might be involved through several mechanisms of pain sensitisation (Miller 2002; Yang 2003). Increased stress burden, stress response, pain catastrophising cognitions, poor social functioning and psychiatric comorbidity (anxiety and depression) are contributing factors (Riegel 2014).
-
Dyssynergic voiding associated with bladder neck hypertrophy is detected in men suffering from refractory CP/CPPS (Dellabella 2006; Hruz 2003). Intra‐prostatic urinary reflux and increased intra‐prostatic pressure is associated with inflammation in CP/CPPS (Kirby 1982; Mehik 2002).
-
Other theories described for this condition include: adrenal axis abnormalities (Anderson 2008), pelvic floor muscles dysfunction (Hetrick 2006; Shoskes 2008a), pelvic nerves entrapment (Antolak 2002), genetic predisposition to inflammation (Shoskes 2002), and oxidative stress (Arisan 2006).
Description of the intervention
There are a wide variety of interventions for treating CP/CPPS, each one addressing a different pathophysiological or symptomatic framework. The diversity of available interventions reflects the complexity of the condition and how little is known about its determinants.
Management of CP/CPPS involves a multimodal and tailored approach (Rees 2015; Shoskes 2008b). Some of the strategies used alone or in combination are the following.
Pharmacological interventions:
-
Alpha blockers
-
5‐alpha reductase inhibitors
-
Antibiotic therapy (quinolones, tetracyclines and other agents)
-
Anti‐inflammatories (nonsteroidal anti‐inflammatory drugs (NSAIDs), corticosteroids)
-
Phytotherapy (pollen extract and bioflavonoids)
-
Botulinum toxin A
-
Allopurinol
-
Traditional medicine (traditional Chinese medicine, etc.)
-
Other pharmacological agents (e.g. pregabalin)
Non‐pharmacological interventions:
-
Acupuncture and electroacupuncture
-
Local thermotherapy
-
Extracorporeal shockwave therapy
-
Myofascial trigger point release
-
Biofeedback
-
Psychological support
-
Prostatic surgery
-
Other miscellaneous non‐pharmacological therapies
Multimodal approaches:
-
Combination therapy: alpha blockers plus antibiotics, antibiotics plus analgesics, etc.
Adverse effects
Common side effects of pharmacological regimens include (Brunton 2011) the following.
-
Alpha blockers: hypotension, ejaculatory dysfunction, headache, dizziness, and nasal congestion
-
5‐alpha‐reductase inhibitors: decreased libido, impotence, potentiation of hypotension (in combination with alpha blockers)
-
Quinolones: gastrointestinal discomfort, headache, dizziness, rash, and tendinopathy
-
Tetracyclines: gastrointestinal discomfort, rash, teeth discolouration, and hepatotoxicity
-
NSAIDs: peripheral oedema, rash, dyspepsia, peptic ulcer and bleeding, renal and hepatic injury, and increased risk of adverse cardiovascular events
-
Phytotherapy: gastrointestinal discomfort and allergic reactions
The most common side effect in physical therapies is pain worsened during or immediately after the procedure (Fitzgerald 2013).
How the intervention might work
Pharmacological interventions
Alpha blockers reduce the autonomic sympathetic tone in the bladder neck and prostate, improving urinary flow, and lower urinary tract symptoms. 5‐alpha‐reductase inhibitors reduce the production of dihydrotestosterone and consequently the size of the prostatic gland dependent on the stimulation of this hormone. This might reduce pain and impaired voiding (Brunton 2011).
NSAIDs are antagonists to the cyclo‐oxygenases enzymes (COX) type 1 and 2 and their pro‐inflammatory sub‐products (Brunton 2011). Both nonselective and selective (COX‐2) inhibitors could therefore decrease inflammatory mediated pain in CP/CPPS.
Phytotherapy includes the use of pollen extract and bioflavonoids that appear to have anti‐inflammatory properties, decreasing acinar cell proliferation and the production of interleukin‐6, tumour necrosis factor α, and other pro‐inflammatory cytokines (Capodice 2005; Kamijo 2001).
Even if CP/CPPS is defined when no bacterial cause can be identified, antibiotics have been used to treat it on the assumption of the existence of an occult or under‐treated infection (Hou 2012).
Allopurinol would reduce the prostatic secretions of purine and pyrimidine base containing metabolites in urine. These metabolites could be responsible for prostatic inflammation through urinary reflux (McNaughton 2002).
Botulinum toxin A has denervating properties and also causes reduction in pain mediators when applied to the prostate in animal models. It also causes apoptosis and involution of the prostate gland (Chuang 2006).
Non‐pharmacological interventions
Acupuncture targets specific cutaneous points representing various internal organs using fine needle insertion and sometimes adding electric current to increase stimulation (electroacupuncture). In animal models electroacupuncture has anti‐inflammatory properties and activates analgesic neurotransmitters (Kim 2006).
Locally‐induced hyperthermia, using transrectal or transurethral procedures, could decrease oxygen free radicals associated with prostatic inflammation (Gao 2012).
Myofascial trigger points release targets pelvic floor musculature dysfunction as a potential cause or contributor to CP/CPPS (Fitzgerald 2013). Biofeedback also addresses pelvic floor muscle through initial contraction in order to achieve further relaxation (Capodice 2005).
It has been suggested that psychological treatments could be helpful in all types of chronic pain syndromes and the psychiatric comorbidity associated with the condition (e.g. depression secondary to chronic pain) (Riegel 2014).
Clinical phenotyping
Clincal phenotyping is a strategy that was developed in order to deliver customised treatment in an aetiologic framework (Shoskes 2008b). The UPOINT system addresses six domains: Urinary symptoms, Psychosocial dysfunction, Organ‐specific findings, Infection, Neurologic dysfunction, and Tenderness of muscles, and offers an algorithmic approach to the use of the aforementioned interventions. The number of affected domains correlates significantly with the prostatitis symptoms score, and the addition of a Sexual dysfunction domain (UPOINT(S)) improves accuracy in stratification of symptom severity (Magri 2010). While in itself it is not an intervention, it serves as a screening tool to select the most appropriate intervention for each person.
Why it is important to do this review
The Cochrane Urology Group undertook an extensive prioritisation exercise to identify a core portfolio of the most clinically important titles. This title was identified as a clinically important priority by the urology expert panel for development, maintenance, and investment of resources by the editorial base.
CP/CPPS is a prevalent condition amongst men and it causes significant impairment of quality of life. There was a previous Cochrane Review on the same subject, but with a different methodological approach (McNaughton Collins 1999). Other non‐Cochrane systematic reviews were also undertaken in previous years: some of them focused on individual interventions (Qin 2016; Yang 2006; Zhu 2014), while others had a wider scope of interventions (Anothaisintawee 2011; Cohen 2012; Magistro 2016). We consider that a new and updated Cochrane Review is needed in order to critically summarise the body of evidence for this complex condition and using the GRADE approach, thus providing key information about the best estimate of the magnitude of the effect in relative terms and absolute differences for patient‐important outcomes. Previous systematic reviews did not use this approach and had variable adherence to the rigorous methodology recommended by Cochrane.
The protocol for this review was first published in August 2016 with the title Interventions for treating chronic prostatitis/chronic pelvic pain syndrome (Franco 2017). Due to the retrieval of a significant number of included studies, the review team and the Cochrane Urology Group decided to split the review into two more narrowly defined reviews: Non‐pharmacological interventions for treating chronic prostatitis/chronic pelvic pain syndrome (Franco 2018) and Pharmacological interventions for treating chronic prostatitis/chronic pelvic pain syndrome.
Objectives
To assess the effects of pharmacological therapies for chronic prostatitis/chronic pelvic pain syndrome.
Methods
Criteria for considering studies for this review
Types of studies
We included randomised controlled trials (RCTs). We included studies regardless of their publication status or language of publication.
Types of participants
We included men of all ages, regardless of social condition or ethnic origin, suffering from chronic prostatitis/chronic pelvic pain syndrome (CP/CPPS), according with type III prostatitis of the NIH classification.
If we identified studies in which only a subset of participants were relevant to this review, we included them if data were available separately for the relevant subset.
Types of interventions
We planned to investigate the following comparisons of experimental intervention versus comparator intervention. Concomitant interventions have to be the same in the experimental and comparator groups to establish fair comparisons. We performed a condition‐based comprehensive bibliographic search in order to find all interventions tested so far for CP/CPPS; some of them therefore might not be listed in this section.
Pharmacological interventions:
-
Alpha blockers
-
5‐alpha reductase inhibitors
-
Antibiotic therapy (quinolones, tetracyclines and other agents)
-
Anti‐inflammatories (nonsteroidal anti‐inflammatory drugs (NSAIDs), corticosteroids)
-
Phytotherapy (pollen extract and bioflavonoids)
-
Botulinum toxin A
-
Allopurinol
-
Traditional medicine (traditional Chinese medicine, etc.)
-
Other pharmacological agents
Multimodal approaches:
-
Combination pharmacological therapy: e.g. alpha blockers plus antibiotics, antibiotics plus analgesics, etc.
Comparator interventions
-
Placebo
-
No treatment
-
Other types of pharmacological interventions
Comparisons
We perform head‐to‐head comparisons or intervention versus placebo/no‐treatment comparisons. Pharmacological treatments are compared by drug and by class. For example:
-
Alpha blockers versus placebo
-
Alpha blockers plus quinolones versus placebo
And also
-
Tamsulosin versus placebo
-
Tamsulosin plus ciprofloxacin versus placebo
We have not included in this review those studies evaluating the comparison between pharmacological and non‐pharmacological interventions, and those which combine non‐pharmacological and pharmacological interventions in the same arm; this is to prevent overlapping with the review Non‐pharmacological interventions for treating chronic prostatitis/chronic pelvic pain syndrome (Franco 2018).
Types of outcome measures
We have not used the measurement of the outcomes assessed in this review as an eligibility criterion.
Primary outcomes
-
Prostatitis symptoms
-
Adverse events
Secondary outcomes
-
Sexual dysfunction
-
Quality of life (QoL)
-
Depression and anxiety
-
Urinary symptoms
Method and timing of outcome measurement
We used the clinically important difference for the review outcomes, to rate the overall quality of the evidence in 'Summary of finding' tables (Johnston 2010). When the mean difference (MD) or risk ratio (RR) was equal to or larger than the minimal clinically important difference (MCID), we assumed that many participants may have gained clinically meaningful improvement from treatment; when the MD was at least half of the MCID but less than the MCID, an appreciable number of participants had probably achieved a clinically meaningful improvement; and when the MD was less than one‐half of the MCID, it was unlikely that an appreciable number of participants achieved clinically meaningful improvement (Johnston 2010).
Prostatitis symptoms
-
Measured by the National Institutes of Health ‐ Chronic Prostatitis Symptom Index (NIH‐CPSI) as total score and sub‐score measurements, when possible, and other validated scales.
-
We considered an MCID in NIH‐CPSI score as a 25% decrease or a six‐point reduction from baseline (Nickel 2003b). This threshold was used to measure the 'responders rate' (Cates 2015).
Adverse events
-
Defined as treatment intolerance, adverse effects of the interventions at any time after participants were randomised to intervention/comparator groups
-
There was no established threshold for adverse events. We considered the clinically important differences of adverse events above as a relative risk reduction of at least 25% (Guyatt 2011a)
Sexual dysfunction
-
Measured by validated scales (e.g. International Index of Erectile Function (IIEF))
-
We considered the MCID in the erectile function domain score of the IIEF to be four (Rosen 2011). We planned to use different thresholds of MCID based on the severity of erectile dysfunction, with a threshold of two for men with mild erectile dysfunction, five with moderate erectile dysfunction and seven with severe erectile dysfunction (Rosen 2011). We also considered an IIEF‐5 of over five points as the MCID (Spaliviero 2010).
Quality of life
-
Assessed by the Medical Outcomes Study Short Form 12 (SF‐12) or other validated scales
-
We considered an MCID of SF‐12 physical component score to be eight and SF‐12 mental component score to be four (Parker 2013)
Depression and anxiety
-
Assessed by Beck Depression Inventory, State Anxiety Inventory‐Y or other validated scales
-
We considered an MCID of Beck Depression Inventory to be 11 and State Anxiety Inventory‐Y to be 10 (Button 2015; Corsaletti 2014)
-
We considered an MCID of Hospital Anxiety and Depression scale to be 1.6 (Puhan 2008)
Urinary symptoms
-
Measured by International Prostate Symptom Score (IPSS) or American Urological Association Symptom Score (AUASS)
-
We considered improvement of the IPSS score of three points as an MCID to assess efficacy and comparative effectiveness (Barry 1995). We planned to use different thresholds of MCID based on the severity of IPSS, with a threshold of three for men with mild lower urinary tract symptomatology (LUTS), five for moderate LUTS and eight for severe LUTS (Barry 1995).
We considered outcomes measured up to and including 12 months after randomisation as short‐term, and later than 12 months as long‐term.
Main outcomes for 'Summary of findings' tables
We present 'Summary of findings' tables reporting the following outcomes, listed according to priority.
-
Prostatitis symptoms
-
Adverse events
-
Sexual dysfunction
-
QoL
-
Depression and anxiety
Search methods for identification of studies
We searched for all published and unpublished RCTs meeting our stated inclusion/exclusion criteria, without restrictions by language, publication date or publication status, and in consultation with the Cochrane Urology Group Information Specialist.
Electronic searches
We identified published, unpublished and ongoing studies by searching the following databases from their inception:
-
Cochrane Central Register of Controlled Trials (CENTRAL; latest issue in 10 July 2019) in the Cochrane Library;
-
PubMed (1946 to 10 July 2019);
-
Embase Elsevier (1947 to 10 July 2019);
-
PsycINFO OVID (1887 to 10 July 2019);
-
CINAHL EBSCO (1937 to 10 July 2019);
-
ClinicalTrials.gov (www.clinicaltrials.gov, 10 July 2019);
-
ISRCTN Registry (BioMed Central; www.isrctn.com/, 10 July 2019);
-
World Health Organization International Clinical Trials Registry Platform (www.who.int/trialsearch, 10 July 2019).
We modelled the search strategies for databases on the search strategy designed for PubMed (Appendix 1; Appendix 2; Appendix 3; Appendix 4; Appendix 5; Appendix 6). The PubMed search used the Cochrane Highly Sensitive Search Strategy for identifying randomised trials in MEDLINE: sensitivity maximising version (2008 revision; Lefebvre 2011). The Embase search used the trial filter for therapy, maximising sensitivity developed by the Health Information Research Unit (HIRU) at McMaster University, adapted from OVID to the Elsevier interface (HIRU 2015). For CENTRAL and clinical trials registries filters are not applicable. We did not use filters for PsycINFO and CINAHL because the results likely to be obtained were very few.
Searching other resources
We tried to identify other potentially eligible trials or ancillary publications by searching the reference lists of retrieved included trials and relevant reviews, meta‐analyses and health technology assessment reports. We also contacted authors of included studies to identify any further studies that we may have missed. We contacted drug and device manufacturers for ongoing or unpublished trials. We searched abstract proceedings of the American Urological Association, European Association of Urology and Society of Sexual Medicine of the last three years for unpublished studies (Appendix 7).
We also searched other grey literature sources such as:
-
Open Grey (www.opengrey.eu/);
-
New York Academy of Medicine Grey Literature Report (www.greylit.org/);
-
Google Scholar.
Data collection and analysis
Selection of studies
We used reference management software (EndNote) and Covidence to identify and remove duplicate records. Three review authors (JVAF, TT, VV) working in pairs, independently scanned the abstract, title, or both, of remaining records retrieved, to determine which studies should be assessed further. Five review authors (JVAF, SI, TT, VV, YX) investigated all potentially relevant records in full text, mapped records to studies, and classified studies as included studies, excluded studies, studies awaiting classification or ongoing studies, in accordance with the criteria for each provided in the Cochrane Handbook for Systematic Reviews of Interventions (Higgins 2011a). We used Covidence for title/abstract and full‐text screening. We resolved any discrepancies through consensus or by recourse to a third review author (JHJ). If we could not resolve disagreements, we designated the study as 'awaiting classification' (Characteristics of studies awaiting classification) and we contacted study authors for clarification. We documented reasons for the exclusion of studies that may have reasonably been expected to be included in the review in a Characteristics of excluded studies table. We present an adapted PRISMA flow diagram showing the process of study selection (Liberati 2009).
Data extraction and management
We developed a dedicated data abstraction form that we piloted ahead of time.
For studies that fulfilled our inclusion criteria, seven review authors (FIT, JHJ, JVAF, SI, TT, VV, YX), working in pairs, independently abstracted the following information, which is provided in the Characteristics of included studies table.
-
Study design;
-
Study dates (if dates are not available then this will be reported as such);
-
Study settings and country;
-
Participant inclusion and exclusion criteria;
-
Participant details, baseline demographics;
-
The number of participants by study and by study arm;
-
Details of relevant experimental and comparator interventions, such as dose, route, frequency, and duration;
-
Definitions of relevant outcomes, and method and timing of outcome measurement, as well as any relevant subgroups;
-
Study funding sources;
-
Declarations of interest by primary investigators.
We further summarise some of the characteristics of the studies, participants and interventions in additional tables (Table 1; Table 2).
| Study | Intervention | Dose | Comparison | Dose for comparison Co‐interventions |
| Tadalafil study | 5 mg daily | Only co‐intervention | Both arms received levofloxacin 500 mg daily | |
| Ciprofloxacin + tamsulosin | Ciprofloxacin 500 mg twice daily, tamsulosin 0.4 mg once daily | C1: Ciprofloxacin C2: Tamsulosin C3: Placebo | They used double placebo (factorial design) | |
| Cernilton® (pollen extract) | 2 pills, 3 times a day | Cernilton® (pollen extract) | 1 pill, 3 times a day | |
| Prednisolone | 20 mg once daily and then tapered to 5 mg in 1 month | Placebo | Same regimen as active treatment | |
| Prolit super (plant extracts) | 4 capsules a day | Placebo | Same regimen as active treatment | |
| Deprox ® (pollen extract) | 2 capsules a day | Ibuprofen | 600 mg three times daily | |
| Deprox ® (pollen extract) | 2 capsules a day | Bromelain | 2 tablets a day | |
| Mepatricin | 40 mg daily | Vitamin C (as placebo) | 500 mg daily | |
| Alfusozin | 10 mg daily | C1: Terpene mixture 1 capsule three times a day C2: Only co‐intervention | All participants received levofloxacin 300 mg daily | |
| Terazosin | Titrated from 1 to 5 mg daily in two weeks | Placebo | Same regimen as active treatment | |
| Qiantongding decoction | Mix of herbal medications (oral infusion), twice a day | XiaoYanTong (Indometacin) | 25 mg tablet three times a day | |
| Tamsulosin | 0.2 mg daily | Placebo | Same regimen as active treatment | |
| Levofloxacin | 500 mg daily | C1: Ciprofloxacin 500 mg daily C2: Levofloxacin 1 g daily C3: No antibiotic | ‐ | |
| Roxithromycin | 300 mg daily | C1: Ciprofloxacin 1g daily C2: Aceclofenac 200 mg daily | ‐ | |
| Cytoflavin | 10 ml intravenously for 10 days, then 4 pills a day for 20 days | No cytoflavin | Both arms received: α‐blockers ‐ 1 month anti‐inflammatory drugs – 2 weeks prostate massage and vibrovacuum fallostimulation – 10 times antibiotics – 10 days | |
| Mepartricin | 40 mg daily for 60 days | Placebo | Same regimen as active treatment | |
| Phenoxybenzamine | 20 mg daily | Placebo | Same regimen as active treatment | |
| Pollen extract | 74 mg in Prolit® capsules | Placebo | Same regimen as active treatment | |
| Botulinum toxin A | 100 units applied in the external urethral sphincter | Botulinum toxin A | 100 units applied to the prostate and sphincter | |
| Quinolone + ibuprofen + terazosin | 500 mg, 400 mg and 5 mg respectively | C1: Terazosin 5 mg C2: Quinolone 500 mg + ibuprofen 400 mg | ‐ | |
| Botulinum toxin A | 200 units applied to the prostate | Placebo | Same regimen as active treatment | |
| Palmitoylethanolamide | 300 mg in Penease® capsules twice a day | Serenoa repens | 320 mg 1 capsule daily [All] "patients received a full course of pharmacological therapy" before allocation | |
| Duloxetin | 60 mg, escalated during the first 15 days | Only co‐interventions | Co‐interventions included Serenoa repens and tamsulosin | |
| Zafirlukast | 20 mg twice a day | Placebo | Same regimen as active treatment Both arms received doxycycline 100 mg twice daily for 4 weeks | |
| Botulinum toxin A | 100 units applied to pelvic floor muscles | Placebo | Same regimen as active treatment | |
| Terasozin | 2 mg daily | Placebo | Same regimen as active treatment | |
| Bazheng decoction | 320 mL daily | Only co‐intervention | Co‐intervention: tamsulosin 0.2 mg a day | |
| Pollen extract | 63 mg 3 times a day | Eviprostat® (herbal extract) | 1 capsule 3 times a day | |
| Levofloxacin | 200 mg daily | C1: Doxazosin C2: Levofloxacin + Doxazosin | 4 mg daily | |
| Desketoprofen | 12.5 mg 3 times a day | C1: Indomethacin 25 mg 3 times a day C2: Only co‐interventions | All participants received terazosin 2 mg daily for 4 weeks | |
| Terazosin | 3 ‐ 4 mg | No terazosin | All participants received levofloxacin 300 mg/day, tamiflunate 3 tablets/day for 12 weeks | |
| Serenoa repens | 325 mg daily | Finasteride | 5 mg daily | |
| Tamsulosin | 0.2 mg daily | C1: Ibuprofen + Misoprostol C2: Tamsulosin + ibuprofen + misoprostol | 600 mg ibuprofen three 3 times a day, 300 mcg misoprostol 3 times a day | |
| Propiverine | 20 mg daily | No propiverine | Both groups received gatifloxacin 200 mg twice daily | |
| Ciprofloxacin | 500 mg twice daily | C1: Diclofenac C2: Only co‐intervention | 50 mg twice daily Both groups received tamsulosin 0.2 mg daily for 12 weeks | |
| Solifenacin | 5 mg daily | No solifenacin | Both groups received ciprofloxacin 1000 mg daily for 8 weeks | |
| Mirodenafil | 50 mg daily | Only co‐intervention | Both groups received levofloxacin 500 mg daily for 6 weeks | |
| Doxazosin | 2 mg daily | C1: Ciprofloxacin C2: Doxazosin + ciprofloxacin | 500 mg twice a day | |
| Terazosin | 5 mg daily | C1: Tamsulosin C2: Placebo | 0.4 mg daily | |
| Sertraline | 50 mg daily | Placebo | Same regimen as active treatment | |
| Terpene mixture | Rowatinex® 200 mg | Ibuprofen | 600 mg 3 times a day | |
| Finasteride | 5 mg | Placebo | Same regimen as active treatment Ketoprofene was provided to both group for pain relief | |
| QianLieAnShuan (Prostat, 前列安栓) | Herbal suppository each night | Placebo suppository | Same regimen as active treatment | |
| Tiaoshen Tonglin | Mix of herbal medications (oral 150 ml infusion) daily | Terazosin | 2 mg daily | |
| Qianlieping | 2 g herbal capsule 3 times a day | C1: Tamsulosin C2: Qianlieping + Tamsulosin | 0.2 mg daily | |
| Vardenafil | 10 mg daily before sexual intercourse (from week 5 onwards) | Only co‐interventions | Both groups received traditional Chinese medicine (Huafenqinutang oral dose for 8 weeks) | |
| Phenoxybenzamine | 10 mg twice a day | C1: Flavoxate C2: Placebo | 200 mg 3 times a day | |
| Deprox ® (pollen extract) | 2 tablets a day | Serenoa repens | 320 mg daily | |
| Deprox ® (pollen extract) | 2 tablets a day | Quercetin | 500 mg twice daily | |
| Alfusozin | 5 mg twice a day | Placebo | Same regimen as active treatment Both groups "were allowed to take analgesics (ibuprofen, ketoprofen, diclofenac)" | |
| Alfusozin | 10 mg daily | No alfuzosin | Both groups received levofloxacin 100mg 3 times a day | |
| Profluss ® (Serenoa repens + lycopene + seleniated sodium) | 320 mg | Serenoa repens | 320 mg | |
| Curcumin‐calendula | 350 mg curcumin and 80 mg calendula in rectal suppositories daily | Placebo | Same regimen as active treatment | |
| Levofloxacin | 500 mg daily | Placebo | Same regimen as active treatment | |
| Rofecoxib | 50 mg and 25 mg doses daily | C1: Rofecoxib C2: Placebo | All participants had the same regimen All participants were permitted to take up to 2.6 g of paracetamol for rescue analgesia | |
| Finasteride | 5 mg daily | Placebo | Same regimen as active treatment | |
| Tamsulosin | 0.4 mg daily | Placebo | Same regimen as active treatment | |
| Pentosan polysulphate | 300 mg 3 times a day | Placebo | Same regimen as active treatment | |
| Alfusozin | 10 mg daily | Placebo | Same regimen as active treatment | |
| Silodosin | 8 mg daily | C1: Silodosin (4 mg) C2: Placebo | Same regimen as active treatment | |
| Tanezumab | 20 mg intravenous single dose | Placebo | Same regimen as active treatment | |
| PPC (aminoacid preparation) | 6 capsules a day | Pollen extract | Same regimen as active treatment | |
| Cranberry juice | 150 ml twice daily | No treatment | All participants underwent an 8 week‐run‐in period with levofloxacin 100mg 3 times a day, NSAID, alpha blocker, behaviour therapy, and hot sitz bath; for non‐responder, 4 additional weeks of same treatments were added | |
| Tadalafil | 10 mg daily | Only co‐intervention | Both groups received levofloxacin 500 mg daily for 4 weeks | |
| Tadalafil | 5 mg daily | Only co‐intervention | Both groups received levofloxacin 500 mg daily for six weeks | |
| Antiphlogistic agent | Mixture of herbal remedies 3 times a day | C1: Antiphlogistic + enema C2: Antiphlogistic + suppository C3: Antiphlogistic + "rectal fumigation" | ‐ | |
| Allopurinol | 300 mg twice a day | C1: Allopurinol 300 mg + placebo C2: Placebo twice a day | Both groups received the same number of pills | |
| Pregabalin | Titrated from 150 to 600 mg daily | Placebo | Same regimen as active treatment | |
| Serenoa repens | No description on dose or regimen | Placebo | No description on dose or regimen | |
| Alfusozin | 10 mg daily | Only co‐intervention | Both groups received tosufloxacin 150mg 3 times a day | |
| QianLieAnWan | Herbal ball‐shaped formulation, 9g 2 ‐ 3 times a day | C1: QianLieKang C2: Pollen extract capsule | ‐ | |
| Quercetin | 500 mg twice a day | Placebo | Same regimen as active treatment | |
| Tadalafil | 5 mg daily | Only co‐interventions | Both groups received levofloxacin 500 mg for 6 weeks and alfuzosin 10 mg for 6 weeks | |
| Terazosin | Titrated to 5 mg daily | Placebo | Same regimen as active treatment | |
| QianLieAnTong | Herbal capsule 0.38 g four tables 3 times a day | No QianLieAnTong | Both groups received terazosin 2 mg daily | |
| QianLieAnShuan (Prostat, 前列安栓) | Herbal suppository each night | No QuanLieAnShuan (Prostant) | Both groups received alpha blockers (tamsulosin or terazosin) | |
| Tiocolchicoside + ibuprofen | 120 (sic) and 1200 mg respectively, daily | Only co‐intervention | Both groups received terazosin 5 mg a day | |
| Tiocolchicoside + ibuprofen + doxazosin | 12 mg + 400 mg + 4 mg respectively, daily | C1: Doxazosin C2: Placebo | C1: Doxazosin 4 mg daily | |
| Fluvoxamine | 50 mg daily | Placebo | Same regimen as active treatment | |
| Pollen extract | 60 mg carnitine twice a day, daily | Placebo | Same regimen as active treatment Both groups were pretreated with azithromycin (250 mg every 6 hours for 1 day) | |
| OM‐89 (E. coli lysate) | 6 mg from 18 strains | Placebo | Same regimen as active treatment Other medications were allowed in both groups | |
| Chuanshentong | Sage and carrot‐family herbal extracts, injected in the prostate | Placebo injection | Same regimen as active treatment | |
| Terazosin | 2 mg daily | C1: Levofloxacin C2: Terazosin + Levofloxacin | Levofloxacin dose: 200 mg twice daily Both groups received dietary advice and prostatic massage once a week and were advised to take warm baths | |
| Pentosan polysulphate | 100 mg twice daily | Placebo | Same regimen | |
| Doxazosin | 4 mg daily | C1: Diclofenac C2: Doxazosin + diclofenac | 75 mg daily | |
| YuLeShu | Herbal mixture 20 ml 3 times a day | Only co‐interventions | Both groups received levofloxacin 0.2g twice a day, doxazosin 2 mg daily, QianLieTongYu 3 times a day, 4 capsules each time and weekly prostate massage | |
| Pollen extract (普适泰 = 舍尼通) | 0.375 g 3 times a day | Antibiotic treatment | Sulfamethoxazole 2 tablets, twice daily 10 days, ofloxacin 0.2 g, twice daily 10 days, minocycline 0.1 g twice daily, 10 days, sequentially, repeated monthly for 3 months | |
| Prednisone | 15 mg daily | Placebo | Both groups received levofloxacin 100 mg twice a day for 4 weeks | |
| Terazosin | 1 mg daily | C1: Tamsulosin C2: Placebo | 0.2 mg daily | |
| Pollen extract (普适泰 = 舍尼通) | 0.375 g twice a day | Placebo | Both groups received levofloxacin 100 mg twice a day for 4 weeks | |
| Tamsulosin | 0.2 mg daily | C1: Levofloxacin C2: Tamsulosin + levofloxacin | Levofloxacin 0.2 g daily | |
| Doxazosin | Dose was not defined | Only co‐intervention | Both groups received gatifloxacin 200mg twice daily | |
| Celecoxib | 200 mg daily | Celecoxib | 200 mg 3 times a day | |
| Aike decoction | Twice daily | C1: Bazhengsan decoction C2: Prostatitis decoction C3: Placebo | All decoctions were administered twice daily | |
| Sertraline | Titrated from 50 to 100 mg individually | C1:Duloxetine C2: Only co‐intervention | Duloxeine titrated from 30 to 120 mg individually All participants received doxazosin 4 mg daily | |
| Celecoxib | 200 mg daily | Placebo | Same regimen | |
| Tetracycline | 500 mg daily | Placebo | Placebo was "Vitamin B" | |
| Allopurinol | 100 mg 3 times a day | Placebo | Same regimen |
C1, C2, C3 were used to refer to multiple treatment arms. NSAID: Nonsteroidal anti‐inflammatory drugs. Blank cells indicate that dosing is described in the adjacent cell and co‐interventions were not described.
| Study | n randomised | n analysed | Duration ‐ Follow‐up | Mean age (years) Baseline | Previous treatments | Mean NIH‐CPSI score Baseline | Trial period | Country | Funding |
| 108 | 108 | 4 weeks | 40.55 | N/A | N/A | N/A | Saudi Arabia | None | |
| 196 | 174 | 12 weeks | 44.58 | N/A | 24.78 | 2001 ‐ 2002 | USA and Canada | Government + Industry | |
| 78 | 78 | 12 weeks | 36.90 | N/A | 22.50 | 2008 | Russia | None | |
| 21 | 18 | 8 weeks 52 weeks | 41.05 | N/A | 24.45 | 2000 ‐ 2002 | UK | Government | |
| 57 | 57 | 8 weeks | N/A | N/A | 22.00 | N/A | Russia | None | |
| 87 | 84 | 4 weeks | 33.75 | N/A | 25.20 | 2012 | Italy | N/A | |
| 70 | 65 | 12 weeks | 32.60 | N/A | 25.35 | 2015 | Italy | N/A | |
| 54 | 42 | 4 weeks | 34.00 | N/A | N/A | N/A | Italy | N/A | |
| 103 | 103 | 8 weeks | 39.27 | N/A | 24.53 | 2006 ‐ 2008 | South Korea | N/A | |
| 100 | 86 | 12 weeks 14 weeks | 35.50 | N/A | 26.15 | 2000 ‐ 2001 | Malaysia and US | Industry | |
| 70 | 70 | 4 weeks | 29.60 | No | 24.70 | 2007 ‐ 2008 | China | N/A | |
| 100 | 93 | 24 weeks 120 weeks | 34.30 | No | 22.90 | 2003 ‐ 2007 | China | N/A | |
| 215 | 215 | 6 weeks | N/A | Yes | N/A | N/A | Taiwan | N/A | |
| 75 | 75 | 4 weeks 12 weeks | 29.10 | N/A | 21.40 | 2011 | South Korea | N/A | |
| 60 | Not ANLZ | 4 weeks | N/A | N/A | N/A | N/A | Russia | None | |
| 30 | 26 | 8 weeks | 33.00 | N/A | 25.00 | 2001 ‐ 2002 | Italy | N/A | |
| 40 | 30 | 6 weeks | 39.00 | Yes | N/A | N/A | Germany | Industry | |
| 60 | 58 | 24 weeks | 35.00 | Yes | N/A | N/A | USA | Industry | |
| 52 | 52 | 52 weeks | 36.50 | Yes | N/A | N/A | Egypt | N/A | |
| 87 | 87 | 12 weeks 20 weeks | 34.20 | N/A | 23.92 | 2004 ‐ 2008 | Turkey | N/A | |
| 60 | 60 | 24 weeks | 40.42 | Yes | 34.09 | 2011 ‐ 2013 | Iran | N/A | |
| 44 | 44 | 12 weeks | 41.32 | N/A | N/A | 2014 ‐ 2015 | Italy | N/A | |
| 38 | 34 | 16 weeks | 46.80 | N/A | 24.68 | 2009 ‐ 2012 | Italy | N/A | |
| 20 | 17 | 4 weeks | 35.75 | N/A | N/A | N/A | UK | Industry | |
| 29 | 29 | 4 weeks | 50.50 | Yes | 25.95 | N/A | USA | N/A | |
| 91 | 69 | 12 weeks | 39.60 | N/A | PSSI 9.61/9.27 | 1997 ‐ 1999 | Turkey | N/A | |
| 96 | 96 | 2 weeks | 32.15 | N/A | 27.40 | 2012 ‐ 2013 | China | N/A | |
| 100 | 80 | 8 weeks | 51.55 | No | 21.30 | 2009 ‐ 2013 | Japan | N/A | |
| 81 | 81 | 6 weeks | 40.03 | No | 23.03 | 2004 | South Korea | N/A | |
| 115 | 115 | 4 weeks | 32.48 | No | 22.43 | 2007 ‐ 2008 | China | N/A | |
| 127 | 127 | 12 weeks | N/A | N/A | 21.65 | 2004 ‐ 2005 | South Korea | Industry | |
| 64 | 61 | 52 weeks | 43.20 | N/A | 24.30 | N/A | USA | N/A | |
| 63 | 55 | 8 weeks 12 weeks | N/A | N/A | 18.31 | 2001 ‐ 2002 | South Korea | N/A | |
| 46 | 46 | 2 months | 40.10 | N/A | 22.85 | N/A | South Korea | University | |
| 107 | 100 | 12 weeks | 46.10 | N/A | 23.56 | 2008 ‐ 2009 | South Korea | N/A | |
| 96 | 87 | 8 weeks | N/A | N/A | 21.10 | N/A | South Korea | N/A | |
| 88 | 88 | 6 weeks | 44.75 | N/A | 20.80 | N/A | South Korea | University | |
| 90 | 90 | 4 weeks | 40.30 | N/A | 25.80 | 2004 | Bosnia and Herzegovina | N/A | |
| 80 | 80 | 8 weeks | 36.19 | N/A | N/A | 1997 ‐ 1998 | Italy | N/A | |
| 14 | 13 | 13 weeks | N/A | N/A | PSS 23.4/28 | N/A | UK | NGO | |
| 50 | 50 | 6 weeks | 43.45 | N/A | 21.87 | 2003 ‐ 2004 | South Korea | N/A | |
| 41 | 35 | 52 weeks | 46.50 | Yes | N/A | N/A | Finland | None | |
| 76 | 75 | 4 weeks | 32.70 | N/A | 48.32 | 2002 | China | N/A | |
| 108 | 108 | 8 weeks | 29.95 | N/A | 26.05 | 2004 ‐ 2006 | China | Government | |
| 257 | 220 | 6 weeks | 30.60 | N/A | 24.80 | 2010 ‐ 2011 | China | Government | |
| 138 | 138 | 8 weeks | 37.00 | N/A | 27.85 | N/A | China | N/A | |
| 60 | 57 | 4 weeks | 39.13 | N/A | 21.85 | 2000 ‐ 2001 | China | Government + Industry | |
| N/A | 63 | 6 weeks | N/A | N/A | N/A | 2016 | Italy | None | |
| 54 | 54 | 4 weeks | 33.85 | N/A | 25.82 | 2016 | Italy | None | |
| 40 | 36 | 24 weeks 52 weeks | 49.50 | N/A | 24.50 | N/A | Finland | Government | |
| 54 | 54 | 8 weeks | 45.25 | N/A | 23.50 | 2004 ‐ 2005 | South Korea | N/A | |
| 102 | 102 | 8 weeks 16 weeks | 38.43 | No | 27.61 | 2006 ‐ 2007 | Italy | N/A | |
| 55 | 48 | 4 weeks 12 weeks | 32.00 | No | 20.25 | 2015 ‐ 2016 | Italy | None | |
| 80 | 79 | 6 weeks | 56.10 | N/A | 22.85 | N/A | Canada | Government + Industry | |
| 161 | 157 | 6 weeks | 45.97 | N/A | 21.97 | N/A | USA and Canada | Industry | |
| 76 | 64 | 24 weeks | 44.30 | N/A | 21.30 | N/A | USA | Government + Industry | |
| 58 | 58 | 6 weeks | 40.85 | N/A | 26.30 | 2000 ‐ 2001 | USA | Industry | |
| 100 | 73 | 16 weeks | 39.15 | N/A | 26.45 | N/A | USA and Canada | Industry | |
| 272 | 233 | 12 weeks | 40.10 | N/A | 24.45 | 2005 ‐ 2008 | USA, Canada and Malaysia | Government + Industry | |
| 151 | 115 | 12 weeks | 48.30 | N/A | 26.90 | 2008 ‐ 2009 | Canada | Industry | |
| 62 | 51 | 16 weeks | 46.85 | N/A | N/A | 2009 ‐ 2010 | USA, Canada, France, Sweden and Switzerland | Industry | |
| 76 | Not ANLZ | 4 weeks | N/A | N/A | N/A | 1983 | Japan | N/A | |
| 50 | 50 | 12 weeks | 35.85 | Yes | 22.75 | 2002 ‐ 2003 | South Korea | N/A | |
| 78 | 78 | 4 weeks | N/A | N/A | N/A | N/A | South Korea | None | |
| 86 | 86 | 6 weeks | 48.75 | N/A | N/A | N/A | South Korea | N/A | |
| 160 | Not ANLZ | 4 weeks | 36.00 | N/A | N/A | 1999 ‐ 2002 | China | Government | |
| 54 | 34 | 32 weeks | N/A | N/A | N/A | N/A | Sweden | N/A | |
| 324 | 313 | 6 weeks | 46.60 | Yes | 26.05 | 2006 ‐ 2007 | USA | Government + Industry | |
| 142 | 142 | 72 weeks | N/A | N/A | N/A | N/A | Austria | None | |
| 57 | N/A | 8 weeks | 40.05 | N/A | 20.70 | N/A | South Korea | University | |
| 60 | Not ANLZ | 4 weeks | N/A | N/A | N/A | 1994 | China | N/A | |
| 30 | 28 | 4 weeks | 44.85 | N/A | 20.60 | N/A | USA | N/A | |
| 68 | 61‐65 | 6 weeks | N/A | N/A | N/A | N/A | India | None | |
| 64 | 51 | 8 weeks 52 weeks | N/A | N/A | 25.70 | N/A | Russia | None | |
| 115 | 115 | 4 weeks | 31.60 | No | 23.99 | 2007 ‐ 2008 | China | N/A | |
| 90 | 88 | 6 weeks | 36.01 | N/A | 24.80 | 2006 | China | N/A | |
| 45 | 39 | 24 weeks | 34.10 | N/A | N/A | 2003 ‐ 2004 | Turkey | N/A | |
| 90 | 79 | 24 weeks 52 weeks | 29.10 | No | 22.63 | 2004 ‐ 2005 | Turkey | N/A | |
| 42 | 29 | 8 weeks | 41.00 | N/A | N/A | N/A | UK | Industry | |
| 139 | 118 | 12 weeks | 39.50 | N/A | 19.80 | 1999 ‐ 2004 | Germany | Industry | |
| 185 | 154 | 24 weeks 52 weeks | 47.70 | N/A | 22.40 | 2008 ‐ 2010 | Austria, Germany, Poland and Portugal | Industry | |
| 38 | 36 | 12 weeks | 28.00 | N/A | N/A | 2002 ‐ 2003 | China | N/A | |
| 115 | 115 | 6 weeks | 37.63 | No | 23.03 | 2011 ‐ 2014 | China | None | |
| 30 | 24 | 12 weeks | 37.60 | N/A | N/A | 1984 ‐ 1985 | Sweden | N/A | |
| 123 | 115 | 12 weeks | 34.80 | No | 23.96 | 2006 ‐ 2007 | China | N/A | |
| 88 | 88 | 4 weeks | 34.21 | N/A | 28.43 | 2011 ‐ 2012 | China | N/A | |
| 60 | Not ANLZ | 12 weeks | 28.25 | N/A | N/A | 1998 ‐ 1999 | China | N/A | |
| 160 | 158 | 4 weeks | 29.25 | N/A | 22.61 | 2007 | China | N/A | |
| 156 | 153 | 12 weeks | 30.73 | N/A | 25.44 | 2009 | China | N/A | |
| 160 | 159 | 8 weeks | 31.54 | N/A | N/A | 2005 ‐ 2006 | China | N/A | |
| 105 | 105 | 12 weeks | N/A | N/A | 20.05 | 2002 ‐ 2004 | China | Industry | |
| 69 | N/A | 6 weeks | 41.55 | N/A | 24.35 | 2005 ‐ 2006 | South Korea | N/A | |
| 64 | 61 | 6 weeks | 35.60 | N/A | 28.35 | 2003 | China | N/A | |
| 248 | 218 | 4 weeks | 30.97 | N/A | 21.41 | 2005 ‐ 2007 | China | Government | |
| 150 | 126 | 24 weeks | 32.96 | No | 21.94 | 2011 ‐ 2012 | China | None | |
| 64 | 64 | 8 weeks | N/A | No | N/A | 2006 ‐ 2008 | China | N/A | |
| 251 | 114 | 12 weeks | 32.55 | N/A | 25.22 | N/A | China | Government | |
| 48 | 48 | 12 weeks | 39.50 | Yes | N/A | 2005 ‐ 2007 | China | N/A | |
| 56 | 56 | 12 weeks | 33.40 | N/A | 25.68 | 2002 ‐ 2004 | Iran | N/A |
N/A: not applicable; NGO: non‐governmental organization; NIH‐CPSI: National Institutes of Health Chronic Prostatitis Symptom Index; PSS: Prostatitis Severity Score; PSSI: Prostatitis Symptoms Severity Index; USA: United States of America. Duration and follow‐up are differentiated when data were available.
We extracted outcome data relevant to this Cochrane Review as needed for calculation of summary statistics and measures of variance. For dichotomous outcomes, we attempted to obtain numbers of events and totals of population for a 2 × 2 table, as well as summary statistics with corresponding measures of variance. For continuous outcomes, we attempted to obtain means and standard deviations, or data necessary to calculate this information. We resolved any disagreements by discussion, or, if required, by consultation with a third review author (SI or JHJ).
We attempted to contact authors of included studies to obtain key missing data as needed.
We provide information, including trial identifier, about potentially relevant ongoing studies in a Characteristics of ongoing studies table.
Dealing with duplicate and companion publications
In the event of duplicate publications, companion documents or multiple reports of a primary study, we maximised yield of information by mapping all publications to unique studies and collating all available data. We used the most complete data set aggregated across all known publications. In case of doubt, we gave priority to the publication reporting the longest follow‐up associated with our primary or secondary outcomes.
Assessment of risk of bias in included studies
Six review authors (JHJ, JVAF, SI, TT, VV, YX), working in pairs, independently assessed the risks of bias of each included study. We resolved disagreements by consensus, or by consultation with a third review author (JVAF or VV).
We assessed risks of bias using Cochrane's 'Risk of bias' assessment tool (Higgins 2017). We assessed the following domains:
-
Random sequence generation (selection bias);
-
Allocation concealment (selection bias);
-
Blinding of participants and personnel (performance bias);
-
Blinding of outcome assessment (detection bias);
-
Incomplete outcome data (attrition bias);
-
Selective reporting (reporting bias);
-
Other potential sources of bias.
We judged 'Risk of bias' domains as being at low risk, high risk or unclear risk and evaluated individual bias items as described in the Cochrane Handbook for Systematic Reviews of Interventions (Higgins 2017). We present 'Risk of bias' summary figures to illustrate these findings.
For performance bias (blinding of participants and personnel) and detection bias (blinding of outcome assessment), we evaluated the risks of bias separately for each outcome, and we grouped outcomes according to whether they were measured subjectively or objectively when reporting our findings in the 'Risk of bias' tables.
We also assessed attrition bias (incomplete outcome data) on an outcome‐specific basis, and grouped outcomes with similar judgements when reporting our findings in the 'Risk of bias' tables.
We further summarised the risks of bias across domains for each outcome in each included study, as well as across studies and domains for each outcome.
All endpoints are subjective outcomes.
Measures of treatment effect
We expressed dichotomous data as risk ratios (RRs) with 95% confidence intervals (CIs). We expressed continuous data as mean differences (MDs) with 95% CIs unless different studies used different measures to assess the same outcome, in which case we expressed data as standardised mean differences (SMDs) with 95% CIs.
Unit of analysis issues
The unit of analysis was the individual participant. If we identified cross‐over trials, cluster‐randomised trials or trials with more than two intervention groups for inclusion in the review, we handled these in accordance with guidance provided in the Cochrane Handbook for Systematic Reviews of Interventions (Higgins 2011b).
Dealing with missing data
We obtained missing data from study authors, if feasible, and performed intention‐to‐treat analyses if data were available; otherwise, we performed available‐case analyses. We investigated attrition rates, such as dropouts, losses to follow‐up and withdrawals, and we critically appraised issues of missing data. We did not impute missing data. In studies where results were available only graphically we estimated the measurements of the primary outcomes using software in order to describe them in a narrative fashion (Jelicic 2016; PlotDigitalizer).
Assessment of heterogeneity
In the event of excessive heterogeneity unexplained by subgroup analyses, we did not report outcome results as the pooled effect estimate in a meta‐analysis, but have provided a narrative description of the results of each study.
We identified heterogeneity (inconsistency) through visual inspection of the forest plots to assess the amount of overlap of CIs, and the I2 statistic, which quantifies inconsistency across studies, to assess the impact of heterogeneity on the meta‐analysis (Higgins 2002; Higgins 2003). We interpreted the I2 statistic as follows.
-
0% to 40%: may not be important.
-
30% to 60%: may indicate moderate heterogeneity.
-
50% to 90%: may indicate substantial heterogeneity.
-
75% to 100%: considerable heterogeneity.
When we found heterogeneity, we attempted to determine possible reasons for it by examining individual study and subgroup characteristics.
Assessment of reporting biases
We attempted to obtain study protocols to assess for selective outcome reporting.
When we included 10 studies or more investigating a particular outcome, we used funnel plots to assess small‐study effects. Several explanations can be offered for the asymmetry of a funnel plot, including true heterogeneity of effect with respect to trial size, poor methodological design (and hence bias of small trials) and publication bias. We therefore interpreted the results cautiously.
Data synthesis
Unless there was good evidence for homogeneous effects across studies, we summarised data using a random‐effects model. We interpreted random‐effects meta‐analyses with due consideration of the whole distribution of effects. We also performed statistical analyses according to the statistical guidelines contained in the Cochrane Handbook for Systematic Reviews of Interventions (Higgins 2011a). For dichotomous outcomes, we used the Mantel‐Haenszel method; for continuous outcomes, we used the inverse variance method. We used Review Manager 5 (RevMan 2014) software to perform analyses.
Subgroup analysis and investigation of heterogeneity
We expected the following characteristics to introduce clinical heterogeneity, and planned to carry out subgroup analyses with investigation of interactions.
-
Participants' characteristics: symptom severity at recruitment, age, presence of clinical comorbidities (irritable bowel syndrome, fibromyalgia, interstitial cystitis).
-
Duration of the intervention: measured in weeks (e.g. less than 12 weeks or more than 12 weeks).
-
Presence of combined therapy due to the presence of co‐interventions: e.g. alpha blockers versus placebo, compared to alpha blockers + co‐interventions (antibiotics or analgesics or both) versus co‐interventions alone or in combination with placebo.
We planned to use the test for subgroup differences in Review Manager 5 to compare subgroup analyses if there had been sufficient studies (RevMan 2014).
Sensitivity analysis
We planned to perform sensitivity analyses to explore the influence of the following factors (when applicable) on effect sizes.
-
Restricting the analysis by taking into account risk of bias, by excluding studies at high risk or unclear risk in at least one domain.
-
Explore the impact of re‐expressing symptom severity as a dichotomous outcome.
-
Excluding studies that included participants with a diagnosis of chronic non‐bacterial prostatitis or prostatodynia, not meeting the criteria of the 1999 Research Consensus (Nickel 1999).
'Summary of findings' tables
We presented the overall quality of the evidence for each outcome according to the GRADE approach, which takes into account five criteria related to internal validity (risk of bias, inconsistency, imprecision, publication bias), and external validity, such as directness of results (Guyatt 2008). For each comparison, two review authors (JHJ, JVAF) independently rated the quality of evidence for each outcome as 'high,' 'moderate,' 'low' or 'very low', using GRADEpro GDT. We resolved any discrepancies by consensus, or if needed by arbitration by a third review author (VV). We present a summary of the evidence for the main outcomes in the 'Summary of findings' tables, which provide key information about: the best estimate of the magnitude of the effect in relative terms and absolute differences for each relevant comparison of alternative management strategies; numbers of participants and studies addressing each important outcome; and the rating of the overall confidence in effect estimates for each outcome (Guyatt 2011b; Schünemann 2017). If meta‐analysis was not possible, we present results in a narrative 'Summary of findings' table. We initially planned to present 'Summary of findings' tables for all comparisons, but given their multiplicity, we have presented only those most related to clinical practice in order to highlight the evidence most relevant to clinicians, patients and other stakeholders (see Differences between protocol and review). Nevertheless, we assessed all comparisons using the GRADE approach and they are available under the section Effects of interventions.
We used the controlled vocabulary suggested by Glenton 2010 to summarise the findings of the 'Summary of findings' tables in the 'Plain language summary.'
Results
Description of studies
Results of the search
For detailed information about the results of the search see Figure 1. This review shares the search strategy for the review of non‐pharmacological Interventions for treating chronic prostatitis/chronic pelvic pain syndrome (Franco 2018). In this section we describe the study flow for the studies relevant to the review question. For this review we screened 1725 records. We included four studies from other systematic reviews on this topic (McNaughton 2000; Yang 2008). We discounted 1536 records and obtained the full text for 189 records. We excluded 54 studies (57 records) after full‐text assessment; their characteristics are given in Characteristics of excluded studies tables. We found five studies that could have been completed according to the clinical trial registries but there was no publication available and a two‐stage study with an incomplete report of the conduct of the clinical trial stage (Characteristics of studies awaiting classification). We identified four ongoing studies (see Characteristics of ongoing studies). We included 99 studies (122 records) in this review.
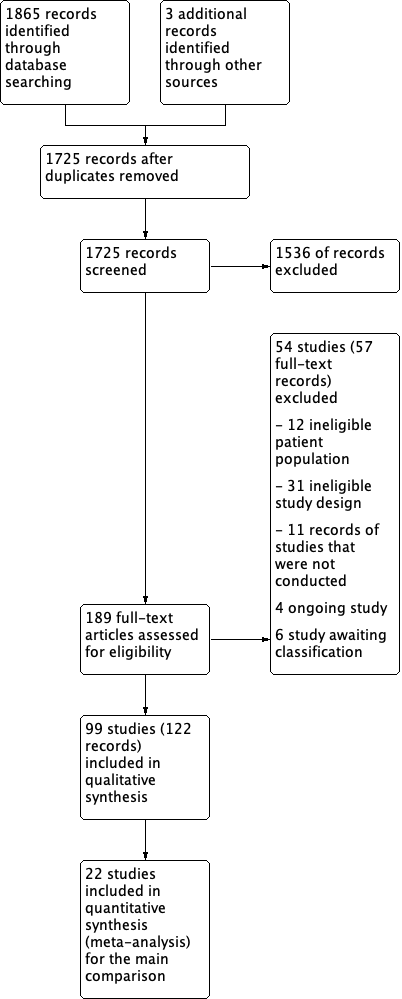
Study flow diagram.
Included studies
We included 99 studies with 9119 participants (see Characteristics of included studies; Table 1; Table 2).
Design
All the included studies were RCTs.
Sample sizes
Median sample size was 76 (interquartile range 55.5 to 107.5). The smallest sample size was 14 and the largest sample size was 324. Sample size was not specified in one study (Macchione 2017).
Setting
Since CP/CPPS is usually treated in an outpatient setting, most studies offered ambulatory care.
Twenty‐eight studies were conducted in China (Chen 2009; Chen 2011; Hu 2015; Jiang 2009; Li 2003; Li 2007; Li 2012; Lin 2007; Lu 2004; Peng 2003; Shi 1994; Sun 2008; Tan 2009; Wang 2004; Wang 2016; Wu 2008; Xia 2014; Xu 2000; Yang 2009; Yang 2010; Ye 2006; Ye 2008; Zeng 2004; Zhang 2007; Zhang 2017; Zhao 2009; Zhao 2019; Zhou 2008), 16 studies were conducted in South Korea (Cha 2009; Choe 2014; Jeong 2008; Jung 2006; Kim 2003; Kim 2008; Kim 2011a; Kim 2011b; Kong 2014; Lee 2006a; Mo 2006; Park 2005; Park 2012; Park 2017; Ryu 2007; Youn 2008), 11 studies were conducted in Italy (Cai 2014; Cai 2017; Cavallini 2001; De Rose 2004; Giammusso 2017; Giannantoni 2014; Lacquaniti 1999; Macchione 2017; Maurizi 2019Morgia 2010; Morgia 2017), seven studies were conducted in the USA (Elist 2006; Gottsch 2011; Kaplan 2004; Nickel 2004a; Nickel 2004b; Pontari 2010; Shoskes 1999) and seven studies were conducted in more than one country (Alexander 2004; Cheah 2003; Nickel 2003b; Nickel 2005; Nickel 2008; Nickel 2016; Wagenlehner 2014). The remaining studies were conducted in Austria (Reissigl 2004), Bosnia‐Herzegovina (Kulovac 2007), Canada (Nickel 2003a; Nickel 2011a), Egypt (Elshawaf 2009), Finland (Leskinen 1999; Mehik 2003), Germany (Dunzendorfer 1983; Wagenlehner 2009), India (Singh 2017), Iran (Falahatkar 2015; Ziaee 2006), Japan (Iwamura 2015; Okada 1985), Russia (Apolikhin 2010; Breusov 2014; Churakov 2012; Sivkov 2005), Sweden (Persson 1996; Wedren 1987), Taiwan (Cheng 2010), Turkey (Erdemir 2010; Gül 2001; Tugcu 2006; Tuğcu 2007), Saudi Arabia (Abdalla 2018) and the UK (Bates 2007; Goldmeier 2005; Lee 2005; Turkington 2002).
There was a wide variety of languages in the included studies. Twenty‐one studies were written in Chinese (Chen 2009; Hu 2015; Jiang 2009; Li 2003; Li 2007; Li 2012; Lin 2007; Lu 2004; Peng 2003; Shi 1994; Sun 2008; Tan 2009; Wang 2004; Wu 2008; Xia 2014; Xu 2000; Yang 2009; Yang 2010; Ye 2006; Zeng 2004; Zhang 2007), four studies were in Russian (Breusov 2014; Churakov 2012; Apolikhin 2010; Sivkov 2005); eight studies in Korean (Cha 2009; Youn 2008; Kim 2008; Ryu 2007; Mo 2006; Jung 2006; Kim 2003; Park 2005); two in Italian (Cavallini 2001; Lacquaniti 1999), two in Turkish (Erdemir 2010; Tugcu 2006) one in Japanese (Okada 1985) and one in German (Dunzendorfer 1983). This posed some limitations on our review (see Potential biases in the review process). The remaining RCTs were written in English.
Participants
The median age of participants was 38 years (interquartile range 33 to 41). Seventeen studies did not provide information on age (Breusov 2014; Cheng 2010; Churakov 2012; Jung 2006; Kim 2003; Kim 2011b; Lee 2005; Macchione 2017; Okada 1985; Park 2012; Persson 1996; Reissigl 2004; Shi 1994; Singh 2017; Sivkov 2005; Ye 2008; Zhao 2009). Most studies did not include participants over 50 years old, to avoid symptom overlap with benign prostate hyperplasia. Three studies (Gottsch 2011; Iwamura 2015; Nickel 2003a) included older participants (mean age 50 or older). Median symptoms severity, measured by NIH‐CPSI scores, was 24, with a narrow interquartile range of 22 to 26. Only two studies included participants with a NIH‐CPSI score greater than 30 (Li 2003; Falahatkar 2015).
All studies referred to diagnostic criteria aimed at the differentiation of CP/CPPS from other forms of prostatitis and other urological diseases. Participants underwent digital rectal examination, urine cultures and two‐ or four‐glass Meares‐Stamey test. They excluded participants who had recently undergone prostatic biopsy or surgery, participants with prostate cancer, participants with a recent history of sexually‐transmitted diseases and participants with concomitant neurological disorders or severe systemic disorders.
Thirteen studies included participants who had not received other previous treatment (Chen 2009; Chen 2011; Iwamura 2015; Jeong 2008; Jiang 2009; Morgia 2010; Morgia 2017; Sun 2008; Tuğcu 2007; Wang 2016; Wu 2008; Zhang 2017; Zhao 2009). Ten studies specified that participants had previously received medical treatment with antibiotics or alpha blockers (or both) and had not had a positive response (Cheng 2010; Dunzendorfer 1983; Elist 2006; Elshawaf 2009; Falahatkar 2015; Gottsch 2011; Leskinen 1999; Park 2005; Pontari 2010; Zhou 2008). The other studies did not specify whether the participants had received previous treatments for this condition. Nevertheless, a common inclusion criterion was a wash‐out period, as stated in a protocol for medical therapy often cited as a consensus for inclusion/exclusion criteria (Alexander 2004).
Interventions
We included studies assessing a wide variety of pharmacological interventions.
-
Alpha blockers (Alexander 2004; Cha 2009; Cheah 2003; Chen 2011; Dunzendorfer 1983; Erdemir 2010; Gül 2001; Jeong 2008; Jung 2006; Kim 2003; Kulovac 2007; Lacquaniti 1999; Lu 2004; Mehik 2003; Mo 2006; Nickel 2004b; Nickel 2008; Nickel 2011a; Ryu 2007; Sivkov 2005; Wang 2016; Wu 2008; Yang 2010; Youn 2008).
-
5‐alpha reductase inhibitors (Leskinen 1999; Nickel 2004a).
-
Antibiotic therapy (Cheng 2010; Choe 2014; Kim 2011a; Nickel 2003a; Ye 2008; Zhou 2008).
-
Anti‐inflammatories: Bates 2007; Goldmeier 2005; Jiang 2009; Kim 2003; Kim 2011a; Tuğcu 2007; Wu 2008; Yang 2009; Zhao 2009.
-
Phytotherapy: (Apolikhin 2010; Breusov 2014; Cai 2014; Cai 2017; Cha 2009; Elist 2006Giammusso 2017; Iwamura 2015; Kaplan 2004; Lee 2006a; Macchione 2017; Maurizi 2019; Morgia 2010; Morgia 2017; Okada 1985; Park 2005; Reissigl 2004; Shoskes 1999; Wagenlehner 2009; Xu 2000; Ye 2006).
-
Botulinum toxin A (Elshawaf 2009; Falahatkar 2015; Gottsch 2011).
-
Allopurinol (Persson 1996; Ziaee 2006).
-
Traditional Chinese medicine (Chen 2009; Hu 2015; Li 2003; Li 2007; Li 2012; Peng 2003; Shi 1994; Sun 2008; Tan 2009; Wang 2004; Xia 2014; Zhang 2007).
-
Other pharmacological agents
-
-
Antidepressant (Giannantoni 2014; Lee 2005; Turkington 2002; Zhang 2017)
-
Mepartricin (Cavallini 2001; De Rose 2004)
-
OM‐89 (Wagenlehner 2014)
-
Pentosan (Nickel 2005; Wedren 1987)
-
Phosphodiesterase inhibitors (Abdalla 2018; Kong 2014; Lin 2007; Park 2012; Park 2017; Singh 2017)
-
Pregabalin (Pontari 2010)
-
Tanezumab (Nickel 2016)
Outcomes
Almost all studies reported the effects of the interventions on prostatitis symptoms. All but three studies used the NIH‐CPSI score: two studies (Lee 2005; Leskinen 1999) used a 100‐point validated scale (Prostatitis Symptom Severity Index (PSSI)) and Lacquaniti 1999 used another validated scale (0 to 12, from Neal 1994).
Other secondary outcomes relevant to this review were reported inconsistently. Ten studies did not report prostatitis symptoms: three studies reported global improvement as a composite outcome of symptoms and laboratory findings (Cavallini 2001; Peng 2003; Shi 1994) and seven studies reported clinical improvement using locally‐developed scales (Churakov 2012; Dunzendorfer 1983; Elist 2006; Persson 1996; Wedren 1987; Xu 2000; Okada 1985). Some of these studies provided information about adverse events.
We found mostly short‐term outcomes for the included comparisons. Median follow‐up was eight weeks (interquartile range 6 to 12 weeks; range 4 to 72 weeks).
Funding sources
Most studies (54 studies, 55%) did not specify their funding sources. Seven studies were financed by their local government (Bates 2007; Mehik 2003; Li 2007; Li 2012; Peng 2003; Zhang 2007; Zhao 2019), one study by a non‐governmental organisation (Lee 2005), three studies by universities (Kim 2008; Kong 2014; Ryu 2007), six studies received mixed financing from government and pharmaceutical companies (Alexander 2004; Lu 2004; Nickel 2003a; Nickel 2004a; Nickel 2008; Pontari 2010) and 15 studies were funded by pharmaceutical companies (Cheah 2003; Dunzendorfer 1983; Elist 2006; Goldmeier 2005; Jung 2006; Maurizi 2019; Nickel 2003b; Nickel 2004b; Nickel 2005; Nickel 2011a; Nickel 2016; Turkington 2002; Wagenlehner 2009; Wagenlehner 2014; Ye 2008). Thirteen studies specified that they had no funding (Abdalla 2018; Apolikhin 2010; Breusov 2014; Churakov 2012; Leskinen 1999; Morgia 2017; Macchione 2017; Sivkov 2005; Park 2012; Reissigl 2004; Singh 2017; Wang 2016; Zhang 2017).
Excluded studies
We excluded 54 studies for the following reasons (see Characteristics of excluded studies).
Twelve studies evaluated an ineligible participant population: eight studies included participants with bacterial prostatitis, but with no disaggregated data for CP/CPPS (Barbalias 1998; Chen 2016; Feng 2011; Galeone 2012; Glybochko 2014; Golubchikov 2005; Lokshin 2010; Pushkar' 2006; Simmons 1985) and three studies did not use the NIH criteria for CP/CPPS (Minjie 2017; Nickel 2011b; Zhang 2011)
We found 31 studies to have an ineligible study design: 27 studies specified that they did not use randomisation or used a non‐random sequence for the allocation of participants (Abdel‐Meguid 2018; Aliaev 2006; Allen 2017; Colleen 1975; DRKS00009352; Evliyaoğlu 2002; Hong 2008; Ikeuchi 1990; ISRCTN43221600; Kalinina 2015; Kamalov 2006; Kogan 2010; Lee 2006b; Leng 2007; Lopatkin 2009; Loran 2003; Ma 2015; Nishino 2017; Osborn 1981; Pavone 2010; Razumov 2005; Stamatiou 2014; Takahashi 2005; Thin 1983; Tkachuk 2006; Tkachuk 2011; Xu 2004); two studies reported the follow‐up of a single arm of a randomised controlled trial (Kotarinos 2009; Marx 2013); one study was a non‐controlled study of different routes of administration of an intervention (El‐enen 2015), and one study was a phase II dose‐finding study with an adaptive design (Wagenlehner 2017).
Additionally, 11 studies were terminated and no outcome data were available, due to problems in their conduct (Bschleipfer 2007; NCT02042651; NCT00194597; NCT00194623; NCT03500159; NCT00194636; NCT00301405; NCT00464373; NCT00529386; NCT01678911; NCT01830829).
Risk of bias in included studies
See Figure 2 for a summary of 'Risk of bias' assessments. See Figure 3 for the individual assessments of the included studies. Detailed descriptions of the supporting judgements can be found in the Characteristics of included studies. Considering a global assessment of risk of bias for the main outcomes of this review, only three studies had low risk of bias (Alexander 2004; Nickel 2004b; Pontari 2010), 23 studies had unclear risk of bias (Breusov 2014; Cha 2009; Chen 2011; Cheng 2010; Elist 2006; Elshawaf 2009; Abdalla 2018; Falahatkar 2015; Jung 2006; Kim 2008; Lacquaniti 1999; Li 2003; Mo 2006; Nickel 2003a; Nickel 2011a; Park 2012; Reissigl 2004; Ryu 2007; Yang 2009; Yang 2010; Ye 2006; Youn 2008; Ziaee 2006) and the remaining 70 studies had at least one domain with high risk of bias.

Risk of bias graph: review authors' judgements about each risk of bias item presented as percentages across all included studies.

Risk of bias summary: review authors' judgements about each risk of bias item for each included study.
Allocation
Random sequence generation
Thirty‐one studies specified an adequate method of random sequence allocation (Alexander 2004; Breusov 2014; Cai 2014; Cai 2017; Cheah 2003; Chen 2011; Choe 2014; De Rose 2004; Dunzendorfer 1983; Elist 2006; Goldmeier 2005; Gottsch 2011; Hu 2015; Lacquaniti 1999; Lu 2004; Mehik 2003; Morgia 2010; Nickel 2003a; Nickel 2003b; Nickel 2004b; Nickel 2008; Nickel 2016; Persson 1996; Pontari 2010; Singh 2017; Tan 2009; Turkington 2002; Wagenlehner 2009; Wagenlehner 2014; Wang 2016; Zhao 2009). The remaining studies were at unclear risk of bias for random sequence generation.
Allocation concealment
Twenty‐two studies specified an adequate method of allocation concealment (Alexander 2004; Bates 2007; De Rose 2004; Elist 2006; Falahatkar 2015; Goldmeier 2005; Gottsch 2011; Iwamura 2015; Mehik 2003; Morgia 2010; Nickel 2003a; Nickel 2003b; Nickel 2004b; Nickel 2008; Nickel 2011a; Nickel 2016; Okada 1985; Persson 1996; Pontari 2010; Singh 2017; Wagenlehner 2009; Wagenlehner 2014). One study specified that they did not conceal the allocation of participants and was deemed at high risk of bias for this domain (Choe 2014). The remaining studies were at unclear risk of bias in allocation concealment.
Blinding
Blinding of participants and personnel
Nineteen studies specified an adequate method for the blinding of participants and personnel (Alexander 2004; Bates 2007; Chen 2011; Elist 2006; Falahatkar 2015; Goldmeier 2005; Iwamura 2015; Lacquaniti 1999; Mehik 2003; Nickel 2003b; Nickel 2004b; Nickel 2008; Nickel 2011a; Nickel 2016; Okada 1985; Pontari 2010; Sivkov 2005; Wagenlehner 2009; Wagenlehner 2014). Forty‐four studies did not adequately blind participants or personnel and were deemed at high risk of bias, considering that all outcomes were subjective (Apolikhin 2010; Cai 2014; Cai 2017; Chen 2009; Choe 2014; Erdemir 2010; Giammusso 2017; Giannantoni 2014; Gottsch 2011; Hu 2015; Jeong 2008; Jiang 2009; Kaplan 2004; Kim 2011a; Kim 2011b; Kong 2014; Kulovac 2007; Lee 2006a; Li 2007; Li 2012; Lin 2007; Lu 2004; Macchione 2017; Maurizi 2019; Morgia 2017; Park 2005; Park 2017; Peng 2003; Shi 1994; Singh 2017; Sun 2008; Tan 2009; Tugcu 2006; Tuğcu 2007; Wang 2004; Wang 2016; Wu 2008; Xia 2014; Xu 2000; Ye 2008; Zeng 2004; Zhang 2007; Zhang 2017; Zhao 2019; Zhou 2008). The remaining studies were at unclear risk of bias of blinding of participants and personnel.
Blinding of outcome assessment
All the outcomes for this review were participant‐reported outcomes. Thirty‐five studies reported blinding of participants (outcome assessors) (Alexander 2004; Bates 2007; Breusov 2014; Cheah 2003; Chen 2011; De Rose 2004; Elist 2006; Falahatkar 2015; Goldmeier 2005; Iwamura 2015; Lacquaniti 1999; Lee 2005; Mehik 2003; Morgia 2017; Nickel 2003a; Nickel 2003b; Nickel 2004a; Nickel 2004b; Nickel 2005; Nickel 2008; Nickel 2011a; Nickel 2016; Okada 1985; Persson 1996; Pontari 2010; Shoskes 1999; Sivkov 2005; Turkington 2002; Wagenlehner 2009; Wagenlehner 2014; Wedren 1987; Yang 2009; Ye 2006; Zhao 2009; Ziaee 2006). Thirty‐nine studies did not adequately blind participants (Apolikhin 2010; Cai 2014; Cai 2017; Chen 2009; Choe 2014; Erdemir 2010; Giannantoni 2014; Gottsch 2011; Hu 2015; Jeong 2008; Jiang 2009; Kim 2011a; Kim 2011b; Kulovac 2007; Lee 2006a; Li 2007; Li 2012; Lin 2007; Lu 2004; Macchione 2017; Park 2005; Peng 2003; Shi 1994; Singh 2017; Sun 2008; Tan 2009; Tugcu 2006; Tuğcu 2007; Wang 2004; Wang 2016; Wu 2008; Xia 2014; Xu 2000; Ye 2008; Zeng 2004; Zhang 2007; Zhang 2017; Zhao 2019; Zhou 2008). The remaining studies were at unclear risk of bias of outcome assessment.
Incomplete outcome data
Forty‐three studies specified that outcome data for all outcomes were available in all or nearly all participants (Alexander 2004; Apolikhin 2010; Breusov 2014; Cai 2014; Chen 2009; Chen 2011; Elist 2006; Erdemir 2010; Falahatkar 2015; Gottsch 2011; Hu 2015; Jeong 2008; Jiang 2009; Jung 2006; Kaplan 2004; Kim 2008; Kong 2014; Li 2003; Li 2007; Lin 2007; Maurizi 2019; Morgia 2010; Nickel 2003a; Nickel 2004b; Park 2005; Peng 2003; Pontari 2010; Shi 1994; Singh 2017; Sun 2008; Tan 2009; Wang 2004; Wang 2016; Wu 2008; Xia 2014; Yang 2009; Yang 2010; Ye 2006; Ye 2008; Zeng 2004; Zhao 2009; Zhou 2008; Ziaee 2006). Thirty‐six had unbalanced or high attrition (or both) of outcome data at follow‐up and were deemed at high risk of bias (Bates 2007; Cai 2017; Cavallini 2001; Cheah 2003; De Rose 2004; Dunzendorfer 1983; Goldmeier 2005; Gül 2001; Iwamura 2015; Kim 2003; Kim 2011a; Kim 2011b; Lee 2005; Leskinen 1999; Li 2012; Lu 2004; Mehik 2003; Morgia 2017; Nickel 2003b; Nickel 2004a; Nickel 2005; Nickel 2008; Nickel 2016; Okada 1985; Persson 1996; Shoskes 1999; Sivkov 2005; Tugcu 2006; Turkington 2002; Wagenlehner 2009; Wagenlehner 2014; Wedren 1987; Xu 2000; Zhang 2007; Zhang 2017; Zhao 2019). The remaining studies were at unclear risk of bias in this domain.
Selective reporting
Ten studies had low risk of reporting bias when comparing their outcomes to their protocols or trial registrations (Alexander 2004; Falahatkar 2015; Iwamura 2015; Nickel 2003a; Nickel 2004b; Nickel 2008; Nickel 2011a; Pontari 2010; Wagenlehner 2014; Wang 2016). Twenty studies reported some of their outcomes graphically or with missing data and were deemed at high risk of bias (Apolikhin 2010; Bates 2007; Choe 2014; Churakov 2012; Erdemir 2010; Giammusso 2017; Kaplan 2004; Kim 2003; Kulovac 2007; Lee 2006a; Leskinen 1999; Mehik 2003; Morgia 2010; Nickel 2003b; Nickel 2016; Persson 1996; Wagenlehner 2009; Wang 2004; Zhao 2009; Zhou 2008). The remaining studies were at unclear risk of reporting bias.
Other potential sources of bias
Four studies were at high risk of bias for this domain: in two studies (Nickel 2016; Wagenlehner 2009), the pharmaceutical company participated in the conduct and publication of the study: in one study there were large baseline difference between groups (Park 2005), and in another study an active run‐in phase was implemented (Ye 2008). Nineteen studies were at unclear risk of bias for this domain: eight studies had insufficient data to make a judgement, since they were available as abstract only (Abdalla 2018; Cheng 2010; Elshawaf 2009; Macchione 2017; Park 2012; Park 2017; Reissigl 2004; Singh 2017), nine studies reported baseline characteristics poorly or they were not available (Giammusso 2017; Kim 2003; Kim 2011a; Kim 2011b; Kulovac 2007; Sivkov 2005; Tugcu 2006; Zhao 2009; Zhou 2008), one sturdy reported small differences in baseline characteristics (Kong 2014), and two studies provided no information about how many participants were in each group (Lacquaniti 1999; Morgia 2010). The remaining studies were at low risk of other bias.
Effects of interventions
See: Summary of findings for the main comparison Alpha blockers compared to placebo for chronic prostatitis/chronic pelvic pain syndrome; Summary of findings 2 5‐alpha reductase inhibitors compared to placebo for chronic prostatitis/chronic pelvic pain syndrome; Summary of findings 3 Antibiotic therapy compared to placebo for chronic prostatitis/chronic pelvic pain syndrome; Summary of findings 4 Anti‐inflammatories compared to control for chronic prostatitis/chronic pelvic pain syndrome; Summary of findings 5 Phytotherapy compared to placebo or other agents for chronic prostatitis/chronic pelvic pain syndrome; Summary of findings 6 Botulinum toxin A compared to placebo for chronic prostatitis/chronic pelvic pain syndrome; Summary of findings 7 Allopurinol compared to placebo for chronic prostatitis/chronic pelvic pain syndrome; Summary of findings 8 Traditional Chinese Medicine compared to placebo or usual care for chronic prostatitis/chronic pelvic pain syndrome
Unless stated otherwise, mean differences in prostatitis symptoms refer to NIH‐CPSI scores and the responder rate refers to the number of participants who achieved a six‐point decrease or a 25% decrease in NIH‐CPSI scores (See Types of outcome measures). Other outcome measurements may vary. The number of participants under each comparison represent the total number of randomized participants, whereas the number of participants for each outcome are those analysed.
1. Alpha blockers versus placebo
Twenty‐four studies with 2387 randomized participants compared the use of alpha blockers versus placebo or no additional treatment (Alexander 2004; Cha 2009; Cheah 2003; Chen 2011; Dunzendorfer 1983; Erdemir 2010; Gül 2001; Jeong 2008; Jung 2006; Kim 2003; Kulovac 2007; Lu 2004; Mehik 2003; Mo 2006; Nickel 2004b; Nickel 2008; Nickel 2011a; Ryu 2007; Sivkov 2005; Tuğcu 2007; Wang 2016; Wu 2008; Yang 2010; Youn 2008). See Table 1 and Table 2 for further details of the participants and interventions. See summary of findings Table for the main comparison. Three studies were not included in this summary due to missing data and are described below (Cha 2009; Gül 2001;Lacquaniti 1999). We used data from Cha 2009 for the outcome of adverse events.
1.1.1. Prostatitis symptoms: short‐term
Based on 18 studies with 1524 participants with a six‐week to six‐month follow‐up (Alexander 2004; Cheah 2003; Chen 2011; Erdemir 2010; Jung 2006; Kim 2003; Kulovac 2007; Lu 2004; Mehik 2003; Mo 2006; Nickel 2008; Nickel 2011a; Ryu 2007; Tuğcu 2007; Wang 2016; Wu 2008; Yang 2009; Youn 2008), we are uncertain of the effects of alpha blockers on prostatitis symptoms compared to placebo or to no additional treatment (random‐effects meta‐analysis; MD −5.01, 95% CI −7.41 to −2.61; I2 = 98%; Analysis 1.1). These lower scores were observed across all subscores of pain, urinary symptoms and QoL (Analysis 1.2; Analysis 1.3; Analysis 1.4). The quality of evidence was very low, due to study limitations, inconsistency (high statistical heterogeneity) and imprecision. We could not identify asymmetry in the funnel plot suggestive of publication bias (see Figure 4).

Funnel plot of comparison: 1 Alpha‐blockers versus placebo, outcome: 1.1 Prostatitis symptoms: short term.
Based on seven studies with 721 participants reported (Alexander 2004; Chen 2011; Jeong 2008; Mehik 2003; Nickel 2004b; Nickel 2008; Nickel 2011a), we are uncertain of the effects of alpha blockers in the responders rate compared to placebo or to no additional treatment (random‐effects meta‐analysis; RR 1.23, 95% CI 0.94 to 1.61; I2 = 66%; Analysis 1.5). The quality of evidence was very low, due to unclear or high risk of bias in most domains in most studies, inconsistency (high statistical heterogeneity) and imprecision (a confidence interval that crosses the minimal clinically important difference (MCID)).
We found that four studies (Ryu 2007; Tuğcu 2007; Wu 2008; Yang 2010) had standard deviation (SD) values close to one, which is unusual in a body of research in which this value is close to six. We contacted study authors to clarify if this was an error (e.g. if they were the standard error instead of standard deviation), but we received no response.
1.1.2. Prostatitis symptoms: long‐term
Based on four studies with 235 participants with one‐year follow‐up (Erdemir 2010; Mehik 2003; Sivkov 2005; Tuğcu 2007), we are uncertain of the effects of alpha blockers on prostatitis symptoms compared to placebo or to no additional treatment, measured by NIH‐CPSI score (random‐effects meta‐analysis; MD −5.60, 95% CI −10.89 to −0.32; I2 = 98%; Analysis 1.6). The quality of the evidence was very low due to unclear or high risk of bias in most domains in most studies, inconsistency (high statistical heterogeneity) and imprecision (the confidence interval crosses the threshold for the MCID).
Based on one study with 92 participants (Chen 2011), alpha blockers may have result in a small increase in the responders rate compared to placebo or to no additional treatment (RR 1.57, 95% CI 1.06 to 2.32; Analysis 1.7). The quality of evidence was low, due to unclear risk of bias and imprecision (the confidence interval crosses the threshold for the MCID).
1.2. Adverse events
Based on 19 studies with 1588 participants (Alexander 2004; Cha 2009; Cheah 2003; Chen 2011; Dunzendorfer 1983; Erdemir 2010; Gül 2001; Jeong 2008; Kim 2003; Mo 2006; Nickel 2004b; Nickel 2008; Nickel 2011a; Ryu 2007; Sivkov 2005; Tuğcu 2007; Wang 2016; Wu 2008; Yang 2010), we found that participants who received alpha blockers may experience more adverse events (RR 1.60, 95% CI 1.09 to 2.34; I2 = 48%; Analysis 1.8) compared to those who received placebo or no additional intervention at six‐week to six‐month follow‐up. The quality of the evidence is low, due to unclear or high risk of bias in most domains in most studies, and imprecision (the confidence interval crosses the threshold for the MCID). We could not identify asymmetry in the funnel plot suggestive of publication bias (see Figure 5). Common adverse events included: dizziness, hypotension, palpitations, retrograde ejaculation, headache, and heartburn.

Funnel plot of comparison: 1 Alpha‐blockers versus placebo, outcome: 1.8 Adverse events.
1.3. Sexual dysfunction
Based on four studies with 452 participants (Chen 2011; Nickel 2008; Ryu 2007; Wang 2016), alpha blockers probably result in little to no difference in sexual dysfunction, measured by IIEF scale at six‐ to 12‐week follow‐up (MD 0.26, 95% CI −1.13 to 1.65; I2 = 0%, Analysis 1.9). The quality of the evidence was moderate, due to an unclear or high risk of bias in most domains in most studies.
1.4. Quality of life
Based on three studies with 421 participants (Alexander 2004; Nickel 2008; Nickel 2011a), alpha blockers probably result in little to no difference in quality of life, measured by SF‐12 Health Status Questionnaire at six‐ to 12‐week follow‐up (mental domain MD 0.15, 95% CI −2.63 to 2.92; I2 = 51%; Analysis 1.10; physical domain MD 1.17, 95% CI −0.97 to 3.30; I2 = 47%, Analysis 1.11). The quality of the evidence was moderate, due to unclear or high risk of bias in some of the included studies.
1.5. Anxiety and depression
Based on one study with 232 participants (Nickel 2008), alpha blockers probably result in little to no difference in anxiety and depression, measured by the Hospital Anxiety and Depression Scale at 12‐week follow‐up (MD −1.10, 95% CI −2.54 to 0.34; Analysis 1.12). The quality of evidence was low, due to high risk of attrition bias and imprecision (the confidence interval crosses the threshold for the MCID).
1.6. Urinary symptoms
Based on two studies with 143 participants (Cheah 2003; Ryu 2007), we are uncertain of the effect of alpha blockers on urinary symptoms compared to placebo or to no additional treatment, measured by IPSS at 12‐ to 14‐week follow‐up (MD −2.68, 95% CI −5.90 to 0.54; I2 = 88%; Analysis 1.13). The quality of evidence was very low, due to study limitations, inconsistency and imprecision.
Sensitivity analysis: risk of bias
Prostatitis symptoms
Excluding all studies with unclear or high risk of bias, we included only two studies with 153 participants under this comparison (Alexander 2004; Nickel 2004b). One of these studies (Alexander 2004) indicated that there was little to no difference in prostatitis symptoms between those who received tamsulosin or placebo, (MD −1.00, 95% CI −3.35 to 1.35, I2 = 0%). When analysing the number of responders, only two studies with 155 participants were included under this comparison (Alexander 2004; Nickel 2004b). Tamsulosin made little to no difference in the responder rate (RR 1.16, 95% CI 0.73 to 1.82; I2 = 0%; Analysis 1.14).
Adverse events
Excluding all studies with unclear or high risk of bias, we included only two studies with 153 participants under this comparison (Alexander 2004; Nickel 2004b). Tamsulosin made little to no difference in the incidence of adverse events (random‐effects meta‐analysis: RR 0.96, 95% CI 0.63 to 1.47, I2 = 0%; Analysis 1.15).
Sensitivity analysis: diagnostic criteria
We performed a sensitivity analysis excluding Dunzendorfer 1983, which did not meet the Research Consensus definition for CP/CPPS (Nickel 1999).
Prostatitis symptoms
The exclusion of Dunzendorfer 1983 did not produce a significant alteration in the estimate for this outcome (MD −4.96, 95% CI −7.47 to −2.46; I2 = 98%; 18 studies, 1484 participants).
Adverse events
The exclusion of Dunzendorfer 1983 did not produce a significant alteration to the estimate for this outcome (RR 1.44, 95% CI 1.05 to 1.99; I2 = 33%; 17 studies, 1548 participants).
Subgroup analysis: co‐interventions
Prostatitis symptoms
a) Studies that did not add any co‐interventions to the alpha blocker versus placebo comparison: MD −3.56, 95% CI −5.26 to −1.86; I2 = 67%; 7 studies, 688 participants.
b) Studies that added co‐interventions (analgesics or antibiotics, or both) to the alpha blocker versus placebo comparison: MD −5.69, 95% CI −8.90 to −2.48; I2 = 99%; 11 studies, 836 participants.
Test for subgroup differences: Chi2 = 1.33, df = 1 (P = 0.25), I2 = 24.7% (Analysis 1.16).
Adverse events
a) Studies that did not include any co‐interventions to the alpha blocker versus placebo comparison: RR 1.69, 95% CI 1.10 to 2.60; I2 = 59%; 11 studies, 1089 participants.
b) Studies that included co‐interventions (analgesics or antibiotics, or both) to the alpha blocker versus placebo comparison: RR 1.20, 95% CI 0.46 to 3.17; I2 = 0%; 8 studies, 499 participants.
Test for subgroup differences: Chi2 = 0.39, df = 1 (P = 0.53), I2 = 0% (Analysis 1.17).
No other predefined sensitivity analysis was possible for this comparison.
Studies not included in meta‐analysis or 'Summary of findings' table
Three studies were not included in meta‐analysis due to missing outcome data:
-
Cha 2009, with 103 participants, compared levofloxacin, levofloxacin plus alfuzosin, and a levofloxazin plus terpene mixture. Participants who received levofloxacin plus alfuzosin had fewer prostatitis symptoms measured by NIH‐CPSI scores (mean score 13) compared to those who received levofloxacin alone (mean score 15.4) at eight‐week follow‐up. Two participants in the alfuzosin group suffered from dizziness. P values and standard deviations were not available. No other outcomes relevant for this review were reported in this study.
-
Gül 2001, with 91 participants, compared terazosin and placebo. Participants who received terazosin had fewer prostatitis symptoms measured by PSSI scores (0 to 12 score, benefit is indicated by lower scores: MD −2.56, 95% CI −3.64 to −1.48). The study reported that none of the participants suffered adverse events. No other outcomes relevant for this review were reported in this study.
-
Lacquaniti 1999, with 80 participants, compared terazosin, tamsulosin and placebo. Participants who received terazosin and tamsulosin had fewer prostatitis symptoms measured by PSSI scores (0 to 12 score, benefit is indicated by lower scores: mean score in the terazosin group 1.221 and mean score in the tamsulosin group 1.324) compared to the placebo group (mean score 4.211, P < 0.05). Five participants in the terazosin group suffered from hypotension, six participants in the tamsulosin group suffered from retrograde ejaculation, and two participants in the placebo group suffered from epigastric pain and hypotension. No other outcomes relevant for this review were reported in this study.
2. 5‐alpha reductase inhibitors versus placebo
Two studies with 177 randomized participants (Leskinen 1999; Nickel 2004a) compared the use of a 5‐alpha reductase inhibitor (finasteride) versus placebo. See Table 1 and Table 2 for further details of the participants and interventions. See summary of findings Table 2. One additional study was not included in this summary due to missing data and is described below (Leskinen 1999). We found only short‐term outcomes under this comparison.
2.1 Prostatitis symptoms
Based on one study with 64 participants with six‐month follow‐up (Nickel 2004a), finasteride probably causes a small reduction in prostatitis symptoms compared to placebo (MD −4.60, 95% CI −5.43 to −3.77; Analysis 2.1). The quality of evidence was moderate, due to unclear or high risk of bias in most domains. This drug may have resulted in little to no difference in the responders rate compared to placebo or to no additional treatment, but we are very uncertain about these results (RR 2.13, 95% CI 0.82 to 5.53; I2 = 0%; Analysis 2.2). The quality of evidence was low, due to unclear or high risk of bias in most domains and imprecision (the confidence interval includes appreciable benefits and harms).
2.2. Adverse events
Based on the two included studies under this comparison, finasteride may make little to no difference in the incidence of adverse events (RR 0.87, 95% CI 0.33 to 2.30; I2 = 0%; 2 studies, 105 participants; Analysis 2.3). Common adverse events included: decrease libido, fatigue, mood change and gastrointestinal discomfort. The quality of evidence is low, due to unclear or high risk of bias in most domains in most studies, and imprecision (the confidence interval includes appreciable benefits and harms).
2.3. Sexual dysfunction
None of the included studies reported this outcome.
2.4. Quality of life
None of the included studies reported this outcome.
2.5. Anxiety and depression
None of the included studies reported this outcome.
2.6. Urinary symptoms
None of the included studies reported this outcome (see below).
Study not included in meta‐analysis or 'Summary of findings' table
One study was not included in meta‐analysis due to missing outcome data: a study with 41 participants (Leskinen 1999) compared the use of finasteride to placebo. The authors reported that those participants who received finasteride had fewer prostatitis symptoms at 12‐month follow‐up measured by NIH‐CPSI scores (mean decrease in scores estimated from a graph in the finasteride group was 16 points, and 8 points in the placebo group, P value not available). Participants in the finasteride group had a similar decrease in urinary symptoms to those in the placebo group at 12‐month follow‐up, measured by IPSS scores (mean decrease in both groups estimated from graphs was 8 points).
3. Antibiotics versus placebo
Six studies with 693 randomized participants compared the use of antibiotics versus placebo (Alexander 2004; Kim 2011a; Kulovac 2007; Nickel 2003a; Wang 2016; Ye 2008). All studies used quinolones (levofloxacin and ciprofloxacin). See Table 1 and Table 2 for further details of the participants and interventions. See summary of findings Table 3. Three studies were not included in this summary, due to missing data, and are described below (Cheng 2010; Choe 2014; Zhou 2008). We found only short‐term outcomes under this comparison.
3.1. Prostatitis symptoms
Five studies with 372 participants fully reported this outcome as total NIH‐CPSI scores at six‐week to three‐month follow‐up (Alexander 2004; Kim 2011a; Kulovac 2007; Nickel 2003a; Wang 2016), and one study (Ye 2008) with 105 participants only reported subscores. Antibiotics may result in a small reduction in prostatitis symptoms (random‐effects meta‐analysis, MD −2.43, 95% CI −4.72 to −0.15; I2 = 75%; Analysis 3.1). This effect was evident in the pain subscore (Analysis 3.2) but not in the urinary symptoms or the quality of life subscores (Analysis 3.3; Analysis 3.4). The quality of evidence was low, due to high risk of bias (unclear or high risk of bias in most domains in the main study of this comparison) and inconsistency (statistical heterogeneity).
Based on two studies with 178 participants with six‐month follow‐up (Alexander 2004; Nickel 2003a), antibiotics may have resulted in little to no difference in responder rate compared to placebo (random‐effects meta‐analysis, RR 1.12, 95% CI 0.73 to 1.74; I2 = 0%; Analysis 3.5). The quality of evidence was low, due to unclear or high risk of bias in most domains in the main study of this comparison, and imprecision (few events, resulting in a confidence interval that includes appreciable benefits and harms).
3.2. Adverse events
Based on four studies with 336 participants (Alexander 2004; Nickel 2003a; Wang 2016; Ye 2008), antibiotics probably result in little to no difference in adverse events (RR 1.01, 95% CI 0.66 to 1.55; I2 = 0%; Analysis 3.6). Common adverse events included: dyspepsia, diarrhoea, sleep disorders, joint and articular pain, and upper respiratory complaints. The quality of evidence was moderate, due to imprecision (the confidence interval crosses the threshold for the MCID).
3.3. Sexual dysfunction
Based on one study with 77 participants (Wang 2016), antibiotics probably result in little to no effect on sexual dysfunction at six‐week follow‐up (MD in IIEF scale 0.40, 95% CI −1.59 to 2.39; Analysis 3.7). The quality of evidence was moderate, due to high or unclear risk of bias in most domains.
3.4. Quality of life
Based on one study with 87 participants (Alexander 2004), antibiotics probably result in little to no effect on quality of life at six‐week follow‐up (MD in SF‐12 scale −3.90, 95% CI −7.94 to 0.14 (Analysis 3.8) for the mental domain, and MD 1.00, 95% CI −2.07 to 4.07 for the physical domain; Analysis 3.9). The quality of evidence was moderate, due to imprecision (the confidence interval crosses the threshold for the MCID).
3.5. Anxiety and depression
None of the included studies reported this outcome.
3.6. Urinary symptoms
Based on one study with 68 participants (Kim 2011a), antibiotics probably result in little to no effect in urinary symptoms at three‐month follow‐up (MD −1.10, 95% CI −2.88 to 0.68; Analysis 3.10). The quality of evidence was moderate, due to high or unclear risk of bias in most domains.
Sensitivity analysis: risk of bias
Prostatitis symptoms
Excluding all studies with unclear or high risk of bias, we included only one study with 196 participants under this comparison (Alexander 2004). This study indicated that there was a small reduction in prostatitis symptoms in those participants who received antibiotics compared to placebo (NIH‐CPSI scores, MD −2.80, 95% CI −5.45 to −0.15). When analysing the number of responders, antibiotics made little to no difference in the responder rate (RR 1.00, 95% CI 0.48 to 2.09).
Adverse events
Excluding all studies with unclear or high risk of bias, we included only one study with 196 participants under this comparison (Alexander 2004). This study indicated that antibiotics made little to no difference in the incidence of adverse events (RR 0.97, 95% CI 0.60 to 1.57).
No other predefined sensitivity analysis was possible for this comparison.
Subgroup analysis: age > 50 years versus age < 50 years
Prostatitis symptoms
a) Studies that included participants with a mean age above 50 years: one study (Nickel 2003a) MD 0.60, 95% CI −3.79 to 4.99; 1 study, 80 participants.
b) Studies that included participants with a mean age less than 50 years: four studies (Alexander 2004; Kim 2011a; Kulovac 2007; Wang 2016) MD −2.92, 95% CI −5.37 to −0.46; I2 = 78%; 4 studies, 292 participants.
The test for subgroup differences was not significant: Chi2 = 1.88, df = 1 (P = 0.17), I2 = 46.8% (Analysis 3.11).
Adverse events
a) Studies that included participants with a mean age above 50 years: one study (Nickel 2003a) RR 1.17, 95% CI 0.46 to 2.97; 1 study, 80 participants.
b) Studies that included participants with a mean age less than 50 years: three studies (Alexander 2004; Ye 2006; Wang 2016) RR 0.97, 95% CI 0.60 to 1.57; I2 = 0%; 3 studies, 256 participants.
The test for subgroup differences was not significant: Chi2 = 0.12, df = 1 (P = 0.73), I2 = 0% (Analysis 3.12).
Subgroup analysis: co‐interventions
Prostatitis symptoms
a) Studies that did not add any co‐interventions to the antibiotic versus placebo comparison: MD −1.57, 95% CI −4.77 to 1.63; I2 = 41%; 2 studies, 167 participants.
b) Studies that added co‐interventions (alpha blockers) with the antibiotics versus placebo comparison: MD −2.96, 95% CI −6.28 to 0.37; I2 = 85%; 3 studies, 205 participants.
Test for subgroup differences: Chi2 = 0.35, df = 1 (P = 0.56), I2 = 0% (Analysis 3.13).
Adverse events
a) Studies that did not add any co‐interventions to the antibiotics versus placebo comparison: RR 1.01, 95% CI 0.66 to 1.55; I2 = 0%; 2 studies, 175 participants.
b) Studies that added co‐interventions (alpha blockers) to the antibiotics versus placebo comparison: not estimable (no adverse events in the included studies).
Test for subgroup differences: Not applicable (Analysis 3.14).
No other predefined subgroup analysis was possible for this comparison.
Studies not included in meta‐analysis or 'Summary of findings' table
Three studies were not included in meta‐analysis due to missing outcome data:
-
Cheng 2010, with 215 participants, compared levofloxacin 500 mg, ciprofloxacin 500 mg, levofloxacin 1 g and no antibiotics. Participants who received levofloxacin had fewer prostatitis symptoms compared to those who received ciprofloxacin or no antibiotics (P < 0.05; study available as abstract only) at six‐week follow‐up. No other outcomes relevant for this review were reported in this study.
-
Choe 2014, with 75 participants, compared roxithromycin, ciprofloxacin and aceclofenac. Prostatitis symptoms: participants had a mean NIH‐CPSI score at 12‐week follow‐up of 9.8 in the roxithromycin group, 10 in the ciprofloxacin group and 14.3 in the aceclofenac group, but the authors reported that analysis of variance (ANOVA) yielded P values > 0.05. This study also reported the number of responders (six‐point decrease of NIH‐CPSI scores) at 12‐week follow‐up: 15/25 in the roxithromycin group, 13/25 in the ciprofloxacin group and 18/25 in the aceclofenac group (Chi2 and P > 0.05). At 12‐week follow‐up, the three groups had similar urinary symptoms measured by IPSS scores (ANOVA P > 0.05). "Three cases of mild dyspepsia, one case of diarrhoea, and one case of mild skin rash were reported", but the authors did not specify which treatment the participants had received. No other outcomes relevant for this review were reported in this study.
-
Zhou 2008, with 48 participants, compared tetracycline and placebo. The focus of this study was microbiological results. The study reported that participants who received tetracycline at three‐month follow‐up had a decrease in prostatitis measured by NIH‐CPSI scores (from 35.6 to 17.1), and "in the control group, however, no significant change was found in the [NIH]‐CPSI scores after placebo treatment". No other information was provided for the comparison between groups (mean differences, P values). No other outcomes relevant for this review were reported in this study.
4. Anti‐inflammatories versus placebo
Nine studies with 763 randomized participants were included under this comparison using different anti‐inflammatory agents: corticosteroids (Bates 2007; Yang 2009), antileukotrienes (Goldmeier 2005), nonsteroidal antiinflammatory drugs (NSAID) (Jiang 2009; Kim 2003; Kim 2011a; Wu 2008; Zhao 2009), and tiocolchicoside (Tuğcu 2007). See Table 1 and Table 2 for further details of the participants and interventions. See summary of findings Table 4. Three additional studies were not included in this summary due to missing data, and are described below (Nickel 2003b; Tugcu 2006; Zeng 2004).
4.1. Prostatitis symptoms
Based on seven studies with 585 participants (Jiang 2009; Kim 2003; Kim 2011a; Tuğcu 2007; Wu 2008; Yang 2009; Zhao 2009), anti‐inflammatories may cause a small reduction in prostatitis symptoms when compared to placebo at six‐week to six‐month follow‐up (random‐effects meta‐analysis, MD −2.50, 95% CI −3.74 to −1.26; I2 = 88%; Analysis 4.1). This effect was only evident in the analysis of subscores of pain, but not in urinary symptoms and quality of life (Analysis 4.2; Analysis 4.3; Analysis 4.4). The quality of the evidence is low, due to high or unclear risk of bias in most studies, and inconsistency (high statistical heterogeneity).
Based on two studies with 82 participants (Bates 2007; Zhao 2009), anti‐inflammatories may have resulted in little to no difference in responder rate compared to placebo (random‐effects meta‐analysis, RR 1.44, 95% CI 0.68 to 3.03; I2 = 0%; Analysis 4.5). The quality of the evidence is low, due to high or unclear risk of bias in most studies, and imprecision (few events, resulting in a confidence interval that includes appreciable benefits and harms).
Tuğcu 2007, with 90 participants, reported long‐term results. For the comparison of tiocolchicoside, ibuprofen and terazosin versus terazosin alone, participants in the combined therapy group probably have fewer prostatitis symptoms (MD −10.50, 95% CI −11.12 to −9.88; Analysis 4.6). The quality of the evidence is moderate, due to high risk of bias.
4.2. Adverse events
Based on seven studies with 540 participants with four‐week to six‐month follow‐up (Goldmeier 2005; Jiang 2009; Kim 2003; Tuğcu 2007; Wu 2008; Yang 2009; Zhao 2009), anti‐inflammatories may result in little to no difference in adverse events (random‐effects meta‐analysis, RR 1.27, 95% CI 0.81 to 2.00; I2 = 9%; Analysis 4.7). The quality of the evidence is low, due to high or unclear risk of bias in most studies, and imprecision (few events, resulting in a confidence interval that includes appreciable benefits and harms). Common adverse events included: nausea and gastrointestinal discomfort, heartburn, skin rash and hypersensitivity.
4.3. Sexual dysfunction
None of the included studies reported this outcome.
4.4. Quality of life
None of the included studies reported this outcome.
4.5. Anxiety and depression
None of the included studies reported this outcome.
4.6. Urinary symptoms
Based on one study with 72 participants (Kim 2011a) with three‐month follow‐up, anti‐inflammatories probably result in little to no difference in urinary symptoms (MD −1.30, 95% CI −2.97 to 0.37; Analysis 4.8). The quality of evidence is moderate, due to high risk of bias.
Subgroup analysis: co‐interventions
Prostatitis symptoms
a) Studies that did not add any co‐interventions to the anti‐inflammatories versus placebo comparison: MD −3.62, 95% CI −4.85 to −2.39; 1 study, 64 participants.
b) Studies that added co‐interventions (alpha blockers or antibiotics) to the anti‐inflammatories versus placebo comparison: MD −2.29, 95% CI −3.67 to −0.90; I2 = 89%; 6 studies, 521 participants.
Test for subgroup differences: Chi2 = 1.99, df = 1 (P = 0.16), I2 = 49.8%; (Analysis 4.9).
Adverse events
a) Studies that did not add any co‐interventions to the anti‐inflammatories versus placebo comparison: RR 2.00, 95% CI 0.19 to 20.97; 1 study, 64 participants.
b) Studies that added co‐interventions (alpha blockers or antibiotics) to the anti‐inflammatories versus placebo comparison: RR 1.25, 95% CI 0.73 to 2.15; ; I2 = 25%; 6 studies, 476 participants.
Test for subgroup differences: Chi2 = 0.14, df = 1 (P = 0.70), I2 = 0%; (Analysis 4.10).
No other predefined subgroup analysis was possible for this comparison.
Studies not included in meta‐analysis or 'Summary of findings' table
Three studies were not included in meta‐analysis due to missing outcome data:
-
Nickel 2003b, with 161 participants, compared rofecoxib in 50 mg and 25 mg doses to placebo. At six‐week follow‐up, participants had a similar decrease in prostatitis symptoms: mean change from baseline NIH‐CPSI was −4.2 in the placebo group, −4.9 in the rofecoxib 25 mg (P = 0.68 compared to placebo) and −6.2 in the rofecoxib 50 mg group (P = 0.68 compared to placebo). There was a greater number of responders (defined as a six‐point decrease in NIH‐CPSI scores) at six‐week follow‐up in the rofecoxib 50 mg group (62.5%) compared to the placebo group (39.7%; P = 0.031); however, there were no differences between the rofecoxib 25 mg group (46.2%) and the placebo group. Adverse events: two participants in the placebo group suffered from chest pain and atrial flutter, and two in the rofecoxib 50 mg group suffered from chest pain. No other outcomes relevant for this review were reported in this study. Note: this drug was withdrawn from the market in 2004 due to a increased risk of heart attack (Sibbald 2004).
-
Zeng 2004, with 60 participants, compared celecoxib 200 mg once daily or twice daily. At six‐week follow‐up, participants in the celecoxib twice‐daily group had fewer prostatitis symptoms compared to those in the celecoxib once‐daily group (MD −5.20, 95% CI −5.88 to −4.52). One participant in the celecoxib twice‐daily group suffered from headache and one participant in the celecoxib once‐daily group suffered from mild diarrhoea. No other outcomes relevant for this review were reported in this study.
-
Tugcu 2006, with 45 participants, compared the use of tiocolchicoside, ibuprofen and terazosin versus terazosin alone. Participants in both groups had similar prostatitis symptoms at six‐ and 12‐month follow‐up (only subscores were available, P > 0.05). No other outcomes relevant for this review were reported in this study.
5. Phytotherapy versus placebo
Seven studies with 551 randomized participants were included under this comparison, using different phytotherapeutic agents: Prolit super septo® (combined agents) (Breusov 2014); calendula‐curcuma (Morgia 2017); cranberry (Park 2005); quercetin (Shoskes 1999); pollen extract (Elist 2006; Wagenlehner 2009; Ye 2006). See Table 1 and Table 2 for further details of the participants and interventions. See summary of findings Table 5. Fourteen studies were not included in this meta‐analysis due to missing data or because they do not compare phytotherapy to placebo (head‐to‐head comparisons) and are described below (Apolikhin 2010; Cai 2014; Cai 2017; Cha 2009; Giammusso 2017; Iwamura 2015; Kaplan 2004; Lee 2006a; Macchione 2017; Maurizi 2019; Morgia 2010; Okada 1985; Reissigl 2004; Xu 2000). One study assessing the effects of cytoflavin did not report outcomes relevant to this review (Churakov 2012).
5.1. Prostatitis symptoms
Based on five studies with 320 participants with one‐ to three‐month follow‐up (Breusov 2014; Morgia 2017; Park 2005; Shoskes 1999; Wagenlehner 2009), phytotherapy may reduce prostatitis symptoms compared to placebo (random‐effects meta‐analysis, MD −5.02, 95% CI −6.81 to −3.23; I2 = 60%; Analysis 5.1). These lower scores were observed across all subscores of pain, urinary symptoms and QoL (Analysis 5.2; Analysis 5.3; Analysis 5.4). The quality of evidence was low, due to unclear or high risk of bias in most domains in most studies, and imprecision (the confidence interval crosses the threshold for the MICD).
Based on three studies with 224 participants with one‐ to three‐month follow‐up (Breusov 2014; Shoskes 1999; Wagenlehner 2009), phytotherapy probably increases the responder rate compared to placebo (random‐effects meta‐analysis, RR 1.78, 95% CI 1.25 to 2.52; I2 = 27%; Analysis 5.5). The quality of evidence was moderate, due to unclear or high risk of bias in most domains in the main study of this comparison.
5.2. Adverse events
Based on seven studies with 540 participants with one‐ to three‐month follow‐up (Breusov 2014; Elist 2006; Morgia 2017; Park 2005; Shoskes 1999; Wagenlehner 2009; Ye 2006), phytotherapy may result in little to no difference in adverse events (random‐effects meta‐analysis, RR 1.13, 95% CI 0.54 to 2.36; I2 = 0%; Analysis 5.6). The quality of the evidence is low, due to high or unclear risk of bias in most studies, and imprecision (few events, resulting in a confidence interval that includes appreciable benefits and harms). Common adverse events included: gastrointestinal discomfort including nausea, dyspepsia and diarrhoea, headache, and skin rash.
5.3. Sexual dysfunction
Based on one study with 48 participants (Morgia 2017), phytotherapy (in this case, calendula‐curcuma) may have improved sexual dysfunction at three‐month follow‐up (MD in IIEF score 3.50, 95% CI 2.67 to 4.33; Analysis 5.7). The quality of the evidence was low, due to high risk of bias and imprecision (the confidence interval crosses the threshold for the MCID).
5.4. Quality of life
None of the included studies reported this outcome.
5.5. Anxiety and depression
None of the included studies reported this outcome.
5.6. Urinary symptoms
Based on one study with 139 participants (Wagenlehner 2009), phytotherapy (in this case pollen extract) probably resulted in little to no difference in urinary symptoms at 12‐week follow‐up (IPSS score MD −1.14, 95% CI −2.36 to 0.08; Analysis 5.8). The quality of evidence was moderate, due to high risk of bias.
Sensitivity analysis: diagnostic criteria
We performed a sensitivity analysis excluding Shoskes 1999, which did not meet the Research Consensus definition for CP/CPPS (Nickel 1999).
Prostatitis symptoms
The exclusion of Shoskes 1999 did not produce a significant alteration to the estimate for this outcome (MD −4.95, 95% CI −6.99 to −2.91; I2 = 70%; 4 studies, 292 participants).
Adverse events
The exclusion of Shoskes 1999 did not produce a significant alteration to the estimate for this outcome (RR 1.07, 95% CI 0.49 to 2.34; I2 = 0%; 6 studies, 512 participants = 512).
No other predefined sensitivity analysis was possible for this comparison.
Subgroup analysis: co‐interventions
Prostatitis symptoms
a) Studies that did not add any co‐interventions to the phytotherapy versus placebo comparison: MD −6.06, 95% CI −7.28 to −4.84; I2 = 0%; 3 studies, 133 participants.
b) Studies that added co‐interventions (alpha blockers or antibiotics, or both) to the phytotherapy versus placebo comparison: MD −3.92, 95% CI −6.76 to −1.08; I2 = 75%; 2 studies, 187 participants.
Test for subgroup differences: Chi2 = 1.84, df = 1 (P = 0.17), I2 = 45.7% (Analysis 5.9).
Adverse events
a) Studies that did not add any co‐interventions to the phytotherapy versus placebo comparison: RR 2.09, 95% CI 0.33 to 13.30; I2 = 0%; 4 studies, 191 participants.
b) Studies that added co‐interventions (alpha blockers or antibiotics, or both) to the phytotherapy versus placebo comparison: RR 1.14, 95% CI 0.34 to 3.79; I2 = 17%; 3 studies, 349 participants.
Test for subgroup differences: Chi2 = 0.29, df = 1 (P = 0.59), I2 = 0% (Analysis 5.10).
No other predefined sensitivity analysis was possible for this comparison.
Studies not included in meta‐analysis or 'Summary of findings' table
Fourteen studies were not included in this summary due to missing data or because they do not compare phytotherapy to placebo (head‐to‐head comparisons) and are described below.
Pollen extract
-
Apolikhin 2010, with 78 participants, compared the use of a pollen extract pill (Cernilton®) three times a day for three months at a single dose or a double dose (two pills in each dose). Participants who received a higher dose may have had fewer prostatitis symptoms at six‐month follow‐up compared to those with a single dose (MD in NIH‐CPSI scores −2.40, 95% CI −4.28 to −0.52). No other outcomes relevant to this review were reported in this study.
-
Cai 2014, with 87 participants, compared the use of a pollen extract pill (Deprox®) and ibuprofen. Participants who received pollen extract had fewer prostatitis symptoms than those who received ibuprofen at 30‐day follow‐up (MD in NIH‐CPSI scores −6.70, 95% CI −7.65 to −5.75). Participants who received pollen extract and ibuprofen had similar urinary symptoms (MD in IPSS score MD −0.40, 95% CI −1.42 to 0.62). Participants in the pollen extract group had higher quality‐of‐life measurements compared to the ibuprofen group (Quality of Well‑Being scale, range 0 to 1, MD 0.10, 95% CI 0.03 to 0.17). One participant in the pollen extract group suffered from nausea and seven participants in the ibuprofen group suffered from nausea and epigastric pain. No other outcomes relevant to this review were reported in this study.
-
Cai 2017, with 70 participants, compared the use of a pollen extract pill (Deprox®) and bromelain. Participants who received pollen extract had fewer prostatitis symptoms than those who received bromelain at three‐month follow‐up (MD in NIH‐CPSI scores −10.80, 95% CI −12.51 to −9.09). Participants in the pollen extract group had higher quality‐of‐life measurements compared to the bromelain group (SF‐36 scale MD 3.70, 95% CI 2.45 to 4.95). One participant in the pollen extract group and two participants in the bromelain group suffered from nausea. No other outcomes relevant to this review were reported in this study.
-
Iwamura 2015, with 100 participants, compared the use of a pollen extract pill and Eviprostat® (a herbal supplement). At eight‐week follow‐up, prostatitis symptoms were similar in both groups (P = 0.76), with a similar incidence of responders (25% decrease in NIH‐CPSI scores: RR 0.80, 95% CI 0.71 to 1.08). There were two non‐severe adverse events in the pollen extract group and one in the Eviprostat® group. No other outcomes relevant to this review were reported in this study. This study included participants with a mean age above 50 years, and it was therefore not possible to conduct subgroup analysis, since no other study was included under this comparison.
-
Macchione 2017, with 63 participants, compared the use of pollen extract pill (Deprox®) and Serenoa repens. At six‐week follow‐up participants in the pollen extract group had fewer prostatitis symptoms measured by NIH‐CPSI scores compared to the Serenoa repens group (MD −3.70, 95% CI −5.67 to −1.73). Participants in the pollen extract group had fewer urinary symptoms measured by IPSS scores compared to the Serenoa repens group (MD −4.90, 95% CI −7.12 to −2.68). No other outcomes relevant to this review were reported in this study.
-
Maurizi 2019, with 54 participants, compared the use of pollen extract pill (Deprox®) and quercetin. At four‐week follow‐up participants in the pollen extract group had fewer prostatitis symptoms measured by NIH‐CPSI scores compared to quercetin ( MD −2.63, 95% CI −3.61 to −1.65). Participants in the pollen extract group had similar urinary symptoms measured by IPSS scores compared to the quercetin group (MD −0.37, 95% CI −1.12 to 0.38). No participant suffered adverse in each group. No other outcomes relevant to this review were reported in this study.
-
Okada 1985, with 76 participants, compared the use of pollen extract to an amino acid compound ("PPC"), and Xu 2000, with 60 participants, compared the use of pollen extract to a sequence of antibiotics. No outcomes relevant to this review were reported in these studies.
Serenoa repens
-
Morgia 2010, with 102 participants, compared the use of Serenoa repens with other herbal extracts (Profluss®) and Serenoa repens alone. Participants in the Profluss® group had fewer prostatitis symptoms at 16‐week follow‐up (mean NIH‐CPSI score 13.27) compared to the Serenoa repens group (mean NIH‐CPSI score 20.52, P < 0.001). Participants in the Profluss® group had a greater risk of achieving a response in prostatitis symptoms (> 50% reduction in NIH‐CPSI scores) compared to those in the Serenoa repens group (RR 2.00, 95% CI 1.16 to 3.44). Participants in the Profluss® group had fewer urinary symptoms (mean IPSS score 7.6) compared to the Serenoa repens group (mean IPSS score 170.1, P < 0.001). Four participants in the Profluss® group and three in the Serenoa repens groups suffered gastrointestinal adverse events. One participant in the Profluss® group and one in the Serenoa repens group suffered cephalea as an adverse event. No other outcomes relevant to this review were reported in this study.
-
Kaplan 2004, with 64 participants, compared the use of Serenoa repens to finasteride. The participants had similar prostatitis symptoms in both groups at three‐month follow‐up (results were available only in graph form). At 12‐month follow‐up, prostatitis symptoms measured by the mean NIH‐CPSI score was 24.6 in the Serenoa repens group and 18.1 in the finasteride group (P < 0.02). At 12‐month follow‐up, urinary symptoms measured by the American Urological Association scale (AUA) were similar in both groups (mean score 10.4 in the Serenoa repens group and 11.9 in the finasteride group). Three participants suffered adverse events in the Serenoa repens group (headache) and two participants suffered adverse events in the finasteride group (decreased libido). No other outcomes relevant to this review were reported in this study.
-
Reissigl 2004, with 142 participants, compared the use of Serenoa repens to placebo. Participants in the Serenoa repens group had a greater risk of achieving a response in prostatitis symptoms (30% to 50% decrease in NIH‐CPSI scores) compared with the placebo group (RR 3.89, 95% CI 2.33 to 6.48). Participants in the Serenoa repens group had a greater risk of achieving a response in urinary symptoms (50% decrease in IPSS scores) compared to the placebo group (RR 4.33, 95% CI 2.46 to 7.62). No other outcomes relevant to this review were reported in this study.
-
Giammusso 2017, with 44 participants, compared the administration of palmitoylethanolamide to Serenoa repens extract. The authors reported that those who received palmitoylethanolamide had a reduction in prostatitis symptoms (measured by NIH‐CPSI scores) and urinary scores (measured by IPSS scores), but they did not have an improvement in sexual dysfunction (measured by IIEF scores). These outcomes were reported in a narrative fashion and graphically. None of the participants suffered adverse events. No other outcomes relevant to this review were reported in this study.
Terpene mixture
-
Lee 2006a, with 50 participants, compared the use of a terpene mixture and ibuprofen. At six‐week follow‐up, participants who received the terpene mixture had similar prostatitis symptoms (mean NIH‐CPSI score 16.8) compared to those in the ibuprofen group (mean NIH‐CPSI score 15.3, P = 0.06). The study reported that three participants in the terpene mixture group suffered from heartburn. No other outcomes relevant to this review were reported in this study.
-
Cha 2009, with 103 participants, compared levofloxacin, levofloxacin plus alfuzosin and levofloxazin plus terpene mixture. Participants who received levofloxacin plus terpene mixture had fewer prostatitis symptoms measured by NIH‐CPSI scores (mean score 12.4) compared to those who received levofloxacin alone (mean score 15.4) at eight‐week follow‐up. One participant in the terpene mixture group suffered from nausea. P values and standard deviations were not available. No other outcomes relevant to this review were reported in this study.
6. Botulinum toxin A versus placebo
Two studies compared the use of botulinum toxin A (BTA) to a sham procedure: one study with 60 participants (Falahatkar 2015) applied the toxin to the prostate, and another study with 29 participants (Gottsch 2011) applied the toxin to pelvic floor muscles. We report the outcomes of these studies separately due to this clinical heterogeneity in the interventions and participants (Gottsch 2011 included participants aged over 50 years, and Falahatkar 2015 included participants with more severe baseline prostatitis symptoms). See Table 1 and Table 2 for further details of the participants and interventions. See summary of findings Table 6. One study that explored two different BTA injection protocols (Elshawaf 2009) is not included in the 'Summary of findings' table (see below).
6.1. Prostatitis symptoms
6.1.1. Prostatitis symptoms: subgroup intraprostatic injection, participants < 50 years old with basal NIH‐CPSI scores > 30
Based on one study with 60 participants (Falahatkar 2015), intraprostatic BTA injection may have decreased prostatitis symptoms at six‐month follow‐up (MD −25.80, 95% CI −30.15 to −21.45; Analysis 6.1). These results were consistent across all subscores of pain, urinary symptoms and quality of life (Analysis 6.2; Analysis 6.3; Analysis 6.4). The quality of the evidence is low, due to unclear risk of selection bias and imprecision issues (small sample size resulting in a wide confidence interval).
6.1.2. Prostatitis symptoms: subgroup pelvic floor muscles injection, participants > 50 years old with basal NIH‐CPSI scores < 30
Based on one study with 29 participants (Gottsch 2011), pelvic floor muscle BTA injection may have caused little to no effect in prostatitis symptoms at one‐month follow‐up (MD −2.60, 95% CI −5.59 to 0.39; Analysis 6.1). These results were consistent across subscores of urinary symptoms and quality of life, however pain scores in the BTA group were lower than the control group (Analysis 6.2; Analysis 6.3; Analysis 6.4). The quality of evidence is low, due to high risks of performance and detection bias, and imprecision issues (small sample size resulting in a wide confidence interval).
6.2. Adverse events
The study on intraprostatic BTA injection (Falahatkar 2015) reported that two participants in the active treatment group suffered from haematuria (RR 5.00, 95% CI 0.25 to 99.95; 60 participants; Analysis 6.5). No participants in the study on pelvic floor muscle BTA injection (Gottsch 2011) suffered adverse events. The quality of the evidence is low, due to unclear or high risks of bias and imprecision (few events).
6.3. Sexual dysfunction
None of the included studies reported this outcome.
6.4. Quality of life
None of the included studies reported this outcome.
6.5. Anxiety and depression
None of the included studies reported this outcome.
6.6. Urinary symptoms
The study on intraprostatic BTA injection reported this outcome (Falahatkar 2015). Intraprostatic BTA injection may have decreased urinary symptoms (IPSS scores, MD −9.67, 95% CI −13.97 to −5.37; 60 participants; Analysis 6.6). The quality of the evidence is low, due to unclear risk of selection bias, and imprecision issues (small sample size resulting in a wide confidence interval).
Studies not included in meta‐analysis or 'Summary of findings' table
One study was not included in meta‐analysis due to missing outcome data. Elshawaf 2009, with 52 participants, compared botulinum toxin A injection in the external urethral sphincter versus a combined injection in the prostate and external urethral sphincter. At six‐month follow‐up, the group with the combined injection had fewer prostatitis symptoms measured by NIH‐CPSI scores (P < 0.05). None of the participants suffered adverse events. No other outcomes relevant for this review were reported in this study.
7. Allopurinol versus placebo
Two studies with 110 participants were included under this comparison (Persson 1996; Ziaee 2006). See Table 1 and Table 2 for further details of the participants and interventions. See summary of findings Table 7. One of these studies (Persson 1996) reported the incidence of adverse events (see below), but no outcomes relevant for this review were reported in this study, since the authors used a 12‐point scale that was not validated for this condition.
7.1. Prostatitis symptoms
Based on one study with 56 participants with three‐month follow‐up (Ziaee 2006), allopurinol may cause little to no different in prostatitis symptoms compared to placebo (MD −0.21, 95% CI −4.48 to 4.06; Analysis 7.1). This was also evident in pain and urinary subscores (Analysis 7.2; Analysis 7.3). The quality of evidence was low, due to unclear or high risks of bias in most domains and imprecision (the confidence interval includes appreciable benefits and harms).
7.2. Adverse events
Based on the included studies with 110 participants, no adverse events were observed at three‐month follow‐up. The quality of the evidence is low, due to high or unclear risks of bias in both studies, and imprecision (zero events).
7.3. Sexual dysfunction
None of the included studies reported this outcome.
7.4. Quality of life
None of the included studies reported this outcome.
7.5. Anxiety and depression
None of the included studies reported this outcome.
7.6. Urinary symptoms
None of the included studies reported this outcome.
8. Traditional Chinese medicine (TCM) versus placebo
Seven studies with 970 randomized participants were included under this comparison (Hu 2015; Li 2003; Li 2012; Sun 2008; Tan 2009; Xia 2014; Zhang 2007). See Table 1 and Table 2 for further details of the participants and interventions. See summary of findings Table 8. Five studies were not included in the 'Summary of findings' table and are described below (Chen 2009; Li 2007; Peng 2003; Shi 1994; Wang 2004).
8.1. Prostatitis symptoms
Based on seven studies with 835 participants with two‐week to two‐month follow‐up (Hu 2015; Li 2003; Li 2012; Sun 2008; Tan 2009; Xia 2014; Zhang 2007), TCM may reduce prostatitis symptoms compared to placebo (MD ‐3.13, 95% CI ‐4.99 to ‐1.28; I2 = 82%, Analysis 8.1). These results were consistent in the pain and urinary subscores but not quality of life subscore (Analysis 8.2; Analysis 8.3; Analysis 8.4). The quality of evidence was low, due to high risk of bias (unclear or high risk of bias in most domains in most studies) and inconsistency (I2 > 80%), although some of this inconsistency might be explained by the differences between the interventions in this comparison (possible indirectness).
8.2. Adverse events
Based on four studies with 584 participants at four‐ to eight‐week follow‐up (Li 2003; Li 2012; Tan 2009; Zhang 2007), TCM may cause little to no difference in adverse events compared to placebo (RR 1.34, 95% CI 0.22 to 8.02; I2 = 45%; Analysis 8.5). The quality of evidence was low, due to high risk of bias (unclear or high risk of bias in most domains in most studies) and imprecision (few events, resulting in a confidence interval that includes appreciable benefits and harms). Common adverse events included gastrointestinal discomfort, nausea, vomiting and diarrhoea, and anal bleeding (for those TCM interventions that used suppositories).
8.3. Sexual dysfunction
One study with 88 participants (Xia 2014) reported this outcome at two‐week follow‐up. TCM probably resulted in little to no difference in sexual discomfort when compared to placebo (IIEF scores, MD 0.27, 95% CI −1.17 to 1.71; Analysis 8.6). The quality of evidence is moderate, due to high risk of or unclear risk of bias in most domains of the study.
8.4. Quality of life
None of the included studies reported this outcome.
8.5. Anxiety and depression
One study with 88 participants (Xia 2014) reported this outcome at two‐week follow‐up. TCM may have resulted in a decrease in symptoms of anxiety and depression when compared to placebo (Hamilton Anxiety Rating Scale, MD −9.50, 95% CI −11.70 to −7.30; Analysis 8.7; Hamilton Depression Rating Scale, MD −7.84, 95% CI −10.71 to −4.97; Analysis 8.8). The quality of evidence is low, due to high risk of bias (unclear or high risk of bias in most domains in most studies) and imprecision (small sample size resulting in a wide confidence interval that crosses the threshold for the MCID).
8.6. Urinary symptoms
None of the included studies reported this outcome
Studies not included in meta‐analysis or 'Summary of findings' table
Five studies were not included in meta‐analysis due to missing outcome data or because they involve head‐to‐head comparisons:
-
Chen 2009, with 70 participants, compared QianTongDing Decoction with indomethacin. Participants who received QianTongDing Decoction may have had fewer prostatitis symptoms at one‐month follow‐up (MD in NIH‐CPSI scores −6.80, 95% CI −7.94 to −5.66). The quality of evidence is low, due to high risk of bias and imprecision issues. Two participants in the indomethacin group suffered from epigastralgia. No participants in the QianTongDing group suffered adverse events. No other outcomes relevant to this review were reported in this study.
-
Li 2007, with 108 participants, compared a Tiaoshen Tonglin infusion with terazosin. Participants who received Tiaoshen Tonglin infusion may have had fewer prostatitis symptoms at two‐month follow‐up (MD in NIH‐CPSI scores −3.80, 95% CI −4.82 to −2.78). The incidence of adverse events was 2/56 in the Tiaoshen Tonglin and 12/52 in the terazosin group (dizziness and palpitations). The quality of evidence is low, due to high risk of bias and imprecision issues. No other outcomes relevant to this review were reported in this study.
-
Peng 2003, with 160 participants, compared an "antiphlogistic" agent in different regimens and with various co‐interventions. No outcomes relevant to this review were reported in this study.
-
Shi 1994, with 60 participants, compared QianLieAnWan capsules and QianLieKang (a type of pollen extract capsule). No outcomes relevant to this review were reported in this study.
-
Wang 2004, with 38 participants, compared an intraprostatic injection of Chuanshentong to a placebo injection. At six‐week follow‐up there were more participants who had an appreciable reduction in prostatitis symptoms (six or more points decrease in NIH‐CPSI scores) in the active treatment group compared to the placebo group (RR 2.49, 95% CI 1.24 to 4.97). The study stated that there were no adverse events in the active treatment group. No outcomes relevant to this review were reported in this study.
9. Other pharmacological agents
In the following sections we provide a description of the studies that included other pharmacological agents (in alphabetical order). See Table 1 and Table 2 for further details of the participants and interventions.
9.1. Anticholinergics
Three studies with 202 randomized participants were included under this comparison (Kim 2008; Kim 2011b;Lu 2004).
9.1.1. Prostatitis symptoms
Based on the three studies (Kim 2008; Kim 2011b; Lu 2004) with four‐ to eight‐week follow‐up, anticholinergics probably resulted in little to no difference in prostatitis symptoms compared to control (random‐effects meta‐analysis, MD −1.20, 95% CI −3.49 to 1.09; I2 = 47%; 3 studies, 173 participants). The quality of evidence was moderate, due to high or unclear risks of bias in most domains.
9.1.2. Adverse events
Two studies with 106 participants reported adverse events (Kim 2008; Lu 2004). These studies reported that there were globally no adverse events. The quality of evidence is low, due to high or unclear risks of bias in most domains, and imprecision (zero events in both groups).
9.1.3. Sexual dysfunction
One study (Kim 2011b) with 96 participants reported sexual dysfunction. Participants who received anticholinergics had similar sexual dysfunction measured by IIEF scores (MD 1.00, 95% CI −1.46 to 3.46). The quality of evidence was moderate, due to high or unclear risks of bias in most domains.
9.1.4. Quality of life
None of the studies reported this outcome.
9.1.5. Depression and anxiety
None of the studies reported this outcome.
9.1.6. Urinary symptoms
Two studies with 133 participants reported urinary symptoms (Kim 2008; Kim 2011b). Participants who received anticholinergics may have a slight reduction in urinary symptoms (MD −2.32, 95% CI −4.24 to −0.40; I2 = 0%). The quality of evidence was moderate, due to high or unclear risk of bias in most domains.
9.2. Antidepressants
Five studies with 495 randomized participants evaluated these agents: three studies with 94 participants compared antidepressants to placebo (Giannantoni 2014; Lee 2005; Turkington 2002) and another study with 150 randomized participants compared duloxetine and doxazosin, sertraline and doxazosin, and doxazosin alone (doxazosin acted as a co‐intervention) (Zhang 2017). One additional study with 251 randomized participants compared the use of dapoxetin as add‐on therapy to medical therapy versus medical therapy alone in patients with comorbid premature ejaculation (Zhao 2019) is described separately below.
Antidepressants versus placebo
9.2.1 Prostatitis symptoms
Giannantoni 2014, with 38 participants, reported that those who received duloxetine had fewer prostatitis symptoms compared to those who received placebo (MD −5.97, 95% CI −7.89 to −4.05) at 16‐week follow‐up. Lee 2005, with 14 participants, reported this outcome using the Prostatitis Symptom Severity scale (0 to 100 score, benefit is indicated by lower scores). Participants who received sertraline had statistically non‐significantly lower mean scores (mean score 17.3) compared to those on placebo (mean score 26, P = 0.34) at 13‐week follow‐up. The quality of evidence was very low, due to high risk of bias, inconsistency and imprecision (few events). Zhang 2017, with 150 participants, reported that those in the duloxetine group had fewer prostatitis symptoms at six‐month follow‐up (mean decrease 12.64 points) compared to those receiving sertraline (mean decrease 7.41 points, P < 0.01) and to those receiving doxazosin alone (mean decrease 6.12 points, P < 0.01). The responder rate was greater in the duloxetine group (88.6%) compared to the sertraline group (63.4%) and the doxazosin‐alone group (56.1%).
9.2.2. Adverse events
Based on three studies with 94 participants (Giannantoni 2014; Turkington 2002; Lee 2005) at 8‐ to 16‐week follow‐up, antidepressants may cause little to no difference in adverse events (random‐effects meta‐analysis, RR 1.65, 95% CI 0.54 to 5.04; I2 = 14%). The quality of the evidence was low, due to high risk of bias and imprecision (few events). Common adverse events included gastrointestinal discomfort, decreased libido and ejaculatory disorders, sedation and dizziness.
Zhang 2017, with 150 participants, reported narratively: three participants discontinued treatment due to adverse events in the duloxetine group, two in the sertraline group and two in the doxazosin group, and that "[the] occurrence rate of nausea and vomiting was 15.91% in duloxetine group, which was significantly higher than that in the other 2 groups, and some patients were unable to tolerate the adverse reactions".
9.2.3. Sexual dysfunction
Giannantoni 2014, with 38 participants, reported this outcome using the IIEF score. Participants in both groups had similar scores at 16‐week follow‐up: mean score in the duloxetine group was 14.8, mean score in the placebo group was 15.3, P = "NS" (non‐significant). Lee 2005, with 14 participants, reported this outcome using the Psychosexual Questionnaire. Participants in both groups had similar scores at 13‐week follow‐up: mean score in the sertraline group was 22.1, mean score in the placebo group was 23.1, P = 0.44.
The quality of the evidence was low, due to high risk of bias and imprecision (few events).
9.2.4. Quality of life
Turkington 2002, with 42 participants, reported that those who received fluvoxamine had improved quality of life at eight‐week follow‐up (measured by the General Health Questionnaire, mean score in the fluvoxamine group was 5.75 and mean score in the placebo group was 1.25, P < 0.01).
The quality of the evidence was low, due to high risk of bias and imprecision (small sample size, underpowered study).
9.2.5. Depression and anxiety.
Turkington 2002, with 42 participants, reported that both groups had similar symptoms of anxiety and depression at eight‐week follow‐up (measured by Hamilton Depression Scale, P = 0.21 for the anxiety domain and 0.87 for the depression domain).
Giannantoni 2014, with 38 participants, reported that those in the duloxetine group had fewer symptoms of anxiety (mean Hamilton Anxiety scale of 7.93, SD 6.54) compared to those who received placebo (mean score of 15.72, SD 10.11, P < 0.01). The symptoms of depression (measured by Hamilton Depression scale) were fewer in the duloxetine group, but this difference was not statistically significant. Follow‐up was 16 weeks.
Lee 2005, with 14 participants, reported that those who received sertraline had statistically non‐significantly lower mean symptoms of anxiety and depression as measured by the Hospital Anxiety and Depression scale (anxiety score was 6.7, depression score was 3.1 in the sertraline group, while anxiety score was 17.7, and depression score was 5.6 in the placebo group, P value = 0.4 and 0.3 respectively) at 13‐week follow‐up.
Zhang 2017, with 150 participants, reported that those who received duloxetine had fewer symptoms of anxiety and depression at six‐month follow‐up measured by the Hospital Anxiety and Depression Scale (HADS) (mean decrease 9.43 points) compared to those who received sertraline (mean decrease 7.27 points, P < 0.05) and those who received doxazosin alone (mean decrease 4.90 points, P < 0.01).
The quality of evidence was low, due to high risk of bias and imprecision (small sample size, underpowered studies).
9.2.6. Urinary symptoms
None of the included studies reported this outcome.
Antidepressants (dapoxetine) plus medical therapy versus medical therapy alone in men with premature ejaculation
A study with 251 randomized participants compared the use of dapoxetine as add‐on therapy to medical therapy versus medical therapy alone in patients suffering from CP/CPPS with comorbid premature ejaculation (Zhao 2019).
In this study, based on available data from 114 participants, those who received dapoxetine may have had fewer prostatitis symptoms at 12 week follow‐up (NIH‐CPSI score, MD ‐4.37, 95% CI ‐6.88 to ‐1.86) and fewer sexual dysfunction (measured by the Premature Ejaculation Profile with a range from 0 to 16 and higher scores indicating improvement, MD 4.43, 95% CI 2.83 to 6.03) compared to those in the control group. Based on data from 251 participants, the incidence of adverse events was similar in both groups: 7.37% in the dapoxetine group and 4.91% in the control group (RR 1.50, 95% CI 0.45 to 5.04). No outcomes relevant to this review were reported in this study. The quality of the evidence was low due to imprecision and study limitations.
9.3. Mepartricin
Two studies analysed this intervention (Cavallini 2001; De Rose 2004).
Cavallini 2001, with 42 participants, compared mepartricin versus vitamin C (as a placebo comparator). An adverse event was reported in 1/22 participants in the mepartricin group (epigastralgia), with none in the control group. No other outcomes relevant to this review were reported in this study.
De Rose 2004, with 26 participants, compared mepartricin with placebo. At 60‐day follow‐up, participants who received mepartricin had fewer prostatitis symptoms measured by NIH‐CPSI scores (median 10, interquartile range 4 to 25), compared to those who received placebo (median 20, interquartile range 11 to 45, P = 0.0018). Two participants who received mepartricin suffered from epigastralgia. No other outcomes relevant to this review were reported in this study.
The quality of the evidence for the reported outcomes was low, due to high risk of bias and imprecision (small sample size, underpowered studies).
Note: this drug has only limited availability worldwide (some European countries and Brazil).
9.4. OM‐89 (Escherichia coli lysate)
Wagenlehner 2014, with 185 participants, compared the use of OM‐89 versus placebo.
9.4.1. Prostatitis symptoms
OM‐89 probably has little to no effect on prostatitis symptoms (MD −0.60, 95% CI −3.21 to 2.01) compared to those who received placebo at 12‐month follow‐up. The number of participants who achieved a 25% decrease in NIH‐CPSI scores was similar in both groups (RR 0.99, 95% CI 0.78 to 1.25). The quality of the evidence was moderate, due to high risk of bias.
9.4.2. Adverse events
OM‐89 probably has little to no effect on adverse events (RR 0.99, 95% CI 0.78 to 1.25). The quality of the evidence for the reported outcomes was low, due to high risk of bias and imprecision (few events, resulting in a confidence interval that includes appreciable benefits and harms).
9.4.3. Sexual dysfunction, quality of life, anxiety and depression, or urinary symptoms
No other outcomes relevant to this review were reported in this study.
9.5. Pentosan
Two studies with 130 participants (Nickel 2005; Wedren 1987) compared the use of pentosan with placebo.
9.5.1. Prostatitis symptoms
This outcome was reported by Nickel 2005, with 100 participants. Those in the pentosan group probably had similar prostatitis symptoms when compared to the placebo group at 16‐week follow‐up (NIH‐CPSI score MD −2.70, 95% CI −5.61 to 0.21). The quality of evidence is moderate, due to high risk of bias.
9.5.2. Adverse events
In Nickel 2005 adverse events were reported by 36/51 participants receiving pentosan and 34/49 receiving placebo. The most frequent adverse events were diarrhoea, nausea and headache. Six participants in the pentosan group had altered liver function tests, and one of them suffered from liver failure. In Wedren 1987 two participants in the pentosan group suffered from diarrhoea while none in the placebo group reported any adverse event. The quality of evidence is low, due to high risk of bias and imprecision (few events).
9.5.3. Sexual dysfunction, quality of life, anxiety and depression, or urinary symptoms
No other outcomes relevant to this review were reported in the included studies for this comparison.
9.6. Phosphodiesterase inhibitors
We included six studies with 536 randomized participants which compared the addition of phosphodiesterase inhibitors to medical therapy versus medical therapy alone (Abdalla 2018; Kong 2014;Lin 2007;Park 2012; Park 2017; Singh 2017).
9.6.1.Prostatitis symptoms
Based on two studies with 226 participants (Kong 2014; Lin 2007), phosphodiesterase inhibitors may reduce prostatitis symptoms at six‐ to eight‐week follow‐up (random‐effect meta‐analysis, MD −4.37, 95% CI −5.24 to −3.50; I2 = 82%). Singh 2017, with 68 participants, reported that the mean decrease in NIH‐CPSI scores at six weeks was 18 in the tadalafil group and 8.4 in the control group (P < 0.05). Park 2012, with 78 participants, reported that the mean decrease in NIH‐CPSI scores at four weeks was 2.7 in the tadalafil group and 1.2 in the control group (P < 0.05). Park 2017, with 86 participants, reported that the mean decrease in NIH‐CPSI scores at four weeks was 7.3 in the tadalafil group and 3.1 in the control group (P < 0.05). Abdalla 2018, with 108 participants, reported that NIH‐CPSI scores were lower at four‐week follow‐up (P < 0.001) in those who received tadalafil and antibiotics compared to those who only received antibiotics. The quality of evidence is low, due to high or unclear risks of bias in most domains, and inconsistency.
9.6.2. Adverse events
Lin 2007, with 138 participants, reported that there were no adverse events. Three studies (Kong 2014; Park 2012; Singh 2017) reported that those in the phosphodiesterase inhibitors group suffered from frequent erections, dyspepsia, back pain, blurred vision and headache (no information on the control group). Abdalla 2018 reported that one participant in the tadalafil group suffered from flushing. The quality of evidence is low, due to high or unclear risks of bias in most domains, and imprecision (few events).
9.6.3. Sexual dysfunction
Two studies with 226 participants provided sufficient information to pool the results in meta‐analysis (Kong 2014; Lin 2007). Participants who received phosphodiesterase inhibitors may have had less sexual dysfunction at six‐ to eight‐week follow‐up (measured by IIEF score, MD 6.80, 95% CI 5.05 to 8.55; I2 = 76%). Park 2012, with 78 participants, reported that those in the tadalafil group had less sexual dysfunction at four‐week follow‐up (mean increase in the IIEF score of 3.7) compared to those in the control group (mean increase in the IIEF score of 0.2, P < 0.05). Park 2017, with 86 participants, reported that those in the tadalafil group had less sexual dysfunction at six‐week follow‐up (mean increase in the IIEF score of 3.8) compared to those in the control group (mean increase in the IIEF score of 0.2, P < 0.05). Singh 2017, with 68 participants, reported that those in the tadalafil group had less sexual dysfunction at six‐week follow‐up (mean increase in the IIEF score of 6.4) compared to those in the control group (mean decrease in the IIEF score of −0.7, P < 0.05). Abdalla 2018, with 108 participants, reported less sexual dysfunction (higher IIEF scores) at four‐week follow‐up (P < 0.001) in those who received tadalafil and antibiotics compared to those who received antibiotics alone. The quality of evidence is low, due to high or unclear risks of bias in most domains, and imprecision (mean differences between scores crossed the MCID).
9.6.4. Quality of life
None of the studies reported QoL.
9.6.5. Depression and anxiety
None of the studies reported on depression and anxiety.
9.6.6. Urinary symptoms
Four studies with 320 participants reported this outcome. Kong 2014, with 88 participants, reported that those in the mirodenafil group had a greater decrease in urinary symptoms at six‐week follow‐up (measured by IPSS score, mean decrease of 4.3 points) compared to those in the control group (mean decrease of 1.1 points, P value < 0.05). Park 2012, with 78 participants, reported that those in the tadalafil group had a greater decrease in urinary symptoms at four‐week follow‐up (measured by IPSS score, mean decrease of 2.6 points) compared to those in the control group (mean decrease of 1 point, P value < 0.05). Park 2017, with 86 participants, reported that those in the tadalafil group had a greater decrease in urinary symptoms at six‐week follow‐up (measured by IPSS score, mean decrease of 4.2 points) compared to those in the control group (mean decrease of 1.1 points, P value < 0.05). Singh 2017, with 68 participants, reported that those in the tadalafil group had a greater decrease in urinary symptoms at six‐week follow‐up (measured by IPSS score, mean decrease of 8.8 points) compared to those in the control group (mean decrease of 3.4 points, P value < 0.05). The quality of evidence is low, due to high or unclear risk of bias in most domains, and imprecision (mean differences between scores crossed the MCID).
9.7. Pregabalin
Pontari 2010, with 324 participants, compared the use of pregabalin and placebo.
9.7.1. Prostatitis symptoms
Pregabalin causes little to no difference in prostatitis symptoms compared to placebo at six‐week follow‐up (measured by NIH‐CPSI score, MD −1.90, 95% CI −3.97 to 0.17). The number of participants who achieved a six‐point decrease in the score was similar in both groups (RR 1.32, 95% CI 0.99 to 1.76). The quality of evidence is high.
9.7.2. Adverse events
There were 191 adverse events, and the authors state that there was no difference between groups (P = 0.40), but more participants suffered from neurological symptoms, including headache, in the pregabalin group than in the placebo group (RR 1.70, 95% CI 1.15 to 2.51). The quality of evidence is low, due to imprecision.
9.7.3. Sexual dysfunction
Pregabalin causes little to no difference in sexual dysfunction compared to placebo (measured by the Sexual Health Inventory for Men, MD −0.80, 95% CI −2.69 to 1.09, P = 0.40). The quality of evidence is high.
9.7.4. Quality of life
Pregabalin causes little to no difference in quality of life compared to placebo (measured by the SF‐12 questionnaire; P = 0.34 for physical domain and 0.22 for mental domain). The quality of evidence is high.
9.7.5. Anxiety and depression
Pregabalin causes little to no difference in anxiety and depression compared to placebo (measured by the Hospital Anxiety and Depression Scale, P = 0.36). The quality of evidence is high.
9.7.6. Urinary symptoms
The study did not report this outcome.
9.8. Tanezumab
Nickel 2016, with 62 participants, compared the monoclonal antibody tanezumab with placebo.
9.8.1. Prostatitis symptoms
Participants receiving tanezumab had similar prostatitis symptoms to those who received placebo at six‐week follow‐up (NIH‐CPSI score MD 1.43, 95% CI −6.71 to 3.85). The quality of the evidence is low, due to high risks of bias and imprecision (the confidence interval crosses the threshold for the MCID).
9.8.2. Adverse events
Adverse events were reported in 19/30 participants receiving tanezumab and in 12/32 of those receiving placebo. The most frequent adverse events were paraesthesias, arthralgia, headache, pain in an extremity, and insomnia. The quality of evidence is low, due study limitations and imprecision.
9.8.3. Sexual dysfunction, quality of life, anxiety and depression, or urinary symptoms
No other outcomes relevant to this review were reported in this study.
Discussion
Summary of main results
We included 99 unique studies with 9119 men with chronic prostatitis/chronic pelvic pain syndrome (CP/CPPS), with the assessment of 16 types of pharmacological interventions. Most of our comparisons included short‐term follow‐up information. The median age of the participants was 38 years.
Main comparisons
We found low‐ to very low‐quality evidence that alpha blockers may reduce prostatitis symptoms based on a reduction in NIH‐CPSI scores of more than two (but less than eight) with an increased incidence of minor adverse events such as dizziness and hypotension Moderate‐ to low‐quality evidence indicates that 5‐alpha reductase inhibitors, antibiotics, anti‐inflammatories, and phytotherapy probably cause a small decrease in prostatitis symptoms and may not be associated with a greater incidence of adverse events. Intraprostatic BTA injection may cause a large reduction in prostatitis symptoms with procedure‐related adverse events (haematuria), but pelvic floor muscle BTA injection may not have the same effects (low‐quality evidence). Allopurinol may also be ineffective for the reduction of prostatitis symptoms (low‐quality evidence). We assessed a wide range of interventions involving traditional Chinese medicine; low‐quality evidence showed they may reduce prostatitis symptoms without an increased incidence in adverse events.
Other interventions
Moderate‐ to high‐quality evidence indicates that the following interventions may be ineffective for the reduction of prostatitis symptoms: anticholinergics, OM‐89, pentosan, and pregabalin. Low‐ to very low‐quality evidence indicates that antidepressants and tanezumab may be ineffective for the reduction of prostatitis symptoms. Low‐quality evidences indicates that mepartricin and phosphodiesterase inhibitors may reduce prostatitis symptoms, without an increased incidence in adverse events.
Overall completeness and applicability of evidence
Our review focused on men with CP/CPPS. Almost all the included studies used the consistent inclusion criteria defined by the NIH (Nyberg 1999). These diagnostic criteria are related to clinical practice, since these participants are usually tested for urological diseases that could mimic CP/CPPS. However, some of the impact of the NIH consensus on the diagnosis of CP/CPPS might have changed the classification of participants across time (Krieger 2002), so the results of older trials must be interpreted with caution with the current diagnostic criteria. We incorporated a sensitivity analysis based on this consideration.
We maintained open inclusion criteria for the included interventions. This decision was based on the poorly understood pathophysiological determinants for CP/CPPS (see Background). This led to the inclusion of a wide variety of pharmacological interventions, which could relate to clinical practice, considering that people with CP/CPPS usually try different treatment options before achieving some form of relief. There might be difficulties in the interpretation of some head‐to‐head comparisons, since we do not know the effectiveness of each separate intervention: for example, for the comparison of pollen extract (deprox®) versus bromelain we might not know if pollen extract and bromelain are superior to placebo in the first place in order to analyse their relative effectiveness.
Our review focused on critical patient‐important outcomes; however, most studies did not report them consistently, especially the incidence of adverse events. This is a common problem in clinical trials (Ioannidis 2001), and poses difficulties when estimating the net benefit of the interventions. Additionally, most of the included studies did not report the effects of their interventions on quality of life (QoL), sexual function and mental health, considering the important impact of CP/CPPS in these domains (Krsmanovic 2014). We acknowledge that the NIH‐CPSI score includes QoL and urinary symptom subscores that, alongside the pain subscore, contribute to a total score that has proved to be valid and reliable (Litwin 1999; McNaughton Collins 2001; Propert 2006; Turner 2003); however, these subscores have not been individually validated for these constructs. We acknowledge that the validated scores for QoL, urinary symptoms, sexual dysfunction, and anxiety and depression might not have been validated in the subpopulation of men with CP/CPPS, so their values should be interpreted cautiously, especially using the assessment of the minimal clinically important difference (MCID).
Some pharmacological interventions may have different impacts on the main outcomes for this conditions. For example: phosphodiesterase inhibitors may have a greater impact on sexual dysfunction than on prostatitis symptoms; analgesics alone or in combinations may be used more when pain exacerbations occur. For this purpose, the UPOINTS approach allows the clinician to screen the person's characteristics and needs to guide the selection of pharmacological and non‐pharmacological interventions (Magri 2010; Shoskes 2008b). When considering adverse events, we have listed those most commonly reported in clinical trials. We acknowledge that there might be a wide range of possible adverse events that clinical trials might not have captured, and that observational studies could provide more information on this topic (Singh 2012). Most adverse events were self‐limiting and with minor impact (e.g. gastrointestinal discomfort). In some cases the authors titrated the drugs to reduce the impact of early‐onset adverse events, such as postural hypotension for alpha blockers (Lepor 2007). Additionally, there might be other suggestions, as being cautious when standing up from bed, in order to avoid this adverse event (Figueroa 2010). Other adverse events that may not be transient (e.g. retrograde ejaculation) might be more challenging to treat, and a discussion with the patient may be warranted in order to elicit the importance of these outcomes, especially in relation to sexual activity and expectations (Lepor 2007). Unlike surgery‐induced retrograde ejaculation, this adverse event usually reverts to normal when alpha blockers are suspended.
Furthermore, most studies reported results at four‐ to 12‐week follow‐up, which might be insufficient considering that men with CP/CPPS generally have a long, fluctuating history of symptoms, usually for years (Clemens 2015).
We had planned to explore the effect of the interventions in subgroups of men with different degrees of disease severity and in subgroups of men with common comorbidities (Gasperi 2017), but the included studies provided insufficient data for this, so our analyses were limited.
This review supplements another Cochrane Review in the same area: Non‐pharmacological interventions for treating chronic prostatitis/chronic pelvic pain syndrome (Franco 2018). In that review we highlighted that acupuncture and extracorporeal shockwave therapy are probably beneficial for this condition. While we found no evidence for psychological support for this condition, psychotherapy (e.g. cognitive behavioural therapy) has been effective in the management of somatoform disorders (Van Dessel 2014).
Some of the included treatments for the main comparisons expressed in the 'Summary of findings' tables and in other sections of the review have not been part of routine care for CP/CPPS, especially: anticholinergics, mepartricin, OM‐89, phosphodiesterase inhibitors, pregabalin and tanezumab. In support of this, we used, as an example, the recommendations by the European Association of Urology (available at uroweb.org/guideline/chronic‐pelvic‐pain/ (last accessed July 2018)). As the guideline authors stated, careful consideration should be given when considering the applicability of these interventions in daily practice. For example, botulinum toxin A may not be easily accessible or acceptable for most men, since it involves an intraprostatic injection. As the GRADE Evidence to Decision Framework states, a careful evaluation of the patient's values and preferences, resource use and equity issues and the acceptability and feasibility of the interventions is warranted when drafting guidelines recommendations (Alonso‐Coello 2016); something that is beyond the scope of this review.
Quality of the evidence
The main limitations of the body of evidence were the following.
-
Study limitations: most studies had problems when masking the interventions from study personnel and participants. This is particularly important for this review, considering that all the predefined outcomes were subjective and participant‐reported. Many studies had a considerable amount of missing outcome data and there was little explanation as to how this was handled (e.g. using methods such as 'last observation carried forward'). Additionally, most studies poorly reported random sequence generation and allocation concealment, and most had no published protocol or analysis plan to assess the risk of selective reporting.
-
Inconsistency: we found considerable heterogeneity in some of the main comparisons; we were unable to explain this using our predefined sensitivity and subgroup analyses. We added a subgroup analysis based on one of our predefined conditions, but none of these analyses yielded significant results.
-
Imprecision: we estimated an optimal information size of 74 for the primary outcome 'prostatitis symptoms', and almost 50% of the studies had a smaller sample size; most studies therefore suffered from imprecision. Nevertheless, in some cases meta‐analysis of some of the included studies increased the number of participants for each comparison, overcoming this limitation. This was more difficult to do for the outcome 'adverse events', in which the small number of events (in some cases there were none) resulted in considerable imprecision.
-
Publication bias: we assessed the risk of publication bias using funnel plots in few outcomes, due to the paucity of trials, and we did not find evidence of any suggestive asymmetry.
Potential biases in the review process
We strictly followed our published protocol to reduce the risk of bias in the conduct of this review.
We performed a comprehensive search in multiple databases, trial registries and other sources to reduce the risk of meta‐bias in our review. We did not restrict the searches or inclusion of studies on the basis of language of publication. Thirty‐eight studies were written in a language other than English. We incorporated three additional authors (JHJ, SI, YX) who helped in the process of developing and writing this review by reading and processing the articles in Korean, Russian and Chinese. However, the assessment of the individual studies was done by a single author and this could have introduced errors in the process of developing the judgements for risk of bias and data extraction. We tried to minimise these errors by using computer‐assisted translation and thorough discussion of the extracted data with our co‐authors.
We were unable to retrieve some of the studies on traditional Chinese medicine (TCM) published in some Chinese journals (available at the China National Knowledge Infrastructure database) that were included in other reviews that searched Chinese databases (see Agreements and disagreements with other studies or reviews). Should we find the reports of these studies, we will evaluate them for inclusion in updates of this review, since we have no clear information about their eligibility. We note, however, that the reported results of these studies in the corresponding reviews are consistent with our findings.
We contacted study authors on multiple occasions with a variable rate of response. However, we acknowledge that many of the ratings of 'unclear' risk of bias were due to limitations in the report of the studies, rather than a true risk of bias in the conduct of these trials. We also contacted authors in order to obtain missing outcome data (e.g. standard deviation, number of participants, P values, etc.) with a poor response rate in most cases. We nevertheless report all available outcome data under "Studies not included in meta‐analysis or 'Summary of findings' table".
We deleted the 'Clinical Phenotyping' item as an intervention in our review, as suggested by a peer reviewer. We acknowledge that this strategy might not constitute in itself an intervention. This change has not affected the results of this review, since we found no trials on this subject. We also modified the presentation of some of the methods in this review (assessment of outcomes and GRADE methods), but this did not affect the results of the review either (see Differences between protocol and review).
We intended to explain the reasons for statistical heterogeneity across studies for many comparisons, but were unable to do so using our predefined and post hoc subgroup analyses. This led to the downgrading of our confidence in the evidence due to inconsistency, according to the GRADE criteria. We acknowledge that there is wide variability in the underlying causes and clinical manifestations of men suffering from this condition across studies, so we believe that there might be other variables that could explain this inconsistency. Given that the underlying cause of CP/CPPS remains unknown and may encompass different pathogenic pathways (Appiya 2019), unless there are clear distinctions of these pathways and different subtypes of CP/CPPS with common aetiologic and prognostic factors, we might expect that these inconsistencies across study populations of the different trials will persist.
Agreements and disagreements with other studies or reviews
We found several systematic reviews addressing interventions for CP/CPPS. These reviews had several methodological limitations: lack of a protocol stating the review methods, insufficiently comprehensive searches, inadequate language restrictions and no integration of the quality of the evidence with the results, for example, by using GRADE methods.
Cochrane Reviews
In a previous Cochrane Review on pregabalin for CP/CPPS (Aboumarzouk 2012) the authors included the same trial (Pontari 2010) as ours and reached similar conclusions, but we considered that the included study had low risk of bias, while the previous review considered it to be at high risk of bias. Our judgements are justified in the Characteristics of included studies section. Three systematic reviews (two of them Cochrane Reviews) included both pharmacological and non‐pharmacological interventions (McNaughton 2000; McNaughton Collins 1999; McNaughton 2002). We included some of the trials covered in these reviews. The findings on the effectiveness and the limitations of the quality of evidence were similar, but most of the included studies were from before 1999, when the Research Consensus defined the latest criteria for this condition (Nyberg 1999). For this reason, we performed a sensitivity analysis analysing this effect, as suggested by a peer reviewer of our previous review (Franco 2018).
Other reviews
In a comprehensive review, Anothaisintawee 2011 evaluated the effects of alpha blockers, antibiotics, anti‐inflammatories, finasteride, phytotherapy, pentosan, pregabalin and combined therapy and included the same trials as our review with similar results; however, this review stated that "the magnitude of apparent benefit with α‐blockers may be distorted by publication bias" which we did not find in our assessment.
Cai 2017 focused on the effects of pollen extract and included animal studies, non‐randomised studies and some of the clinical trials included in this review, with the same results. Two systematic reviews (Cohen 2012; Yang 2008) included the trials in this review but were underpowered for some comparisons, such as those including antibiotics and anti‐inflammatories. Yang 2008 included some trials only available at the China National Knowledge Infrastructure (CNKI).
A systematic review of TCM for chronic prostatitis (Chen 2006) included nine randomised trials from the CNKI database, none of which we included in this review. They found that there was low‐quality evidence that TCM was equivalent or superior to western therapies, but the meta‐analysis pooled randomised and non‐randomised studies. It is not clear if they included participants with bacterial prostatitis.
Erickson 2008 (and its update Le 2011) included some of the studies for pharmacological interventions for CP/CPPS. This review stated that 5‐alpha reductase inhibitors, allopurinol, alpha blockers, mepartricin, NSAIDs, pentosan, and quercetin may have little or no beneficial effect for this condition, but with great uncertainties because of the low quality of the body of evidence. While most findings in that review are similar to ours, the authors focused their analysis of alpha blockers on the largest study with low risk of bias. This agrees with our sensitivity analysis in which we found alpha blockers to be ineffective. Two other reviews (Lee 2007; Yang 2006) assessed the effect of alpha blockers, but their assessments of study quality were limited.
A systematic review with a network meta‐analysis (Qin 2016) assessed the effects of acupuncture, alpha blockers, antibiotics and combination therapy, including the same trials as this review with similar findings on effectiveness. The surface under the cumulative ranking (SUCRA) plot revealed interesting findings comparing non‐pharmacological therapies and pharmacological therapies, favouring acupuncture and electroacupuncture. Another review using network meta‐analysis (Thakkinstian 2012) also had similar findings but the authors reflected that "results are discrepant between the analyses of symptom scores and treatment responsiveness". We believe that this relates to the fact that difference symptom scores require smaller sample sizes than measurements of treatment effects for dichotomous outcomes. This is why most analyses for 'responders' were downgraded due to imprecision.
Magistro 2016 included similar trials but with a narrower scope, and the authors stated "Our current understanding of the pathophysiology underlying CP/CPPS resulting in this highly variable syndrome does not speak in favour of a monotherapy for management".

Study flow diagram.
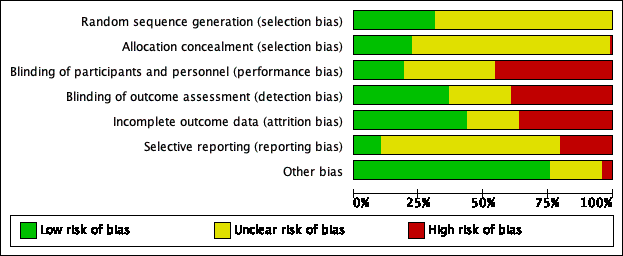
Risk of bias graph: review authors' judgements about each risk of bias item presented as percentages across all included studies.
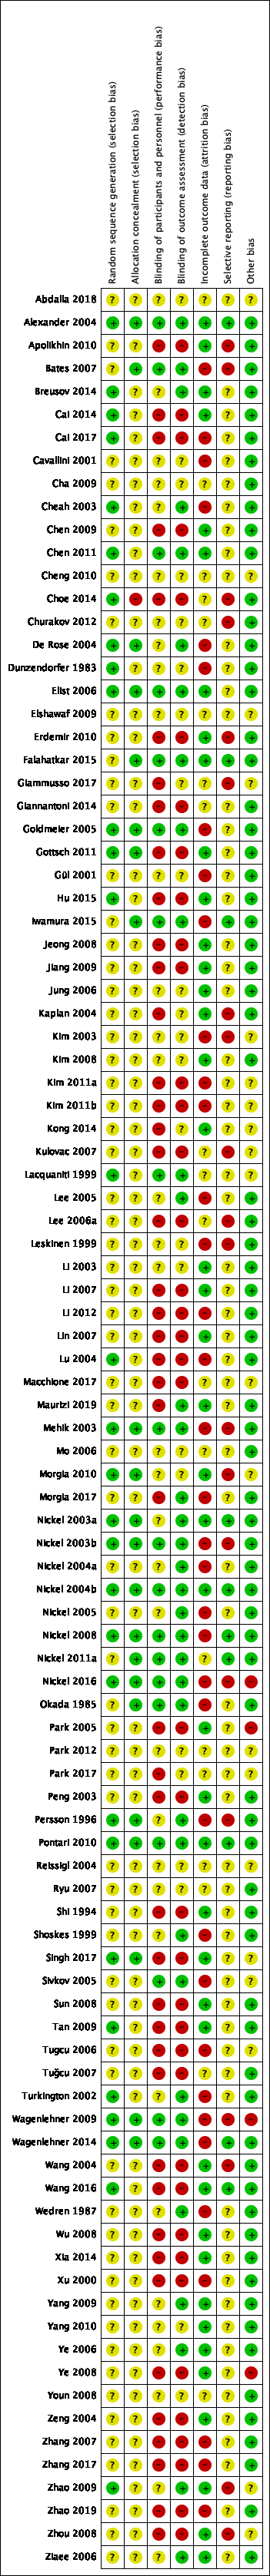
Risk of bias summary: review authors' judgements about each risk of bias item for each included study.
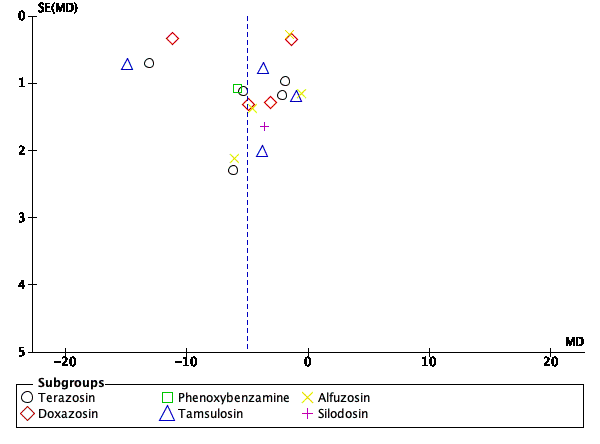
Funnel plot of comparison: 1 Alpha‐blockers versus placebo, outcome: 1.1 Prostatitis symptoms: short term.

Funnel plot of comparison: 1 Alpha‐blockers versus placebo, outcome: 1.8 Adverse events.
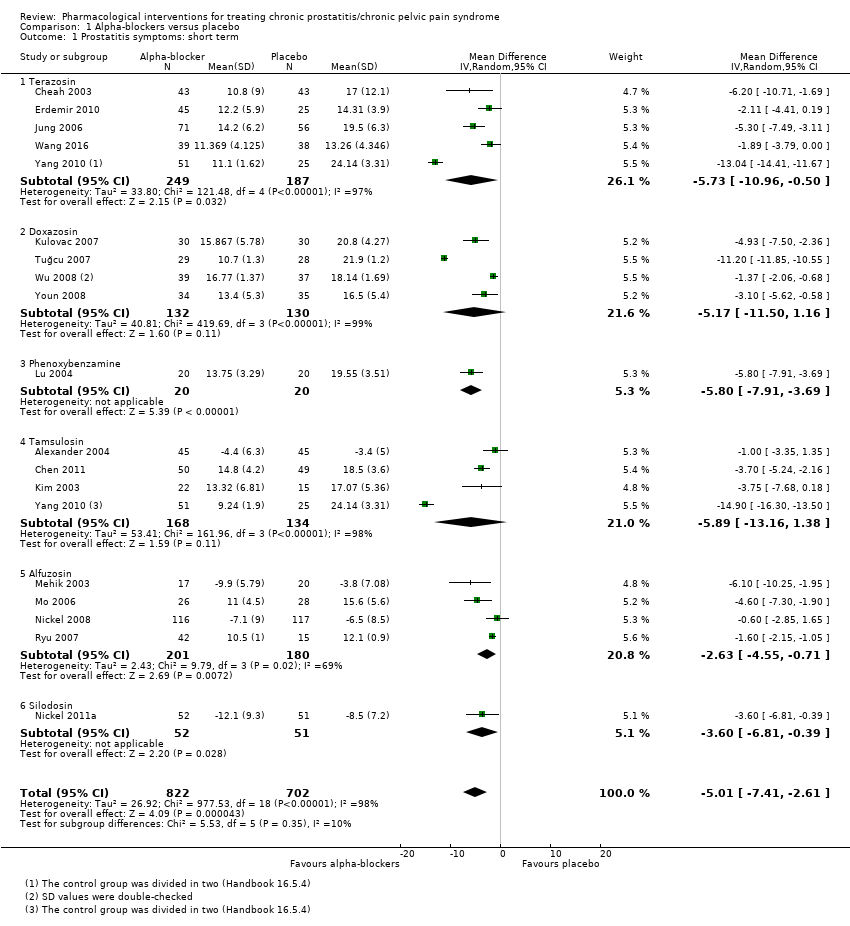
Comparison 1 Alpha‐blockers versus placebo, Outcome 1 Prostatitis symptoms: short term.

Comparison 1 Alpha‐blockers versus placebo, Outcome 2 Prostatitis symptoms: pain.

Comparison 1 Alpha‐blockers versus placebo, Outcome 3 Prostatitis symptoms: urinary.

Comparison 1 Alpha‐blockers versus placebo, Outcome 4 Prostatitis symptoms: quality of life.
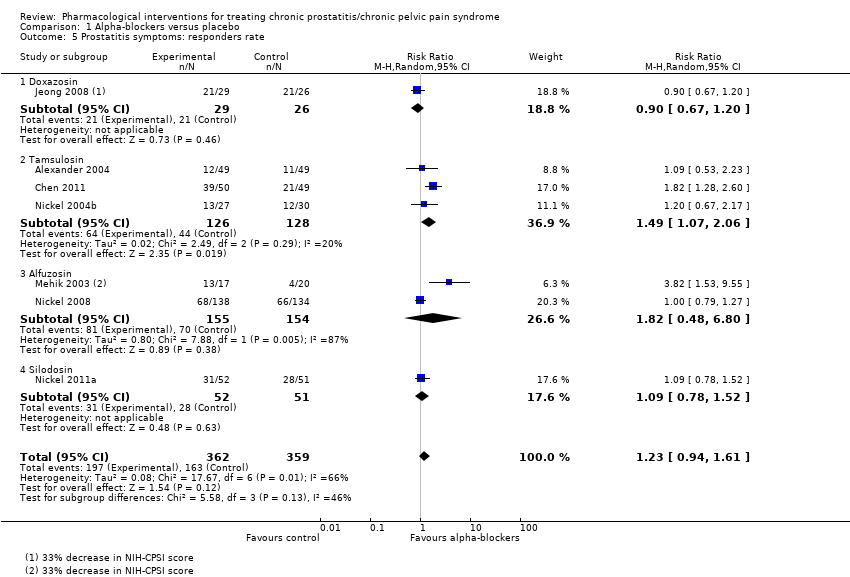
Comparison 1 Alpha‐blockers versus placebo, Outcome 5 Prostatitis symptoms: responders rate.
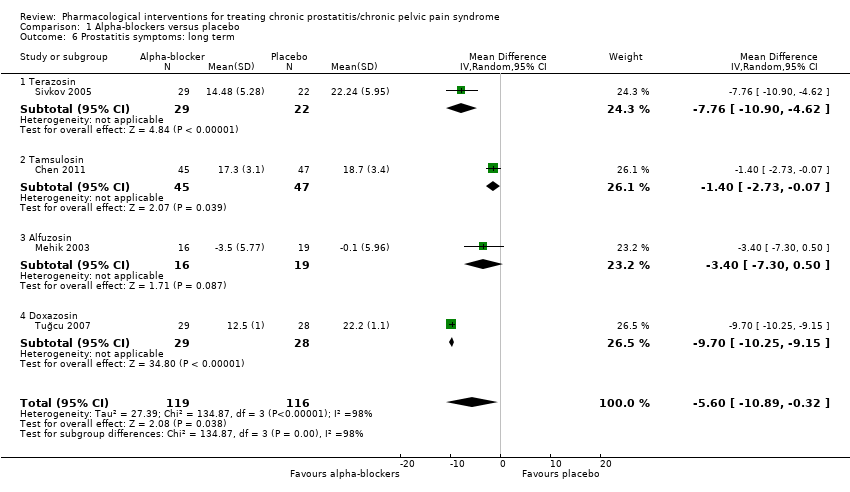
Comparison 1 Alpha‐blockers versus placebo, Outcome 6 Prostatitis symptoms: long term.
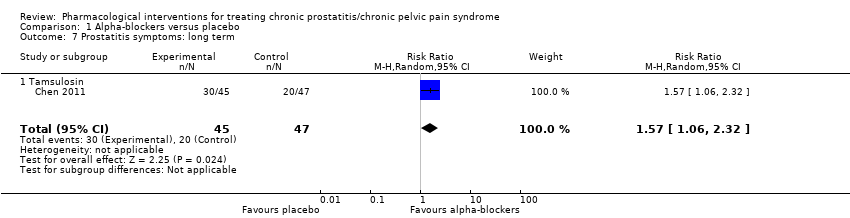
Comparison 1 Alpha‐blockers versus placebo, Outcome 7 Prostatitis symptoms: long term.

Comparison 1 Alpha‐blockers versus placebo, Outcome 8 Adverse events.

Comparison 1 Alpha‐blockers versus placebo, Outcome 9 Sexual dysfunction.
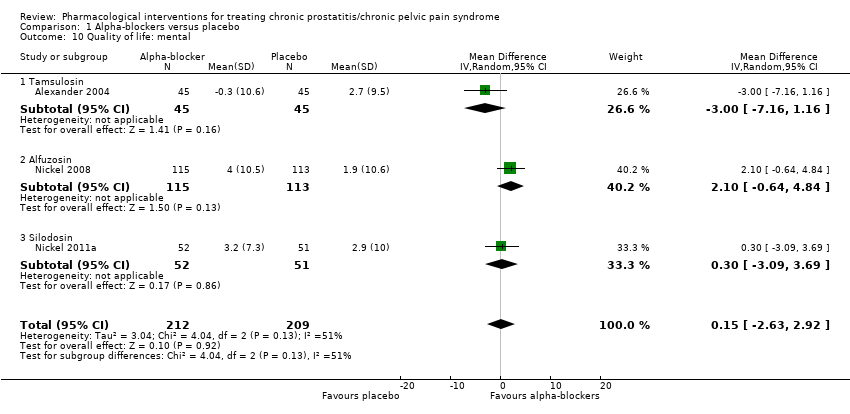
Comparison 1 Alpha‐blockers versus placebo, Outcome 10 Quality of life: mental.

Comparison 1 Alpha‐blockers versus placebo, Outcome 11 Quality of life: physical.
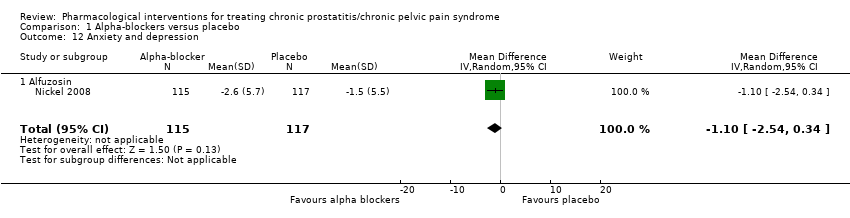
Comparison 1 Alpha‐blockers versus placebo, Outcome 12 Anxiety and depression.
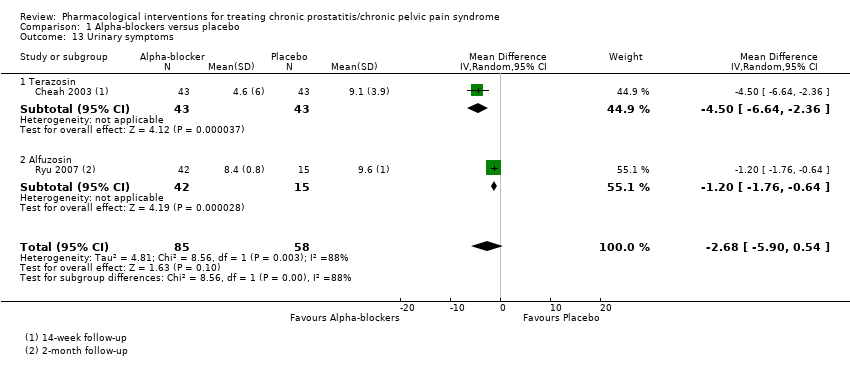
Comparison 1 Alpha‐blockers versus placebo, Outcome 13 Urinary symptoms.

Comparison 1 Alpha‐blockers versus placebo, Outcome 14 Prostatitis symptoms: responders rate (sensitivity analysis according to risk of bias).

Comparison 1 Alpha‐blockers versus placebo, Outcome 15 Adverse events (sensitivity analysis according to risk of bias).

Comparison 1 Alpha‐blockers versus placebo, Outcome 16 Prostatitis symptoms: short term (subgroup analysis by co‐interventions).
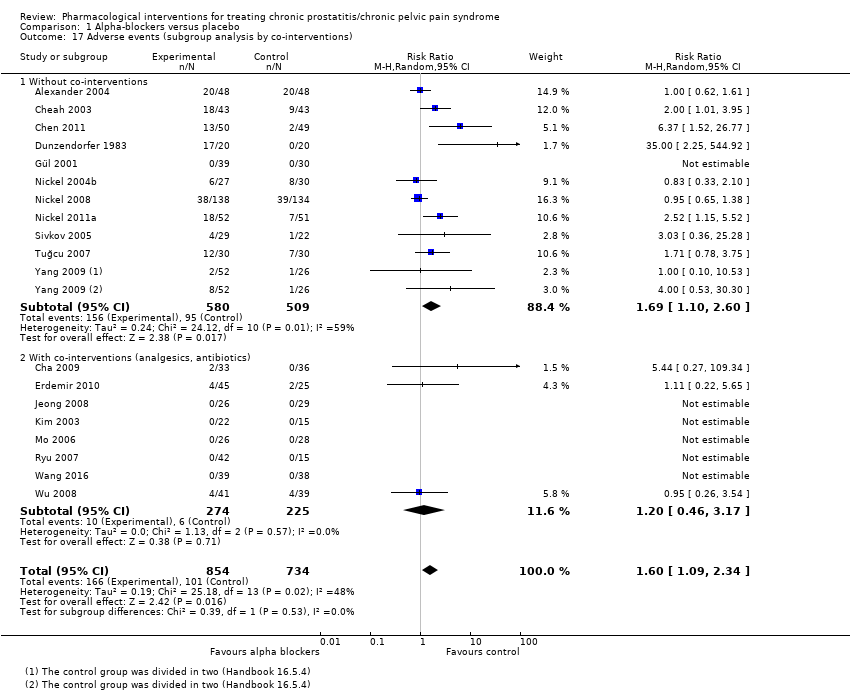
Comparison 1 Alpha‐blockers versus placebo, Outcome 17 Adverse events (subgroup analysis by co‐interventions).
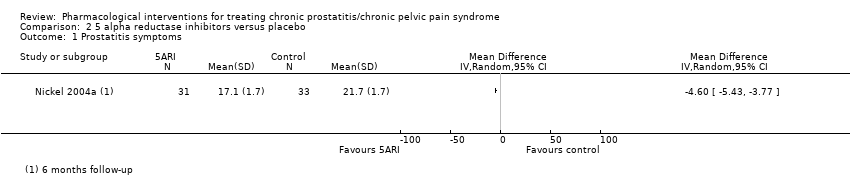
Comparison 2 5 alpha reductase inhibitors versus placebo, Outcome 1 Prostatitis symptoms.
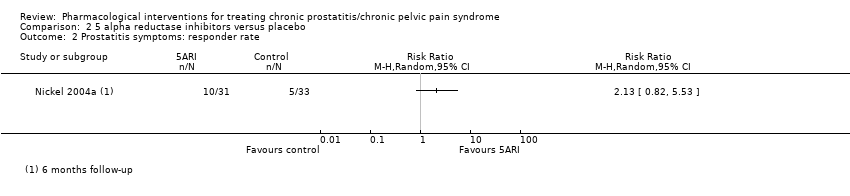
Comparison 2 5 alpha reductase inhibitors versus placebo, Outcome 2 Prostatitis symptoms: responder rate.

Comparison 2 5 alpha reductase inhibitors versus placebo, Outcome 3 Adverse events.

Comparison 3 Antibiotic therapy versus placebo, Outcome 1 Prostatitis symptoms.

Comparison 3 Antibiotic therapy versus placebo, Outcome 2 Prostatitis symptoms: pain.
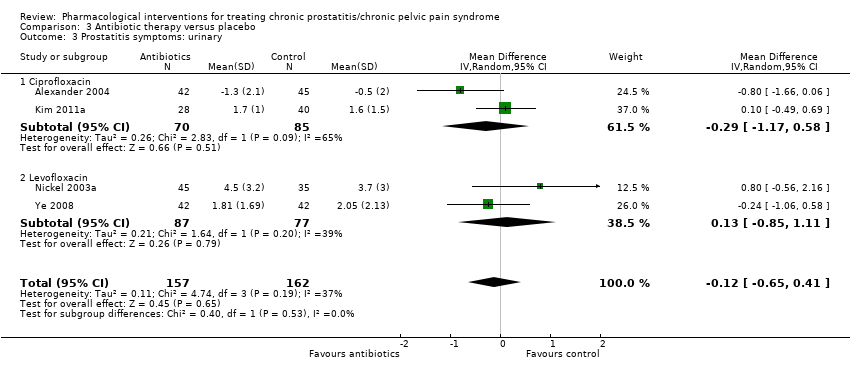
Comparison 3 Antibiotic therapy versus placebo, Outcome 3 Prostatitis symptoms: urinary.

Comparison 3 Antibiotic therapy versus placebo, Outcome 4 Prostatitis symptoms: quality of life.
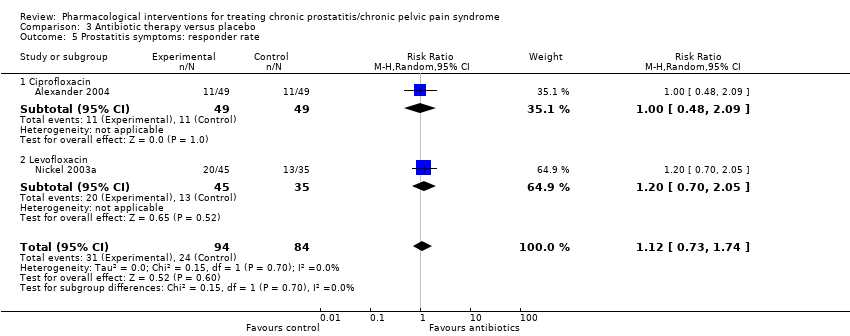
Comparison 3 Antibiotic therapy versus placebo, Outcome 5 Prostatitis symptoms: responder rate.

Comparison 3 Antibiotic therapy versus placebo, Outcome 6 Adverse events.
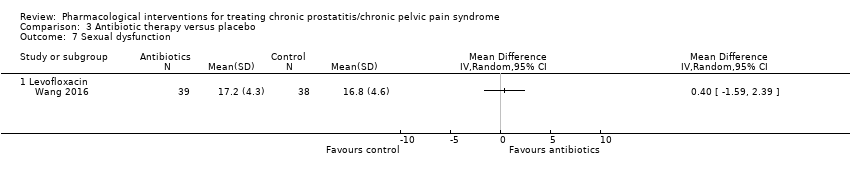
Comparison 3 Antibiotic therapy versus placebo, Outcome 7 Sexual dysfunction.
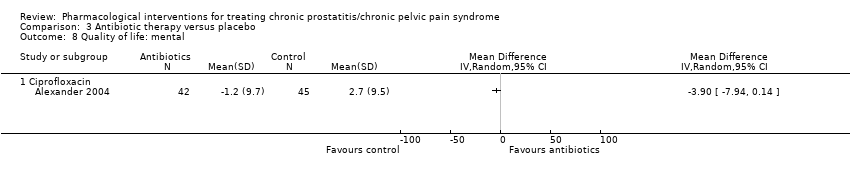
Comparison 3 Antibiotic therapy versus placebo, Outcome 8 Quality of life: mental.

Comparison 3 Antibiotic therapy versus placebo, Outcome 9 Quality of life: physical.
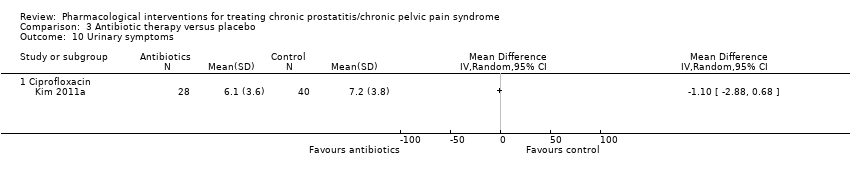
Comparison 3 Antibiotic therapy versus placebo, Outcome 10 Urinary symptoms.

Comparison 3 Antibiotic therapy versus placebo, Outcome 11 Prostatitis symptoms: subgroup analysis (age).

Comparison 3 Antibiotic therapy versus placebo, Outcome 12 Adverse events: subgroup analysis (age).
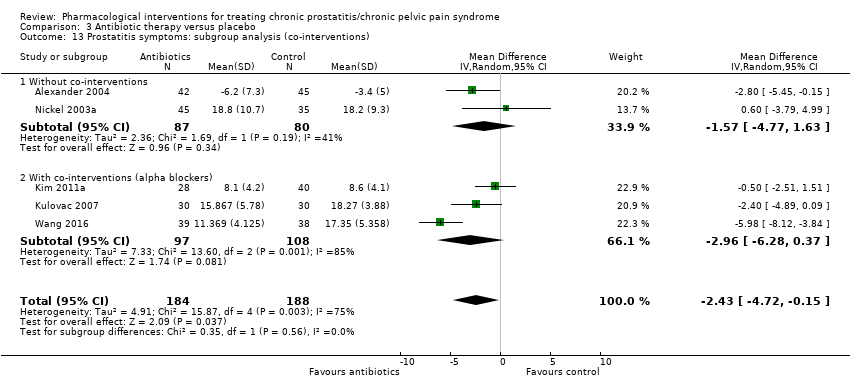
Comparison 3 Antibiotic therapy versus placebo, Outcome 13 Prostatitis symptoms: subgroup analysis (co‐interventions).
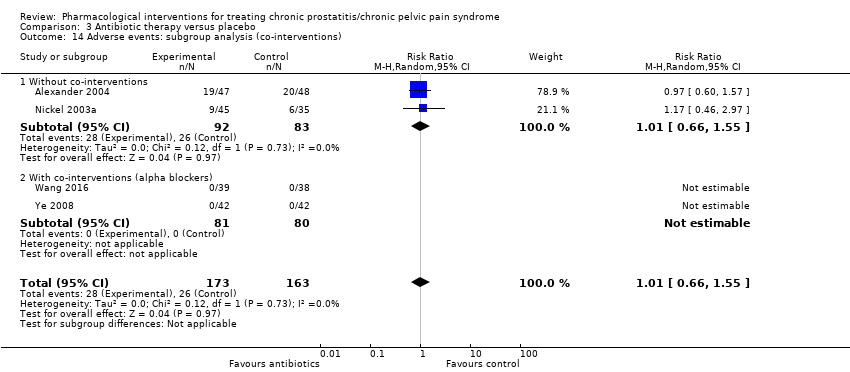
Comparison 3 Antibiotic therapy versus placebo, Outcome 14 Adverse events: subgroup analysis (co‐interventions).

Comparison 4 Antiinflammatories versus placebo, Outcome 1 Prostatitis symptoms.

Comparison 4 Antiinflammatories versus placebo, Outcome 2 Prostatitis symptoms: pain.
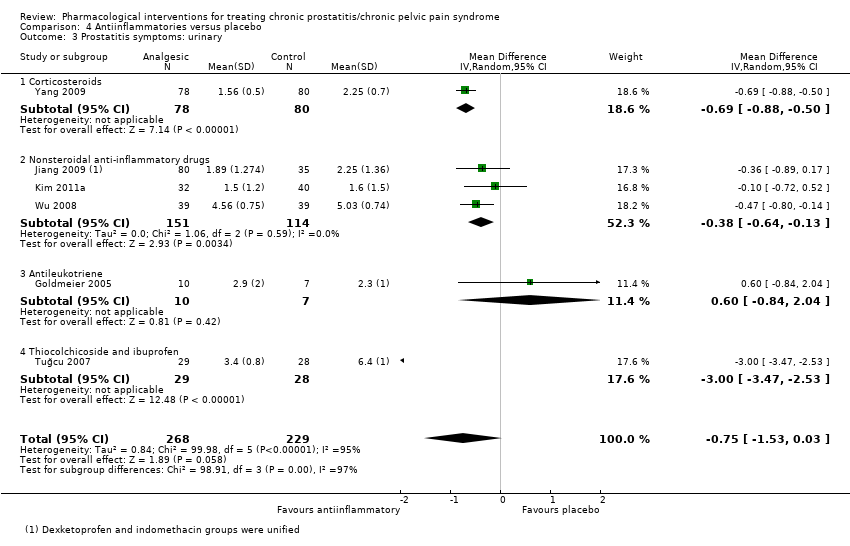
Comparison 4 Antiinflammatories versus placebo, Outcome 3 Prostatitis symptoms: urinary.

Comparison 4 Antiinflammatories versus placebo, Outcome 4 Prostatitis symptoms: quality of life.

Comparison 4 Antiinflammatories versus placebo, Outcome 5 Prostatitis symptoms: responder rate.
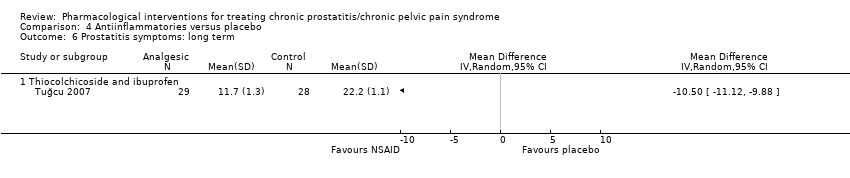
Comparison 4 Antiinflammatories versus placebo, Outcome 6 Prostatitis symptoms: long term.

Comparison 4 Antiinflammatories versus placebo, Outcome 7 Adverse events.
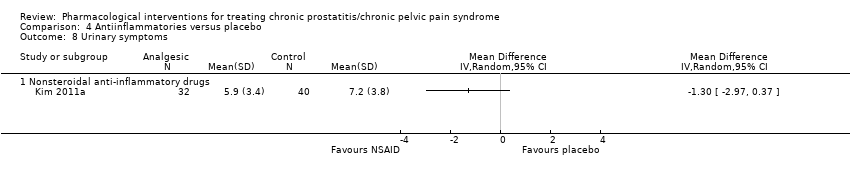
Comparison 4 Antiinflammatories versus placebo, Outcome 8 Urinary symptoms.
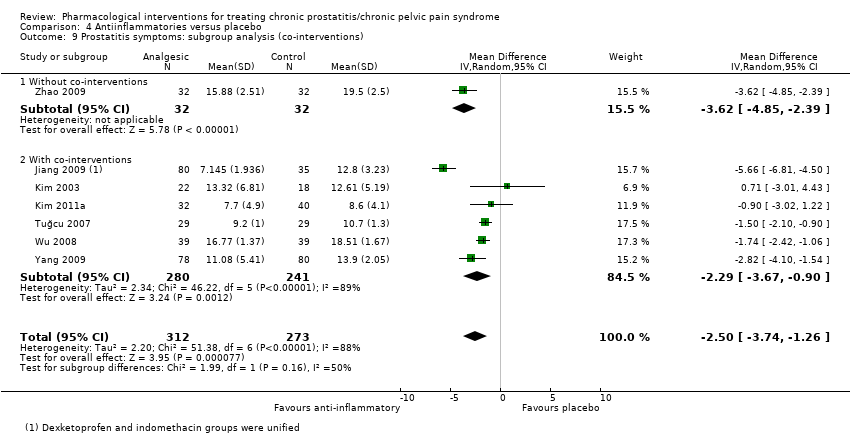
Comparison 4 Antiinflammatories versus placebo, Outcome 9 Prostatitis symptoms: subgroup analysis (co‐interventions).
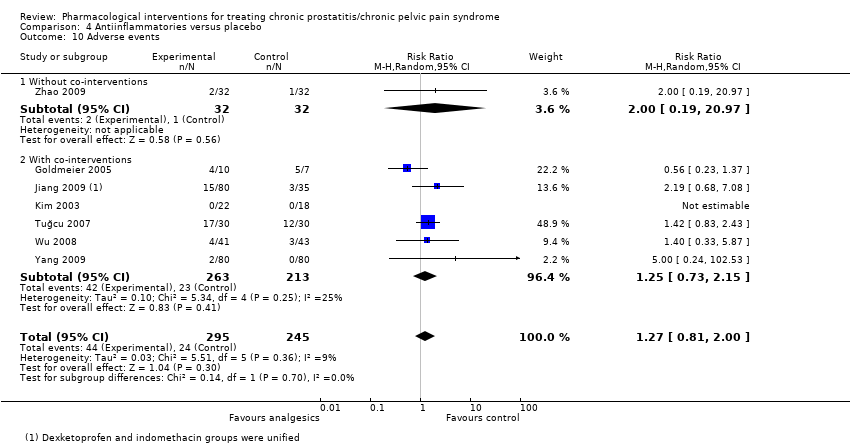
Comparison 4 Antiinflammatories versus placebo, Outcome 10 Adverse events.
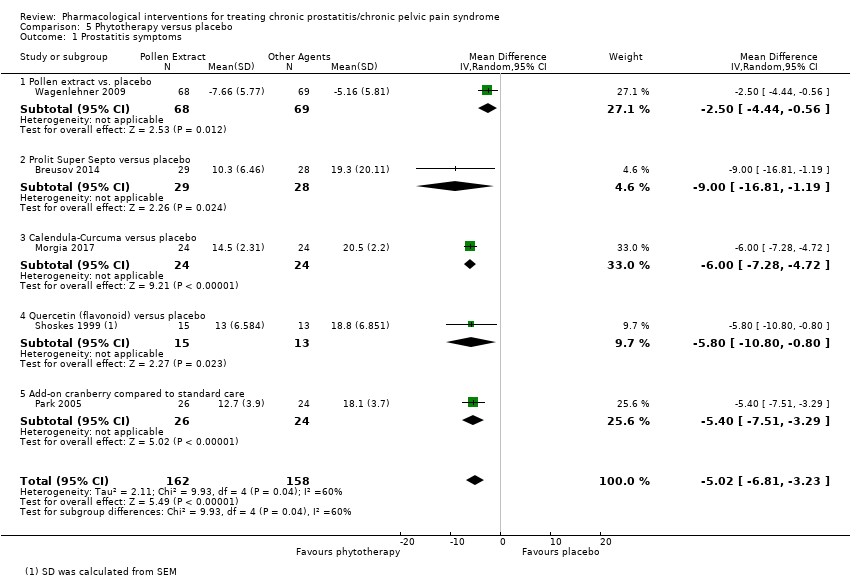
Comparison 5 Phytotherapy versus placebo, Outcome 1 Prostatitis symptoms.
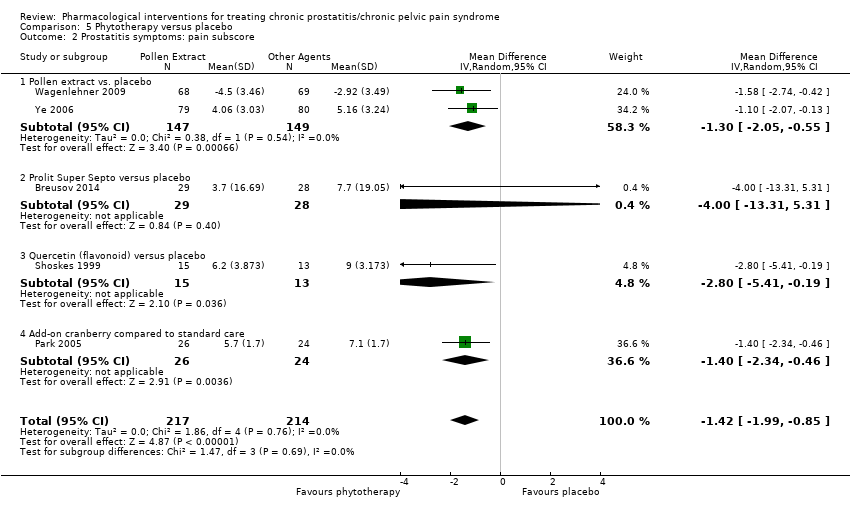
Comparison 5 Phytotherapy versus placebo, Outcome 2 Prostatitis symptoms: pain subscore.
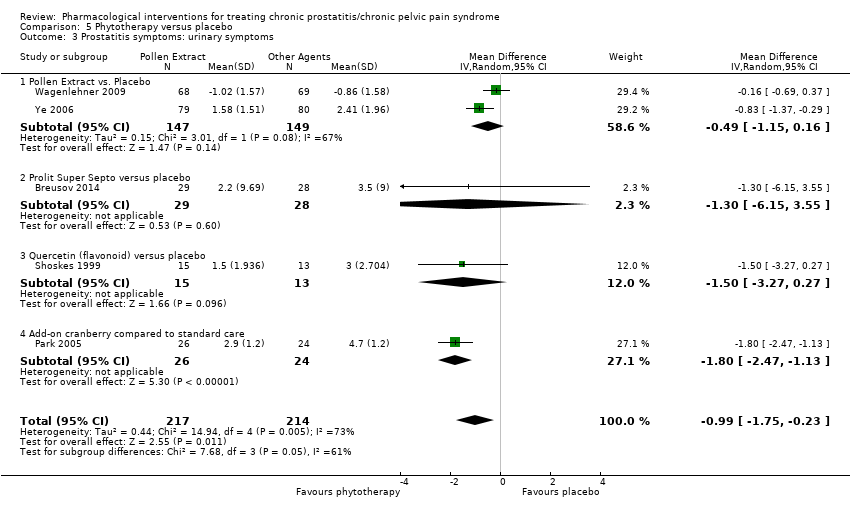
Comparison 5 Phytotherapy versus placebo, Outcome 3 Prostatitis symptoms: urinary symptoms.

Comparison 5 Phytotherapy versus placebo, Outcome 4 Prostatitis symptoms: quality of life.
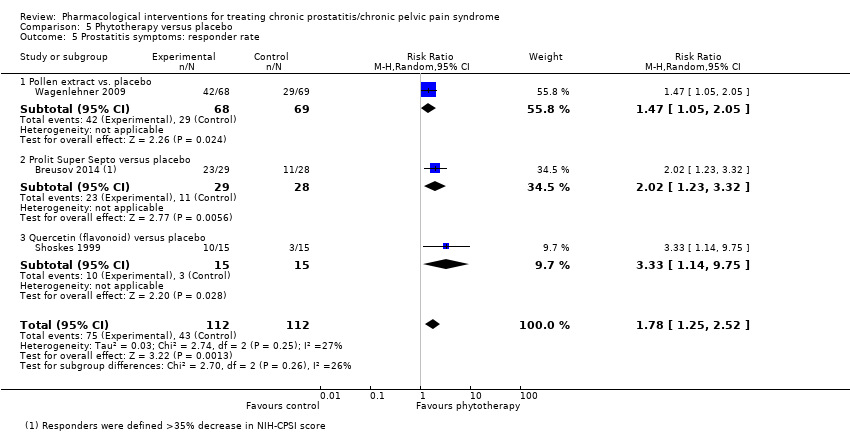
Comparison 5 Phytotherapy versus placebo, Outcome 5 Prostatitis symptoms: responder rate.
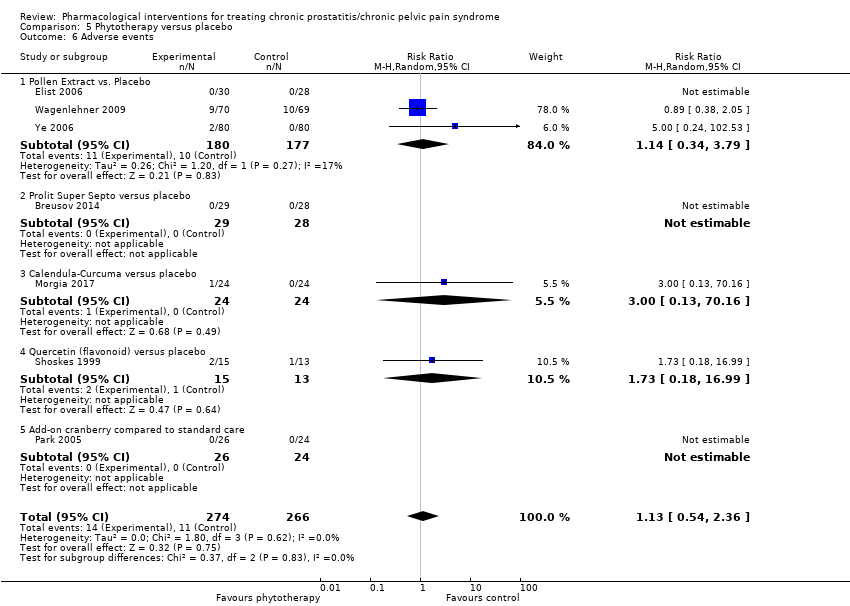
Comparison 5 Phytotherapy versus placebo, Outcome 6 Adverse events.
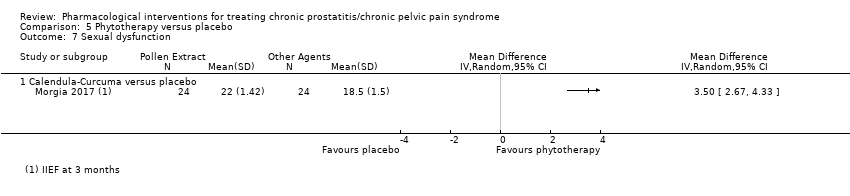
Comparison 5 Phytotherapy versus placebo, Outcome 7 Sexual dysfunction.
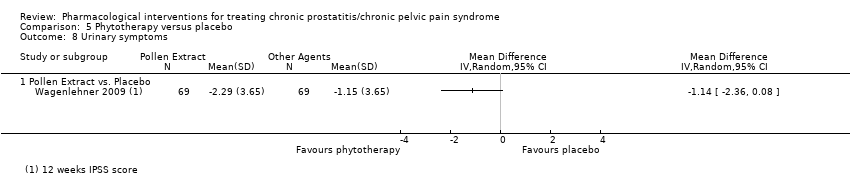
Comparison 5 Phytotherapy versus placebo, Outcome 8 Urinary symptoms.
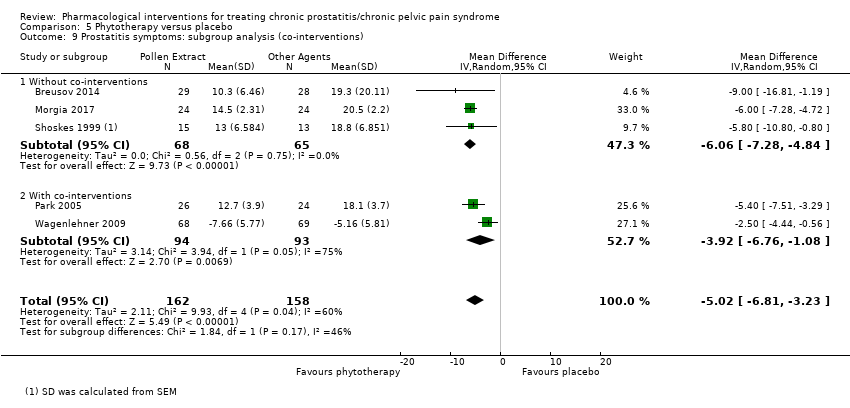
Comparison 5 Phytotherapy versus placebo, Outcome 9 Prostatitis symptoms: subgroup analysis (co‐interventions).

Comparison 5 Phytotherapy versus placebo, Outcome 10 Adverse events: subgroup analysis (co‐interventions).

Comparison 6 Botulinum toxin A versus placebo, Outcome 1 Prostatitis symptoms.
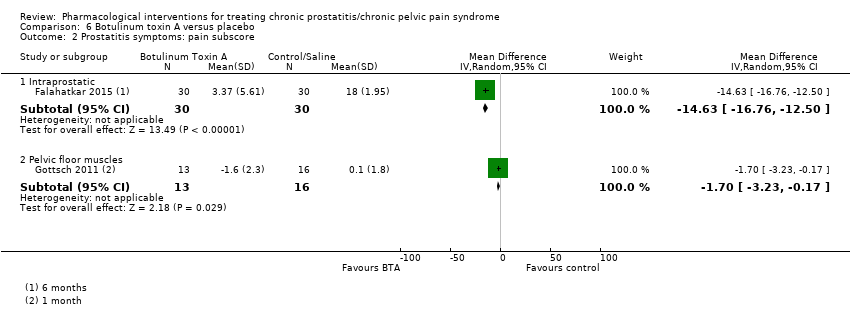
Comparison 6 Botulinum toxin A versus placebo, Outcome 2 Prostatitis symptoms: pain subscore.
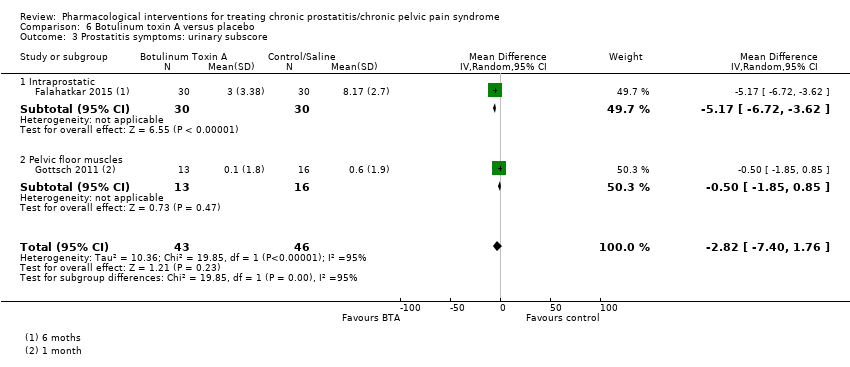
Comparison 6 Botulinum toxin A versus placebo, Outcome 3 Prostatitis symptoms: urinary subscore.

Comparison 6 Botulinum toxin A versus placebo, Outcome 4 Prostatitis symptoms: quality of life.

Comparison 6 Botulinum toxin A versus placebo, Outcome 5 Adverse events.
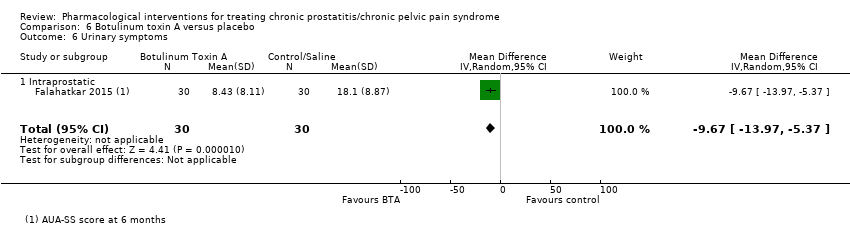
Comparison 6 Botulinum toxin A versus placebo, Outcome 6 Urinary symptoms.
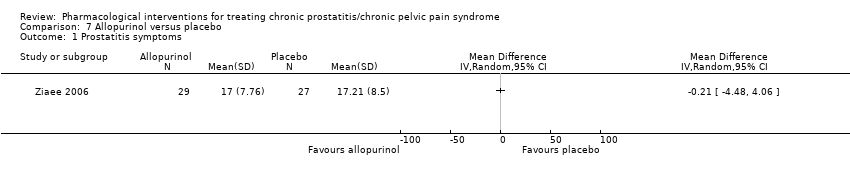
Comparison 7 Allopurinol versus placebo, Outcome 1 Prostatitis symptoms.
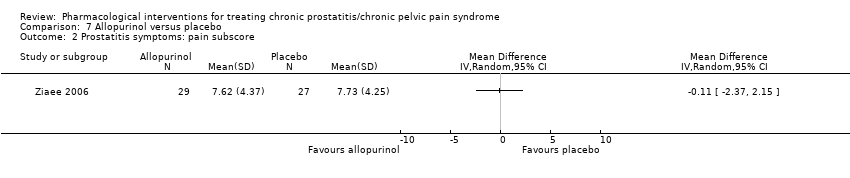
Comparison 7 Allopurinol versus placebo, Outcome 2 Prostatitis symptoms: pain subscore.

Comparison 7 Allopurinol versus placebo, Outcome 3 Prostatitis symptoms: urinary subscore.
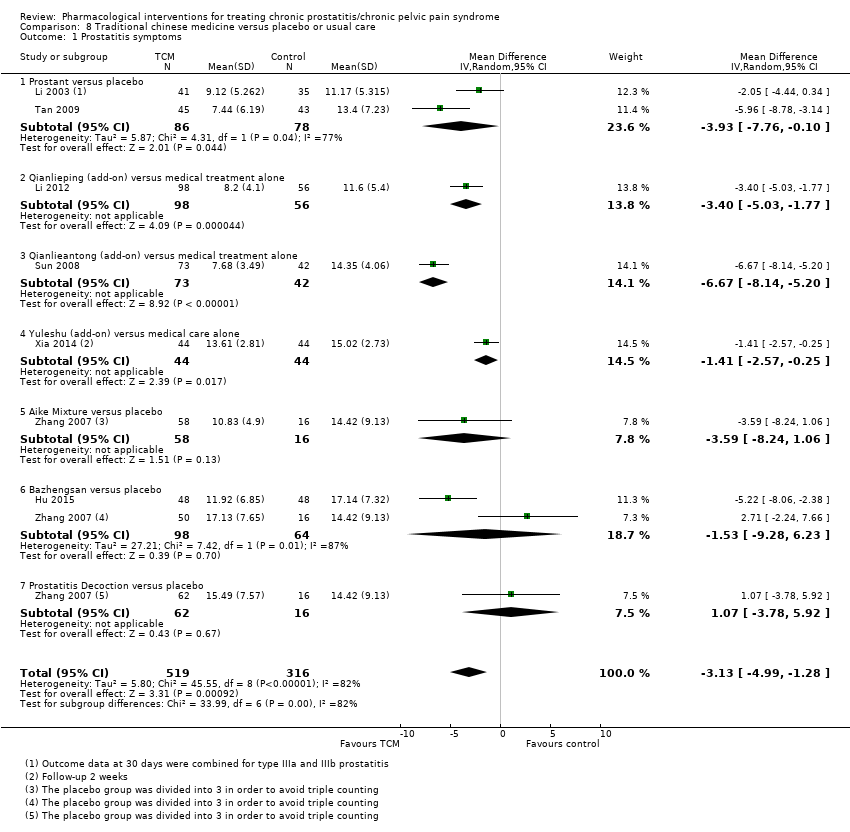
Comparison 8 Traditional chinese medicine versus placebo or usual care, Outcome 1 Prostatitis symptoms.

Comparison 8 Traditional chinese medicine versus placebo or usual care, Outcome 2 Prostatitis symptoms: pain subscore.

Comparison 8 Traditional chinese medicine versus placebo or usual care, Outcome 3 Prostatitis symptoms: urinary subscore.
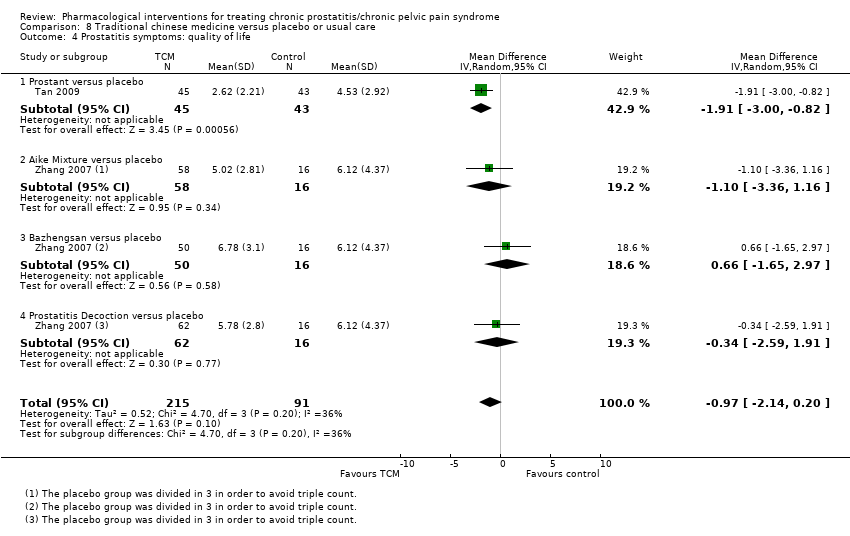
Comparison 8 Traditional chinese medicine versus placebo or usual care, Outcome 4 Prostatitis symptoms: quality of life.
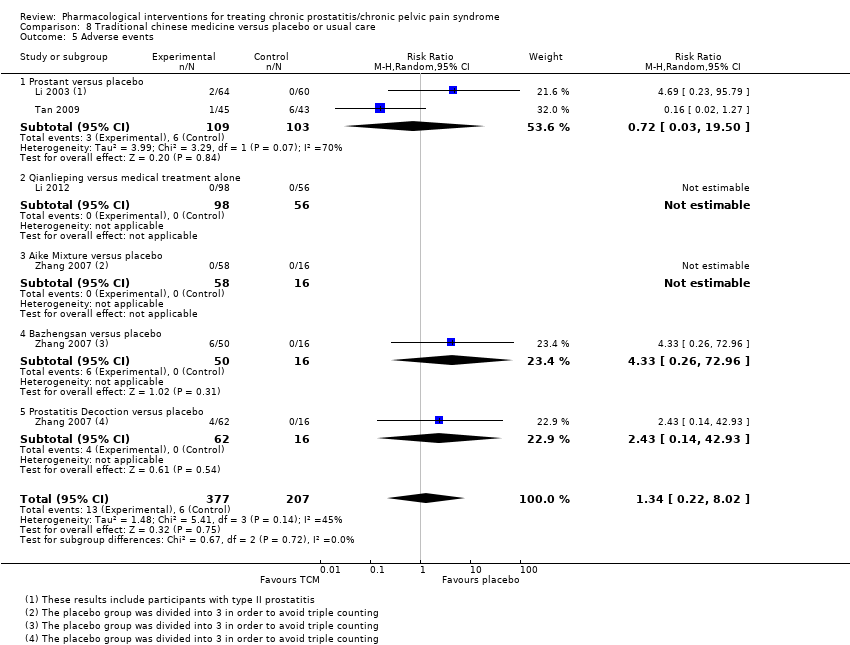
Comparison 8 Traditional chinese medicine versus placebo or usual care, Outcome 5 Adverse events.
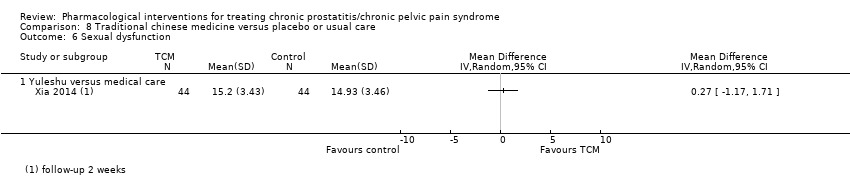
Comparison 8 Traditional chinese medicine versus placebo or usual care, Outcome 6 Sexual dysfunction.

Comparison 8 Traditional chinese medicine versus placebo or usual care, Outcome 7 Anxiety and depression: anxiety.
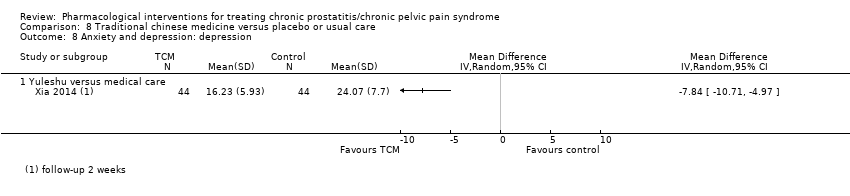
Comparison 8 Traditional chinese medicine versus placebo or usual care, Outcome 8 Anxiety and depression: depression.
| Alpha blockers compared to placebo for chronic prostatitis/chronic pelvic pain syndrome | |||||
| Patient or population: men with chronic prostatitis/chronic pelvic pain syndrome Some comparisons included alpha blockers as add‐on therapy to medical therapy (e.g. antibiotics) versus medical therapy alone. | |||||
| Outcomes | № of participants | Quality of the evidence | Relative effect | Anticipated absolute effects* (95% CI) | |
| Risk with placebo | Risk difference with alpha‐blockers | ||||
| Prostatitis symptoms A decrease of 25% or 6 points is considered an important improvement | 1524 | ⊕⊝⊝⊝ | ‐ | The mean prostatitis symptoms ranged from 12.1 to 24.14 | MD 5.01 lower |
| Prostatitis symptoms | 253 (4 RCTs) | ⊕⊝⊝⊝ | ‐ | The mean prostatitis symptoms ranged from 18.7 to 22.24 | MD 5.6 lower |
| Prostatitis symptoms: 'responders' | 721 | ⊕⊝⊝⊝ | RR 1.23 | Study population | |
| 477 per 1000 | 110 more per 1000 | ||||
| Adverse events Any adverse event | 1588 | ⊕⊕⊝⊝ | RR 1.60 | Study population | |
| 94 per 1000 | 56 more per 1000 | ||||
| Sexual dysfunction | 452 | ⊕⊕⊕⊝ | ‐ | The mean sexual dysfunction ranged from 16.1 to 18.4 | MD 0.26 higher |
| Quality of life | 421 | ⊕⊕⊕⊝ | ‐ | The mean quality of life ranged from 41 to 46 | MD 0.15 higher |
| Anxiety and depression | 232 | ⊕⊕⊝⊝ | ‐ | The mean anxiety and depression was 12.8 | MD 1.1 lower |
| *The risk in the intervention group (and its 95% confidence interval) is based on the assumed risk in the comparison group and the relative effect of the intervention (and its 95% CI). | |||||
| GRADE Working Group grades of evidence | |||||
| aDowngraded one level due to study limitations: unclear or high risk of bias in most domains in most studies. | |||||
| 5‐alpha reductase inhibitors compared to placebo for chronic prostatitis/chronic pelvic pain syndrome | |||||
| Patient or population: men with chronic prostatitis/chronic pelvic pain syndrome | |||||
| Outcomes | № of participants | Quality of the evidence | Relative effect | Anticipated absolute effects* (95% CI) | |
| Risk with placebo | Risk difference with 5 alpha reductase inhibitors | ||||
| Prostatitis symptoms A decrease of 25% or 6 points is considered an important improvement | 64 | ⊕⊕⊕⊝ | ‐ | The mean prostatitis symptoms was 21.7 | MD 4.6 lower |
| Prostatitis symptoms: 'responders' | 64 | ⊕⊕⊝⊝ | RR 2.13 | Study population | |
| 152 per 1000 | 171 more per 1000 | ||||
| Adverse events | 105 | ⊕⊕⊝⊝ | RR 0.87 | Study population | |
| 163 per 1000 | 21 fewer per 1000 | ||||
| Sexual dysfunction ‐ not reported | ‐ | ‐ | ‐ | ‐ | ‐ |
| Quality of life ‐ not reported | ‐ | ‐ | ‐ | ‐ | ‐ |
| Anxiety and depression ‐ not reported | ‐ | ‐ | ‐ | ‐ | ‐ |
| *The risk in the intervention group (and its 95% confidence interval) is based on the assumed risk in the comparison group and the relative effect of the intervention (and its 95% CI). | |||||
| GRADE Working Group grades of evidence | |||||
| aDowngraded one level due to high risk of bias: unclear or high risk of bias in most domains in the main study of this comparison. | |||||
| Antibiotic therapy compared to placebo for chronic prostatitis/chronic pelvic pain syndrome | |||||
| Patient or population: men with chronic prostatitis/chronic pelvic pain syndrome Some comparisons included antibiotics as add‐on therapy to medical therapy (e.g. alpha blockers) versus medical therapy alone | |||||
| Outcomes | № of participants | Quality of the evidence | Relative effect | Anticipated absolute effects* (95% CI) | |
| Risk with placebo | Risk difference with antibiotic therapy | ||||
| Prostatitis symptoms A decrease of 25% or 6 points is considered an important improvement | 372 | ⊕⊕⊝⊝ | ‐ | The mean prostatitis symptoms ranged from 8.6 to 18.2 | MD 2.43 lower |
| Prostatitis symptoms: 'responders' | 178 | ⊕⊕⊝⊝ | RR 1.12 | Study population | |
| 286 per 1000 | 34 more per 1000 | ||||
| Adverse events | 336 | ⊕⊕⊕⊝ | RR 1.01 | Study population | |
| 213 per 1000 | 2 more per 1000 | ||||
| Sexual dysfunction | 77 | ⊕⊕⊕⊝ | ‐ | The mean sexual dysfunction was 16.8 | MD 0.4 higher |
| Quality of life | 87 | ⊕⊕⊕⊝ | ‐ | The mean quality of life was 44.3 | MD 3.9 lower |
| Anxiety and depression ‐ not reported | ‐ | ‐ | ‐ | ‐ | ‐ |
| *The risk in the intervention group (and its 95% confidence interval) is based on the assumed risk in the comparison group and the relative effect of the intervention (and its 95% CI). | |||||
| GRADE Working Group grades of evidence | |||||
| aDowngraded one level due to inconsistency: statistical heterogeneity 75%. | |||||
| Anti‐inflammatories compared to placebo for chronic prostatitis/chronic pelvic pain syndrome | |||||
| Patient or population: men with chronic prostatitis/chronic pelvic pain syndrome | |||||
| Outcomes | № of participants | Quality of the evidence | Relative effect | Anticipated absolute effects* (95% CI) | |
| Risk with control | Risk difference with anti‐inflammatories | ||||
| Prostatitis symptoms A decrease of 25% or 6 points is considered an important improvement | 585 | ⊕⊕⊝⊝ | ‐ | The mean prostatitis symptoms ranged from 8.6 to 19.5 | MD 2.5 lower |
| Prostatitis symptoms: 'responders' | 82 | ⊕⊕⊝⊝ | RR 1.44 | Study population | |
| 91 per 1000 | 40 more per 1000 | ||||
| Adverse events | 540 | ⊕⊕⊝⊝ | RR 1.27 | Study population | |
| 98 per 1000 | 26 more per 1000 | ||||
| Sexual dysfunction ‐ not reported | ‐ | ‐ | ‐ | ‐ | ‐ |
| Quality of life ‐ not reported | ‐ | ‐ | ‐ | ‐ | ‐ |
| Anxiety and depression ‐ not reported | ‐ | ‐ | ‐ | ‐ | ‐ |
| *The risk in the intervention group (and its 95% confidence interval) is based on the assumed risk in the comparison group and the relative effect of the intervention (and its 95% CI). | |||||
| GRADE Working Group grades of evidence | |||||
| aDowngraded one level due to high risk of bias: unclear or high risk of bias in most domains in most studies. | |||||
| Phytotherapy compared to placebo for chronic prostatitis/chronic pelvic pain syndrome | |||||
| Patient or population: men with chronic prostatitis/chronic pelvic pain syndrome | |||||
| Outcomes | № of participants | Quality of the evidence | Relative effect | Anticipated absolute effects* (95% CI) | |
| Risk with placebo or other agents | Risk difference with phytotherapy | ||||
| Prostatitis symptoms A decrease of 25% or 6 points is considered an important improvement | 320 | ⊕⊕⊝⊝ | ‐ | The mean prostatitis symptoms ranged from 10.3 to 14.5 | MD 5.02 lower |
| Prostatitis symptoms: 'responders' | 224 | ⊕⊕⊕⊝ | RR 1.78 | Study population | |
| 384 per 1000 | 299 more per 1000 | ||||
| Adverse events | 540 | ⊕⊕⊝⊝ | RR 1.13 | Study population | |
| 41 per 1000 | 5 more per 1000 | ||||
| Sexual dysfunction | 48 | ⊕⊕⊝⊝ | ‐ | The mean sexual dysfunction was 18.5 | MD 3.5 higher |
| Quality of life ‐ not reported | ‐ | ‐ | ‐ | ‐ | ‐ |
| Anxiety and depression ‐ not reported | ‐ | ‐ | ‐ | ‐ | ‐ |
| *The risk in the intervention group (and its 95% confidence interval) is based on the assumed risk in the comparison group and the relative effect of the intervention (and its 95% CI). | |||||
| GRADE Working Group grades of evidence | |||||
| aDowngraded one level due to high risk of bias: unclear or high risk of bias in most domains in most studies. | |||||
| Botulinum toxin A compared to placebo for chronic prostatitis/chronic pelvic pain syndrome | |||||
| Patient or population: men with chronic prostatitis/chronic pelvic pain syndrome | |||||
| Outcomes | № of participants | Quality of the evidence | Relative effect | Anticipated absolute effects* (95% CI) | |
| Risk with placebo | Risk difference with botulinum toxin A | ||||
| Prostatitis symptoms Subgroup: Intraprostatic injection, participants age > 50 years old, basal NIH‐CPSI score > 30 Assessed with: NIH‐CPSI score. Benefit is indicated by lower scores A decrease of 25% or 6 points is considered an important improvement | 60 | ⊕⊕⊝⊝ | ‐ | The mean prostatitis symptoms ‐ Intraprostatic injection was 36.37 | MD 25.8 lower |
| Prostatitis symptoms Subgroup: Pelvic floor muscles injection, participants age < 50 years old, basal NIH‐CPSI score < 30 | 29 | ⊕⊕⊝⊝ | ‐ | The mean prostatitis symptoms ‐ Pelvic floor muscles injection was 27.8 | MD 2.6 lower |
| Adverse events | 89 | ⊕⊕⊝⊝ | RR 5.00 | Study population | |
| 22 per 1000 | 87 more per 1000 | ||||
| Sexual dysfunction ‐ not reported | ‐ | ‐ | ‐ | ‐ | ‐ |
| Quality of life ‐ not reported | ‐ | ‐ | ‐ | ‐ | ‐ |
| Anxiety and depression ‐ not reported | ‐ | ‐ | ‐ | ‐ | ‐ |
| *The risk in the intervention group (and its 95% confidence interval) is based on the assumed risk in the comparison group and the relative effect of the intervention (and its 95% CI). | |||||
| GRADE Working Group grades of evidence | |||||
| aDowngraded one level due to unclear risk of bias (random sequence generation). | |||||
| Allopurinol compared to placebo for chronic prostatitis/chronic pelvic pain syndrome | |||||
| Patient or population: men with chronic prostatitis/chronic pelvic pain syndrome | |||||
| Outcomes | № of participants | Quality of the evidence | Relative effect | Anticipated absolute effects* (95% CI) | |
| Risk with placebo | Risk difference with allopurinol | ||||
| Prostatitis symptoms A decrease of 25% or 6 points is considered an important improvement | 56 | ⊕⊕⊝⊝ | ‐ | The mean prostatitis symptoms was 17.21 | MD 0.21 lower |
| Adverse events Follow‐up: 3 months | 110 | ⊕⊕⊝⊝ | ‐ | No adverse events were observed in the included studies | |
| Sexual dysfunction ‐ not reported | ‐ | ‐ | ‐ | ‐ | ‐ |
| Quality of life ‐ not reported | ‐ | ‐ | ‐ | ‐ | ‐ |
| Anxiety and depression ‐ not reported | ‐ | ‐ | ‐ | ‐ | ‐ |
| *The risk in the intervention group (and its 95% confidence interval) is based on the assumed risk in the comparison group and the relative effect of the intervention (and its 95% CI). | |||||
| GRADE Working Group grades of evidence | |||||
| aDowngraded one level due to imprecision: confidence interval includes appreciable benefits and harms.˜ | |||||
| Traditional Chinese Medicine compared to placebo for chronic prostatitis/chronic pelvic pain syndrome | |||||
| Patient or population: men with chronic prostatitis/chronic pelvic pain syndrome Some comparisons included antibiotics, alpha blockers and other Western medications as co‐interventions | |||||
| Outcomes | № of participants | Quality of the evidence | Relative effect | Anticipated absolute effects* (95% CI) | |
| Risk with placebo or usual care | Risk difference with Traditional Chinese medicine | ||||
| Prostatitis symptoms A decrease of 25% or 6 points is considered an important improvement | 835 | ⊕⊕⊝⊝ | ‐ | The mean prostatitis symptoms ranged from 11.17 to 15.02 | MD 3.13 lower |
| Adverse events | 584 | ⊕⊕⊝⊝ | RR 1.34 | Study population | |
| 29 per 1000 | 10 more per 1000 | ||||
| Sexual dysfunction | 88 | ⊕⊕⊕⊝ | ‐ | The mean sexual dysfunction was 14.93 | MD 0.27 higher |
| Quality of life ‐ not reported | ‐ | ‐ | ‐ | ‐ | ‐ |
| Anxiety and depression: anxiety | 88 | ⊕⊕⊝⊝ | ‐ | The mean anxiety and depression: anxiety was 23.3 | MD 9.5 lower |
| Anxiety and depression: depression | 88 | ⊕⊕⊝⊝ | ‐ | The mean anxiety and depression: depression was 24.07 | MD 7.84 lower |
| *The risk in the intervention group (and its 95% confidence interval) is based on the assumed risk in the comparison group and the relative effect of the intervention (and its 95% CI). | |||||
| GRADE Working Group grades of evidence | |||||
| aDowngraded one level due to inconsistency: high statistical heterogeneity (> 80%). Some of this inconsistency might be explained by the differences between the interventions under this comparison. | |||||
| Study | Intervention | Dose | Comparison | Dose for comparison Co‐interventions |
| Tadalafil study | 5 mg daily | Only co‐intervention | Both arms received levofloxacin 500 mg daily | |
| Ciprofloxacin + tamsulosin | Ciprofloxacin 500 mg twice daily, tamsulosin 0.4 mg once daily | C1: Ciprofloxacin C2: Tamsulosin C3: Placebo | They used double placebo (factorial design) | |
| Cernilton® (pollen extract) | 2 pills, 3 times a day | Cernilton® (pollen extract) | 1 pill, 3 times a day | |
| Prednisolone | 20 mg once daily and then tapered to 5 mg in 1 month | Placebo | Same regimen as active treatment | |
| Prolit super (plant extracts) | 4 capsules a day | Placebo | Same regimen as active treatment | |
| Deprox ® (pollen extract) | 2 capsules a day | Ibuprofen | 600 mg three times daily | |
| Deprox ® (pollen extract) | 2 capsules a day | Bromelain | 2 tablets a day | |
| Mepatricin | 40 mg daily | Vitamin C (as placebo) | 500 mg daily | |
| Alfusozin | 10 mg daily | C1: Terpene mixture 1 capsule three times a day C2: Only co‐intervention | All participants received levofloxacin 300 mg daily | |
| Terazosin | Titrated from 1 to 5 mg daily in two weeks | Placebo | Same regimen as active treatment | |
| Qiantongding decoction | Mix of herbal medications (oral infusion), twice a day | XiaoYanTong (Indometacin) | 25 mg tablet three times a day | |
| Tamsulosin | 0.2 mg daily | Placebo | Same regimen as active treatment | |
| Levofloxacin | 500 mg daily | C1: Ciprofloxacin 500 mg daily C2: Levofloxacin 1 g daily C3: No antibiotic | ‐ | |
| Roxithromycin | 300 mg daily | C1: Ciprofloxacin 1g daily C2: Aceclofenac 200 mg daily | ‐ | |
| Cytoflavin | 10 ml intravenously for 10 days, then 4 pills a day for 20 days | No cytoflavin | Both arms received: α‐blockers ‐ 1 month anti‐inflammatory drugs – 2 weeks prostate massage and vibrovacuum fallostimulation – 10 times antibiotics – 10 days | |
| Mepartricin | 40 mg daily for 60 days | Placebo | Same regimen as active treatment | |
| Phenoxybenzamine | 20 mg daily | Placebo | Same regimen as active treatment | |
| Pollen extract | 74 mg in Prolit® capsules | Placebo | Same regimen as active treatment | |
| Botulinum toxin A | 100 units applied in the external urethral sphincter | Botulinum toxin A | 100 units applied to the prostate and sphincter | |
| Quinolone + ibuprofen + terazosin | 500 mg, 400 mg and 5 mg respectively | C1: Terazosin 5 mg C2: Quinolone 500 mg + ibuprofen 400 mg | ‐ | |
| Botulinum toxin A | 200 units applied to the prostate | Placebo | Same regimen as active treatment | |
| Palmitoylethanolamide | 300 mg in Penease® capsules twice a day | Serenoa repens | 320 mg 1 capsule daily [All] "patients received a full course of pharmacological therapy" before allocation | |
| Duloxetin | 60 mg, escalated during the first 15 days | Only co‐interventions | Co‐interventions included Serenoa repens and tamsulosin | |
| Zafirlukast | 20 mg twice a day | Placebo | Same regimen as active treatment Both arms received doxycycline 100 mg twice daily for 4 weeks | |
| Botulinum toxin A | 100 units applied to pelvic floor muscles | Placebo | Same regimen as active treatment | |
| Terasozin | 2 mg daily | Placebo | Same regimen as active treatment | |
| Bazheng decoction | 320 mL daily | Only co‐intervention | Co‐intervention: tamsulosin 0.2 mg a day | |
| Pollen extract | 63 mg 3 times a day | Eviprostat® (herbal extract) | 1 capsule 3 times a day | |
| Levofloxacin | 200 mg daily | C1: Doxazosin C2: Levofloxacin + Doxazosin | 4 mg daily | |
| Desketoprofen | 12.5 mg 3 times a day | C1: Indomethacin 25 mg 3 times a day C2: Only co‐interventions | All participants received terazosin 2 mg daily for 4 weeks | |
| Terazosin | 3 ‐ 4 mg | No terazosin | All participants received levofloxacin 300 mg/day, tamiflunate 3 tablets/day for 12 weeks | |
| Serenoa repens | 325 mg daily | Finasteride | 5 mg daily | |
| Tamsulosin | 0.2 mg daily | C1: Ibuprofen + Misoprostol C2: Tamsulosin + ibuprofen + misoprostol | 600 mg ibuprofen three 3 times a day, 300 mcg misoprostol 3 times a day | |
| Propiverine | 20 mg daily | No propiverine | Both groups received gatifloxacin 200 mg twice daily | |
| Ciprofloxacin | 500 mg twice daily | C1: Diclofenac C2: Only co‐intervention | 50 mg twice daily Both groups received tamsulosin 0.2 mg daily for 12 weeks | |
| Solifenacin | 5 mg daily | No solifenacin | Both groups received ciprofloxacin 1000 mg daily for 8 weeks | |
| Mirodenafil | 50 mg daily | Only co‐intervention | Both groups received levofloxacin 500 mg daily for 6 weeks | |
| Doxazosin | 2 mg daily | C1: Ciprofloxacin C2: Doxazosin + ciprofloxacin | 500 mg twice a day | |
| Terazosin | 5 mg daily | C1: Tamsulosin C2: Placebo | 0.4 mg daily | |
| Sertraline | 50 mg daily | Placebo | Same regimen as active treatment | |
| Terpene mixture | Rowatinex® 200 mg | Ibuprofen | 600 mg 3 times a day | |
| Finasteride | 5 mg | Placebo | Same regimen as active treatment Ketoprofene was provided to both group for pain relief | |
| QianLieAnShuan (Prostat, 前列安栓) | Herbal suppository each night | Placebo suppository | Same regimen as active treatment | |
| Tiaoshen Tonglin | Mix of herbal medications (oral 150 ml infusion) daily | Terazosin | 2 mg daily | |
| Qianlieping | 2 g herbal capsule 3 times a day | C1: Tamsulosin C2: Qianlieping + Tamsulosin | 0.2 mg daily | |
| Vardenafil | 10 mg daily before sexual intercourse (from week 5 onwards) | Only co‐interventions | Both groups received traditional Chinese medicine (Huafenqinutang oral dose for 8 weeks) | |
| Phenoxybenzamine | 10 mg twice a day | C1: Flavoxate C2: Placebo | 200 mg 3 times a day | |
| Deprox ® (pollen extract) | 2 tablets a day | Serenoa repens | 320 mg daily | |
| Deprox ® (pollen extract) | 2 tablets a day | Quercetin | 500 mg twice daily | |
| Alfusozin | 5 mg twice a day | Placebo | Same regimen as active treatment Both groups "were allowed to take analgesics (ibuprofen, ketoprofen, diclofenac)" | |
| Alfusozin | 10 mg daily | No alfuzosin | Both groups received levofloxacin 100mg 3 times a day | |
| Profluss ® (Serenoa repens + lycopene + seleniated sodium) | 320 mg | Serenoa repens | 320 mg | |
| Curcumin‐calendula | 350 mg curcumin and 80 mg calendula in rectal suppositories daily | Placebo | Same regimen as active treatment | |
| Levofloxacin | 500 mg daily | Placebo | Same regimen as active treatment | |
| Rofecoxib | 50 mg and 25 mg doses daily | C1: Rofecoxib C2: Placebo | All participants had the same regimen All participants were permitted to take up to 2.6 g of paracetamol for rescue analgesia | |
| Finasteride | 5 mg daily | Placebo | Same regimen as active treatment | |
| Tamsulosin | 0.4 mg daily | Placebo | Same regimen as active treatment | |
| Pentosan polysulphate | 300 mg 3 times a day | Placebo | Same regimen as active treatment | |
| Alfusozin | 10 mg daily | Placebo | Same regimen as active treatment | |
| Silodosin | 8 mg daily | C1: Silodosin (4 mg) C2: Placebo | Same regimen as active treatment | |
| Tanezumab | 20 mg intravenous single dose | Placebo | Same regimen as active treatment | |
| PPC (aminoacid preparation) | 6 capsules a day | Pollen extract | Same regimen as active treatment | |
| Cranberry juice | 150 ml twice daily | No treatment | All participants underwent an 8 week‐run‐in period with levofloxacin 100mg 3 times a day, NSAID, alpha blocker, behaviour therapy, and hot sitz bath; for non‐responder, 4 additional weeks of same treatments were added | |
| Tadalafil | 10 mg daily | Only co‐intervention | Both groups received levofloxacin 500 mg daily for 4 weeks | |
| Tadalafil | 5 mg daily | Only co‐intervention | Both groups received levofloxacin 500 mg daily for six weeks | |
| Antiphlogistic agent | Mixture of herbal remedies 3 times a day | C1: Antiphlogistic + enema C2: Antiphlogistic + suppository C3: Antiphlogistic + "rectal fumigation" | ‐ | |
| Allopurinol | 300 mg twice a day | C1: Allopurinol 300 mg + placebo C2: Placebo twice a day | Both groups received the same number of pills | |
| Pregabalin | Titrated from 150 to 600 mg daily | Placebo | Same regimen as active treatment | |
| Serenoa repens | No description on dose or regimen | Placebo | No description on dose or regimen | |
| Alfusozin | 10 mg daily | Only co‐intervention | Both groups received tosufloxacin 150mg 3 times a day | |
| QianLieAnWan | Herbal ball‐shaped formulation, 9g 2 ‐ 3 times a day | C1: QianLieKang C2: Pollen extract capsule | ‐ | |
| Quercetin | 500 mg twice a day | Placebo | Same regimen as active treatment | |
| Tadalafil | 5 mg daily | Only co‐interventions | Both groups received levofloxacin 500 mg for 6 weeks and alfuzosin 10 mg for 6 weeks | |
| Terazosin | Titrated to 5 mg daily | Placebo | Same regimen as active treatment | |
| QianLieAnTong | Herbal capsule 0.38 g four tables 3 times a day | No QianLieAnTong | Both groups received terazosin 2 mg daily | |
| QianLieAnShuan (Prostat, 前列安栓) | Herbal suppository each night | No QuanLieAnShuan (Prostant) | Both groups received alpha blockers (tamsulosin or terazosin) | |
| Tiocolchicoside + ibuprofen | 120 (sic) and 1200 mg respectively, daily | Only co‐intervention | Both groups received terazosin 5 mg a day | |
| Tiocolchicoside + ibuprofen + doxazosin | 12 mg + 400 mg + 4 mg respectively, daily | C1: Doxazosin C2: Placebo | C1: Doxazosin 4 mg daily | |
| Fluvoxamine | 50 mg daily | Placebo | Same regimen as active treatment | |
| Pollen extract | 60 mg carnitine twice a day, daily | Placebo | Same regimen as active treatment Both groups were pretreated with azithromycin (250 mg every 6 hours for 1 day) | |
| OM‐89 (E. coli lysate) | 6 mg from 18 strains | Placebo | Same regimen as active treatment Other medications were allowed in both groups | |
| Chuanshentong | Sage and carrot‐family herbal extracts, injected in the prostate | Placebo injection | Same regimen as active treatment | |
| Terazosin | 2 mg daily | C1: Levofloxacin C2: Terazosin + Levofloxacin | Levofloxacin dose: 200 mg twice daily Both groups received dietary advice and prostatic massage once a week and were advised to take warm baths | |
| Pentosan polysulphate | 100 mg twice daily | Placebo | Same regimen | |
| Doxazosin | 4 mg daily | C1: Diclofenac C2: Doxazosin + diclofenac | 75 mg daily | |
| YuLeShu | Herbal mixture 20 ml 3 times a day | Only co‐interventions | Both groups received levofloxacin 0.2g twice a day, doxazosin 2 mg daily, QianLieTongYu 3 times a day, 4 capsules each time and weekly prostate massage | |
| Pollen extract (普适泰 = 舍尼通) | 0.375 g 3 times a day | Antibiotic treatment | Sulfamethoxazole 2 tablets, twice daily 10 days, ofloxacin 0.2 g, twice daily 10 days, minocycline 0.1 g twice daily, 10 days, sequentially, repeated monthly for 3 months | |
| Prednisone | 15 mg daily | Placebo | Both groups received levofloxacin 100 mg twice a day for 4 weeks | |
| Terazosin | 1 mg daily | C1: Tamsulosin C2: Placebo | 0.2 mg daily | |
| Pollen extract (普适泰 = 舍尼通) | 0.375 g twice a day | Placebo | Both groups received levofloxacin 100 mg twice a day for 4 weeks | |
| Tamsulosin | 0.2 mg daily | C1: Levofloxacin C2: Tamsulosin + levofloxacin | Levofloxacin 0.2 g daily | |
| Doxazosin | Dose was not defined | Only co‐intervention | Both groups received gatifloxacin 200mg twice daily | |
| Celecoxib | 200 mg daily | Celecoxib | 200 mg 3 times a day | |
| Aike decoction | Twice daily | C1: Bazhengsan decoction C2: Prostatitis decoction C3: Placebo | All decoctions were administered twice daily | |
| Sertraline | Titrated from 50 to 100 mg individually | C1:Duloxetine C2: Only co‐intervention | Duloxeine titrated from 30 to 120 mg individually All participants received doxazosin 4 mg daily | |
| Celecoxib | 200 mg daily | Placebo | Same regimen | |
| Tetracycline | 500 mg daily | Placebo | Placebo was "Vitamin B" | |
| Allopurinol | 100 mg 3 times a day | Placebo | Same regimen | |
| C1, C2, C3 were used to refer to multiple treatment arms. NSAID: Nonsteroidal anti‐inflammatory drugs. Blank cells indicate that dosing is described in the adjacent cell and co‐interventions were not described. | ||||
| Study | n randomised | n analysed | Duration ‐ Follow‐up | Mean age (years) Baseline | Previous treatments | Mean NIH‐CPSI score Baseline | Trial period | Country | Funding |
| 108 | 108 | 4 weeks | 40.55 | N/A | N/A | N/A | Saudi Arabia | None | |
| 196 | 174 | 12 weeks | 44.58 | N/A | 24.78 | 2001 ‐ 2002 | USA and Canada | Government + Industry | |
| 78 | 78 | 12 weeks | 36.90 | N/A | 22.50 | 2008 | Russia | None | |
| 21 | 18 | 8 weeks 52 weeks | 41.05 | N/A | 24.45 | 2000 ‐ 2002 | UK | Government | |
| 57 | 57 | 8 weeks | N/A | N/A | 22.00 | N/A | Russia | None | |
| 87 | 84 | 4 weeks | 33.75 | N/A | 25.20 | 2012 | Italy | N/A | |
| 70 | 65 | 12 weeks | 32.60 | N/A | 25.35 | 2015 | Italy | N/A | |
| 54 | 42 | 4 weeks | 34.00 | N/A | N/A | N/A | Italy | N/A | |
| 103 | 103 | 8 weeks | 39.27 | N/A | 24.53 | 2006 ‐ 2008 | South Korea | N/A | |
| 100 | 86 | 12 weeks 14 weeks | 35.50 | N/A | 26.15 | 2000 ‐ 2001 | Malaysia and US | Industry | |
| 70 | 70 | 4 weeks | 29.60 | No | 24.70 | 2007 ‐ 2008 | China | N/A | |
| 100 | 93 | 24 weeks 120 weeks | 34.30 | No | 22.90 | 2003 ‐ 2007 | China | N/A | |
| 215 | 215 | 6 weeks | N/A | Yes | N/A | N/A | Taiwan | N/A | |
| 75 | 75 | 4 weeks 12 weeks | 29.10 | N/A | 21.40 | 2011 | South Korea | N/A | |
| 60 | Not ANLZ | 4 weeks | N/A | N/A | N/A | N/A | Russia | None | |
| 30 | 26 | 8 weeks | 33.00 | N/A | 25.00 | 2001 ‐ 2002 | Italy | N/A | |
| 40 | 30 | 6 weeks | 39.00 | Yes | N/A | N/A | Germany | Industry | |
| 60 | 58 | 24 weeks | 35.00 | Yes | N/A | N/A | USA | Industry | |
| 52 | 52 | 52 weeks | 36.50 | Yes | N/A | N/A | Egypt | N/A | |
| 87 | 87 | 12 weeks 20 weeks | 34.20 | N/A | 23.92 | 2004 ‐ 2008 | Turkey | N/A | |
| 60 | 60 | 24 weeks | 40.42 | Yes | 34.09 | 2011 ‐ 2013 | Iran | N/A | |
| 44 | 44 | 12 weeks | 41.32 | N/A | N/A | 2014 ‐ 2015 | Italy | N/A | |
| 38 | 34 | 16 weeks | 46.80 | N/A | 24.68 | 2009 ‐ 2012 | Italy | N/A | |
| 20 | 17 | 4 weeks | 35.75 | N/A | N/A | N/A | UK | Industry | |
| 29 | 29 | 4 weeks | 50.50 | Yes | 25.95 | N/A | USA | N/A | |
| 91 | 69 | 12 weeks | 39.60 | N/A | PSSI 9.61/9.27 | 1997 ‐ 1999 | Turkey | N/A | |
| 96 | 96 | 2 weeks | 32.15 | N/A | 27.40 | 2012 ‐ 2013 | China | N/A | |
| 100 | 80 | 8 weeks | 51.55 | No | 21.30 | 2009 ‐ 2013 | Japan | N/A | |
| 81 | 81 | 6 weeks | 40.03 | No | 23.03 | 2004 | South Korea | N/A | |
| 115 | 115 | 4 weeks | 32.48 | No | 22.43 | 2007 ‐ 2008 | China | N/A | |
| 127 | 127 | 12 weeks | N/A | N/A | 21.65 | 2004 ‐ 2005 | South Korea | Industry | |
| 64 | 61 | 52 weeks | 43.20 | N/A | 24.30 | N/A | USA | N/A | |
| 63 | 55 | 8 weeks 12 weeks | N/A | N/A | 18.31 | 2001 ‐ 2002 | South Korea | N/A | |
| 46 | 46 | 2 months | 40.10 | N/A | 22.85 | N/A | South Korea | University | |
| 107 | 100 | 12 weeks | 46.10 | N/A | 23.56 | 2008 ‐ 2009 | South Korea | N/A | |
| 96 | 87 | 8 weeks | N/A | N/A | 21.10 | N/A | South Korea | N/A | |
| 88 | 88 | 6 weeks | 44.75 | N/A | 20.80 | N/A | South Korea | University | |
| 90 | 90 | 4 weeks | 40.30 | N/A | 25.80 | 2004 | Bosnia and Herzegovina | N/A | |
| 80 | 80 | 8 weeks | 36.19 | N/A | N/A | 1997 ‐ 1998 | Italy | N/A | |
| 14 | 13 | 13 weeks | N/A | N/A | PSS 23.4/28 | N/A | UK | NGO | |
| 50 | 50 | 6 weeks | 43.45 | N/A | 21.87 | 2003 ‐ 2004 | South Korea | N/A | |
| 41 | 35 | 52 weeks | 46.50 | Yes | N/A | N/A | Finland | None | |
| 76 | 75 | 4 weeks | 32.70 | N/A | 48.32 | 2002 | China | N/A | |
| 108 | 108 | 8 weeks | 29.95 | N/A | 26.05 | 2004 ‐ 2006 | China | Government | |
| 257 | 220 | 6 weeks | 30.60 | N/A | 24.80 | 2010 ‐ 2011 | China | Government | |
| 138 | 138 | 8 weeks | 37.00 | N/A | 27.85 | N/A | China | N/A | |
| 60 | 57 | 4 weeks | 39.13 | N/A | 21.85 | 2000 ‐ 2001 | China | Government + Industry | |
| N/A | 63 | 6 weeks | N/A | N/A | N/A | 2016 | Italy | None | |
| 54 | 54 | 4 weeks | 33.85 | N/A | 25.82 | 2016 | Italy | None | |
| 40 | 36 | 24 weeks 52 weeks | 49.50 | N/A | 24.50 | N/A | Finland | Government | |
| 54 | 54 | 8 weeks | 45.25 | N/A | 23.50 | 2004 ‐ 2005 | South Korea | N/A | |
| 102 | 102 | 8 weeks 16 weeks | 38.43 | No | 27.61 | 2006 ‐ 2007 | Italy | N/A | |
| 55 | 48 | 4 weeks 12 weeks | 32.00 | No | 20.25 | 2015 ‐ 2016 | Italy | None | |
| 80 | 79 | 6 weeks | 56.10 | N/A | 22.85 | N/A | Canada | Government + Industry | |
| 161 | 157 | 6 weeks | 45.97 | N/A | 21.97 | N/A | USA and Canada | Industry | |
| 76 | 64 | 24 weeks | 44.30 | N/A | 21.30 | N/A | USA | Government + Industry | |
| 58 | 58 | 6 weeks | 40.85 | N/A | 26.30 | 2000 ‐ 2001 | USA | Industry | |
| 100 | 73 | 16 weeks | 39.15 | N/A | 26.45 | N/A | USA and Canada | Industry | |
| 272 | 233 | 12 weeks | 40.10 | N/A | 24.45 | 2005 ‐ 2008 | USA, Canada and Malaysia | Government + Industry | |
| 151 | 115 | 12 weeks | 48.30 | N/A | 26.90 | 2008 ‐ 2009 | Canada | Industry | |
| 62 | 51 | 16 weeks | 46.85 | N/A | N/A | 2009 ‐ 2010 | USA, Canada, France, Sweden and Switzerland | Industry | |
| 76 | Not ANLZ | 4 weeks | N/A | N/A | N/A | 1983 | Japan | N/A | |
| 50 | 50 | 12 weeks | 35.85 | Yes | 22.75 | 2002 ‐ 2003 | South Korea | N/A | |
| 78 | 78 | 4 weeks | N/A | N/A | N/A | N/A | South Korea | None | |
| 86 | 86 | 6 weeks | 48.75 | N/A | N/A | N/A | South Korea | N/A | |
| 160 | Not ANLZ | 4 weeks | 36.00 | N/A | N/A | 1999 ‐ 2002 | China | Government | |
| 54 | 34 | 32 weeks | N/A | N/A | N/A | N/A | Sweden | N/A | |
| 324 | 313 | 6 weeks | 46.60 | Yes | 26.05 | 2006 ‐ 2007 | USA | Government + Industry | |
| 142 | 142 | 72 weeks | N/A | N/A | N/A | N/A | Austria | None | |
| 57 | N/A | 8 weeks | 40.05 | N/A | 20.70 | N/A | South Korea | University | |
| 60 | Not ANLZ | 4 weeks | N/A | N/A | N/A | 1994 | China | N/A | |
| 30 | 28 | 4 weeks | 44.85 | N/A | 20.60 | N/A | USA | N/A | |
| 68 | 61‐65 | 6 weeks | N/A | N/A | N/A | N/A | India | None | |
| 64 | 51 | 8 weeks 52 weeks | N/A | N/A | 25.70 | N/A | Russia | None | |
| 115 | 115 | 4 weeks | 31.60 | No | 23.99 | 2007 ‐ 2008 | China | N/A | |
| 90 | 88 | 6 weeks | 36.01 | N/A | 24.80 | 2006 | China | N/A | |
| 45 | 39 | 24 weeks | 34.10 | N/A | N/A | 2003 ‐ 2004 | Turkey | N/A | |
| 90 | 79 | 24 weeks 52 weeks | 29.10 | No | 22.63 | 2004 ‐ 2005 | Turkey | N/A | |
| 42 | 29 | 8 weeks | 41.00 | N/A | N/A | N/A | UK | Industry | |
| 139 | 118 | 12 weeks | 39.50 | N/A | 19.80 | 1999 ‐ 2004 | Germany | Industry | |
| 185 | 154 | 24 weeks 52 weeks | 47.70 | N/A | 22.40 | 2008 ‐ 2010 | Austria, Germany, Poland and Portugal | Industry | |
| 38 | 36 | 12 weeks | 28.00 | N/A | N/A | 2002 ‐ 2003 | China | N/A | |
| 115 | 115 | 6 weeks | 37.63 | No | 23.03 | 2011 ‐ 2014 | China | None | |
| 30 | 24 | 12 weeks | 37.60 | N/A | N/A | 1984 ‐ 1985 | Sweden | N/A | |
| 123 | 115 | 12 weeks | 34.80 | No | 23.96 | 2006 ‐ 2007 | China | N/A | |
| 88 | 88 | 4 weeks | 34.21 | N/A | 28.43 | 2011 ‐ 2012 | China | N/A | |
| 60 | Not ANLZ | 12 weeks | 28.25 | N/A | N/A | 1998 ‐ 1999 | China | N/A | |
| 160 | 158 | 4 weeks | 29.25 | N/A | 22.61 | 2007 | China | N/A | |
| 156 | 153 | 12 weeks | 30.73 | N/A | 25.44 | 2009 | China | N/A | |
| 160 | 159 | 8 weeks | 31.54 | N/A | N/A | 2005 ‐ 2006 | China | N/A | |
| 105 | 105 | 12 weeks | N/A | N/A | 20.05 | 2002 ‐ 2004 | China | Industry | |
| 69 | N/A | 6 weeks | 41.55 | N/A | 24.35 | 2005 ‐ 2006 | South Korea | N/A | |
| 64 | 61 | 6 weeks | 35.60 | N/A | 28.35 | 2003 | China | N/A | |
| 248 | 218 | 4 weeks | 30.97 | N/A | 21.41 | 2005 ‐ 2007 | China | Government | |
| 150 | 126 | 24 weeks | 32.96 | No | 21.94 | 2011 ‐ 2012 | China | None | |
| 64 | 64 | 8 weeks | N/A | No | N/A | 2006 ‐ 2008 | China | N/A | |
| 251 | 114 | 12 weeks | 32.55 | N/A | 25.22 | N/A | China | Government | |
| 48 | 48 | 12 weeks | 39.50 | Yes | N/A | 2005 ‐ 2007 | China | N/A | |
| 56 | 56 | 12 weeks | 33.40 | N/A | 25.68 | 2002 ‐ 2004 | Iran | N/A | |
| N/A: not applicable; NGO: non‐governmental organization; NIH‐CPSI: National Institutes of Health Chronic Prostatitis Symptom Index; PSS: Prostatitis Severity Score; PSSI: Prostatitis Symptoms Severity Index; USA: United States of America. Duration and follow‐up are differentiated when data were available. | |||||||||
| Outcome or subgroup title | No. of studies | No. of participants | Statistical method | Effect size |
| 1 Prostatitis symptoms: short term Show forest plot | 18 | 1524 | Mean Difference (IV, Random, 95% CI) | ‐5.01 [‐7.41, ‐2.61] |
| 1.1 Terazosin | 5 | 436 | Mean Difference (IV, Random, 95% CI) | ‐5.73 [‐10.96, ‐0.50] |
| 1.2 Doxazosin | 4 | 262 | Mean Difference (IV, Random, 95% CI) | ‐5.17 [‐11.50, 1.16] |
| 1.3 Phenoxybenzamine | 1 | 40 | Mean Difference (IV, Random, 95% CI) | ‐5.80 [‐7.91, ‐3.69] |
| 1.4 Tamsulosin | 4 | 302 | Mean Difference (IV, Random, 95% CI) | ‐5.89 [‐13.16, 1.38] |
| 1.5 Alfuzosin | 4 | 381 | Mean Difference (IV, Random, 95% CI) | ‐2.63 [‐4.55, ‐0.71] |
| 1.6 Silodosin | 1 | 103 | Mean Difference (IV, Random, 95% CI) | ‐3.60 [‐6.81, ‐0.39] |
| 2 Prostatitis symptoms: pain Show forest plot | 13 | 1243 | Mean Difference (IV, Random, 95% CI) | ‐2.39 [‐3.57, ‐1.22] |
| 2.1 Terazosin | 3 | 289 | Mean Difference (IV, Random, 95% CI) | ‐3.86 [‐6.00, ‐1.73] |
| 2.2 Doxazosin | 3 | 202 | Mean Difference (IV, Random, 95% CI) | ‐2.19 [‐4.56, 0.17] |
| 2.3 Phenoxybenzamine | 1 | 40 | Mean Difference (IV, Random, 95% CI) | ‐2.25 [‐3.78, ‐0.72] |
| 2.4 Tamsulosin | 3 | 265 | Mean Difference (IV, Random, 95% CI) | ‐3.17 [‐6.31, ‐0.03] |
| 2.5 Alfuzosin | 3 | 344 | Mean Difference (IV, Random, 95% CI) | ‐0.59 [‐1.67, 0.49] |
| 2.6 Silodosin | 1 | 103 | Mean Difference (IV, Random, 95% CI) | ‐1.40 [‐2.97, 0.17] |
| 3 Prostatitis symptoms: urinary Show forest plot | 13 | 1243 | Mean Difference (IV, Random, 95% CI) | ‐1.48 [‐2.29, ‐0.66] |
| 3.1 Terazosin | 3 | 289 | Mean Difference (IV, Random, 95% CI) | ‐2.07 [‐3.79, ‐0.34] |
| 3.2 Doxazosin | 3 | 202 | Mean Difference (IV, Random, 95% CI) | ‐1.71 [‐4.34, 0.92] |
| 3.3 Phenoxybenzamine | 1 | 40 | Mean Difference (IV, Random, 95% CI) | ‐1.60 [‐2.28, ‐0.92] |
| 3.4 Tamsulosin | 3 | 265 | Mean Difference (IV, Random, 95% CI) | ‐1.63 [‐3.85, 0.59] |
| 3.5 Alfuzosin | 3 | 344 | Mean Difference (IV, Random, 95% CI) | ‐0.67 [‐1.05, ‐0.29] |
| 3.6 Silodosin | 1 | 103 | Mean Difference (IV, Random, 95% CI) | ‐0.90 [‐2.00, 0.20] |
| 4 Prostatitis symptoms: quality of life Show forest plot | 13 | 1243 | Mean Difference (IV, Random, 95% CI) | ‐1.61 [‐2.49, ‐0.73] |
| 4.1 Terazosin | 3 | 289 | Mean Difference (IV, Random, 95% CI) | ‐2.51 [‐4.62, ‐0.40] |
| 4.2 Doxazosin | 3 | 202 | Mean Difference (IV, Random, 95% CI) | ‐1.34 [‐3.24, 0.56] |
| 4.3 Phenoxybenzamine | 1 | 40 | Mean Difference (IV, Random, 95% CI) | ‐2.2 [‐3.14, ‐1.26] |
| 4.4 Tamsulosin | 3 | 265 | Mean Difference (IV, Random, 95% CI) | ‐1.78 [‐4.96, 1.40] |
| 4.5 Alfuzosin | 3 | 344 | Mean Difference (IV, Random, 95% CI) | ‐0.53 [‐1.34, 0.29] |
| 4.6 Silodosin | 1 | 103 | Mean Difference (IV, Random, 95% CI) | ‐1.40 [‐2.49, ‐0.31] |
| 5 Prostatitis symptoms: responders rate Show forest plot | 7 | 721 | Risk Ratio (M‐H, Random, 95% CI) | 1.23 [0.94, 1.61] |
| 5.1 Doxazosin | 1 | 55 | Risk Ratio (M‐H, Random, 95% CI) | 0.90 [0.67, 1.20] |
| 5.2 Tamsulosin | 3 | 254 | Risk Ratio (M‐H, Random, 95% CI) | 1.49 [1.07, 2.06] |
| 5.3 Alfuzosin | 2 | 309 | Risk Ratio (M‐H, Random, 95% CI) | 1.82 [0.48, 6.80] |
| 5.4 Silodosin | 1 | 103 | Risk Ratio (M‐H, Random, 95% CI) | 1.09 [0.78, 1.52] |
| 6 Prostatitis symptoms: long term Show forest plot | 4 | 235 | Mean Difference (IV, Random, 95% CI) | ‐5.60 [‐10.89, ‐0.32] |
| 6.1 Terazosin | 1 | 51 | Mean Difference (IV, Random, 95% CI) | ‐7.76 [‐10.90, ‐4.62] |
| 6.2 Tamsulosin | 1 | 92 | Mean Difference (IV, Random, 95% CI) | ‐1.40 [‐2.73, ‐0.07] |
| 6.3 Alfuzosin | 1 | 35 | Mean Difference (IV, Random, 95% CI) | ‐3.4 [‐7.30, 0.50] |
| 6.4 Doxazosin | 1 | 57 | Mean Difference (IV, Random, 95% CI) | ‐9.7 [‐10.25, ‐9.15] |
| 7 Prostatitis symptoms: long term Show forest plot | 1 | 92 | Risk Ratio (M‐H, Random, 95% CI) | 1.57 [1.06, 2.32] |
| 7.1 Tamsulosin | 1 | 92 | Risk Ratio (M‐H, Random, 95% CI) | 1.57 [1.06, 2.32] |
| 8 Adverse events Show forest plot | 19 | 1588 | Risk Ratio (M‐H, Random, 95% CI) | 1.60 [1.09, 2.34] |
| 8.1 Terazosin | 6 | 431 | Risk Ratio (M‐H, Random, 95% CI) | 2.03 [1.14, 3.61] |
| 8.2 Doxazosin | 3 | 195 | Risk Ratio (M‐H, Random, 95% CI) | 1.47 [0.75, 2.88] |
| 8.3 Phenoxybenzamine | 1 | 40 | Risk Ratio (M‐H, Random, 95% CI) | 35.00 [2.25, 544.92] |
| 8.4 Tamsulosin | 5 | 367 | Risk Ratio (M‐H, Random, 95% CI) | 1.35 [0.60, 3.03] |
| 8.5 Alfuzosin | 4 | 452 | Risk Ratio (M‐H, Random, 95% CI) | 1.19 [0.37, 3.78] |
| 8.6 Silodosin | 1 | 103 | Risk Ratio (M‐H, Random, 95% CI) | 2.52 [1.15, 5.52] |
| 9 Sexual dysfunction Show forest plot | 4 | 452 | Mean Difference (IV, Random, 95% CI) | 0.26 [‐1.13, 1.65] |
| 9.1 Terazosin | 1 | 77 | Mean Difference (IV, Random, 95% CI) | 1.10 [‐0.84, 3.04] |
| 9.2 Tamsulosin | 1 | 99 | Mean Difference (IV, Random, 95% CI) | ‐0.20 [‐4.84, 4.44] |
| 9.3 Alfuzosin | 2 | 276 | Mean Difference (IV, Random, 95% CI) | ‐0.70 [‐2.89, 1.48] |
| 10 Quality of life: mental Show forest plot | 3 | 421 | Mean Difference (IV, Random, 95% CI) | 0.15 [‐2.63, 2.92] |
| 10.1 Tamsulosin | 1 | 90 | Mean Difference (IV, Random, 95% CI) | ‐1.00 [‐7.16, 1.16] |
| 10.2 Alfuzosin | 1 | 228 | Mean Difference (IV, Random, 95% CI) | 2.1 [‐0.64, 4.84] |
| 10.3 Silodosin | 1 | 103 | Mean Difference (IV, Random, 95% CI) | 0.30 [‐3.09, 3.69] |
| 11 Quality of life: physical Show forest plot | 3 | 421 | Mean Difference (IV, Random, 95% CI) | 1.17 [‐0.97, 3.30] |
| 11.1 Tamsulosin | 1 | 90 | Mean Difference (IV, Random, 95% CI) | 2.4 [‐0.52, 5.32] |
| 11.2 Alfuzosin | 1 | 228 | Mean Difference (IV, Random, 95% CI) | ‐0.5 [‐2.51, 1.51] |
| 11.3 Silodosin | 1 | 103 | Mean Difference (IV, Random, 95% CI) | 2.5 [‐0.81, 5.81] |
| 12 Anxiety and depression Show forest plot | 1 | 232 | Mean Difference (IV, Random, 95% CI) | ‐1.1 [‐2.54, 0.34] |
| 12.1 Alfuzosin | 1 | 232 | Mean Difference (IV, Random, 95% CI) | ‐1.1 [‐2.54, 0.34] |
| 13 Urinary symptoms Show forest plot | 2 | 143 | Mean Difference (IV, Random, 95% CI) | ‐2.68 [‐5.90, 0.54] |
| 13.1 Terazosin | 1 | 86 | Mean Difference (IV, Random, 95% CI) | ‐4.5 [‐6.64, ‐2.36] |
| 13.2 Alfuzosin | 1 | 57 | Mean Difference (IV, Random, 95% CI) | ‐1.20 [‐1.76, ‐0.64] |
| 14 Prostatitis symptoms: responders rate (sensitivity analysis according to risk of bias) Show forest plot | 2 | 155 | Odds Ratio (M‐H, Random, 95% CI) | 1.23 [0.61, 2.48] |
| 14.1 Tamsulosin | 2 | 155 | Odds Ratio (M‐H, Random, 95% CI) | 1.23 [0.61, 2.48] |
| 15 Adverse events (sensitivity analysis according to risk of bias) Show forest plot | 2 | 153 | Risk Ratio (M‐H, Random, 95% CI) | 0.96 [0.63, 1.47] |
| 15.1 Tamsulosin | 2 | 153 | Risk Ratio (M‐H, Random, 95% CI) | 0.96 [0.63, 1.47] |
| 16 Prostatitis symptoms: short term (subgroup analysis by co‐interventions) Show forest plot | 18 | 1524 | Mean Difference (IV, Random, 95% CI) | ‐5.01 [‐7.41, ‐2.61] |
| 16.1 Without co‐interventions | 7 | 688 | Mean Difference (IV, Random, 95% CI) | ‐3.56 [‐5.26, ‐1.86] |
| 16.2 With co‐interventions (analgesics, antibiotics) | 11 | 836 | Mean Difference (IV, Random, 95% CI) | ‐5.69 [‐8.90, ‐2.48] |
| 17 Adverse events (subgroup analysis by co‐interventions) Show forest plot | 19 | 1588 | Risk Ratio (M‐H, Random, 95% CI) | 1.60 [1.09, 2.34] |
| 17.1 Without co‐interventions | 11 | 1089 | Risk Ratio (M‐H, Random, 95% CI) | 1.69 [1.10, 2.60] |
| 17.2 With co‐interventions (analgesics, antibiotics) | 8 | 499 | Risk Ratio (M‐H, Random, 95% CI) | 1.20 [0.46, 3.17] |
| Outcome or subgroup title | No. of studies | No. of participants | Statistical method | Effect size |
| 1 Prostatitis symptoms Show forest plot | 1 | Mean Difference (IV, Random, 95% CI) | Totals not selected | |
| 2 Prostatitis symptoms: responder rate Show forest plot | 1 | Risk Ratio (M‐H, Random, 95% CI) | Totals not selected | |
| 3 Adverse events Show forest plot | 2 | 105 | Risk Ratio (M‐H, Random, 95% CI) | 0.87 [0.33, 2.30] |
| Outcome or subgroup title | No. of studies | No. of participants | Statistical method | Effect size |
| 1 Prostatitis symptoms Show forest plot | 5 | 372 | Mean Difference (IV, Random, 95% CI) | ‐2.43 [‐4.72, ‐0.15] |
| 1.1 Ciprofloxacin | 3 | 215 | Mean Difference (IV, Random, 95% CI) | ‐1.69 [‐3.15, ‐0.23] |
| 1.2 Levofloxacin | 2 | 157 | Mean Difference (IV, Random, 95% CI) | ‐2.98 [‐9.41, 3.44] |
| 2 Prostatitis symptoms: pain Show forest plot | 4 | 319 | Mean Difference (IV, Random, 95% CI) | ‐0.92 [‐1.78, ‐0.06] |
| 2.1 Ciprofloxacin | 2 | 155 | Mean Difference (IV, Random, 95% CI) | ‐0.78 [‐1.86, 0.30] |
| 2.2 Levofloxacin | 2 | 164 | Mean Difference (IV, Random, 95% CI) | ‐0.72 [‐2.74, 1.30] |
| 3 Prostatitis symptoms: urinary Show forest plot | 4 | 319 | Mean Difference (IV, Random, 95% CI) | ‐0.12 [‐0.65, 0.41] |
| 3.1 Ciprofloxacin | 2 | 155 | Mean Difference (IV, Random, 95% CI) | ‐0.29 [‐1.17, 0.58] |
| 3.2 Levofloxacin | 2 | 164 | Mean Difference (IV, Random, 95% CI) | 0.13 [‐0.85, 1.11] |
| 4 Prostatitis symptoms: quality of life Show forest plot | 4 | 319 | Mean Difference (IV, Random, 95% CI) | ‐0.45 [‐0.91, 0.02] |
| 4.1 Ciprofloxacin | 2 | 155 | Mean Difference (IV, Random, 95% CI) | ‐0.44 [‐1.04, 0.15] |
| 4.2 Levofloxacin | 2 | 164 | Mean Difference (IV, Random, 95% CI) | ‐0.50 [‐1.52, 0.53] |
| 5 Prostatitis symptoms: responder rate Show forest plot | 2 | 178 | Risk Ratio (M‐H, Random, 95% CI) | 1.12 [0.73, 1.74] |
| 5.1 Ciprofloxacin | 1 | 98 | Risk Ratio (M‐H, Random, 95% CI) | 1.0 [0.48, 2.09] |
| 5.2 Levofloxacin | 1 | 80 | Risk Ratio (M‐H, Random, 95% CI) | 1.20 [0.70, 2.05] |
| 6 Adverse events Show forest plot | 4 | 336 | Risk Ratio (M‐H, Random, 95% CI) | 1.01 [0.66, 1.55] |
| 6.1 Ciprofloxacin | 1 | 95 | Risk Ratio (M‐H, Random, 95% CI) | 0.97 [0.60, 1.57] |
| 6.2 Levofloxacin | 3 | 241 | Risk Ratio (M‐H, Random, 95% CI) | 1.17 [0.46, 2.97] |
| 7 Sexual dysfunction Show forest plot | 1 | Mean Difference (IV, Random, 95% CI) | Totals not selected | |
| 7.1 Levofloxacin | 1 | Mean Difference (IV, Random, 95% CI) | 0.0 [0.0, 0.0] | |
| 8 Quality of life: mental Show forest plot | 1 | Mean Difference (IV, Random, 95% CI) | Totals not selected | |
| 8.1 Ciprofloxacin | 1 | Mean Difference (IV, Random, 95% CI) | 0.0 [0.0, 0.0] | |
| 9 Quality of life: physical Show forest plot | 1 | Mean Difference (IV, Random, 95% CI) | Totals not selected | |
| 9.1 Ciprofloxacin | 1 | Mean Difference (IV, Random, 95% CI) | 0.0 [0.0, 0.0] | |
| 10 Urinary symptoms Show forest plot | 1 | Mean Difference (IV, Random, 95% CI) | Totals not selected | |
| 10.1 Ciprofloxacin | 1 | Mean Difference (IV, Random, 95% CI) | 0.0 [0.0, 0.0] | |
| 11 Prostatitis symptoms: subgroup analysis (age) Show forest plot | 5 | 372 | Mean Difference (IV, Random, 95% CI) | ‐2.43 [‐4.72, ‐0.15] |
| 11.1 Mean age > 50 years old | 1 | 80 | Mean Difference (IV, Random, 95% CI) | 0.60 [‐3.79, 4.99] |
| 11.2 Mean age < 50 years old | 4 | 292 | Mean Difference (IV, Random, 95% CI) | ‐2.92 [‐5.37, ‐0.46] |
| 12 Adverse events: subgroup analysis (age) Show forest plot | 4 | 336 | Risk Ratio (M‐H, Random, 95% CI) | 1.01 [0.66, 1.55] |
| 12.1 Mean age > 50 years old | 1 | 80 | Risk Ratio (M‐H, Random, 95% CI) | 1.17 [0.46, 2.97] |
| 12.2 Mean age < 50 years old | 3 | 256 | Risk Ratio (M‐H, Random, 95% CI) | 0.97 [0.60, 1.57] |
| 13 Prostatitis symptoms: subgroup analysis (co‐interventions) Show forest plot | 5 | 372 | Mean Difference (IV, Random, 95% CI) | ‐2.43 [‐4.72, ‐0.15] |
| 13.1 Without co‐interventions | 2 | 167 | Mean Difference (IV, Random, 95% CI) | ‐1.57 [‐4.77, 1.63] |
| 13.2 With co‐interventions (alpha blockers) | 3 | 205 | Mean Difference (IV, Random, 95% CI) | ‐2.96 [‐6.28, 0.37] |
| 14 Adverse events: subgroup analysis (co‐interventions) Show forest plot | 4 | 336 | Risk Ratio (M‐H, Random, 95% CI) | 1.01 [0.66, 1.55] |
| 14.1 Without co‐interventions | 2 | 175 | Risk Ratio (M‐H, Random, 95% CI) | 1.01 [0.66, 1.55] |
| 14.2 With co‐interventions (alpha blockers) | 2 | 161 | Risk Ratio (M‐H, Random, 95% CI) | 0.0 [0.0, 0.0] |
| Outcome or subgroup title | No. of studies | No. of participants | Statistical method | Effect size |
| 1 Prostatitis symptoms Show forest plot | 7 | 585 | Mean Difference (IV, Random, 95% CI) | ‐2.50 [‐3.74, ‐1.26] |
| 1.1 Corticosteroids | 1 | 158 | Mean Difference (IV, Random, 95% CI) | ‐2.82 [‐4.10, ‐1.54] |
| 1.2 Nonsteroidal anti‐inflammatory drugs | 5 | 369 | Mean Difference (IV, Random, 95% CI) | ‐2.56 [‐4.50, ‐0.62] |
| 1.3 Thiocolchicoside and ibuprofen | 1 | 58 | Mean Difference (IV, Random, 95% CI) | ‐1.5 [‐2.10, ‐0.90] |
| 2 Prostatitis symptoms: pain Show forest plot | 6 | 497 | Mean Difference (IV, Random, 95% CI) | ‐2.28 [‐4.08, ‐0.48] |
| 2.1 Corticosteroids | 1 | 158 | Mean Difference (IV, Random, 95% CI) | ‐1.67 [‐1.96, ‐1.38] |
| 2.2 Nonsteroidal anti‐inflammatory drugs | 3 | 265 | Mean Difference (IV, Random, 95% CI) | ‐1.80 [‐3.80, 0.20] |
| 2.3 Antileukotriene | 1 | 17 | Mean Difference (IV, Random, 95% CI) | 1.60 [‐5.79, 8.99] |
| 2.4 Thiocolchicoside and ibuprofen | 1 | 57 | Mean Difference (IV, Random, 95% CI) | ‐5.2 [‐5.59, ‐4.81] |
| 3 Prostatitis symptoms: urinary Show forest plot | 6 | 497 | Mean Difference (IV, Random, 95% CI) | ‐0.75 [‐1.53, 0.03] |
| 3.1 Corticosteroids | 1 | 158 | Mean Difference (IV, Random, 95% CI) | ‐0.69 [‐0.88, ‐0.50] |
| 3.2 Nonsteroidal anti‐inflammatory drugs | 3 | 265 | Mean Difference (IV, Random, 95% CI) | ‐0.38 [‐0.64, ‐0.13] |
| 3.3 Antileukotriene | 1 | 17 | Mean Difference (IV, Random, 95% CI) | 0.60 [‐0.84, 2.04] |
| 3.4 Thiocolchicoside and ibuprofen | 1 | 57 | Mean Difference (IV, Random, 95% CI) | ‐3.00 [‐3.47, ‐2.53] |
| 4 Prostatitis symptoms: quality of life Show forest plot | 6 | 497 | Mean Difference (IV, Random, 95% CI) | ‐1.25 [‐2.58, 0.08] |
| 4.1 Corticosteroids | 1 | 158 | Mean Difference (IV, Random, 95% CI) | ‐0.5 [‐0.75, ‐0.25] |
| 4.2 Nonsteroidal anti‐inflammatory drugs | 3 | 265 | Mean Difference (IV, Random, 95% CI) | ‐0.45 [‐0.90, 0.01] |
| 4.3 Antileukotriene | 1 | 17 | Mean Difference (IV, Random, 95% CI) | ‐0.40 [‐4.86, 4.06] |
| 4.4 Thiocolchicoside and ibuprofen | 1 | 57 | Mean Difference (IV, Random, 95% CI) | ‐4.5 [‐5.02, ‐3.98] |
| 5 Prostatitis symptoms: responder rate Show forest plot | 2 | 82 | Risk Ratio (M‐H, Random, 95% CI) | 1.44 [0.68, 3.03] |
| 5.1 Corticosteroids | 1 | 18 | Risk Ratio (M‐H, Random, 95% CI) | 1.0 [0.25, 4.00] |
| 5.2 Nonsteroidal anti‐inflammatory drugs | 1 | 64 | Risk Ratio (M‐H, Random, 95% CI) | 1.67 [0.69, 4.04] |
| 6 Prostatitis symptoms: long term Show forest plot | 1 | Mean Difference (IV, Random, 95% CI) | Totals not selected | |
| 6.1 Thiocolchicoside and ibuprofen | 1 | Mean Difference (IV, Random, 95% CI) | 0.0 [0.0, 0.0] | |
| 7 Adverse events Show forest plot | 7 | 540 | Risk Ratio (M‐H, Random, 95% CI) | 1.27 [0.81, 2.00] |
| 7.1 Corticosteroids | 1 | 160 | Risk Ratio (M‐H, Random, 95% CI) | 5.00 [0.24, 102.53] |
| 7.2 Nonsteroidal anti‐inflammatory drugs | 4 | 303 | Risk Ratio (M‐H, Random, 95% CI) | 1.85 [0.79, 4.32] |
| 7.3 Antileukotriene | 1 | 17 | Risk Ratio (M‐H, Random, 95% CI) | 0.56 [0.23, 1.37] |
| 7.4 Thiocolchicoside and ibuprofen | 1 | 60 | Risk Ratio (M‐H, Random, 95% CI) | 1.42 [0.83, 2.43] |
| 8 Urinary symptoms Show forest plot | 1 | Mean Difference (IV, Random, 95% CI) | Totals not selected | |
| 8.1 Nonsteroidal anti‐inflammatory drugs | 1 | Mean Difference (IV, Random, 95% CI) | 0.0 [0.0, 0.0] | |
| 9 Prostatitis symptoms: subgroup analysis (co‐interventions) Show forest plot | 7 | 585 | Mean Difference (IV, Random, 95% CI) | ‐2.50 [‐3.74, ‐1.26] |
| 9.1 Without co‐interventions | 1 | 64 | Mean Difference (IV, Random, 95% CI) | ‐3.62 [‐4.85, ‐2.39] |
| 9.2 With co‐interventions | 6 | 521 | Mean Difference (IV, Random, 95% CI) | ‐2.29 [‐3.67, ‐0.90] |
| 10 Adverse events Show forest plot | 7 | 540 | Risk Ratio (M‐H, Random, 95% CI) | 1.27 [0.81, 2.00] |
| 10.1 Without co‐interventions | 1 | 64 | Risk Ratio (M‐H, Random, 95% CI) | 2.0 [0.19, 20.97] |
| 10.2 With co‐interventions | 6 | 476 | Risk Ratio (M‐H, Random, 95% CI) | 1.25 [0.73, 2.15] |
| Outcome or subgroup title | No. of studies | No. of participants | Statistical method | Effect size |
| 1 Prostatitis symptoms Show forest plot | 5 | 320 | Mean Difference (IV, Random, 95% CI) | ‐5.02 [‐6.81, ‐3.23] |
| 1.1 Pollen extract vs. placebo | 1 | 137 | Mean Difference (IV, Random, 95% CI) | ‐2.5 [‐4.44, ‐0.56] |
| 1.2 Prolit Super Septo versus placebo | 1 | 57 | Mean Difference (IV, Random, 95% CI) | ‐9.0 [‐16.81, ‐1.19] |
| 1.3 Calendula‐Curcuma versus placebo | 1 | 48 | Mean Difference (IV, Random, 95% CI) | ‐6.0 [‐7.28, ‐4.72] |
| 1.4 Quercetin (flavonoid) versus placebo | 1 | 28 | Mean Difference (IV, Random, 95% CI) | ‐5.80 [‐10.80, ‐0.80] |
| 1.5 Add‐on cranberry compared to standard care | 1 | 50 | Mean Difference (IV, Random, 95% CI) | ‐5.40 [‐7.51, ‐3.29] |
| 2 Prostatitis symptoms: pain subscore Show forest plot | 5 | 431 | Mean Difference (IV, Random, 95% CI) | ‐1.42 [‐1.99, ‐0.85] |
| 2.1 Pollen extract vs. placebo | 2 | 296 | Mean Difference (IV, Random, 95% CI) | ‐1.30 [‐2.05, ‐0.55] |
| 2.2 Prolit Super Septo versus placebo | 1 | 57 | Mean Difference (IV, Random, 95% CI) | ‐4.0 [‐13.31, 5.31] |
| 2.3 Quercetin (flavonoid) versus placebo | 1 | 28 | Mean Difference (IV, Random, 95% CI) | ‐2.8 [‐5.41, ‐0.19] |
| 2.4 Add‐on cranberry compared to standard care | 1 | 50 | Mean Difference (IV, Random, 95% CI) | ‐1.40 [‐2.34, ‐0.46] |
| 3 Prostatitis symptoms: urinary symptoms Show forest plot | 5 | 431 | Mean Difference (IV, Random, 95% CI) | ‐0.99 [‐1.75, ‐0.23] |
| 3.1 Pollen Extract vs. Placebo | 2 | 296 | Mean Difference (IV, Random, 95% CI) | ‐0.49 [‐1.15, 0.16] |
| 3.2 Prolit Super Septo versus placebo | 1 | 57 | Mean Difference (IV, Random, 95% CI) | ‐1.30 [‐6.15, 3.55] |
| 3.3 Quercetin (flavonoid) versus placebo | 1 | 28 | Mean Difference (IV, Random, 95% CI) | ‐1.5 [‐3.27, 0.27] |
| 3.4 Add‐on cranberry compared to standard care | 1 | 50 | Mean Difference (IV, Random, 95% CI) | ‐1.80 [‐2.47, ‐1.13] |
| 4 Prostatitis symptoms: quality of life Show forest plot | 5 | 431 | Mean Difference (IV, Random, 95% CI) | ‐1.60 [‐2.30, ‐0.90] |
| 4.1 Pollen Extract vs. Placebo | 2 | 296 | Mean Difference (IV, Random, 95% CI) | ‐1.09 [‐1.66, ‐0.51] |
| 4.2 Prolit Super Septo versus placebo | 1 | 57 | Mean Difference (IV, Random, 95% CI) | ‐3.70 [‐9.12, 1.72] |
| 4.3 Quercetin (flavonoid) versus placebo | 1 | 28 | Mean Difference (IV, Random, 95% CI) | ‐1.90 [‐3.97, 0.17] |
| 4.4 Add‐on cranberry compared to standard care | 1 | 50 | Mean Difference (IV, Random, 95% CI) | ‐2.2 [‐2.75, ‐1.65] |
| 5 Prostatitis symptoms: responder rate Show forest plot | 3 | 224 | Risk Ratio (M‐H, Random, 95% CI) | 1.78 [1.25, 2.52] |
| 5.1 Pollen extract vs. placebo | 1 | 137 | Risk Ratio (M‐H, Random, 95% CI) | 1.47 [1.05, 2.05] |
| 5.2 Prolit Super Septo versus placebo | 1 | 57 | Risk Ratio (M‐H, Random, 95% CI) | 2.02 [1.23, 3.32] |
| 5.3 Quercetin (flavonoid) versus placebo | 1 | 30 | Risk Ratio (M‐H, Random, 95% CI) | 3.33 [1.14, 9.75] |
| 6 Adverse events Show forest plot | 7 | 540 | Risk Ratio (M‐H, Random, 95% CI) | 1.13 [0.54, 2.36] |
| 6.1 Pollen Extract vs. Placebo | 3 | 357 | Risk Ratio (M‐H, Random, 95% CI) | 1.14 [0.34, 3.79] |
| 6.2 Prolit Super Septo versus placebo | 1 | 57 | Risk Ratio (M‐H, Random, 95% CI) | 0.0 [0.0, 0.0] |
| 6.3 Calendula‐Curcuma versus placebo | 1 | 48 | Risk Ratio (M‐H, Random, 95% CI) | 3.00 [0.13, 70.16] |
| 6.4 Quercetin (flavonoid) versus placebo | 1 | 28 | Risk Ratio (M‐H, Random, 95% CI) | 1.73 [0.18, 16.99] |
| 6.5 Add‐on cranberry compared to standard care | 1 | 50 | Risk Ratio (M‐H, Random, 95% CI) | 0.0 [0.0, 0.0] |
| 7 Sexual dysfunction Show forest plot | 1 | Mean Difference (IV, Random, 95% CI) | Totals not selected | |
| 7.1 Calendula‐Curcuma versus placebo | 1 | Mean Difference (IV, Random, 95% CI) | 0.0 [0.0, 0.0] | |
| 8 Urinary symptoms Show forest plot | 1 | Mean Difference (IV, Random, 95% CI) | Totals not selected | |
| 8.1 Pollen Extract vs. Placebo | 1 | Mean Difference (IV, Random, 95% CI) | 0.0 [0.0, 0.0] | |
| 9 Prostatitis symptoms: subgroup analysis (co‐interventions) Show forest plot | 5 | 320 | Mean Difference (IV, Random, 95% CI) | ‐5.02 [‐6.81, ‐3.23] |
| 9.1 Without co‐interventions | 3 | 133 | Mean Difference (IV, Random, 95% CI) | ‐6.06 [‐7.28, ‐4.84] |
| 9.2 With co‐interventions | 2 | 187 | Mean Difference (IV, Random, 95% CI) | ‐3.92 [‐6.76, ‐1.08] |
| 10 Adverse events: subgroup analysis (co‐interventions) Show forest plot | 7 | 540 | Risk Ratio (M‐H, Random, 95% CI) | 1.13 [0.54, 2.36] |
| 10.1 Without co‐interventions | 4 | 191 | Risk Ratio (M‐H, Random, 95% CI) | 2.09 [0.33, 13.30] |
| 10.2 With co‐interventions | 3 | 349 | Risk Ratio (M‐H, Random, 95% CI) | 1.14 [0.34, 3.79] |
| Outcome or subgroup title | No. of studies | No. of participants | Statistical method | Effect size |
| 1 Prostatitis symptoms Show forest plot | 2 | Mean Difference (IV, Random, 95% CI) | Subtotals only | |
| 1.1 Intraprostatic | 1 | 60 | Mean Difference (IV, Random, 95% CI) | ‐25.80 [‐30.15, ‐21.45] |
| 1.2 Pelvic floor muscles | 1 | 29 | Mean Difference (IV, Random, 95% CI) | ‐2.6 [‐5.59, 0.39] |
| 2 Prostatitis symptoms: pain subscore Show forest plot | 2 | Mean Difference (IV, Random, 95% CI) | Subtotals only | |
| 2.1 Intraprostatic | 1 | 60 | Mean Difference (IV, Random, 95% CI) | ‐14.63 [‐16.76, ‐12.50] |
| 2.2 Pelvic floor muscles | 1 | 29 | Mean Difference (IV, Random, 95% CI) | ‐1.70 [‐3.23, ‐0.17] |
| 3 Prostatitis symptoms: urinary subscore Show forest plot | 2 | 89 | Mean Difference (IV, Random, 95% CI) | ‐2.82 [‐7.40, 1.76] |
| 3.1 Intraprostatic | 1 | 60 | Mean Difference (IV, Random, 95% CI) | ‐5.17 [‐6.72, ‐3.62] |
| 3.2 Pelvic floor muscles | 1 | 29 | Mean Difference (IV, Random, 95% CI) | ‐0.5 [‐1.85, 0.85] |
| 4 Prostatitis symptoms: quality of life Show forest plot | 2 | Mean Difference (IV, Random, 95% CI) | Totals not selected | |
| 4.1 Intraprostatic | 1 | Mean Difference (IV, Random, 95% CI) | 0.0 [0.0, 0.0] | |
| 4.2 Pelvic floor muscles | 1 | Mean Difference (IV, Random, 95% CI) | 0.0 [0.0, 0.0] | |
| 5 Adverse events Show forest plot | 2 | 89 | Risk Ratio (M‐H, Random, 95% CI) | 5.00 [0.25, 99.95] |
| 5.1 Intraprostatic | 1 | 60 | Risk Ratio (M‐H, Random, 95% CI) | 5.00 [0.25, 99.95] |
| 5.2 Pelvic floor muscle | 1 | 29 | Risk Ratio (M‐H, Random, 95% CI) | 0.0 [0.0, 0.0] |
| 6 Urinary symptoms Show forest plot | 1 | 60 | Mean Difference (IV, Random, 95% CI) | ‐9.67 [‐13.97, ‐5.37] |
| 6.1 Intraprostatic | 1 | 60 | Mean Difference (IV, Random, 95% CI) | ‐9.67 [‐13.97, ‐5.37] |
| Outcome or subgroup title | No. of studies | No. of participants | Statistical method | Effect size |
| 1 Prostatitis symptoms Show forest plot | 1 | Mean Difference (IV, Random, 95% CI) | Totals not selected | |
| 2 Prostatitis symptoms: pain subscore Show forest plot | 1 | Mean Difference (IV, Random, 95% CI) | Totals not selected | |
| 3 Prostatitis symptoms: urinary subscore Show forest plot | 1 | Mean Difference (IV, Random, 95% CI) | Totals not selected | |
| Outcome or subgroup title | No. of studies | No. of participants | Statistical method | Effect size |
| 1 Prostatitis symptoms Show forest plot | 7 | 835 | Mean Difference (IV, Random, 95% CI) | ‐3.13 [‐4.99, ‐1.28] |
| 1.1 Prostant versus placebo | 2 | 164 | Mean Difference (IV, Random, 95% CI) | ‐3.93 [‐7.76, ‐0.10] |
| 1.2 Qianlieping (add‐on) versus medical treatment alone | 1 | 154 | Mean Difference (IV, Random, 95% CI) | ‐3.40 [‐5.03, ‐1.77] |
| 1.3 Qianlieantong (add‐on) versus medical treatment alone | 1 | 115 | Mean Difference (IV, Random, 95% CI) | ‐6.67 [‐8.14, ‐5.20] |
| 1.4 Yuleshu (add‐on) versus medical care alone | 1 | 88 | Mean Difference (IV, Random, 95% CI) | ‐1.41 [‐2.57, ‐0.25] |
| 1.5 Aike Mixture versus placebo | 1 | 74 | Mean Difference (IV, Random, 95% CI) | ‐3.59 [‐8.24, 1.06] |
| 1.6 Bazhengsan versus placebo | 2 | 162 | Mean Difference (IV, Random, 95% CI) | ‐1.53 [‐9.28, 6.23] |
| 1.7 Prostatitis Decoction versus placebo | 1 | 78 | Mean Difference (IV, Random, 95% CI) | 1.07 [‐3.78, 5.92] |
| 2 Prostatitis symptoms: pain subscore Show forest plot | 5 | 585 | Mean Difference (IV, Random, 95% CI) | ‐1.49 [‐2.44, ‐0.53] |
| 2.1 Prostant versus placebo | 2 | 164 | Mean Difference (IV, Random, 95% CI) | ‐1.42 [‐2.51, ‐0.34] |
| 2.2 Qianlieantong versus medical treatment alone | 1 | 115 | Mean Difference (IV, Random, 95% CI) | ‐2.54 [‐3.24, ‐1.84] |
| 2.3 Yuleshu versus medical care | 1 | 88 | Mean Difference (IV, Random, 95% CI) | ‐2.52 [‐3.64, ‐1.40] |
| 2.4 Aike Mixture versus placebo | 1 | 74 | Mean Difference (IV, Random, 95% CI) | ‐2.21 [‐4.60, 0.18] |
| 2.5 Bazhengsan versus placebo | 1 | 66 | Mean Difference (IV, Random, 95% CI) | 1.35 [‐1.22, 3.92] |
| 2.6 Prostatitis Decoction versus placebo | 1 | 78 | Mean Difference (IV, Random, 95% CI) | 1.02 [‐1.52, 3.56] |
| 3 Prostatitis symptoms: urinary subscore Show forest plot | 4 | 497 | Mean Difference (IV, Random, 95% CI) | ‐0.78 [‐1.50, ‐0.06] |
| 3.1 Prostant versus placebo | 2 | 164 | Mean Difference (IV, Random, 95% CI) | ‐1.62 [‐3.37, 0.13] |
| 3.2 Qianlieantong versus medical treatment alone | 1 | 115 | Mean Difference (IV, Random, 95% CI) | ‐0.39 [‐1.02, 0.24] |
| 3.3 Aike Mixture versus placebo | 1 | 74 | Mean Difference (IV, Random, 95% CI) | ‐0.84 [‐2.31, 0.63] |
| 3.4 Bazhengsan versus placebo | 1 | 66 | Mean Difference (IV, Random, 95% CI) | 0.25 [‐1.35, 1.85] |
| 3.5 Prostatitis Decoction versus placebo | 1 | 78 | Mean Difference (IV, Random, 95% CI) | ‐0.26 [‐1.73, 1.21] |
| 4 Prostatitis symptoms: quality of life Show forest plot | 2 | 306 | Mean Difference (IV, Random, 95% CI) | ‐0.97 [‐2.14, 0.20] |
| 4.1 Prostant versus placebo | 1 | 88 | Mean Difference (IV, Random, 95% CI) | ‐1.91 [‐1.00, ‐0.82] |
| 4.2 Aike Mixture versus placebo | 1 | 74 | Mean Difference (IV, Random, 95% CI) | ‐1.10 [‐3.36, 1.16] |
| 4.3 Bazhengsan versus placebo | 1 | 66 | Mean Difference (IV, Random, 95% CI) | 0.66 [‐1.65, 2.97] |
| 4.4 Prostatitis Decoction versus placebo | 1 | 78 | Mean Difference (IV, Random, 95% CI) | ‐0.34 [‐2.59, 1.91] |
| 5 Adverse events Show forest plot | 4 | 584 | Risk Ratio (M‐H, Random, 95% CI) | 1.34 [0.22, 8.02] |
| 5.1 Prostant versus placebo | 2 | 212 | Risk Ratio (M‐H, Random, 95% CI) | 0.72 [0.03, 19.50] |
| 5.2 Qianlieping versus medical treatment alone | 1 | 154 | Risk Ratio (M‐H, Random, 95% CI) | 0.0 [0.0, 0.0] |
| 5.3 Aike Mixture versus placebo | 1 | 74 | Risk Ratio (M‐H, Random, 95% CI) | 0.0 [0.0, 0.0] |
| 5.4 Bazhengsan versus placebo | 1 | 66 | Risk Ratio (M‐H, Random, 95% CI) | 4.33 [0.26, 72.96] |
| 5.5 Prostatitis Decoction versus placebo | 1 | 78 | Risk Ratio (M‐H, Random, 95% CI) | 2.43 [0.14, 42.93] |
| 6 Sexual dysfunction Show forest plot | 1 | Mean Difference (IV, Random, 95% CI) | Totals not selected | |
| 6.1 Yuleshu versus medical care | 1 | Mean Difference (IV, Random, 95% CI) | 0.0 [0.0, 0.0] | |
| 7 Anxiety and depression: anxiety Show forest plot | 1 | Mean Difference (IV, Random, 95% CI) | Totals not selected | |
| 7.1 Yuleshu versus medical care | 1 | Mean Difference (IV, Random, 95% CI) | 0.0 [0.0, 0.0] | |
| 8 Anxiety and depression: depression Show forest plot | 1 | Mean Difference (IV, Random, 95% CI) | Totals not selected | |
| 8.1 Yuleshu versus medical care | 1 | Mean Difference (IV, Random, 95% CI) | 0.0 [0.0, 0.0] | |