Total serum bile acids or serum bile acid profile, or both, for the diagnosis of intrahepatic cholestasis of pregnancy
Abstract
Background
Intrahepatic cholestasis of pregnancy is a pregnancy‐specific liver disorder, possibly associated with an increased risk of severe fetal adverse events. Total serum bile acids (TSBA) concentration, alone or in combination with serum aminotransferases, have been the most often used biomarkers for the diagnosis of intrahepatic cholestasis of pregnancy in clinical practice. Serum bile acid profile, composed of primary or secondary, conjugated or non‐conjugated bile acids, may provide more specific disease information.
Objectives
To assess and compare, independently or in combination, the diagnostic accuracy of total serum bile acids or serum bile acids profile, or both, for the diagnosis of intrahepatic cholestasis of pregnancy in pregnant women, presenting with pruritus. To define the optimal cut‐off values for components of serum bile acid profile; to investigate possible sources of heterogeneity.
Search methods
We searched the Cochrane Hepato‐Biliary Group Controlled Trials Register, the Cochrane Hepato‐Biliary Group Diagnostic Test Accuracy Studies Register, the Cochrane Library, MEDLINE Ovid, Embase Ovid, Science Citation Index Expanded, Conference Proceedings Citation Index – Science, BIOSIS, CINAHL, two Chinese databases (CKNI, VIP), Latin American and Caribbean Health Sciences Literature (LILACS), Scientific Electronic Library Online (SciELO), Evidence Search: Health and Social Care by the National Institute for Health and Care Excellence (NICE), the World Health Organization (WHO) Reproductive Health Library (RHL), and the Turning Research into Practice database (TRIP). The most recent date of search was 6 May 2019. We identified additional references by handsearching the references of articles, meta‐analyses, and evidence‐based guidelines retrieved from the computerised databases, on‐line trial registries, and grey literature through OpenSIGLE, National Technical Information Service (NTIS), ProQuest Dissertations & Thesis Database, and Index to Theses in Great Britain and Ireland.
Selection criteria
Prospective or retrospective diagnostic case‐control or cross‐sectional studies, irrespective of publication date, format, and language, which evaluated the diagnostic accuracy of total serum bile acids (TSBA) or components of serum bile acid profile for the diagnosis of intrahepatic cholestasis of pregnancy in pregnant women of any age or ethnicity, in any clinical setting, symptomatic for pruritus.
Data collection and analysis
We selected studies by reading titles, abstracts, or full texts, and assessing their fulfilment of our inclusion criteria. We emailed primary authors to request missing data or individual participant data. Having extracted data from each included study, we built the two‐by‐two tables for each primary study and for all the index tests considered. We estimated sensitivity and specificity with their 95% confidence intervals (CI). We presented data in coupled forest plots, showing sensitivities and specificities of each study, and we plotted the studies in the Receiver Operating Characteristic (ROC) space. We performed meta‐analyses adopting the hierarchical summary ROC model (HSROC) or the bivariate model to meta‐analyse the data. We made indirect comparisons of the considered index tests by adding the index tests as covariates to the bivariate or HSROC models. We performed heterogeneity analysis and sensitivity analysis on studies assessing TSBA accuracy. We used Review Manager 5 (RevMan 5) and SAS statistical software, release 9.4 (SAS Institute Inc., Cary, NC, USA), to perform all statistical analyses. We used QUADAS‐2 domains to assess the risk of bias of the included studies.
Main results
Our search yielded 5073 references, but at the end of our selection process, only 16 studies fulfilled the review inclusion criteria. Nine of these provided individual participant data. We analysed only data concerning TSBA, cholic acid (CA), glycocholic acid (GCA), chenodeoxycholic acid (CDCA), and CA/CDCA because the remaining planned index tests were assessed in few studies. Only one study had low risk of bias in all four QUADAS‐2 domains. The most biased domains were the patient sampling and the reference standard domains. When considering all studies with a cut‐off of 10 μmol/L, TSBA overall sensitivity ranged from 0.72 to 0.98 and specificity ranged from 0.81 to 0.97. After a sensitivity analysis excluding case‐control studies, TSBA sensitivity ranged from 0.48 to 0.66 and specificity from 0.52 to 0.99. After a sensitivity analysis excluding studies in which TSBA was part of the reference standard, TSBA sensitivity ranged from 0.49 to 0.65 and specificity from 0.53 to 0.99. We found the estimates of the overall accuracy for some serum bile acid components (CA, GCA, CDCA, and CA/CDCA) to be imprecise, with the CI for sensitivity and specificity very wide or impossible to calculate. Indirect comparisons between serum bile acid profile components and TSBA were not statistically significant. None of the heterogeneity analysis performed was statistically significant, except for the timing of assessment of TSBA (onset of symptoms, peak value among multiple assessments, delivery) but without clinically relevant results. We could not analyse the diagnostic accuracy of combinations of index tests because none of the included studies carried them out, and because of the small number of included studies.
Authors' conclusions
The overall high risk of bias, the existing concern regarding applicability of the results in clinical practice, and the great heterogeneity of the results in the included studies prevents us from making recommendations and reaching definitive conclusions at the present time. Thus, we do not find any compelling evidence to recommend or refute the routine use of any of these tests in clinical practice. So far, the diagnostic accuracy of TSBA for intrahepatic cholestasis of pregnancy might have been overestimated. There were too few studies to permit a precise estimate of the accuracy of serum bile acid profile components. Further primary clinical research is mandatory. We need both further phase II and phase III diagnostic studies.
Plain language summary
Diagnostic accuracy of total serum bile acids or individual bile acids for intrahepatic cholestasis of pregnancy in woman claiming pruritus
Review question
To assess and compare the diagnostic accuracy of total serum bile acids (TSBA) and some components of serum bile acid profile for the diagnosis of intrahepatic cholestasis of pregnancy in woman with onset of pruritus during pregnancy.
Background
'Diagnostic accuracy' means how well a test correctly identifies or rules out disease and informs subsequent decisions about treatment. Intrahepatic cholestasis of pregnancy is a pregnancy‐specific liver disorder, in which bile (a digestive fluid) builds up in the liver, impairing the liver (intrahepatic) function. Intrahepatic cholestasis of pregnancy is possibly associated with an increased risk of premature delivery and fetal death, which seems to occur most often during the last weeks of pregnancy. This is why most clinicians choose to induce early delivery of the baby.
In clinical practice, presence of severe pruritus (itchiness) during late pregnancy and 'otherwise unexplained' abnormalities in serum liver tests, seems enough to support the diagnosis of intrahepatic cholestasis of pregnancy. However, excluding all other possible underlying diseases is not always easy; hence confirmation of the intrahepatic cholestasis of pregnancy diagnosis may be possible only after delivery, when spontaneous disappearance of pruritus and improvement of liver tests on blood exams usually occur.
Total serum bile acids (TSBA) are the most used biomarkers for intrahepatic cholestasis of pregnancy in clinical practice. Some components of the serum bile acid profile might provide more specific information than total serum bile acids when diagnosing the disease, defining its severity and monitoring its response to treatment.
Study characteristics
This review considered all evidence provided by studies that assess the diagnostic accuracy of total serum bile acids (TSBA) and any component of serum bile acid profile for intrahepatic cholestasis of pregnancy in woman claiming onset of pruritus during pregnancy.
We assessed all available reports from a wide, systematic search of databases of medical literature, irrespective of design, publication status, language, and study design. We finally included 16 studies, most of them assessing the accuracy (sensitivity and specificity) of TSBA with a cut‐off of 10 μmol/L. Most studies had a case‐control design, and these studies could have overestimated the diagnostic accuracy.
Key results
When considering the studies with a cut‐off of 10 μmol/L for TSBA serum concentration, TSBA overall sensitivity (the ability to correctly identify women with the disease) ranged from 72% to 98% and specificity (the ability to correctly identify women without the disease) ranged from 81% to 97%. However, after performing two different analyses excluding studies with probably less reliable results, the diagnostic accuracy seemed lower. We calculated the overall accuracy also of some components of serum bile acid profile, but the small number of studies and the high variability of the results led to very imprecise data.
Quality of the evidence
Only one of the 16 included studies was performed and reported well (low risk of bias). The remaining 15 studies had problems with study design or reporting (high risk of bias). Only five studies seemed to show low concern regarding applicability of the results in clinical practice.
Conclusions
The overall high risk of bias, the existing concern regarding applicability of the results in clinical practice, and the poor uniformity of our results in the included studies prevents us from making recommendations and reaching definitive conclusions at present. Thus, we do not find any compelling evidence to recommend or refute the routine use of any of these tests in clinical practice. So far, the diagnostic accuracy of TSBA for intrahepatic cholestasis of pregnancy might have been overestimated. There were too few studies to permit a precise estimate of the accuracy of serum bile acid profile components. Further primary clinical research is mandatory. We need both further phase II and phase III diagnostic studies.
Authors' conclusions
Summary of findings
| What is the diagnostic accuracy of total serum bile acids (TSBA), cholic acid (CA), glycocholic acid (GCA), chenodeoxycholic acid (CDCA), or CA/CDCA for intrahepatic cholestasis of pregnancy (ICP), at different cut‐off values? | |||||
| Patients/population | Pregnant women with onset of pruritus from the second trimester or later | ||||
| Prior testing | History, serum tests, liver ultrasound | ||||
| Settings | Obstetrics and Gynaecology departments | ||||
| Index test | TSBA, CA, GCA, CDCA, CA/CDCA | ||||
| Importance | Early diagnosis, treatment and follow‐up to reduce fetal adverse events | ||||
| Reference standard | Clinical evaluation comprising common liver function tests, with exclusion of other possible underlying liver or dermatological diseases, and follow‐up after delivery assessing spontaneous normalization of signs and symptoms. | ||||
| Studies | Cross‐sectional and case‐control studies. Each study can be present in more than one subgroup and for more than one index test | ||||
| Test/Subgroup | Summary accuracy (95% CI) | N° part. (studies) | Median prevalence of ICP in pregnant women with pruritus | Implications for an hypothetical population of 100 pregnant women with pruritus | Quality and Comments |
| TSBA, any cut‐off | Sensitivity 0.88 (0.73 to 0.95) Specificity 0.90 (0.84 to 0.95) | 1645 (13) | 30% (300 out of 1000 pregnant women with pruritus having ICP) | 36 (15 to 81) women with ICP would be missed, and 70 (35 to 112) without ICP would be falsely diagnosed. | The overall accuracy found may be not applicable to a real clinical context, as most studies were at high risk of bias for patient selection and reference standard. |
| TSBA cut‐off = 10 μmol/L | Sensitivity 0.91 (0.72 to 0.98) Specificity 0.93 (0.81 to 0.97) | 839 (11) | 30% (300 out of 1000 pregnant women with pruritus having ICP) | 27 (6 to 84) women with ICP would be missed, and 49 (21 to 133) without ICP would be falsely diagnosed. | The overall accuracy found may be not applicable to a real clinical context, as most studies were at high risk of bias for patient selection and reference standard. |
| CA cut‐off = 2 μmol/L | Sensitivity 0.99 (0.33 to 1.00) Specificity 0.61 (0.23to 0.89) | 312 (4) | ‐‐‐ | ‐‐‐ | The estimate of accuracy is too imprecise (i.e. very wide CI, both for sensitivity and specificity), owing to the extreme heterogeneity between study results. Moreover, too few studies and of low quality were included for this index test. This makes impossible a judgment on applicability of the index test in a real clinical setting. |
| CA cut‐off =3 μmol/L | Sensitivity 0.94 (0.66 to 0.99) Specificity 0.82 (0.68 to 0.91) | 312 (4) | 30% (300 out of 1000 pregnant women with pruritus having ICP) | 18 (3 to 102) women with ICP would be missed, and 126 (63 to 224) without ICP would be falsely diagnosed. | The overall accuracy found may be not applicable to a real clinical context, as most studies were at high risk of bias for patient selection and reference standard. |
| GCA, all cut‐offs | Sensitivity 0.92 (0.65 to 0.99) Specificity 0.99 (0.06 to 1.00) | 630 (6) | ‐‐‐ | ‐‐‐ | The estimate of accuracy is too imprecise (i.e. very wide CI, especially for specificity), owing to the extreme heterogeneity between study results. Moreover, too few studies and of low quality were included for this index test. This makes impossible a judgment on applicability of the index test in a real clinical setting. |
| GCA cut‐off = 0.7 μmol/L | Sensitivity 0.97 (0.38 to 1.00) Specificity 0.86 (0.02 to 1.00) | 333 (5) | ‐‐‐ | ‐‐‐ | The estimate of accuracy is too imprecise (i.e. very wide CI, both for sensitivity and specificity), owing to the extreme heterogeneity between study results. Moreover, too few studies and of low quality were included for this index test. This makes impossible a judgment on applicability of the index test in a real clinical setting. |
| GCA cut‐off =1.5 μmol/L | Sensitivity 0.99 (0.08 to 1.00) Specificity 0.90 (0.75 to 0.97) | 417 (4) | ‐‐‐ | ‐‐‐ | The estimate of accuracy is too imprecise (i.e. very wide CI, especially for sensitivity), owing to the extreme heterogeneity between study results. Moreover, too few studies and of low quality were included for this index test. This makes impossible a judgment on applicability of the index test in a real clinical setting. |
| GCA cut‐off = 2 μmol/L | Sensitivity 0.99 (0.07 to 1.00) Specificity 0.97 (0.82 to 1.00) | 125 (3) | ‐‐‐ | ‐‐‐ | The estimate of accuracy is too imprecise (i.e. very wide CI, especially for sensitivity), owing to the extreme heterogeneity between study results. Moreover, too few studies and of low quality were included for this index test. This makes impossible a judgment on applicability of the index test in a real clinical setting. |
| CDCA cut‐off = 2 | Sensitivity 0.98 (0.62 to 1.00) Specificity 0.66 (0.19 to 0.94) | 312 (4) | ‐‐‐ | The estimate of accuracy is too imprecise (i.e. very wide CI, especially for specificity), owing to the extreme heterogeneity between study results. Moreover, too few studies and of low quality were included for this index test. This makes impossible a judgment on applicability of the index test in a real clinical setting. | |
| CDCA cut‐off = 3 | Sensitivity 0.75 (CI not calc) Specificity 0.94 (0.88 to 0.97) | 312 (4) | ‐‐‐ | ‐‐‐ | The CI of sensitivity was not calculable and the CI of specificity was too wide. Hence, we cannot know the precision of the estimates obtained and their applicability in a real clinical scenario. |
| CA/CDCA cut‐off = 1.8 | Sensitivity 0.89 (0.54 to 0.98) Specificity 0.92 (0.85 to 0.96) | 312 (4) | 30% (300 out of 1000 pregnant women with pruritus having ICP) | 33 (6 to 138) women with ICP would be missed, and 56 (28 to 105) without ICP would be falsely diagnosed | The cut‐off used has been chosen among the best ones, comparing Youden indexes at multiple cut‐offs applied to all studies. This may have led to biased results. Moreover, sensitivity estimate has a wide CI. This makes hard to judge the applicability the index test in a real clinical setting. |
| Subgroup analysis for TSBA cut‐off = 10 μmol/L: timing (P = 0.027) | |||||
| Onset of symptoms | Sensitivity 0.87 (0.68 to 0.96) Specificity 0.87 (0.76 to 0.94) | 839 (11) | 30% (30 out of 100 pregnant women with pruritus having ICP) | 39 (12 to 96) women with ICP would be missed, and 91 (42 to 168) without ICP would be falsely diagnosed | Sensitivity and specificity seem to be quite good if TSBA are tested when symptoms of ICP arise. However, the overall accuracy found may be not applicable to a real clinical context, as most studies were at high risk of bias for patient selection and reference standard. |
| Peak value among multiple assessments | Sensitivity 0.7 (0.24 to 0.94) Specificity 1.00 (CI not calc) | 839 (11) | ‐‐‐ | ‐‐‐ | The CI of sensitivity was too wide and the CI of specificity was not calculable. Hence, we cannot know the precision of the estimates obtained and their applicability in a real clinical scenario. |
| Delivery | Sensitivity 1.00 (1.00 to 1.00) Specificity 0.87 (0.68 to 0.95) | 839 (11) | 30% (300 out of 1000 pregnant women with pruritus having ICP) | 0 women with ICP would be missed, and 91 (35 to 224) without ICP would be falsely diagnosed | Sensitivity seems to be higher when TSBA are tested at the time of delivery, while specificity seems to be the same as when symptoms of ICP arise. However, clinicians need to diagnose ICP as soon as possible during pregnancy to monitor and strictly follow up diseased woman, in order to find possible signs of fetal distress and plan the timing of delivery. Delivery time is too late to make a diagnosis. |
| Sensitivity analysis for TSBA cut‐off=10 μmol/L: exclusion of studies with TSBA as part of reference standard | |||||
| Sensitivity 0.57 (0.49 to 0.65) Specificity 0.98 (0.53 to 1.00) | 497 (5) | 30% (300 out of 1000 pregnant women with pruritus having ICP) | 129 (105 to 153) women with ICP would be missed, and 14 (0 to 329) without ICP would be falsely diagnosed | The overall accuracy of TSBA, especially sensitivity, seems to be lower when considering only studies without TSBA inclusion in the reference standard. The accuracy of the index test in a real clinical context may be similar to this. However CIs are wide, and estimates too imprecise to judge with certainty their applicability in a real clinical setting. | |
| Sensitivity analysis for TSBA cut‐off=10 μmol/L: exclusion of case‐control studies | |||||
| Sensitivity 0.57 (0.48 to 0.66) Specificity 0.92 (0.52 to 0.99) | 436 (3) | 30% (300 out of 1000 pregnant women with pruritus having ICP) | 129 (102 to 156) women with ICP would be missed, and 56 (7 to 336) without ICP would be falsely diagnosed | The overall accuracy of TSBA, especially sensitivity, seems to be lower when excluding case‐control studies. The accuracy of the index test in a real clinical context may be similar to this. However CIs are wide, and estimates too imprecise to judge with certainty their applicability in a real clinical setting. | |
| CAUTION: The results on this table should not be interpreted in isolation from the results of the individual included studies contributing to each summary test accuracy measure. These are reported in the main body of the text of the review. | |||||
Background
Intrahepatic cholestasis of pregnancy, also known as obstetric cholestasis, is a pregnancy‐specific liver disorder, known to be possibly associated with an increased risk of severe fetal adverse events. Intrahepatic cholestasis of pregnancy was described as early as 1883 (Ahlfeld 1883), and since then many other publications have followed. However, our knowledge of the disease is still incomplete (Reyes 1997; Sinakos 2010).
The prevalence of intrahepatic cholestasis of pregnancy in pregnant women varies according to geographical location and population, as genetic and environmental factors play a role in its manifestation (Geenes 2009). Following studies from past decades, in countries of North America, Southern Europe, Asia, and Australia, the range of intrahepatic cholestasis of pregnancy was calculated to be between 0.01% and 0.1% (Reyes 1997), in some countries of South America between 1.5% and 4.0% (Reyes 1997), and in Scandinavian countries, the reported prevalence was 1.5% (Glantz 2004). Chile, Bolivia, Finland, Sweden, and Portugal are among the most affected countries in the world (Geenes 2009).
Most often the disease seems to affect women with a history of intrahepatic cholestasis during previous pregnancies (Reyes 1997) or a history of cholestasis associated with the use of oral contraceptives (Pathak 2010), with a family or personal history of biliary disease (Diken 2014), with hepatitis C viral infection (Paternoster 2002), twin pregnancies (Gonzalez 1989), or women with in vitro fertilisation pregnancies (Koivurova 2002). It is also suggested that the risk of acquiring intrahepatic cholestasis of pregnancy is higher in women over the age of 35 years (Heinonen 1999).
There are multiple factors involved in the aetiopathogenesis of intrahepatic cholestasis of pregnancy. Among the genetic factors suspected of playing a part in causing the disease are mutations in genes which encode biliary transport proteins (Dixon 2014); or mutations in bile acid receptors (such as farnesoid X receptor) (Jacquemin 1999). Likewise, among factors suspected of having a role in causing the disease are seasonal variations (with higher prevalence reported in winter) (Brites 1998b), low selenium intake, erucic acid, increased gut absorption of bacterial endotoxins, pollutants (pesticides), infections, or drugs (Geenes 2009; Diken 2014;Ozkan 2015). Hormonal factors such as oestrogens, progesterone, or their metabolites can also play a role in its development (Reyes 2008; Abu‐Hayyeh 2013). Seasonal variations and an increase in dietary selenium intake may have played a role in the decrease of the prevalence of the disease observed in Chile and in Scandinavian countries during the last few decades (Kauppila 1987; Reyes 2000a). Probably owing to these variations, the prevalence of intrahepatic cholestasis of pregnancy in Chile decreased from a range of 11.8% to 27.7% during the 1970s (the higher value observed for Araucanian ethnicity) (Reyes 1978) to the most recently reported range of 1.5% to 4.0% during the 1990s (Reyes 1997).
Some studies showed an association between intrahepatic cholestasis of pregnancy and metabolic abnormalities in affected pregnant women, such as glucose‐impaired tolerance, hyperinsulinaemia, or dyslipidaemia (Martineau 2015), with consequent increased fetal growth and possible sex‐specific increased susceptibility to an obese, diabetic phenotype of the offspring (Desai 2013; Papacleovoulou 2013).
In clinical practice, presence of pruritus during the last third of pregnancy and the 'otherwise unexplained' abnormalities in the most common liver tests, seems enough to support the suspected diagnosis of intrahepatic cholestasis of pregnancy (Green‐top Guideline No.43). However, owing to the nonspecific features of the disease, the mandatory exclusion of all other possible underlying diseases is not always easy and to ascertain the right diagnosis may not be possible until a certain time point after the delivery, when the spontaneous relief of pruritus and normalisation of liver test values occur (Beuers 2006).
The pathophysiology of intrahepatic cholestasis of pregnancy is still poorly understood. An increase in bile acid serum concentration is thought to play a primary role in the onset of the typical cholestatic pruritus (Pathak 2010); however, a correlation between the bile acid serum concentration and severity of pruritus has never been shown. Moreover, the increased passage of bile acids through the placental barrier appears to be toxic for the foetus during intrahepatic cholestasis of pregnancy (Perez 2005; Sheik Abdul Kadir 2010), and this is why obstetricians are concerned about possible fetal adverse events. In an attempt to reduce the feared risk of stillbirth, which seems to occur most often during the last weeks of pregnancy, most clinicians choose an early delivery of the baby because of the medical condition of the mother, usually at week 36 (Puljic 2015, Lo 2015). Whether the increased preterm birth rate associated with intrahepatic cholestasis of pregnancy is due to the disease itself or to its active management is still uncertain (Henderson 2014).
Therapies for intrahepatic cholestasis of pregnancy so far have been empiric, and all aimed at reducing maternal symptoms, improving results of liver tests, and reducing total bile acid concentration. Ursodeoxycholic acid (UDCA), S‐adenosylmethionine (SAMe), dexamethasone, or cholestyramine as well as vitamin K (aiming at preventing possible postpartum bleeding) are the most used interventions (Ozkan 2015).
A Cochrane Review on interventions for treating cholestasis in pregnancy concluded that there was no evidence to recommend early‐term delivery and that there was insufficient evidence to support the use of SAMe, guar gum, activated charcoal, dexamethasone, cholestyramine, Yinchenghao decoction, Danxiaoling Pill, and Yiganling, either alone, or in combination (Gurung 2013). However, the review found that UDCA seemed to improve the maternal symptom of pruritus (Gurung 2013), which is in agreement with the result of the meta‐analysis by Bacq 2012. In addition, Bacq 2012 strongly suggested that UDCA was also beneficial for the fetal outcome; however, the Cochrane Review could not reach this conclusion as the evidence was insufficient (Gurung 2013).
Total serum bile acids (TSBA), alone or in combination with serum aminotransferases, are the most often used biomarker for intrahepatic cholestasis of pregnancy in current clinical practice. They are believed to be 'the best biomarker' for the disease, both diagnostic and prognostic for possible fetal adverse events, and they have been considered appropriately used in clinical practice and 'well known' by scientific literature for years. Hence, when TSBA serum concentration is found high (usually over 10 μmol/L to 14 μmol/L) in a pregnant women claiming pruritus and suspected to have intrahepatic cholestasis of pregnancy, this is enough to start an empirical treatment with UDCA and to start monitoring the woman's and her foetus's well‐being. The attempt is to prevent the feared fetal adverse events, and decide the best timing for delivery (Diken 2014; Geenes 2014).
At first, based on these 'taken for granted' premises on TSBA, we thought of planning a systematic review to assess the accuracy of components of serum bile acid profile, especially primary bile acid concentrations (Sjovall 1966; Laatikainen 1977; Heikkinen 1983a) or total concentration of tauro‐conjugated forms (Tribe 2010). They were studied as biomarkers for intrahepatic cholestasis of pregnancy some decades ago, especially in Scandinavia and South America (Sjovall 1966; Almuna 1986; Almuna 1987b). Later studies showed interest in serum bile acid profile as more sensitive laboratory techniques to assess their serum concentration became available (Sinakos 2010; Tribe 2010; Tripodi 2015), and they were hypothesised to provide more specific information than TSBA when diagnosing the disease, defining its severity, and monitoring its response to treatment (Chen 2013). Hence we wanted to find if they could be useful to improve the current clinical pathway as add‐on or replacement for TSBA. However, while looking for studies to write the background, we realised that no authors had systematically reviewed TSBA accuracy before, and we started to suspect that their use as the best available test might not have been based on solid evidence. So we finally planned a protocol and then a systematic review on the diagnostic accuracy of both TSBA (the current test for intrahepatic cholestasis of pregnancy) together with serum bile acid profile, in order to assess the accuracy of these tests and their role in the diagnostic pathway.
We asked ourselves why and when TSBA have been introduced in clinical practice. Looking back to past studies on intrahepatic cholestasis of pregnancy, we found that intrahepatic cholestasis of pregnancy was also known as “recurrent jaundice of pregnancy”, “icterus gravidarum”, or “pruritus gravidarum” until the 1950s; and that, at first, its diagnostic criteria were mainly clinical, with commonest liver function tests performed to support clinically suspected, and exclude alternative possible, diagnoses. TSBA were introduced in intrahepatic cholestasis of pregnancy clinical pathway on the basis of some case series and case‐control studies conducted mainly in Scandinavian and South America during the 1970s and 1980s (Sjovall 1966; Laatikainen 1984; Laatikainen 1977; Heikkinen 1981; Glasinovic 1982; Shaw 1982; Heikkinen 1983a; Heikkinen 1983b; Heikkinen 1983c; Lisoni 1983). They showed that the TSBA mean serum concentration, as well as cholic acid (CA), glycocholic acid (GCA), or chenodeoxycholic acid (CDCA) mean serum concentrations in some studies, were higher in women with intrahepatic cholestasis of pregnancy, when compared to healthy pregnant women. Since then, in most clinical settings, having TSBA serum concentration over a certain cut‐off value became itself part of the definition of the disease. However the studies named before, despite being cited by most in support of TSBA use for the diagnosis of intrahepatic cholestasis of pregnancy, did not have an appropriate design to demonstrate TSBA diagnostic accuracy, and did not perform an appropriate statistical analysis (Colli 2014). They compared the mean serum concentrations between diseased and non‐diseased pregnant women, but they did not estimate bile acids' sensitivity and specificity in detecting the disease. The publications usually reported only mean values, plus or minus two standard deviations (SD), of serum bile acid concentrations in the two groups of pregnant women, and the difference found between them was statistically significant.
TSBA use in the clinical pathway of intrahepatic cholestasis of pregnancy may have been built up to much more than a merely diagnostic role when their primary role in the pathogenesis of fetal distress was hypothesised (Laatikainen 1984). This hypothesis lead to TSBA use also as prognostic marker for intrahepatic cholestasis of pregnancy, where prognosis meant fetal outcome. Due to the very short time between onset of the disease and delivery (which means fetal outcome, and so prognosis), diagnosis and prognosis were then considered together, as two faces of the same coin. One of the most important and most cited studies following this line was published by Glantz 2004. The study showed a positive correlation between TSBA serum concentration and fetal adverse events, especially when their concentration was above 40 μmol/L, with an increase of 1% of risk per additional μmol/L. Among the 505 participants with intrahepatic cholestasis, reported by Glantz and colleagues, there were three intrauterine deaths (IUDs) of foetuses observed, which meant 0.4% of the participants (two were twin pregnancies with an IUD of one twin in both cases, one of which was found to have a tight knot of the umbilical cord; only two out of three women had TSBA above 40 μmol/L). The incidence of IUD was surprisingly similar to the one observed for the healthy pregnant women group, in contrast with higher percentages reported in previously published studies. It was assumed that the low risk observed was attributable to the 'active' management adopted (i.e. induction or caesarean section a few weeks before term). Authors concluded that active management was to be performed only with pregnant women with a level of bile salts above 40 μmol/L. However, recent studies have questioned these conclusions. The review by Henderson 2014, in line with the ROCG Green‐top Guideline No.43, concluded that a correlation between IUD risk and intrahepatic cholestasis may not exist, and that there was no evidence to either support or refute active obstetric management. Moreover, a recently published prognostic systematic review by Ovadia 2019 concluded that there was an association between intrahepatic cholestasis and IUD only above 100 μmol/L of TSBA: active management should be set aside for these rare patients, while for TSBA below this serum concentration, pregnant women can probably be reassured that the risk of stillbirth is similar to that of pregnant women among the general population, provided that repeat bile acid testing is done until delivery.
Nowadays, debate on diagnosis and prognosis of intrahepatic cholestasis of pregnancy is still open, and clinicians ask for new evidence on the disease. In particular, their primary concern is to know if intrahepatic cholestasis of pregnancy determines an increased risk for fetal adverse events; and, if this is true, which monitoring methods and prognostic markers can reliably predict adverse outcomes in order to decide the best timing for delivery. However, as reliable prognosis cannot exist without reliable diagnosis, we focused our efforts on the 'first step' of diagnostic accuracy (Colli 2014): we planned a diagnostic test accuracy review instead of a prognostic accuracy review to try to summarise the best evidence available on this topic, and to provide 'state of the art' guidance over the diagnosis of intrahepatic cholestasis of pregnancy.
Target condition being diagnosed
Intrahepatic cholestasis of pregnancy is a gestation‐specific liver disorder, defined as onset of pruritus, most often from the third trimester of pregnancy, associated with abnormal liver test results or raised total serum bile acids (TSBA) or both, and spontaneous relief after delivery in the absence of other skin or liver diseases. Severe intrahepatic cholestasis of pregnancy (previously defined by TSBA greater than 40 µmol/L (Glantz 2004)) seems to be associated with an increased proportion of adverse fetal outcomes which include the following: fetal distress; preterm birth (spontaneous or iatrogenic); meconium staining of amniotic fluid; low birth weight; respiratory distress syndrome of the baby (Glantz 2004; Zecca 2006); sudden intrauterine death (IUD), possibly due to an acute anoxic event (Sepúlveda 1991); or impaired fetal cardiomyocyte function (Williamson 2001). However this last severe and feared complication has been recently associated with the disease only when TSBA are above 100 µmol/L (Ovadia 2019).
Pruritus in the absence of skin rash, with the exception of scratching excoriations, could be the only presenting symptom of the disease.
Despite the many available tests, an accurate and early diagnosis of intrahepatic cholestasis of pregnancy can be difficult: it shares some of its clinical features and laboratory findings with other skin diseases (e.g. stretch marks of pregnancy; eczema; pruritic urticarial papules and plaques of pregnancy; infectious, allergic, or immunological skin disorders, etc.) and liver diseases (e.g. viral and autoimmune hepatitis, tumours of hepatobiliary tract, bile stones of the biliary tree, etc.) (Diken 2014); conditions which may lead to icterus (e.g. severe hypoglycaemia, some types of encephalopathy, disseminated intravascular coagulation, etc.); obstetric‐specific benign diseases (e.g. pruritus gravidarum, defined as idiopathic onset of pruritus during pregnancy but with normal liver tests, or asymptomatic hypercholanaemia of pregnancy, defined as serum bile acids level above the upper normal limit without symptoms) (Castaño 2006); and also more serious diseases (e.g. pre‐eclampsia, haemolysis‐elevated liver enzymes‐low platelet count syndrome, or acute fatty liver disease) (Bacq 2011).
Even if most clinicians with the least suspicion of the disease initiate an empiric treatment with UDCA, prophylactic vitamin K, or antihistaminics (or also dexamethasone if pruritus is unbearable), the diagnosis can only be confirmed when the spontaneous relief of symptoms and signs after delivery occur within the usual 48 hours or at most eight weeks (Geenes 2009). In extremely rare occasions, women may have symptoms for longer periods of time (Olsson 1993; Aytaç 2006). If the symptoms or signs related to suspected intrahepatic cholestasis of pregnancy do not disappear within one month, clinicians should consider other differential diagnoses; and further investigations are mandatory (Bacq 2011).
Index test(s)
Total serum bile acids
Total serum bile acids (TSBA) are present at very low concentration (below 5 µmol/L) in the systemic circulation in normal fasting status, depending mostly on absorption from the gut (in turn dependent upon bile canalicular secretion) and hepatic extraction (Walker 2002). The usefulness of TSBA measurements in serum for a variety of liver diseases has been debated (Cravetto 1985; Azer 1997), and almost their only accepted use in current clinical practice is for the diagnosis of intrahepatic cholestasis of pregnancy (see Background).
The most often used cut‐off value of TSBA concentration for the diagnosis of intrahepatic cholestasis of pregnancy is around 10 µmol/L to 14 µmol/L (Diken 2014). However, there is a certain variability in the cut‐off values provided in the literature because of the method of measurement, fasting status, population studied, or gestational age at diagnosis (Pathak 2010). In addition, an early finding of normal levels of bile salts during the course of the disease does not exclude the diagnosis of intrahepatic cholestasis of pregnancy, while isolated elevation of bile salts in asymptomatic pregnant women may occur. However, this finding is uncommon and stands most probably for asymptomatic hypercholanaemia of pregnancy (Tripodi 2015). This could be a reason why the high diagnostic accuracy attributed to total serum bile acids for intrahepatic cholestasis of pregnancy may be questionable (Brites 1998b; Diken 2014).
Serum bile acid profile
The serum bile acid profile is composed of concentrations of individual primary bile acids (cholic acid (CA) and chenodeoxycholic acid (CDCA)), secondary bile acids (deoxycholic (DCA), lithocholic (LCA), ursodeoxycholic acid (UDCA)), and their individual or total glyco‐conjugated (G‐c) and tauro‐conjugated (T‐c) forms (Figure 1), including ratios of some of them (CA/CDCA, G‐c/T‐c), measured in µmol/L. As the measurement of the individual components of the serum bile acid profile for the diagnosis of intrahepatic cholestasis of pregnancy has never been introduced in clinical practice, universally accepted cut‐off values still do not exist.

The current available laboratory methods for bile acid analysis (total or single components of serum bile acid profile) are enzyme assay, radioimmunoassay, enzyme immunoassay, and chromatographic methods such as thin‐layer chromatography, gas chromatography, high performance liquid chromatography, supercritical fluid chromatography, and capillary electrophoresis, coupled with mass spectrometry, fluorometry, UV detection, or electrochemical detection methods. This is why we expected to have heterogeneous results depending on the method used.
Clinical pathway
We describe the current clinical pathway for the diagnosis of intrahepatic cholestasis of pregnancy following the Green‐top Guideline No.43, published by Royal College of Obstetricians and Gynaecologists. Figure 2 presents a schematic overview of the current clinical pathway.

Clinical diagnostic pathway for the diagnosis of intrahepatic cholestasis of pregnancy
Clinical suspicion of intrahepatic cholestasis of pregnancy usually begins from the third — or at least the second — trimester of pregnancy with an onset of mild to severe pruritus, frequently generalised on the palms and soles, getting worse both at night and with advancing gestation (Kenyon 2001). In severe cases, it can also affect the ears, the eyelids, and even the oral cavity (Reyes 1997). Some studies describe instances of pruritus also from earlier stages of pregnancy (Brites 1998a; Keitel 2006; Hubschmann 2016).
After collecting all information concerning pruritus characteristics, it is mandatory to assess family and personal history, recording all other symptoms, and to carry out a physical examination to exclude or identify other plausible causes of pruritus. For example, in the presence of dark urine, pale stool, jaundice, steatorrhoea or right upper abdominal quadrant pain, alternative causes of cholestasis (e.g. bile stones of the biliary tree, tumours of hepatobiliary tract) or hepatitis of any aetiology should be suspected, as typical cholestatic symptoms in intrahepatic cholestasis of pregnancy are rare. Moreover, constitutional symptoms (insomnia, fatigue, anorexia, malaise, or abdominal pain) are not usually present (Hepburn 2008; Kondrakiene 2008;Mays 2010). Raised blood pressure, change in vision, headache, and epigastric abdominal pain may suggest pre‐eclampsia or haemolysis‒elevated liver enzymes‒low platelet count syndrome. Any kind of rash or swelling may suggest an infectious, allergic or immunologic skin disorder, while uterine contractions, or vaginal discharges should be carefully evaluated to exclude possible obstetric complications (Diken 2014). Last but not least, alcohol problems should be excluded. A laboratory test should follow, beginning with full blood count, liver function tests, urinary check, kidney function test, amylase, and lipase. Then depending on the suspected differential diagnoses, specific tests should be performed. In case of suspicion of immunological diseases (e.g. primary biliary cirrhosis, primary sclerosing cholangitis, or other autoimmune diseases), clinicians are advised to test nuclear, smooth muscle, mitochondrial, and liver–kidney microsomal autoantibodies, or other organ‐specific autoantibodies. In case of suspicion of liver infectious diseases, clinicians are advised to perform blood serology for the most common kind of hepatotropic viral agents such as hepatitis A, B, C, D, or E viruses, cytomegalovirus, and Epstein‐Barr virus. Also iron balance tests (ferritin, transferrin, saturation of transferrin) and copper metabolism biomarkers should be considered. Total serum bile acids are tested when intrahepatic cholestasis of pregnancy is suspected.
Among the imaging techniques, ultrasound examination of the abdomen focusing on the liver and biliary tree should be performed; and if it cannot rule out other cholestatic diseases, then magnetic resonance of the biliary tree or of the abdomen could be used to exclude possible causes of extrahepatic cholestasis such as choledochal stones, tumours of the biliary tree, or tumours of the pancreas (Boregowda 2013).
Liver biopsy is indicated only in jaundiced women without pruritus, beginning of symptoms before week 20 of gestation, and sustained abnormal laboratory findings beyond eight weeks after delivery (Boregowda 2013). Liver biopsy is not indicated for the diagnosis of intrahepatic cholestasis of pregnancy because of the risks associated with the procedure; but if performed, it may reveal pure cholestasis, with bile plugs sometimes visible in the hepatocytes and canaliculi (Bacq 2014).
An ideal method to predict fetal outcome does not exist, but obstetric examination with ultrasounds could help in ruling out high risk conditions of pregnancy and in assessing the well‐being of the foetus, while a 'non‐stress test' through cardiotocography (CTG) and biophysical profile (BPP) could also provide information about the well‐being of the baby at the time of the investigation (Diken 2014). If any signs of fetal distress are noticed, or if total serum bile acid shows an increment without benefit from UDCA therapy, the obstetrician may decide for an early delivery of the baby to prevent the feared fetal adverse events which seem to be related with intrahepatic cholestasis of pregnancy.
Prior test(s)
Liver biochemistry or liver function tests are commonly performed when intrahepatic cholestasis of pregnancy is suspected, but their normal upper limits in pregnant women are still discussed (Mullally 2002). Among the most common liver tests are serum aminotransferases (altered in up to 60% of women, but with lower values when compared to other aetiologies of liver disease such as viral hepatitis) (Diken 2014); gamma‐glutamyl transpeptidase (raised in less than one‐third of women with intrahepatic cholestasis of pregnancy) (Floreani 2006); alkaline phosphatases (not so reliable during pregnancy as its placental synthesis leads to physiologically increased values) (Bacq 1996); serum or urinary total, conjugated and unconjugated bilirubin (raised in about 25% of women, but with lower values when compared to other cholestatic diseases) (Reyes 1992); fibrinogen and prothrombin time. The prothrombin can be altered in case of severe liver dysfunction or vitamin K malabsorption due to cholestasis, leading to an increased risk of postpartum bleeding, but this is a very rare finding in intrahepatic cholestasis of pregnancy (Reyes 1992). Some women will have pruritus for days or weeks before the development of abnormal liver tests. In pregnant women with persistent unexplained pruritus, liver tests should be taken every week or two. If clinical evidence and liver tests show a pattern consistent with a viral or autoimmune aetiology (e.g. high elevation of serum aminotransferases), further testing is needed (Green‐top Guideline No.43).
Ultrasound examination of the liver and biliary tract could help to rule out other causes of liver disease or of cholestasis, especially extrahepatic cholestasis (e.g. stones or tumours of the biliary tree) (Boregowda 2013).
Role of index test(s)
The role of an index test, if related to an existent test within a diagnostic clinical pathway, can be one of replacement (substitution of the existent test), triage (addition before the existent test), or add‐on (addition after the existent test) (Bossuyt 2006).
Total serum bile acids (TSBA) are the existing test for the diagnosis of intrahepatic cholestasis of pregnancy. They are usually assessed after the most common liver tests described above when intrahepatic cholestasis of pregnancy is suspected. However, even if they are the existent test for intrahepatic cholestasis of pregnancy, a systematic review of their diagnostic accuracy has never been done, so we wanted first to assess their accuracy before looking for a test which may replace them or be added (add‐on).
Components of serum bile acid profile (cholic acid (CA), glycocholic acid (GCA), chenodeoxycholic acid (CDCA), cholic/chenodeoxycholic acid ratio (CA/CDCA), deoxycholic acid (DCA), lithocholic acid (LCA), ursodeoxycholic acid (UDCA), total glyco‐conjugated bile acids (G‐c), total tauro‐conjugated bile acids (T‐c), total glyco‐conjugated bile acids/total taurine‐conjugated bile acid ratio (G‐c/T‐c)) could be considered as add‐on tests after TSBA. We calculated the overall diagnostic accuracy of some we wanted to consider as a replacement test of TSBA or add‐on tests after TSBA to improve the current clinical pathway.
Alternative test(s)
As alternative tests we can consider those that can be used to assess intrahepatic cholestasis of pregnancy, and all other serum and urinary biochemical tests or imaging techniques which can lead to exclusion of possible differential diagnosis (see Clinical pathway).
However, we also found some biomarker tests which were studied for their accuracy in diagnosing intrahepatic cholestasis of pregnancy, but these biomarker tests were mostly performed in a research setting. Among them are urinary progesterone metabolites, serum autotaxin activity, and glutathione S‐transferase. Urinary progesterone sulphated metabolites were found to be directly related to the pathogenesis of the disease and were studied for the diagnosis of intrahepatic cholestasis of pregnancy as well as for monitoring response to its treatment (Meng 1997; Reyes 2000b; Abu‐Hayyeh 2013). Serum autotaxin activity was shown to correlate with cholestasis‐associated pruritus and was considered able to distinguish intrahepatic cholestasis of pregnancy from other pruritic disorders of pregnancy or pregnancy‐related liver diseases (Kremer 2015). Glutathione S‐transferase is a detoxification liver enzyme with ubiquitous distribution in hepatic cells and its blood concentration was shown to rapidly increase in case of acute liver damage (Ozer 2008). Because of this, glutathione S‐transferase could be an earlier and more accurate indicator of hepatic dysfunction than liver aminotransferases or total bile acids alone (Dann 2004; Joutsiniemi 2008).
Rationale
Intrahepatic cholestasis of pregnancy is considered in clinical practice a high‐risk condition in pregnant women, mainly because of the increased risk of fetal adverse events. Currently, total serum bile acids are the most used diagnostic and prognostic marker for the disease, while serum bile acid profile components are less commonly used. A systematic review of diagnostic test accuracy of total serum bile acids and serum bile acid profile components has never been published. Thus, to assess the accuracy of total serum bile acids and serum bile acid profile components, independently or in combination, and to define which index test (or combination of index tests) could be better for use, may help to improve the current clinical pathway and clinicians' approach to the disease, leading to a direct benefit on the outcomes of both pregnant women and their babies. After that, a prognostic accuracy review to assess the reliability of our index tests as prognostic markers for the disease, could become feasible.
Objectives
To assess and compare, independently or in combination, the diagnostic accuracy of total serum bile acids or serum bile acids profile, or both, for the diagnosis of intrahepatic cholestasis of pregnancy in pregnant women, presenting with pruritus.
Secondary objectives
To define the optimal cut‐off values for components of serum bile acid profile; to investigate possible sources of heterogeneity (see below in Investigations of heterogeneity paragraph).
Methods
Criteria for considering studies for this review
Types of studies
We included studies that evaluated the diagnostic accuracy of the index tests for the diagnosis of intrahepatic cholestasis of pregnancy and used the proper reference standards (see below), irrespective of publication status, language, and prospective or retrospective design. We considered studies of cross‐sectional design including participants with clinical suspicion of intrahepatic cholestasis of pregnancy, as well as studies of case‐control design that compared people with known intrahepatic cholestasis of pregnancy to matched control (pregnant women without evidence of intrahepatic cholestasis of pregnancy participants).
Participants
Pregnant women of any age, recruited in any clinical setting. They should have been tested by at least one of the index tests and they should have undergone the reference standard (see below).
In cross‐sectional studies, participants should have been pregnant women with suspicion of having the target disease (e.g. presenting with new onset of pruritus during pregnancy).
In case‐control studies, the case group should have included pregnant women in which intrahepatic cholestasis of pregnancy had been confirmed through the reference standard (see below), while the control group should have comprised asymptomatic or symptomatic pregnant women in which the target condition had been ruled out with clinical evaluation and biochemical tests.
Index tests
The index tests we considered are total serum bile acids (TSBA) and the following components of serum bile acid profile.
-
Cholic acid (CA)
-
Glycocholic acid (GCA)
-
Chenodeoxycholic acid (CDCA)
-
Cholic/chenodeoxycholic acid ratio (CA/CDCA)
-
Deoxycholic acid (DCA)
-
Lithocholic acid (LCA)
-
Ursodeoxycholic acid (UDCA)
-
Total glyco‐conjugated bile acids (G‐c)
-
Total tauro‐conjugated bile acids (T‐c)
-
Total glyco‐conjugated bile acids/total taurine‐conjugated bile acid ratio (G‐c/T‐c)
The measurements of these index tests are performed in laboratories with different automated techniques (see Background). TSBA are commonly measured by almost all clinical laboratories, while techniques to measure components of serum bile acid profile are currently available only in clinical research settings.
Target conditions
Intrahepatic cholestasis of pregnancy defined as pruritus with onset during pregnancy associated with abnormal liver tests, both unexplained by other skin or liver diseases, and which resolves after delivery (Geenes 2009; Green‐top Guideline No.43).
Reference standards
The obstetric clinical evaluation in which the follow‐up after delivery is included. The clinical evaluation is the final judgment of the clinician who takes into account clinical assessment of the signs and symptoms suggestive for intrahepatic cholestasis of pregnancy and the presence of any otherwise unexplained, persistent abnormalities of AST, ALT, or bilirubin levels until delivery. The follow‐up after delivery is the assessment of spontaneous resolution of symptoms and normalisation of liver tests (i.e. liver test measurements below upper normal limits) within at least 48 hours or eight weeks at most.
For the final diagnosis, the obstetric evaluation could be enough when differential diagnoses can be easily ruled out. For difficult clinical cases, an evaluation and consensus with an hepatologist could be useful.
Search methods for identification of studies
Electronic searches
We searched the Cochrane Hepato‐Biliary Group Controlled Trials Register (maintained and searched internally by the CHBG Information Specialist via the Cochrane Register of Studies Web; 6 May 2019), the Cochrane Hepato‐Biliary Group Diagnostic Test Accuracy Studies Register (maintained and searched internally by the CHBG Information Specialist via the Cochrane Register of Studies Web; 6 May 2019), the Cochrane Library (2019, Issue 5), MEDLINE Ovid (1946 to 6 May 2019), Embase Ovid (1974 to 6 May 2019), Science Citation Index Expanded (Web of Science, 1900 to 6 May), Conference Proceedings Citation Index – Science (Web of Science; 1990 to 6 May 2019), BIOSIS (Web of Science; 1969 to 6 May 2019), and CINAHL (EBSCOhost; 1981 to 6 May 2019) (Royle 2003).
We searched Chinese literature through Chinese CKNI (1979 to May 2019) and VIP (1989 to May 2019) with the help of Maoling Wei from the Chinese Cochrane Centre.
As the highest prevalence of the disease is observed in Chile, on contacting some South American expert authors we were advised to search thoroughly two local databases: Literatura Latino‐Americana e do Caribe em Ciências da Saúde [Literature in the Health Sciences in Latin America and the Caribbean] (LILACS) and Scientific Electronic Library Online (SciELO) (both searched 6 May 2019).
We also searched through some field‐databases suggested by the Royal College of Obstetricians and Gynaecologists: the Evidence Search: Health and Social Care by NICE; the World Health Organization (WHO) Reproductive Health Library (RHL); and the Turning Research into Practice database (TRIP) (6 May 2019).
We applied no restrictions with regard to language or document type.
We give the search strategies with the time spans of the searches in Appendix 1.
Searching other resources
We identified additional references by handsearching the references of articles, meta‐analyses, and evidence‐based guidelines retrieved from the computerised databases, and the references suggested by the 'intrahepatic cholestasis of pregnancy support' web site (www.icpsupport.org/papers.shtml), in order to identify other potentially relevant studies for inclusion in our review.
We searched also for dissertations and theses through ProQuest Dissertations & Thesis Database and Index to Theses in Great Britain and Ireland, and grey literature through OpenSIGLE and National Technical Information Service (NTIS).
We searched on‐line trial registries such as ClinicalTrials.gov, European Medicines Agency (EMA) (www.ema.europa.eu/ema), WHO International Clinical Trial Registry Platform (www.who.int/ictrp), the Food and Drug Administration (FDA) (www.fda.gov), and pharmaceutical company sources.
Data collection and analysis
We followed the available guidelines provided in the Cochrane Diagnostic Reviewer's Handbook (DTA Handbook 2010).
Selection of studies
Two authors (CM, TS) independently conducted the first selection of studies by reading titles or abstracts or both of the identified studies. The two authors independently reviewed the full texts for eligibility, assessing the fulfilment of the inclusion criteria. During this second selection stage, when the two authors found multiple publications of one study fulfilling the inclusion criteria, they grouped them together and they screened these publications for complementary data or checked them for discrepancies. When in doubt, the review authors emailed study authors to ensure that publications referred to the same study and to check the correctness of data.
We solved disagreements by discussion or by consulting a third author (CG, GC, or DN).
Data extraction and management
Two authors (CN, TS) independently completed data extraction from each included study. They solved disagreements by discussion or by consulting a third author (CG, GC, or DN).
They retrieved the following study data.
-
General information: title, journal, year, publication status, study design (cross‐sectional or case‐control, prospective or retrospective, single centre or multicentre), time span considered.
-
Total number of women screened for inclusion in the study, number of pregnant women included, and prevalence of the disease in the considered population.
-
Baseline characteristics: age, ethnicity, country, if pregnancies were twin or singleton, week of pregnancy in which the index tests were performed, disease severity if reported, and concurrent medications used.
-
If most common liver tests were performed, and their findings.
-
Index tests (total serum bile acids or any component of serum bile acid profile): technique used for the measurement, fasting or postprandial status of women while the test was performed, predefined cut‐off values for the diagnosis if reported.
-
Follow‐up after delivery: length of follow‐up, length of time needed for assessment of the spontaneous relief of symptoms and normalisation of liver tests.
-
Number of true positive, true negative, false positive, and false negative comparing index test results with reference standard.
-
Information related to the QUADAS‐2 items for evaluation of the risk of bias of the studies (Whiting 2011).
The two authors summarised data from each study in two‐by‐two tables (false positive (FP), false negative (FN), true positive (TP), true negative (TN)) and entered the data into Review Manager 5 (Review Manager 2014).
Missing data
When information on any of the FP, FN, TP, or TN diagnostic test values were missing, we attempted to contact the authors of the included studies in order to obtain missing information. We also contacted authors if other types of information needed for this review was missing, especially when the publication was in the form of an abstract or poster presentation. We used Excel and Review Manager 5 to add data required for statistical analyses (Review Manager 2014).
We contacted primary authors for missing data by e‐mail. In absence of a reply, we sent a second e‐mail a week after, and when possible we tried to contact the study authors by telephone. We acknowledged study authors for providing missing data, and we created references to unpublished studies when such study data were obtained through personal communication (see notes under each study in Characteristics of included studies).
We excluded the studies when we could not obtain the data needed for the two‐by‐two tables.
Assessment of methodological quality
Design flaws in test accuracy studies can produce biased results (Lijmer 1999; Whiting 2004; Rutjes 2006). In addition, evaluation of study results is quite often impossible due to incomplete reporting (Smidt 2005).
To limit the influence of different biases, two review authors independently assessed the risk of bias of the included studies using four QUADAS‐2 domains (Whiting 2011). A third review author (GC) checked the extracted information and the risk of bias assessments. We resolved disagreements by discussion or by consulting a fourth review author (CG or DN). We contacted study authors if information on methodology was lacking in order to assess correctly the risk of bias of the studies.
We used the domains in Appendix 2 to address aspects of study quality involving the participant selection, index test, reference standard, and flow and timing. We classified a study at low risk of bias only if classified at low risk of bias in all the four domains; otherwise, we considered the study at high risk of bias (Jüni 1999; Whiting 2005).
We used tabular and graphical displays to summarise QUADAS‐2 assessments.
Statistical analysis and data synthesis
We carried out the analyses following guidelines in Chapter 10 (Analysing and Presenting Results) of the Cochrane Diagnostic Reviewer's Handbook (DTA Handbook 2010). We used Review Manager 5 software for analyses and forest plots (Review Manager 2014).
We built two‐by‐two tables for each primary study and for all the index tests considered. We estimated sensitivity and specificity, with their 95% confidence intervals (CI). We presented data in coupled forest plots, showing sensitivities and specificities of each study, with their 95% CI. In forest plots, studies were ordered according to study authors’ names or, when heterogeneity analysis was performed, according to the source of heterogeneity.
We plotted the studies in summary Receiver Operating Characteristic (ROC) curves when studies with different cut‐offs were considered together, or we represented the studies as circles in the ROC space when the studies included in the analysis had the same cut‐off, reporting sensitivity against specificity. The size of circles in the ROC space are proportional to the number of participants included in the study. We represented the 95% confidence regions of mean specificity and sensitivity as areas surrounding the circles.
When individual participant data were available, or when studies used a common cut‐off, we attempted to meta‐analyse data at different cut‐offs and, when possible, to obtain multiple estimates of accuracy for the same index tests.
When the included primary studies reported accuracy data using different cut‐off values, we adopted the hierarchical summary ROC model (HSROC) to pool data and to estimate a summary ROC (SROC) curve. When a sufficient number of primary studies reported data using a common cut‐off value, we performed meta‐analyses using the bivariate model, and we provided the estimate of the summary operating point (mean sensitivity and mean specificity) at that cut‐off value.
For primary studies that reported accuracy results for more than one cut‐off point, we reported sensitivities and specificities for all of the cut‐off points, but we used a single cut‐off point for each study in HSROC or bivariate model analysis. We based our choice on the cut‐off value most commonly reported, or in case a study did not report data on the most commonly used cut‐off, we based our choice on the value corresponding to the maximum of the Youden's index (sensitivity + specificity − 1),
We made direct and indirect comparisons between the considered index tests by adding a covariate term for the index test to the bivariate or HSROC model, as appropriate. We assessed the significance of differences in test accuracy by using the log‐likelihood ratio test for comparison of models with and without the index test covariate term. We considered P values less than 0.05, two‐sided, as statistically significant.
We used SAS statistical software, release 9.4 (SAS Institute Inc., Cary, NC, USA) to perform all statistical analyses.
Investigations of heterogeneity
For the eleven studies assessing TSBA diagnostic accuracy with cut‐off equal to 10 μmol/L, we investigated the following sources of heterogeneity.
-
Laboratory technique used to measure the index test
-
Therapy (if study patients underwent therapy with UDCA or not)
-
Timing of measurement of index test (onset of symptoms, peak values among multiple assessments during pregnancy, immediately before delivery)
We investigated heterogeneity first by visual inspection of the paired forest plots of sensitivities and specificities for each index test. Then, we performed a formal analysis by adding covariates to the bivariate or HSROC model.
Sensitivity analyses
We performed the following sensitivity analysis.
-
Excluding all studies with case‐control design
-
Excluding studies in which the index test was part of the reference standard
Assessment of reporting bias
We decided not to assess publication bias.
'Summary of findings' table
To construct a 'Summary of findings' table for presenting the key findings of our review, we used the approach developed by the Cochrane GRADEing group (formerly, the Cochrane Applicability and Recommendations Methods Group) which is in conformity with QUADAS 2 (see Chapter 11, DTA Handbook 2013; Whiting 2011).
Results
Results of the search
We identified a total of 5073 references. We identified 3511 references through electronic searches of the Cochrane Hepato‐Biliary Group Controlled Trials Register (n = 22) and the Cochrane Hepato‐Biliary Group Diagnostic Test Accuracy Studies Register (n = 0), the Cochrane Library (n = 115), MEDLINE Ovid (n = 770), Embase Ovid (n = 1409), Science Citation Index Expanded and Conference Proceedings Citation Index – Science (n = 592), BIOSIS Previews (n = 539), and CINAHL (EBSCO) (n = 64). We also identified 1043 references through the two Chinese databases CNKI and VIP, but we only considered nine were relevant; these were sent to us by the Chinese colleague who performed the search, and 242 references through electronic searches of the two South American databases LILACS and SciELO. In addition, we identified 277 references through electronic search of Evidence search: Health and Social Care, RHL, TRIP, and handsearching ProQuest Dissertations & Thesis Database, Index to Theses in Great Britain and Ireland, OpenSIGLE, NTIS, on‐line trials registers, conference proceedings and references taken from other publications and found to be potentially relevant. After exclusion of 1324 duplicates, 2715 publications were screened for inclusion. We excluded 2644 publications at a first selection, all by reading the title and abstract; and 259 publications by reading also the full text. Seventy‐one full‐text articles seemed to fulfil the inclusion criteria, and we finally excluded 55, most of them only after contacting study authors in order to bring together more information.
We included 16 relevant studies in this systematic review. Figure 3 presents a schematic overview of the study selection process.

Study selection flow diagram.
References of included studies, ordered by study ID, are given in Included studies.
Additional Table 1 provides the main published or unpublished (given by email from study authors) characteristics of the included studies. For more detailed information on each study's characteristics, comprising the information obtained by email from authors, see Characteristics of included studies.
| Author | Year | Country | # | Study design | ICP definition | Index test(s) | Cut‐off (μmol/l)a | Laboratory technique | Timing |
| Almuna R | 1986 | Chile | 241 | case‐control | Only clinical/with FU | GCA | 0,7 | Immunoenzymatic assay | Onset |
| Almuna R | 1987 | Chile | 22 | case‐control | Clinical + lab/with FU | GCA | 0,7 | Immunoenzymatic assay | Delivery |
| Brites D * | 1998 | Portugal | 77 | case‐control | Clinical + lab + TSBA/with FU | TSBA | 10 | Enzymatic fluorimetric | Onset |
| CA§ | not given | HPLC | Onset | ||||||
| CDCA§ | not given | HPLC | Onset | ||||||
| GCA | not given | HPLC | Onset | ||||||
| CA/CDCA§ | not given | ||||||||
| Brites D * | 1998 | Portugal | 14 | case‐control | Clinical + lab + TSBA/with FU | TSBA | 10 | Enzymatic fluorimetric | Delivery |
| CA§ | not given | HPLC | Onset | ||||||
| CDCA§ | not given | HPLC | Onset | ||||||
| GCA | not given | HPLC | Onset | ||||||
| CA/CDCA§ | not given | ||||||||
| Gonzalez MC | 1989 | Chile | 62 | Cross‐sectional | Clinical + lab + TSBA/with FU | TSBA | 10 | Enzymatic assay | Onset |
| Guducu N* | 2013 | Turkey | 33 | case‐control | Clinical + lab + TSBA/with FU | TSBA | 10 | Enzymatic assay | Peak |
| Huang W* | 2009 | USA | 193 | Cross‐sectional | Clinical + lab/with FU | TSBA | 10 | LC‐MS | Onset |
| CA | not given | LC‐MS | Onset | ||||||
| CDCA | not given | LC‐MS | Onset | ||||||
| CA/CDCA | 3,4 | ||||||||
| Jiang Y | 2012 | China | 700 | case‐control | Clinical + lab + TSBA/with FU | TSBA | 11 | Enzymatic colorimetric | Onset |
| Kowalska‐Kanka A* | 2013 | Poland | 73 | case‐control | Clinical + lab + TSBA/with FU | TSBA | 11 | Enzymatic colorimetric | Peak |
| Laatikanen T | 1984 | Finland | 177 | case‐control | Clinical + lab/with FU | TSBA | 10 | Enzymatic assay | Delivery |
| Lang T* | 2012 | UK | 66 | Cross‐sectional | Clinical + lab/with FU | TSBA | 14 | Enzymatic colorimetric | Onset |
| Lunzer M | 1986 | Australia | 297 | case‐control | Clinical + lab/with FU | GCA | 1,5 | Radioimmuno assay | Onset |
| Roger D* | 1994 | France | 34 | case‐control | Only clinical/with FU | TSBA | 6 | Enzymatic assay | Onset |
| GCA | 0,7 | Immunoenzymatic assay | Onset | ||||||
| Sjovall K* | 1966 | Sweden | 28 | case‐control | Only clinical/with FU | TSBA | not given | Gas‐liquid chromatography | Onset |
| CA | not given | Gas‐liquid chromatography | Onset | ||||||
| CDCA | not given | Gas‐liquid chromatography | Onset | ||||||
| CA/CDCA§ | not given | ||||||||
| Sun Y | 2011 | China | 105 | case‐control | Clinical + lab/with FU | TSBA | 20 | Enzymatic colorimetric | Onset |
| Tripodi V*b | 2006‐2015 | Argentina | 83 | case‐control | Clinical + lab + TSBA/with FU | TSBA | 10 | Enzymatic assay | Onset |
ICP ‐ Intrahepatic cholestasis of pregnancy
*Studies with individual participant data (provided in the publications or received from authors by email)
§ The index test was calculated by review authors on the basis of individual participant data. See full‐text for explanations
aCut‐offs given in this table are those provided in the publications
bWe refer to all publications given under the study ID "Tripodi 2015" (see "References of included studies")
“Clinical”: based on symptoms and physical examination
“lab”: based on laboratory exams (e.g. liver tests, viral serology, autoimmunity biomarkers)
“with FU”: comprising follow‐up after delivery
“without FU”: follow‐up after delivery not performed
We retrieved individual participant data (marked with “*” in Additional Table 1) of nine included studies from their authors by email personal correspondence, while two studies already contained individual participant data in the publication. This allowed us to consider also the index tests performed by the study authors but not published, and to calculate the diagnostic accuracy of the index tests performed in these studies at cut‐offs different from the published ones; (for more detailed information on unpublished data, as well as on how diagnostic accuracy of unpublished index tests was calculated, see Characteristics of included studies). This is the reason why we finally had 13 studies assessing the diagnostic accuracy of TSBA, 4 studies of CA and CDCA, 4 studies of CA/CDCA, and 6 studies of GCA.
Some of the studies assessing the diagnostic accuracy of the components of serum bile acid profile analysed in our review assessed also the diagnostic accuracy of LCA, DCA, UDCA, G‐c, T‐c, and G‐c/T‐c. They reported that T‐c acids increased in the third trimester of pregnancy in women with intrahepatic cholestasis of pregnancy, and that G‐c/T‐c of less than 1.0 μmol/L had high diagnostic accuracy. Another finding was that LCA was higher in serum of women with intrahepatic cholestasis of pregnancy, while UDCA was lower (Brites 1998b; Brites 1998c; Tripodi 2015). However, as the number of studies assessing the diagnostic accuracy of LCA, DCA, UDCA, G‐c, T‐c, and G‐c/T‐c was three or fewer for each, we found it useless to meta‐analyse their data, even when taking into account the studies for which we had individual participant data, owing to statistical limitations and the high risk of random errors.
We could not analyse the accuracy of combinations of the index tests, defined in our protocol as TSBA plus any component of serum bile acid profile, as none of the included studies measured these combinations.
For our analysis of TSBA, irrespective of the cut‐off values used to assess the TSBA accuracy, we had data from 1645 participants; and with TSBA serum concentration of 10 μmol/L as diagnostic cut‐off value, we had data from 839 participants. Thanks to the availability of individual participant data for all studies assessing CA, GCA, CDCA, and CA/CDCA, the number of participants for each test was the same for every cut‐off considered: 312 participants for CA, 630 for GCA, 312 for CDCA, and 312 for CA/CDCA.
Methodological quality of included studies
Figure 4 shows the risk of bias for each study across each QUADAS‐2 domain and Figure 5 shows the overall risk of bias assessment for all included studies across each QUADAS‐2 domain.

Risk of bias and applicability concerns summary: review authors' (CM and TS) judgements about each domain for each included study.
N.B. The empty cells stand for the test, not performed in the study.

Risk of bias and applicability concerns graph: review authors' judgements about each domain presented as percentages across included studies
We assessed only one study at low risk of bias in all four QUADAS‐2 domains (Huang 2009). The most biased domains were the patient‐sampling domain and the reference standard domain. We judged the patient‐sampling domain at high risk of bias in most cases because of the case‐control design, as it excludes all 'difficult to diagnose' patients. We judged the reference standard domain at high risk of bias in most studies because of the inclusion of the index test TSBA in its definition. For applicability concerns, most studies had a high concern regarding patient selection, because the characteristics of selected participants (exclusion of 'difficult to diagnose' patients from cases group; absolutely asymptomatic and healthy pregnant women, often in a very early stage of pregnancy in control groups) excluded them as representative for clinical practice. Only five studies were representative for all domains (Laatikainen 1984; Almuna 1986;Roger 1994;Jiang 2012;Lang 2012).
For more detailed information on each study's quality assessment according to QUADAS‐2, see Characteristics of included studies.
Findings
In this review, we estimated the overall accuracy of TSBA and some components of serum bile acid profile (CA, GCA, CDCA and CA/CDCA) for the diagnosis of intrahepatic cholestasis of pregnancy. We did not perform the analysis of the remaining components of serum bile acid profile (i.e. LCA, DCA, UDCA, G‐c, T‐c, G‐c/T‐c) as there were too few data available.
Total serum bile acids (TSBA)
TSBA was the index test with the highest number of studies assessing its accuracy (Figure 6). The commonest cut‐off value used by studies was 10 μmol/L. Hence, after a first analysis considering all 13 studies (Figure 7), we analysed together only the 11 studies for which estimates of accuracy were available for a cut‐off of 10 μmol/L (Figure 8). Considering only studies using a cut‐off of 10 μmol/L, or those which it was possible to apply this cut‐off, we found the overall sensitivity and specificity estimated for TSBA to be respectively 0.91 (95% CI 0.72 to 0.98) and 0.93 (95% CI 0.81 to 0.97) (Figure 9).

Forest plot of total serum bile acids (TSBA) (all studies) for the diagnosis of intrahepatic cholestasis of pregnancy

Summary receiver operating characteristic (ROC) plot of total serum bile acids (TSBA) (all studies) for the diagnosis of intrahepatic cholestasis of pregnancy. Statistical method used: HSROC (hierarchical summary ROC) model.

Forest plot of total serum bile acids (TSBA) with cut‐off = 10 µmol/L for the diagnosis of intrahepatic cholestasis of pregnancy

Summary receiver operating characteristic (ROC) plot of of total serum bile acids (TSBA) with cut‐off = 10 µmol/L for the diagnosis of intrahepatic cholestasis of pregnancy. Statistical method used: bivariate model.
Glycocholic acid (GCA)
At first we considered all six studies together when estimating GCA accuracy (Figure 10, Figure 11). Then we also estimated GCA accuracy at the three most reported cut‐offs: 0.7 μmol/l (5 studies), 1.5 μmol/L (4 studies), and 2 μmol/L (3 studies).

Forest plot of glycocholic acid (GCA) (all studies) for the diagnosis of intrahepatic cholestasis of pregnancy

Summary receiver operating characteristic (ROC) plot of glycocholic acid (GCA) (all studies) for the diagnosis of intrahepatic cholestasis of pregnancy. Statistical method used: HSROC (hierarchical summary ROC) model.
The overall sensitivity was 0.92 (95% CI 0.65 to 0.99) and the overall specificity was 0.99 (95% CI 0.06 to 1.00), considering all studies. When considering a cut‐off of 0.7 μmol/L, they were 0.97 (95% CI 0.38 to 1.00) and 0.86 (95% CI 0.02 to 1.00) respectively; when the cut‐off was 1.5 μmol/L, they were 0.99 (95% CI 0.08 to 1.00) and 0.90 (95% CI 0.75 to 0.97) respectively; and when the cut‐off 2.0 μmol/L, they were 0.99 (95% CI 0.07 to 1.00) and 0.97 (95% CI 0.82 to 1.00) respectively.
Cholic acid (CA)
Four included studies assessed the diagnostic accuracy of CA. Having obtained individual participant data of all four, we were able to calculate specificity and sensitivity for each study at multiple cut‐offs (2, 3, 4, and 5 μmol/l) (Figure 12). However, the only cut‐off values for which it was possible to estimate the overall accuracy and its 95% CI were 2 μmol/L and 3 μmol/l: CA with a cut‐off of 2 μmol/L had a sensitivity of 0.99 (95% CI 0.33 to 1.00) and a specificity of 0.61 (95% CI 0.23 to 0.89), while CA with a cut‐off of 3 μmol/L had a sensitivity of 0.94 (95% CI 0.66 to 0.99) and a specificity of 0.82 (95% CI 0.68 to 0.91). For a cut‐off of 4 μmol/L and 5 μmol/L, we were not able to estimate the overall sensitivity and specificity.

Forest plots of cholic acid (CA) with different cut‐offs for the diagnosis of intrahepatic cholestasis of pregnancy: a) cut‐off 2 µmol/L; b) cut‐off = 3 µmol/L; c) cut‐off = 4 µmol/L; d) cut‐off = 5 µmol/L
Two studies took into account only the conjugated (tauro‐ and glyco‐) forms of CA, excluding free CA serum levels, because the laboratory techniques used cannot detect the free form as the concentration is too low (Sjovall 1966; Huang 2009). The other two studies for which we had individual participant data also measured free CA levels as separate assessments, but in order to make the study comparable to others we decided not to add them to the CA values (which then comprised only conjugated CA) (Brites 1998b; Brites 1998c).
Chenodeoxycholic acid (CDCA)
We estimated CDCA sensitivity and specificity at two different cut‐offs for each study (Figure 13). It was possible to do this because of the availability of individual participant data for all four studies. At a cut‐off of 2 μmol/l, the estimated overall sensitivity was 0.98 (95% CI 0.62 to 1.00) and the overall specificity was 0.66 (95% CI 0.19 to 0.94); at a cut‐off of 3 μmol/L we could not estimate the overall diagnostic accuracy. High heterogeneity among study results made it impossible to determine the precision of these estimates and their applicability in a real clinical setting.

Forest plots of chenodeoxycholic acid (CDCA) at different cut‐offs for the diagnosis of intrahepatic cholestasis of pregnancy: a) cut‐off = 2 µmol/L; b) cut‐off = 3 µmol/L
Two studies took into account only the conjugated (tauro‐ and glyco‐) forms of CDCA, excluding free CDCA serum levels, because of the laboratory techniques used which cannot detect the free form as the concentration is too low (Sjovall 1966; Huang 2009). The other two studies for which we had individual participant data measured also free CDCA levels as separate assessments, but in order to make the study comparable to others we decided not to add them to CDCA values provided (which then comprised only conjugated CA) (Brites 1998b; Brites 1998c).
CA/CDCA
No study other than Huang 2009 provided a cut‐off for CA/CDCA. We found that for most of the studies, the cut‐off corresponding to the Youden index maximum was around 1.8. For this reason, we performed the meta‐analysis considering only the cut‐off of 1.8. The overall sensitivity was 0.89 (95% CI 0.54 to 0.98), and the overall specificity was 0.92 (95% CI 0.85 to 0.96) (Figure 14).

Forest plot of CA/CDCA with cut‐off = 1.8
Comparisons
We made indirect comparisons between TSBA for a cut‐off of 10 μmol/L and the following index tests for their most accurate cut‐off: CA with a cut‐off of 3 μmol/L, GCA with a cut‐off of 1.5 μmol/L, CA/CDCA with a cut‐off of 1.8 μmol/L. We made the indirect comparisons by adding the index tests as covariates to the bivariate or HSROC model. None of the indirect comparisons was found to be statistically significant (TSBA vs CA: P = 0.29; TSBA vs GCA: P = 0.096; TSBA vs CA/CDCA: P = 0.096). An indirect comparison between TSBA for a cut‐off of 10 μmol/L and CDCA for a cut‐off of 3 μmol/L was not statistically possible.
Direct comparisons were not statistically possible because of the small number of included studies.
Heterogeneity
Taking into account the number and characteristics of the included studies, heterogeneity analysis was possible only for the 11 studies assessing TSBA diagnostic accuracy with cut‐off equal to 10 μmol/L. Moreover, this analysis was possible only for some of the sources of heterogeneity planned at the protocol stage: laboratory technique used to measure the index test, therapy (if study patients underwent therapy with UDCA or not), and timing of measurement of index test (onset of symptoms, peak values among multiple assessments during pregnancy, immediately before delivery). Results are reported below.
Laboratory technique
We investigated laboratory technique by grouping studies according to five different techniques: enzymatic assay (5 studies), enzymatic colorimetric (2 studies), gas‐liquid chromatography (1 study), liquid chromatography‒mass spectrometry (LC‐MS) (1 study), enzymatic fluorometric (2 studies). However, the number of studies for each group was too small to calculate the confidence intervals of accuracy estimates and regions around summary ROC points (except for enzymatic assay). The differences found between techniques were not statistically significant (P = 0.42).
Therapy
We excluded three studies from this heterogeneity analysis because of lack of information regarding therapy (Roger 1994; Huang 2009; Lang 2012); and one because both kind of patients were included (Brites 1998b). We investigated therapy, grouping the seven remaining studies in two different groups: studies including patients who underwent UDCA therapy (5 studies) and studies including patients who did not (2 studies). The differences found between the two groups in TSBA diagnostic accuracy estimates were not statistically significant (P = 0.60).
Timing
We investigated timing, grouping studies in three groups (onset, peak, delivery) according to when the TSBA measurement took place. Sensitivity and specificity estimated for each group were the following: 0.87 (95% CI 0.68 to 0.96) and specificity 0.87 (95% CI 0.76 to 0.94) for onset; 0.70 (95% CI 0.24 to 0.94) and 1.00 (CI not calculable) for peak; 1.00 (95% CI 1.00 to 1.00) and 0.87 (95% CI 0.68 to 0.95) for delivery. The differences in diagnostic accuracy estimates were statistically significant (P = 0.027).
Sensitivity analysis
At the protocol stage, we had planned to perform a sensitivity analysis by excluding studies at high risk of bias (studies judged as high risk of bias or unclear risk of bias in at least one of the domains of QUADAS‐2) in order to explore the influence of the quality of the included studies. However, the overall low quality of included studies did not allow this, as we judged only one study at low risk of bias in all domains (Huang 2009). Hence, we performed only the remaining two sensitivity analyses planned in the protocol.
The first sensitivity analysis excluded studies in which TSBA were included in the reference standard for intrahepatic cholestasis of pregnancy, assuming that this could have been one of the most important sources of bias. The overall sensitivity and specificity were 0.57 (95% CI 0.49 to 0.65) and 0.98 (95% CI 0.53 to 1.00), respectively (Figure 15).

Summary ROC Plot of sensitivity analysis of TSBA cut‐off=10 μmol/L excluding studies in which TSBA assessment was part of the reference standard. Statistical method used: HSROC (hierarchical summary ROC) model.
The second sensitivity analysis excluded all studies with case‐control design, as all of them enrolled as controls asymptomatic pregnant women. The resultant overall sensitivity and specificity were 0.57 (95% CI 0.48 to 0.66) and 0.92 (95% CI 0.52 to 0.99), respectively (Figure 16).

Summary ROC Plot of sensitivity analysis of TSBA cut‐off=10 μmol/L excluding studies with case‐control design (95% confidence region not estimable because of too few studies included in the analysis). Statistical method used: HSROC (hierarchical summary ROC) model.
'Summary of findings' table
summary of findings Table shows, whenever possible, all considered index tests summary accuracy estimates and consequences of their application in a hypothetical clinical context. In the summary of findings Table, we give the prevalence of intrahepatic cholestasis of pregnancy of 30% among pregnant women claiming pruritus; that is, the median of prevalences provided by four included studies with a cross‐sectional design: Huang 2009 (55/193, prevalence 28%), Lang 2012 (40/66, prevalence 60%), Lunzer 1986 (15/69, prevalence 22%), Roger 1994 (17/49, prevalence 35%). Based on this, we calculated implications of the use of our index tests for the diagnosis of intrahepatic cholestasis of pregnancy on a hypothetical population of 100 pregnant women with pruritus. For some index tests, especially for GCA and CA, we found a small number of studies, and there was a great heterogeneity in accuracy estimates among them. Hence, we found that the overall accuracy was imprecise, and the confidence intervals (CI) for sensitivity and specificity estimates were very wide or impossible to calculate. To apply these results in a real clinical setting is not possible.
Discussion
Summary of main results
Our analysis of the eleven studies assessing TSBA diagnostic accuracy for a cut‐off of 10 μmol/L (the most used cut‐off among the studies we included) provided estimates of sensitivity ranging from 0.72 to 0.98, and specificity ranged from 0.81 to 0.97. Considering the respective pooled estimates of 0.91 and 0.93, in a population of 1000 pregnant women claiming for pruritus, with a prevalence of intrahepatic cholestasis of 30%, 27 (6 to 84) diseased women would be missed, and 49 women (21 to 133) without the disease would be falsely diagnosed. However, with a first sensitivity analysis excluding case‐control studies, TSBA overall sensitivity was lower, ranging from 0.48 to 0.66, and its overall specificity had a wider confidence interval, 0.52 to 0.99. This could mean that when patients were pre‐selected with a clear diagnosis of intrahepatic cholestasis of pregnancy and compared with healthy and asymptomatic pregnant women, as in most included studies, accuracy of TSBA was higher than when TSBA were performed on a population of symptomatic pregnant women in a real clinical setting. A second sensitivity analysis, with exclusion of studies which comprised TSBA in the reference standard, estimated a sensitivity range from 0.49 to 0.65 and specificity from 0.53 to 1.00. These results support the conclusion that TSBA accuracy may not be so high as believed, and that existent studies about diagnostic accuracy of TSBA are not well designed to assess it. What should have been done before introducing TSBA in clinical practice (and to know better the diagnostic accuracy of TSBA) was the completion of cross‐sectional studies enrolling consecutive pregnant women suspected of intrahepatic cholestasis of pregnancy (and followed up after delivery to confirm the right diagnosis). This would have allowed the index test to identify the disease among suspected population (Colli 2014). Only few of the studies included in this systematic review had a design similar to this (Gonzalez 1989; Huang 2009; Lang 2012).
Subgroup analysis considering possible sources of heterogeneity, such as a laboratory technique used to measure TSBA or a therapy for women with intrahepatic cholestasis of pregnancy during pregnancy, did not show statistically significant differences. A heterogeneity analysis considering timing of TSBA testing showed a statistically significant difference: assessing TSBA serum concentration at the time of delivery was more specific but less sensitive in diagnosing intrahepatic cholestasis of pregnancy, while taking the peak value among multiple assessments was more sensitive but less specific than assessing TSBA at the time of onset of symptoms (i.e. pruritus). However, this is not sufficiently clinically relevant, as obstetricians need an index test with high sensitivity at an earlier time, which can allow them to strictly follow up the pregnant woman and her foetus in order to find, as soon as possible, signs of potential fetal distress and to decide the best management. If diagnosis is made at the time of delivery, it is too late and almost useless, because it means that a fetal adverse event (fetal death) did not occur; if we make multiple assessments during pregnancy, the evaluation of the peak value could be only 'a posteriori'.
The data to allow a direct comparison between index tests were limited. Through indirect comparisons, none of the serum bile acid profile components were shown to be better than TSBA. However, there were too few and biased studies included and analysed to obtain a precise estimate of serum bile acid profile accuracy.
We could not analyse the accuracy of combinations of the index tests (that in our review protocol was defined as TSBA plus any component of serum bile acid profile) as none of the included studies did so.
Strengths and weaknesses of the review
To our knowledge, this is the first systematic review on the accuracy of diagnostic tests for intrahepatic cholestasis of pregnancy. The rigorous methodology adopted in all phases of the work is a strength of this review: our findings are based on a thorough searching of studies and strict inclusion criteria, as well as standardised and independent data extraction and analysis. Another strength of our review is our success in contacting many study authors to retrieve individual participant data and useful additional data: this allowed us to make more analyses than would have been possible based only on published data.
Major limitations are: the small number of included studies, especially for serum bile acid profile components; the overall low quality of included studies due to a design that was not properly tailored for diagnostic accuracy, and inclusion of the index tests in the reference standard; the relatively small sample sizes of study participants; and the unexplained heterogeneity among studies on serum bile acid profile, most probably due to other possible sources of heterogeneity, not planned at the protocol stage.
Applicability of findings to the review question
The overall low quality, high risk of bias, and great heterogeneity of the results of some index tests prevents us from reaching definitive conclusions and making recommendations. Thus, at present, we do not find any compelling evidence to recommend or refute the routine use of any of these tests in clinical practice.


Clinical diagnostic pathway for the diagnosis of intrahepatic cholestasis of pregnancy

Study selection flow diagram.

Risk of bias and applicability concerns summary: review authors' (CM and TS) judgements about each domain for each included study.
N.B. The empty cells stand for the test, not performed in the study.

Risk of bias and applicability concerns graph: review authors' judgements about each domain presented as percentages across included studies
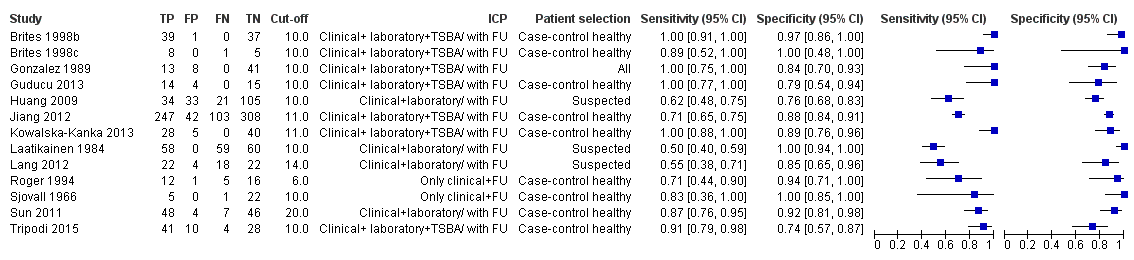
Forest plot of total serum bile acids (TSBA) (all studies) for the diagnosis of intrahepatic cholestasis of pregnancy

Summary receiver operating characteristic (ROC) plot of total serum bile acids (TSBA) (all studies) for the diagnosis of intrahepatic cholestasis of pregnancy. Statistical method used: HSROC (hierarchical summary ROC) model.

Forest plot of total serum bile acids (TSBA) with cut‐off = 10 µmol/L for the diagnosis of intrahepatic cholestasis of pregnancy

Summary receiver operating characteristic (ROC) plot of of total serum bile acids (TSBA) with cut‐off = 10 µmol/L for the diagnosis of intrahepatic cholestasis of pregnancy. Statistical method used: bivariate model.
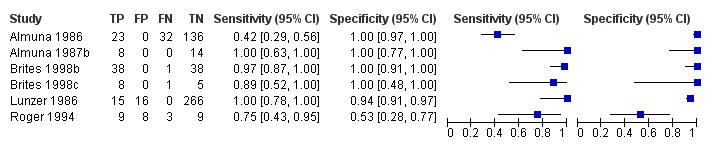
Forest plot of glycocholic acid (GCA) (all studies) for the diagnosis of intrahepatic cholestasis of pregnancy

Summary receiver operating characteristic (ROC) plot of glycocholic acid (GCA) (all studies) for the diagnosis of intrahepatic cholestasis of pregnancy. Statistical method used: HSROC (hierarchical summary ROC) model.

Forest plots of cholic acid (CA) with different cut‐offs for the diagnosis of intrahepatic cholestasis of pregnancy: a) cut‐off 2 µmol/L; b) cut‐off = 3 µmol/L; c) cut‐off = 4 µmol/L; d) cut‐off = 5 µmol/L
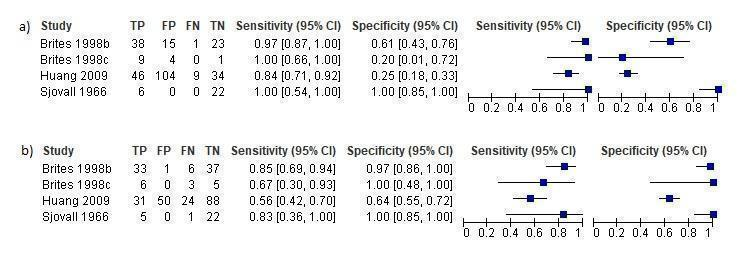
Forest plots of chenodeoxycholic acid (CDCA) at different cut‐offs for the diagnosis of intrahepatic cholestasis of pregnancy: a) cut‐off = 2 µmol/L; b) cut‐off = 3 µmol/L

Forest plot of CA/CDCA with cut‐off = 1.8

Summary ROC Plot of sensitivity analysis of TSBA cut‐off=10 μmol/L excluding studies in which TSBA assessment was part of the reference standard. Statistical method used: HSROC (hierarchical summary ROC) model.

Summary ROC Plot of sensitivity analysis of TSBA cut‐off=10 μmol/L excluding studies with case‐control design (95% confidence region not estimable because of too few studies included in the analysis). Statistical method used: HSROC (hierarchical summary ROC) model.

TSBA (all studies).
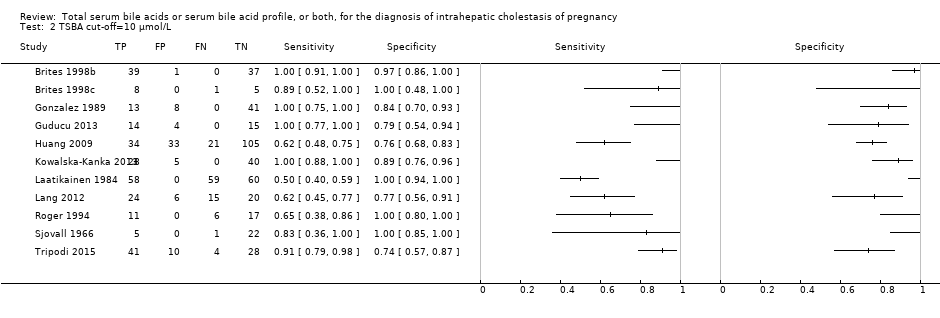
TSBA cut‐off=10 μmol/L.

CA cut‐off=2 μmol/L.

CA cut‐off=3 μmol/L.

CA cut‐off=4 μmol/L.
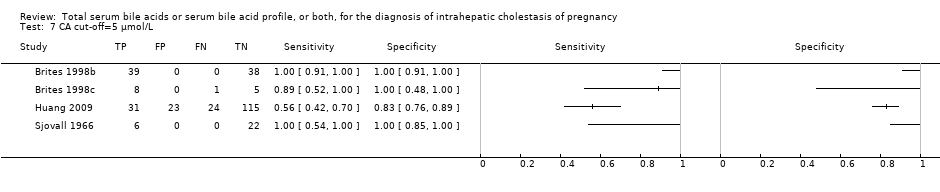
CA cut‐off=5 μmol/L.

CDCA cut‐off=2 μmol/L.

CDCA cut‐off=3 μmol/L.

GCA (all studies).

GCA cut‐off=0.7 μmol/L.

GCA cut‐off=1.5 μmol/L.

GCA cut‐off=2 μmol/L.

CA/CDCA cut‐off=1.8.

TSBA cut‐off=10 μmol/L sensitivity excl TSBA in reference standard.
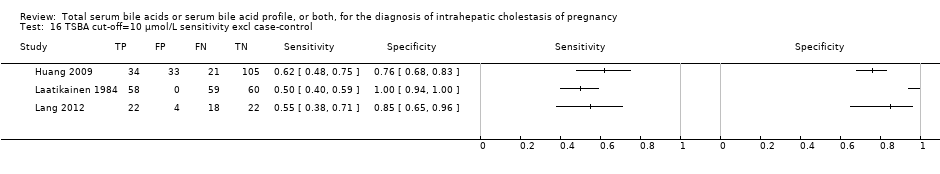
TSBA cut‐off=10 μmol/L sensitivity excl case‐control.
| What is the diagnostic accuracy of total serum bile acids (TSBA), cholic acid (CA), glycocholic acid (GCA), chenodeoxycholic acid (CDCA), or CA/CDCA for intrahepatic cholestasis of pregnancy (ICP), at different cut‐off values? | |||||
| Patients/population | Pregnant women with onset of pruritus from the second trimester or later | ||||
| Prior testing | History, serum tests, liver ultrasound | ||||
| Settings | Obstetrics and Gynaecology departments | ||||
| Index test | TSBA, CA, GCA, CDCA, CA/CDCA | ||||
| Importance | Early diagnosis, treatment and follow‐up to reduce fetal adverse events | ||||
| Reference standard | Clinical evaluation comprising common liver function tests, with exclusion of other possible underlying liver or dermatological diseases, and follow‐up after delivery assessing spontaneous normalization of signs and symptoms. | ||||
| Studies | Cross‐sectional and case‐control studies. Each study can be present in more than one subgroup and for more than one index test | ||||
| Test/Subgroup | Summary accuracy (95% CI) | N° part. (studies) | Median prevalence of ICP in pregnant women with pruritus | Implications for an hypothetical population of 100 pregnant women with pruritus | Quality and Comments |
| TSBA, any cut‐off | Sensitivity 0.88 (0.73 to 0.95) Specificity 0.90 (0.84 to 0.95) | 1645 (13) | 30% (300 out of 1000 pregnant women with pruritus having ICP) | 36 (15 to 81) women with ICP would be missed, and 70 (35 to 112) without ICP would be falsely diagnosed. | The overall accuracy found may be not applicable to a real clinical context, as most studies were at high risk of bias for patient selection and reference standard. |
| TSBA cut‐off = 10 μmol/L | Sensitivity 0.91 (0.72 to 0.98) Specificity 0.93 (0.81 to 0.97) | 839 (11) | 30% (300 out of 1000 pregnant women with pruritus having ICP) | 27 (6 to 84) women with ICP would be missed, and 49 (21 to 133) without ICP would be falsely diagnosed. | The overall accuracy found may be not applicable to a real clinical context, as most studies were at high risk of bias for patient selection and reference standard. |
| CA cut‐off = 2 μmol/L | Sensitivity 0.99 (0.33 to 1.00) Specificity 0.61 (0.23to 0.89) | 312 (4) | ‐‐‐ | ‐‐‐ | The estimate of accuracy is too imprecise (i.e. very wide CI, both for sensitivity and specificity), owing to the extreme heterogeneity between study results. Moreover, too few studies and of low quality were included for this index test. This makes impossible a judgment on applicability of the index test in a real clinical setting. |
| CA cut‐off =3 μmol/L | Sensitivity 0.94 (0.66 to 0.99) Specificity 0.82 (0.68 to 0.91) | 312 (4) | 30% (300 out of 1000 pregnant women with pruritus having ICP) | 18 (3 to 102) women with ICP would be missed, and 126 (63 to 224) without ICP would be falsely diagnosed. | The overall accuracy found may be not applicable to a real clinical context, as most studies were at high risk of bias for patient selection and reference standard. |
| GCA, all cut‐offs | Sensitivity 0.92 (0.65 to 0.99) Specificity 0.99 (0.06 to 1.00) | 630 (6) | ‐‐‐ | ‐‐‐ | The estimate of accuracy is too imprecise (i.e. very wide CI, especially for specificity), owing to the extreme heterogeneity between study results. Moreover, too few studies and of low quality were included for this index test. This makes impossible a judgment on applicability of the index test in a real clinical setting. |
| GCA cut‐off = 0.7 μmol/L | Sensitivity 0.97 (0.38 to 1.00) Specificity 0.86 (0.02 to 1.00) | 333 (5) | ‐‐‐ | ‐‐‐ | The estimate of accuracy is too imprecise (i.e. very wide CI, both for sensitivity and specificity), owing to the extreme heterogeneity between study results. Moreover, too few studies and of low quality were included for this index test. This makes impossible a judgment on applicability of the index test in a real clinical setting. |
| GCA cut‐off =1.5 μmol/L | Sensitivity 0.99 (0.08 to 1.00) Specificity 0.90 (0.75 to 0.97) | 417 (4) | ‐‐‐ | ‐‐‐ | The estimate of accuracy is too imprecise (i.e. very wide CI, especially for sensitivity), owing to the extreme heterogeneity between study results. Moreover, too few studies and of low quality were included for this index test. This makes impossible a judgment on applicability of the index test in a real clinical setting. |
| GCA cut‐off = 2 μmol/L | Sensitivity 0.99 (0.07 to 1.00) Specificity 0.97 (0.82 to 1.00) | 125 (3) | ‐‐‐ | ‐‐‐ | The estimate of accuracy is too imprecise (i.e. very wide CI, especially for sensitivity), owing to the extreme heterogeneity between study results. Moreover, too few studies and of low quality were included for this index test. This makes impossible a judgment on applicability of the index test in a real clinical setting. |
| CDCA cut‐off = 2 | Sensitivity 0.98 (0.62 to 1.00) Specificity 0.66 (0.19 to 0.94) | 312 (4) | ‐‐‐ | The estimate of accuracy is too imprecise (i.e. very wide CI, especially for specificity), owing to the extreme heterogeneity between study results. Moreover, too few studies and of low quality were included for this index test. This makes impossible a judgment on applicability of the index test in a real clinical setting. | |
| CDCA cut‐off = 3 | Sensitivity 0.75 (CI not calc) Specificity 0.94 (0.88 to 0.97) | 312 (4) | ‐‐‐ | ‐‐‐ | The CI of sensitivity was not calculable and the CI of specificity was too wide. Hence, we cannot know the precision of the estimates obtained and their applicability in a real clinical scenario. |
| CA/CDCA cut‐off = 1.8 | Sensitivity 0.89 (0.54 to 0.98) Specificity 0.92 (0.85 to 0.96) | 312 (4) | 30% (300 out of 1000 pregnant women with pruritus having ICP) | 33 (6 to 138) women with ICP would be missed, and 56 (28 to 105) without ICP would be falsely diagnosed | The cut‐off used has been chosen among the best ones, comparing Youden indexes at multiple cut‐offs applied to all studies. This may have led to biased results. Moreover, sensitivity estimate has a wide CI. This makes hard to judge the applicability the index test in a real clinical setting. |
| Subgroup analysis for TSBA cut‐off = 10 μmol/L: timing (P = 0.027) | |||||
| Onset of symptoms | Sensitivity 0.87 (0.68 to 0.96) Specificity 0.87 (0.76 to 0.94) | 839 (11) | 30% (30 out of 100 pregnant women with pruritus having ICP) | 39 (12 to 96) women with ICP would be missed, and 91 (42 to 168) without ICP would be falsely diagnosed | Sensitivity and specificity seem to be quite good if TSBA are tested when symptoms of ICP arise. However, the overall accuracy found may be not applicable to a real clinical context, as most studies were at high risk of bias for patient selection and reference standard. |
| Peak value among multiple assessments | Sensitivity 0.7 (0.24 to 0.94) Specificity 1.00 (CI not calc) | 839 (11) | ‐‐‐ | ‐‐‐ | The CI of sensitivity was too wide and the CI of specificity was not calculable. Hence, we cannot know the precision of the estimates obtained and their applicability in a real clinical scenario. |
| Delivery | Sensitivity 1.00 (1.00 to 1.00) Specificity 0.87 (0.68 to 0.95) | 839 (11) | 30% (300 out of 1000 pregnant women with pruritus having ICP) | 0 women with ICP would be missed, and 91 (35 to 224) without ICP would be falsely diagnosed | Sensitivity seems to be higher when TSBA are tested at the time of delivery, while specificity seems to be the same as when symptoms of ICP arise. However, clinicians need to diagnose ICP as soon as possible during pregnancy to monitor and strictly follow up diseased woman, in order to find possible signs of fetal distress and plan the timing of delivery. Delivery time is too late to make a diagnosis. |
| Sensitivity analysis for TSBA cut‐off=10 μmol/L: exclusion of studies with TSBA as part of reference standard | |||||
| Sensitivity 0.57 (0.49 to 0.65) Specificity 0.98 (0.53 to 1.00) | 497 (5) | 30% (300 out of 1000 pregnant women with pruritus having ICP) | 129 (105 to 153) women with ICP would be missed, and 14 (0 to 329) without ICP would be falsely diagnosed | The overall accuracy of TSBA, especially sensitivity, seems to be lower when considering only studies without TSBA inclusion in the reference standard. The accuracy of the index test in a real clinical context may be similar to this. However CIs are wide, and estimates too imprecise to judge with certainty their applicability in a real clinical setting. | |
| Sensitivity analysis for TSBA cut‐off=10 μmol/L: exclusion of case‐control studies | |||||
| Sensitivity 0.57 (0.48 to 0.66) Specificity 0.92 (0.52 to 0.99) | 436 (3) | 30% (300 out of 1000 pregnant women with pruritus having ICP) | 129 (102 to 156) women with ICP would be missed, and 56 (7 to 336) without ICP would be falsely diagnosed | The overall accuracy of TSBA, especially sensitivity, seems to be lower when excluding case‐control studies. The accuracy of the index test in a real clinical context may be similar to this. However CIs are wide, and estimates too imprecise to judge with certainty their applicability in a real clinical setting. | |
| CAUTION: The results on this table should not be interpreted in isolation from the results of the individual included studies contributing to each summary test accuracy measure. These are reported in the main body of the text of the review. | |||||
| Author | Year | Country | # | Study design | ICP definition | Index test(s) | Cut‐off (μmol/l)a | Laboratory technique | Timing |
| Almuna R | 1986 | Chile | 241 | case‐control | Only clinical/with FU | GCA | 0,7 | Immunoenzymatic assay | Onset |
| Almuna R | 1987 | Chile | 22 | case‐control | Clinical + lab/with FU | GCA | 0,7 | Immunoenzymatic assay | Delivery |
| Brites D * | 1998 | Portugal | 77 | case‐control | Clinical + lab + TSBA/with FU | TSBA | 10 | Enzymatic fluorimetric | Onset |
| CA§ | not given | HPLC | Onset | ||||||
| CDCA§ | not given | HPLC | Onset | ||||||
| GCA | not given | HPLC | Onset | ||||||
| CA/CDCA§ | not given | ||||||||
| Brites D * | 1998 | Portugal | 14 | case‐control | Clinical + lab + TSBA/with FU | TSBA | 10 | Enzymatic fluorimetric | Delivery |
| CA§ | not given | HPLC | Onset | ||||||
| CDCA§ | not given | HPLC | Onset | ||||||
| GCA | not given | HPLC | Onset | ||||||
| CA/CDCA§ | not given | ||||||||
| Gonzalez MC | 1989 | Chile | 62 | Cross‐sectional | Clinical + lab + TSBA/with FU | TSBA | 10 | Enzymatic assay | Onset |
| Guducu N* | 2013 | Turkey | 33 | case‐control | Clinical + lab + TSBA/with FU | TSBA | 10 | Enzymatic assay | Peak |
| Huang W* | 2009 | USA | 193 | Cross‐sectional | Clinical + lab/with FU | TSBA | 10 | LC‐MS | Onset |
| CA | not given | LC‐MS | Onset | ||||||
| CDCA | not given | LC‐MS | Onset | ||||||
| CA/CDCA | 3,4 | ||||||||
| Jiang Y | 2012 | China | 700 | case‐control | Clinical + lab + TSBA/with FU | TSBA | 11 | Enzymatic colorimetric | Onset |
| Kowalska‐Kanka A* | 2013 | Poland | 73 | case‐control | Clinical + lab + TSBA/with FU | TSBA | 11 | Enzymatic colorimetric | Peak |
| Laatikanen T | 1984 | Finland | 177 | case‐control | Clinical + lab/with FU | TSBA | 10 | Enzymatic assay | Delivery |
| Lang T* | 2012 | UK | 66 | Cross‐sectional | Clinical + lab/with FU | TSBA | 14 | Enzymatic colorimetric | Onset |
| Lunzer M | 1986 | Australia | 297 | case‐control | Clinical + lab/with FU | GCA | 1,5 | Radioimmuno assay | Onset |
| Roger D* | 1994 | France | 34 | case‐control | Only clinical/with FU | TSBA | 6 | Enzymatic assay | Onset |
| GCA | 0,7 | Immunoenzymatic assay | Onset | ||||||
| Sjovall K* | 1966 | Sweden | 28 | case‐control | Only clinical/with FU | TSBA | not given | Gas‐liquid chromatography | Onset |
| CA | not given | Gas‐liquid chromatography | Onset | ||||||
| CDCA | not given | Gas‐liquid chromatography | Onset | ||||||
| CA/CDCA§ | not given | ||||||||
| Sun Y | 2011 | China | 105 | case‐control | Clinical + lab/with FU | TSBA | 20 | Enzymatic colorimetric | Onset |
| Tripodi V*b | 2006‐2015 | Argentina | 83 | case‐control | Clinical + lab + TSBA/with FU | TSBA | 10 | Enzymatic assay | Onset |
| ICP ‐ Intrahepatic cholestasis of pregnancy *Studies with individual participant data (provided in the publications or received from authors by email) | |||||||||
| Test | No. of studies | No. of participants |
| 1 TSBA (all studies) Show forest plot | 13 | 1645 |
| 2 TSBA cut‐off=10 μmol/L Show forest plot | 11 | 839 |
| 4 CA cut‐off=2 μmol/L Show forest plot | 4 | 312 |
| 5 CA cut‐off=3 μmol/L Show forest plot | 4 | 312 |
| 6 CA cut‐off=4 μmol/L Show forest plot | 4 | 312 |
| 7 CA cut‐off=5 μmol/L Show forest plot | 4 | 312 |
| 8 CDCA cut‐off=2 μmol/L Show forest plot | 4 | 312 |
| 9 CDCA cut‐off=3 μmol/L Show forest plot | 4 | 312 |
| 10 GCA (all studies) Show forest plot | 6 | 630 |
| 11 GCA cut‐off=0.7 μmol/L Show forest plot | 5 | 333 |
| 12 GCA cut‐off=1.5 μmol/L Show forest plot | 4 | 417 |
| 13 GCA cut‐off=2 μmol/L Show forest plot | 3 | 120 |
| 14 CA/CDCA cut‐off=1.8 Show forest plot | 4 | 312 |
| 15 TSBA cut‐off=10 μmol/L sensitivity excl TSBA in reference standard Show forest plot | 5 | 497 |
| 16 TSBA cut‐off=10 μmol/L sensitivity excl case‐control Show forest plot | 3 | 436 |