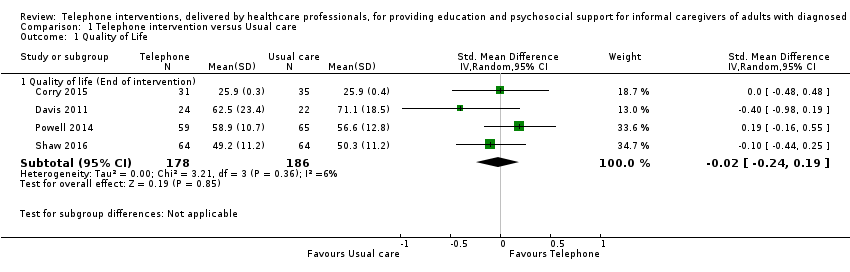
| 1 Quality of Life Show forest plot | 4 | | Std. Mean Difference (IV, Random, 95% CI) | Subtotals only |
|
| 1.1 Quality of life (End of intervention) | 4 | 364 | Std. Mean Difference (IV, Random, 95% CI) | ‐0.02 [‐0.24, 0.19] |
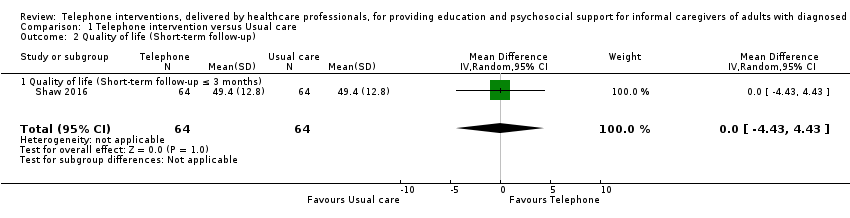
| 2 Quality of life (Short‐term follow‐up) Show forest plot | 1 | 128 | Mean Difference (IV, Random, 95% CI) | 0.0 [‐4.43, 4.43] |
|
| 2.1 Quality of life (Short‐term follow‐up ≤ 3 months) | 1 | 128 | Mean Difference (IV, Random, 95% CI) | 0.0 [‐4.43, 4.43] |
| 3 Burden Show forest plot | 10 | | Std. Mean Difference (IV, Random, 95% CI) | Subtotals only |
|
| 3.1 End of intervention | 9 | 788 | Std. Mean Difference (IV, Random, 95% CI) | ‐0.11 [‐0.30, 0.07] |
| 3.2 Medium‐term follow up > 3 to ≤ 6 months | 2 | 147 | Std. Mean Difference (IV, Random, 95% CI) | 0.00 [‐0.32, 0.33] |
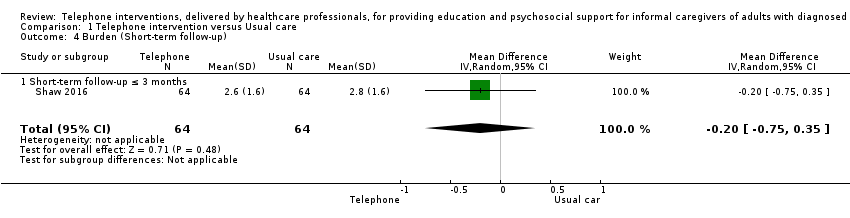
| 4 Burden (Short‐term follow‐up) Show forest plot | 1 | 128 | Mean Difference (IV, Random, 95% CI) | ‐0.20 [‐0.75, 0.35] |
|
| 4.1 Short‐term follow‐up ≤ 3 months | 1 | 128 | Mean Difference (IV, Random, 95% CI) | ‐0.20 [‐0.75, 0.35] |
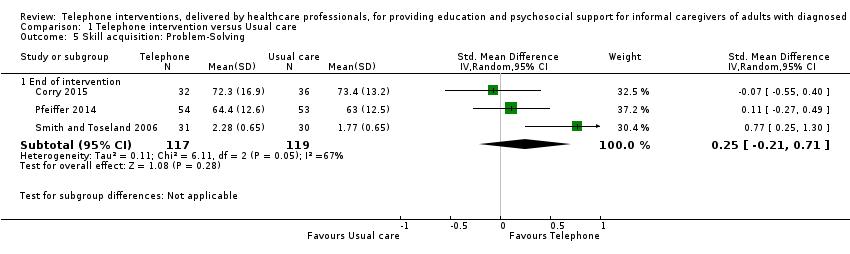
| 5 Skill acquisition: Problem‐Solving Show forest plot | 3 | | Std. Mean Difference (IV, Random, 95% CI) | Subtotals only |
|
| 5.1 End of intervention | 3 | 236 | Std. Mean Difference (IV, Random, 95% CI) | 0.25 [‐0.21, 0.71] |
| 6 Skill acquisition: Preparedness to Care Show forest plot | 2 | | Std. Mean Difference (IV, Random, 95% CI) | Subtotals only |
|
| 6.1 End of intervention | 2 | 208 | Std. Mean Difference (IV, Random, 95% CI) | 0.37 [0.09, 0.64] |
| 7 Skill acquisition: Preparedness to Care (medium‐term follow‐up) Show forest plot | 1 | | Mean Difference (IV, Random, 95% CI) | Subtotals only |
|
| 7.1 Medium‐term follow‐up > 3 months to ≤ 6 months | 1 | 17 | Mean Difference (IV, Random, 95% CI) | ‐0.30 [‐1.02, 0.42] |
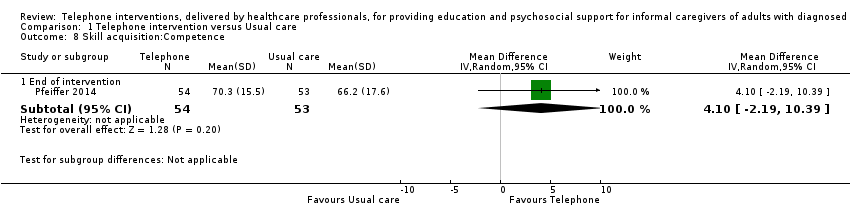
| 8 Skill acquisition:Competence Show forest plot | 1 | | Mean Difference (IV, Random, 95% CI) | Subtotals only |
|
| 8.1 End of intervention | 1 | 107 | Mean Difference (IV, Random, 95% CI) | 4.10 [‐2.19, 10.39] |
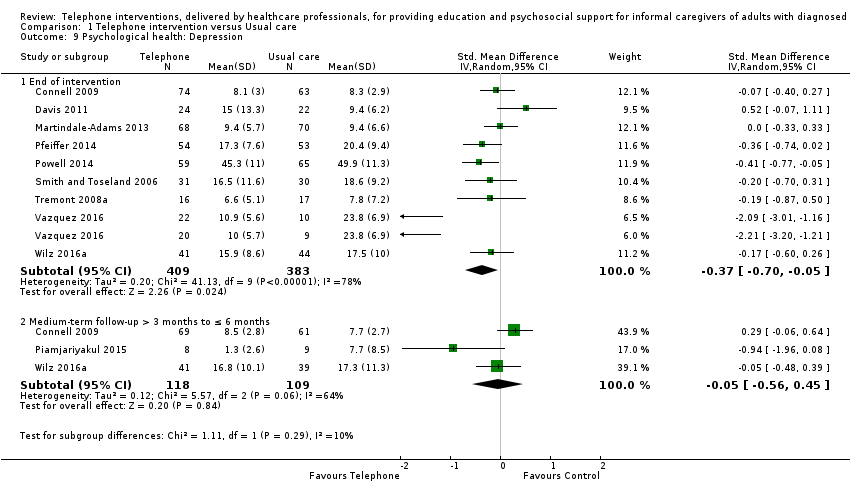
| 9 Psychological health: Depression Show forest plot | 10 | | Std. Mean Difference (IV, Random, 95% CI) | Subtotals only |
|
| 9.1 End of intervention | 9 | 792 | Std. Mean Difference (IV, Random, 95% CI) | ‐0.37 [‐0.70, ‐0.05] |
| 9.2 Medium‐term follow‐up > 3 months to ≤ 6 months | 3 | 227 | Std. Mean Difference (IV, Random, 95% CI) | ‐0.05 [‐0.56, 0.45] |
| 10 Psychological health: Anxiety Show forest plot | 1 | | Mean Difference (IV, Random, 95% CI) | Subtotals only |
|
| 10.1 End of intervention | 1 | 61 | Mean Difference (IV, Random, 95% CI) | ‐4.00 [‐11.68, ‐0.32] |
| 11 Psychological health: Coping Show forest plot | 1 | | Mean Difference (IV, Random, 95% CI) | Subtotals only |
|
| 11.1 End of intervention | 1 | 121 | Mean Difference (IV, Random, 95% CI) | 1.0 [‐0.45, 2.45] |
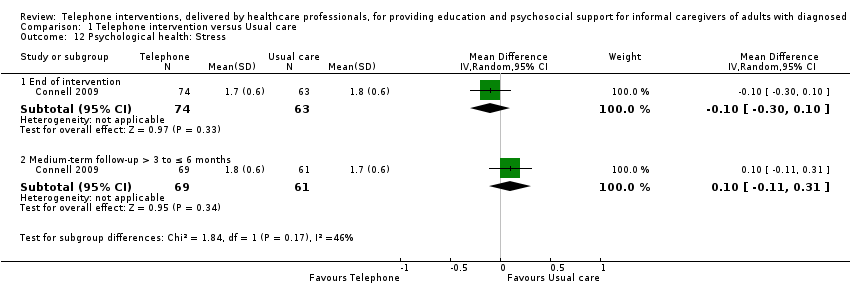
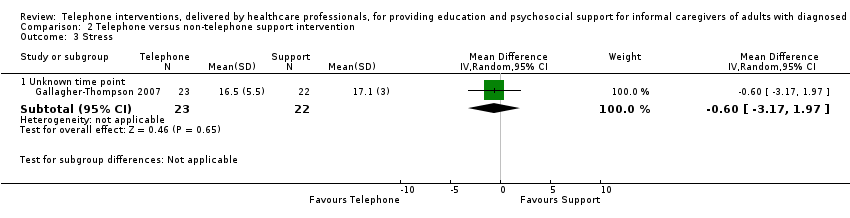
| 12 Psychological health: Stress Show forest plot | 1 | | Mean Difference (IV, Random, 95% CI) | Subtotals only |
|
| 12.1 End of intervention | 1 | 137 | Mean Difference (IV, Random, 95% CI) | ‐0.10 [‐0.30, 0.10] |
| 12.2 Medium‐term follow‐up > 3 to ≤ 6 months | 1 | 130 | Mean Difference (IV, Random, 95% CI) | 0.10 [‐0.11, 0.31] |
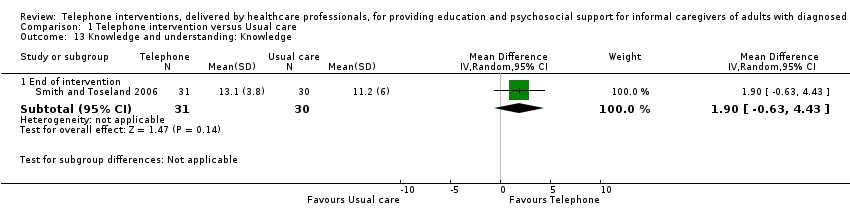
| 13 Knowledge and understanding: Knowledge Show forest plot | 1 | | Mean Difference (IV, Random, 95% CI) | Subtotals only |
|
| 13.1 End of intervention | 1 | 61 | Mean Difference (IV, Random, 95% CI) | 1.90 [‐0.63, 4.43] |
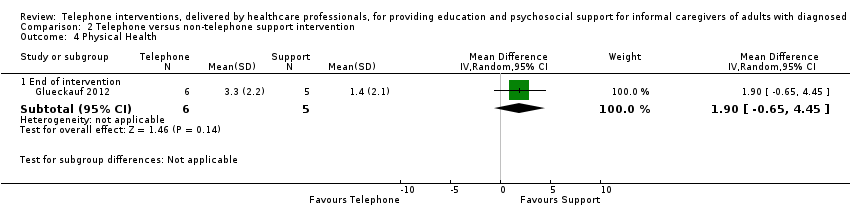
| 14 Health status and well‐being: Physical health Show forest plot | 2 | | Std. Mean Difference (IV, Random, 95% CI) | Subtotals only |
|
| 14.1 End of intervention | 2 | 248 | Std. Mean Difference (IV, Random, 95% CI) | ‐0.09 [‐0.35, 0.17] |
| 15 Health status and well‐being: Self‐efficacy Show forest plot | 2 | | Std. Mean Difference (IV, Random, 95% CI) | Subtotals only |
|
| 15.1 End of intervention | 2 | 175 | Std. Mean Difference (IV, Random, 95% CI) | 0.04 [‐0.26, 0.33] |
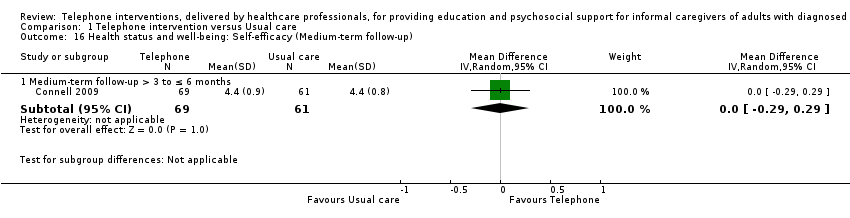
| 16 Health status and well‐being: Self‐efficacy (Medium‐term follow‐up) Show forest plot | 1 | | Mean Difference (IV, Random, 95% CI) | Subtotals only |
|
| 16.1 Medium‐term follow‐up > 3 to ≤ 6 months | 1 | 130 | Mean Difference (IV, Random, 95% CI) | 0.0 [‐0.29, 0.29] |
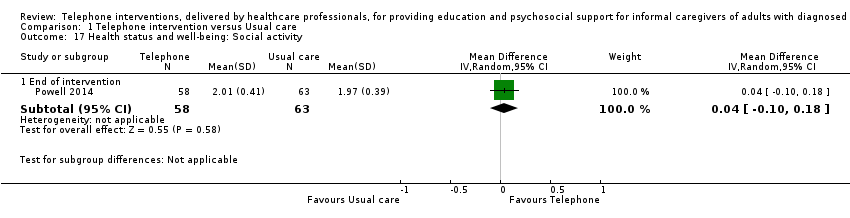
| 17 Health status and well‐being: Social activity Show forest plot | 1 | | Mean Difference (IV, Random, 95% CI) | Subtotals only |
|
| 17.1 End of intervention | 1 | 121 | Mean Difference (IV, Random, 95% CI) | 0.04 [‐0.10, 0.18] |
| 18 Satisfaction: Satisfaction with supports Show forest plot | 3 | | Std. Mean Difference (IV, Random, 95% CI) | Subtotals only |
|
| 18.1 End of intervention | 3 | 291 | Std. Mean Difference (IV, Random, 95% CI) | 0.10 [‐0.24, 0.44] |
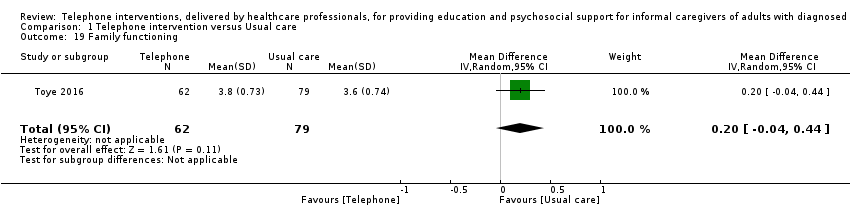
| 19 Family functioning Show forest plot | 1 | 141 | Mean Difference (IV, Random, 95% CI) | 0.20 [‐0.04, 0.44] |
|