Intervenciones telefónicas proporcionadas por profesionales sanitarios para la educación y el apoyo psicosocial de los cuidadores informales de pacientes adultos con enfermedades diagnosticadas
Resumen
Antecedentes
Mantener la atención de los pacientes enfermos en la comunidad depende en gran parte del apoyo de cuidadores no remunerados. Sin embargo, muchos cuidadores se enfrentan a un trabajo para el cual no están bien preparados y pueden requerir apoyo profesional. El teléfono es un método de apoyo de fácil acceso, independientemente de la ubicación geográfica.
Objetivos
El objetivo de esta revisión fue evaluar la efectividad de las intervenciones de apoyo telefónico proporcionadas por profesionales sanitarios, en comparación con atención habitual o intervenciones de apoyo no telefónico, para brindar educación y apoyo psicosocial a los cuidadores informales de pacientes con enfermedades agudas y crónicas diagnosticadas y para evaluar la coste‐efectividad de las intervenciones telefónicas en esta población.
Métodos de búsqueda
Se realizaron búsquedas en las siguientes bases de datos desde el inicio hasta el 16 de noviembre de 2018: Registro Cochrane Central de Ensayos Controlados (Cochrane Central Register of Controlled Trials, CENTRAL); MEDLINE; Embase; PsycINFO; ProQuest Dissertations and Theses A&I y CINAHL Complete. También se buscó en 11 sitios web específicos de cuidadores, tres enlaces de congresos y dos registros de ensayos clínicos.
Criterios de selección
Se incluyeron ensayos controlados aleatorizados (ECA, incluidos los ECA grupales) y ensayos controlados cuasialeatorizados. Se excluyeron los ensayos cruzados (crossover) debido al alto riesgo de efectos de arrastre de una intervención a otra.
Obtención y análisis de los datos
Dos autores, de forma independiente, revisaron las referencias con respecto a los criterios de inclusión, extrajeron los datos y evaluaron el riesgo de sesgo de los estudios incluidos con la herramienta Cochrane "Riesgo de sesgo". Cuando se informaron, los resultados primarios (calidad de vida y carga) y secundarios (desarrollo de habilidades, salud psicológica, conocimiento, estado de salud y bienestar, funcionalidad familiar, satisfacción y resultados económicos) predefinidos se evaluaron al final de la intervención y a corto plazo (≤ 3 meses), a plazo medio (> 3 a ≤ 6 meses) y a más largo plazo (> 6 a 12 meses) después de la intervención. Siempre que fue posible se realizaron metanálisis; de no ser así, se informaron los resultados de modo narrativo.
Resultados principales
Se incluyeron 21 estudios aleatorizados con 1690 cuidadores; 19 estudios compararon intervenciones de apoyo telefónico y atención habitual, de los cuales 18 aportaron datos a los análisis. Dos estudios compararon intervenciones de apoyo profesional telefónicas y no telefónicas. La edad de los cuidadores varió de 19 a 87 años en los estudios. La mayoría de los participantes eran mujeres (> 70,53%) y dos ensayos solo incorporaron a mujeres. La mayoría de los cuidadores fueron familiares de nivel educativo secundario o con un número de años de educación equivalente. Todos los cuidadores residían en la comunidad. El riesgo de sesgo general fue alto para la mayoría de los estudios.
Los resultados demostraron que probablemente hay poca o ninguna diferencia entre las intervenciones de apoyo telefónico y la atención habitual en el resultado primario calidad de vida al final de la intervención (DME ‐0,02; IC del 95%: ‐0,24 a 0,19; cuatro estudios, 364 cuidadores) (evidencia de certeza moderada) o carga al final de la intervención (DME ‐0,11; IC del 95%: ‐0,30 a 0,07; nueve estudios, 788 cuidadores) (evidencia de certeza baja). En un estudio en el que la calidad de vida al final de la intervención se informó de manera narrativa, los resultados indicaron que la intervención de apoyo telefónico puede dar lugar a una calidad de vida ligeramente más alta en comparación con la atención habitual. Dos estudios adicionales sobre la carga del cuidador se informaron de manera narrativa; uno informó que las intervenciones de apoyo telefónico pueden disminuir la carga, el otro no informó cambios en el grupo de intervención, en comparación con la atención habitual.
No están claros los efectos de las intervenciones de apoyo telefónico sobre la depresión de los cuidadores al final de la intervención (DME ‐0,37; IC del 95%: ‐0,70 a ‐0,05; nueve estudios, 792 cuidadores) debido a la evidencia de certeza muy baja para este resultado. La depresión se informó de manera narrativa en tres estudios. Uno informó que la intervención puede reducir la depresión de los cuidadores al final de la intervención, pero este efecto no se mantuvo en el seguimiento a corto plazo. Los otros dos estudios informaron que puede haber poca o ninguna diferencia entre el apoyo telefónico y la atención habitual para la depresión al final de la intervención. Seis estudios midieron la satisfacción con la intervención, pero no informaron datos comparativos. Los seis informaron puntuaciones altas de satisfacción con la intervención. En ninguno de los estudios incluidos se midieron los eventos adversos, incluido el suicidio o la ideación de suicidio.
El análisis indicó que la ansiedad de los cuidadores se puede reducir (DM ‐6,0; IC del 95%: ‐11,68 a ‐0,32; un estudio, 61 cuidadores) y mejorar la predisposición a brindar atención (ambas en grado leve) (DME 0,37; IC del 95%: 0,09 a 0,64; dos estudios, 208 cuidadores) al final de la intervención, después de las intervenciones de apoyo telefónico solo en comparación con la atención habitual. Los hallazgos indican que puede haber poca o ninguna diferencia entre las intervenciones de apoyo telefónico y la atención habitual en los siguientes resultados al final de la intervención: resolución de problemas, actividad social, competencia del cuidador, afrontamiento, estrés, conocimiento, salud física, autoeficacia, funcionamiento familiar y satisfacción con el apoyo (práctico o social). También puede haber poco o ningún efecto de las intervenciones de apoyo telefónico sobre la calidad de vida y la carga en el seguimiento a corto plazo o en la carga y la depresión en el seguimiento a plazo medio.
Se encontró poca o ninguna diferencia entre los grupos en los resultados informados en los estudios que compararon las intervenciones de apoyo profesional telefónico y no telefónico. No están claros los efectos de las intervenciones de apoyo telefónico en comparación con las intervenciones de apoyo no telefónico en la carga y la depresión de los cuidadores al final de la intervención. Ningún estudio informó sobre la calidad de vida ni la satisfacción con la intervención y no se informaron ni observaron efectos adversos en los dos estudios que proporcionaron esta comparación.
Conclusiones de los autores
Aunque la revisión indicó que puede haber un efecto beneficioso leve de las intervenciones de apoyo telefónico sobre algunos resultados (p.ej., ansiedad y predisposición a brindar atención al final de la intervención), en la mayoría de los resultados, incluidos los resultados primarios, las intervenciones que solo utilizaron el teléfono pueden tener poco o ningún efecto sobre los resultados de los cuidadores en comparación con la atención habitual. Los resultados de la revisión se basaron fundamentalmente en estudios con riesgo de sesgo general alto y un número reducido de participantes. Se necesitan más ensayos de alta calidad, con un tamaño muestral más grande.
PICO
Resumen en términos sencillos
[Intervenciones telefónicas para la educación y el apoyo psicosocial a los cuidadores]
Antecedentes
Los cuidadores que proporcionan cuidados a un familiar, un amigo o un vecino enfrentan esta situación de formas diferentes. Algunos cuidadores se pueden enfrentar a una función para la cual no están bien preparados y el apoyo profesional es fundamental. Esta revisión examinó si las intervenciones de apoyo telefónico proporcionadas por profesionales sanitarios tenían efectos beneficiosos positivos sobre diversos resultados, como la calidad de vida, la carga (en términos de esfuerzo o cantidad de trabajo), el desarrollo de habilidades (p.ej., resolución de problemas), la salud psicológica (p.ej., depresión), el conocimiento, la salud física, la funcionalidad familiar, la satisfacción o el coste, para los cuidadores no remunerados de la comunidad. En una intervención de apoyo telefónico, se utiliza el teléfono para brindar conocimiento, asesoramiento o ayuda a los cuidadores y permitirles controlar su propio bienestar o el de la persona que atienden. Es un método de apoyo de fácil acceso, independientemente de la ubicación geográfica. Se incluyeron los estudios que compararon el apoyo telefónico con la atención habitual o con las intervenciones de apoyo profesional no telefónicas.
Características de los estudios
Se incluyeron 21 estudios con 1690 cuidadores que proporcionaban cuidados a pacientes con diversas enfermedades diagnosticadas. La edad de los cuidadores varió de 19 a 87 años. La mayoría eran mujeres y cuidaban a un familiar. La mayoría eran los cónyuges, en particular las esposas, salvo un estudio que se centró principalmente en hijos adultos. El nivel educativo de la mayoría de los cuidadores era mayor que el secundario. Dieciocho estudios informaron financiamiento de fuentes confiables.
Resultados clave
Diecinueve estudios (18 contribuyeron con datos) compararon las intervenciones de apoyo telefónico y la atención habitual. Las intervenciones de apoyo telefónico probablemente tienen poco o ningún efecto sobre la calidad de vida de los cuidadores (cuatro estudios, 364 cuidadores) y pueden tener un efecto pequeño sobre la carga (nueve estudios, 788 cuidadores) en comparación con la atención habitual al final de la intervención. Aunque después de la intervención puede disminuir la ansiedad y puede mejorar la predisposición a brindar atención (en ambos casos en grado leve), no están claros los efectos sobre la depresión, y en general, las intervenciones telefónicas pueden tener poco o ningún efecto sobre los resultados evaluados en esta revisión. Se informó una alta satisfacción con la intervención en seis estudios que midieron este resultado pero no se informó sobre los datos comparativos con los grupos de atención habitual.
Dos estudios compararon intervenciones de apoyo telefónicas y no telefónicas. Puede haber poca o ninguna evidencia de un efecto del apoyo telefónico cuando se comparó con intervenciones de apoyo no telefónico en cualquier resultado informado. No se midieron ni informaron eventos adversos en los estudios incluidos.
Calidad de la evidencia
La certeza de la evidencia se consideró muy baja a moderada entre los resultados, por lo que se reduce la confianza en los hallazgos. Muchos de los resultados se basaron en datos de estudios únicos con pocos participantes. Se necesitan estudios bien diseñados de mayor tamaño para determinar los efectos de las intervenciones de apoyo telefónico.
Authors' conclusions
Summary of findings
| Telephone intervention compared to Usual care for providing education and psychosocial support for informal caregivers of adults with diagnosed illnesses | ||||
| Patient or population: Informal caregivers of adults with diagnosed illnesses | ||||
| Outcomes | Anticipated absolute effects* (95% CI) | № of participants | Certainty of the evidence | Comments |
| Risk with Telephone intervention | ||||
| Quality of Life End of intervention For all scales, higher scores indicated higher QoL. | The mean score for QoL in the intervention group was 0.02 standard deviations lower (0.24 lower to 0.19 higher) | 364 | ⊕⊕⊕⊝ | One further study reported that caregivers receiving a telephone intervention may have slightly higher QoL at end of intervention, compared with usual care. Overall, at the end of intervention, telephone interventions probably have little or no effect on caregiver QoL |
| Burden End of intervention Assessed with: Revised Memory and Behaviour Problem Checklist (0‐24 range), 24‐ and 26‐item Caregiver Reaction Assessment, Family Appraisal of Caregiving Questionnaire (Caregiver Strain subscale – Palliative Care), Burden Interview (22‐ and 12‐item inventories; 0‐4 scale), Modified BKOS scale (22‐item, 5‐point scale) For all scales, higher scores indicated higher burden. | The mean score for Burden in the telephone group was 0.11 standard deviations lower | 788 | ⊕⊕⊝⊝ | Two further studies reported caregiver burden. One reported that telephone interventions may decrease burden; the other reported no change in the intervention group, compared with usual care. Overall, at the end of intervention, telephone interventions may have little or no effect on caregiver burden. |
| Psychological health: Depression End of intervention Assessed with: Center for Epidemiologic Studies Depression Scale 11‐item SF, 10‐item and, 20‐item measures (including German version) (0‐3 scales), Brief Symptom Inventory (18‐item, 5‐point scale), and the Geriatric Depression Scale (30‐item, score range 0‐30) For all scales, higher scores were associated with increased depression/symptoms of depression. | The mean score for depression in the telephone group was 0.37 standard deviations lower (0.7 to 0.05 lower ) | 792 | ⊕⊝⊝⊝ | Three further studies reported caregiver depression. One reported that telephone interventions may decrease depression; the other two reported no change in the intervention group, compared with usual care. Overall, we are uncertain of the effects of telephone interventions on caregiver depression at the end of intervention. |
| Satisfaction with the intervention End of intervention | See comment | ‐ | ‐ | No study was found that assessed this outcome comparatively. Six studies measured satisfaction with the intervention in the intervention group only. All six reported high levels of satisfaction with the intervention (i.e. 'mostly', 'very much so', 'good' or 'excellent'). |
| Adverse events including suicide and suicide ideation | See comment | ‐ | ‐ | No studies measured these outcomes. |
| GRADE Working Group grades of evidence | ||||
| 1 Although participant numbers were relatively few at n = 364, they were deemed sufficient for studies evaluating these types of intervention in a population of informal caregivers; we therefore did not downgrade on sample size (imprecision) for this reason. 2 Most information was from studies at low or unclear risk of bias on most items in the 'risk of bias' tool, although in some studies, one or two risk of bias criteria were assessed as having high risk of bias. We therefore downgraded by 1 level for plausible risk of bias that could seriously alter the results. 3 Some variation in the effect estimates and moderate heterogeneity; evidence downgraded by 1 level (serious inconsistency). 4 Variation in the effect estimates across studies and substantial heterogeneity; evidence downgraded by 2 levels (very serious inconsistency). BKOS: Bakas Caregiver Outcomes Scale | ||||
| Telephone compared to non‐telephone support intervention for providing education and psychosocial support for informal caregivers of adults with diagnosed illnesses | ||||
| Patient or population: Informal caregivers of adults with diagnosed illnesses | ||||
| Outcomes | Anticipated absolute effects* (95% CI) | № of participants | Certainty of the evidence | Comments |
| Risk with Telephone | ||||
| Quality of Life | No studies measured this outcome | ‐ | ‐ | |
| Burden End of intervention Higher scores indicated greater burden. | The mean score for burden in the telephone group was 0.2 lower | 11 | ⊕⊝⊝⊝ | We are uncertain of the effects of telephone interventions on caregiver burden at the end of intervention. |
| Psychological health: Depression: End of intervention Assessed with: Center for Epidemiological Studies Survey‐Depression scale (20‐item, 0‐3 scale) Higher scores indicated higher levels of depression. | The mean score for depression in the telephone group was 4.3 lower (9.57 lower to 0.97 higher) | 11 | ⊕⊝⊝⊝ | We are uncertain of the effects of telephone interventions on caregiver depression at the end of intervention |
| Satisfaction with the intervention | No studies measured this outcome | ‐ | ‐ | |
| Adverse events including suicide and suicide ideation | No studies measured these outcomes | ‐ | ‐ | |
| GRADE Working Group grades of evidence | ||||
| 1 Most information from the 1 included study indicated low or unclear risk of bias on most items on the 'risk of bias' tool, although risk of bias was high for selective reporting. We therefore downgraded by 1 level for plausible risk of bias that could seriously alter the results. 2 Participant numbers were deemed insufficient at 11 and the upper and lower CI limits were > 0.5 from the effect size (downgraded by 2 levels for imprecision). | ||||
Background
Many people with diagnosed medical conditions are dependent upon family members and informal caregivers (that is, a caregiver who is not paid (Levine 2010)), to provide support and care, usually in the home of the person needing care (Care Alliance Ireland 2015; International Alliance of Carer Organisations 2016). The care provided varies according to individuals' needs, with care categories defined as low (mainly companionship, with some caring assistance), medium (instrumental care such as cooking and shopping), medium with personal assistance (such as washing and dressing) and high (including low and medium level caring when the person receiving care cannot provide much assistance to the caregiver) (Care Alliance Ireland 2015). In many instances, informal carers find themselves in a caring role for which they are ill prepared (Coleman 2015; Levine 2013; Nalder 2012). Providing care may impact negatively on the caregiver from an emotional, physical, social, and financial perspective (Care Alliance Ireland 2010; Glendinning 2009; OECD 2011). Internationally, the focus of health care is to have people cared for in the community for as long as is possible. The aim is to shift to community‐based and patient‐centred paradigms of care for the treatment of chronic diseases (WHO 2006); and, where possible, prevent admission to secondary healthcare facilities. Unpaid or informal caregivers have been described as the backbone of the healthcare system (Care Action Network 2013; Levine 2010; OECD 2013); and worldwide they play a key role in the provision of care, saving billions in healthcare expenditure (Levine 2010; Navine‐Waliser 2002).
Description of the condition
The international literature suggests that caregiving impacts similarly on caregivers irrespective of geographical location or of the illness being experienced by the care‐recipient. In a UK study, Golics 2013 reported that caregivers caring for family members with a range of illnesses experienced worry, frustration, anger, and guilt. For some, adjustment to the role is difficult and requires significant emotional and life changes. This is reflected across the world with national studies from Japan (Oshio 2015), South Korea (Do 2015) and Canada (Penning 2015) highlighting the negative effects of caregiving on informal caregivers.
Family members providing unpaid care have been described “…as a hidden 'patient' group…” (Golics 2013, p.795). The need for professional support for caregivers has been reported and highlighted across a range of acute (i.e. time‐bound and responsive to treatment) and chronic (i.e. not time‐bound, non‐curable and susceptible to remission and exacerbation) conditions (Murrow 1996). This includes support for caregivers of people surviving complex illnesses (Czerwonka 2015), patients with cancers ( Heese 2013; Merckaert 2013; Mosher 2013), mental health problems (Gavois 2006), stroke (Cameron 2013), Parkinson’s disease (Oguh 2013), dementia ( Lilly 2012; Van Mierlo 2012b; Zwaanswijk 2013) and multiple sclerosis (Corry 2009). Golics 2013 argues that having access to people with the knowledge and skill to provide support, in particular emotional support, may ease the burden of caring. Burden is a multidimensional concept that can be viewed objectively, in terms of externally observable phenomena, such as the financial impact of caring, or subjectively, in terms of how it is perceived by the individual (Buhse 2008). This may include the experience of strain, stress, or load as a result of the caring role (Buhse 2008).
Although the impact of caregiving may be similar, how it is experienced by caregivers differs. Within caregiver groups such as caregivers of older persons (Unson 2016), intensive care survivors (ICU) (Foster 2003), and people with schizophrenia (Roick 2007), researchers have noted that gender, relationship to the patient (Foster 2003; Roick 2007; Unson 2016) level of contact with the patient (Roick 2007; Unson 2016), younger age (Unson 2016) and unemployment (Roick 2007) all influence how caregivers experience burden. McCabe 2009 further reported lower mood and quality of life in caregivers of people with motor neurone disease and Huntington’s disease compared to caregivers of people with Parkinson's disease and multiple sclerosis. Adjusting to the role of caregiver has been described as a non–linear or oscillating process (Greenwood 2010; Robinson 2005) that is continual (O’Shaughnessy 2010), gradual and occurs over time (Hasson 2010; Robinson 2005), with the adjustment process differing for caregivers within and across conditions (Cameron 2016; Davidson 2012; Smith 2004).
Description of the intervention
Healthcare professionals commonly communicate with care‐recipients and their family members by telephone. A number of research studies have evaluated use of the telephone only (Bakas 2009; Hartke 2003; Van Mierlo 2012b), or the telephone as a component of an intervention (Borman 2009; Piamjariyakul 2013; Sepulveda 2008; Tremont 2008; Van Mierlo 2012b). Some of the interventions are delivered by healthcare professionals and others are delivered by peers (Goodman 1990), or co‐facilitated by befriending volunteers (Charlesworth 2008). In this review, the focus is on evaluating the telephone only, as a means of delivering a support intervention, by healthcare professionals for caregivers of people with acute and chronic conditions. In this review, a telephone intervention is defined as an intervention that enables healthcare professionals to verbally communicate remotely with caregivers. A healthcare professional is a trained healthcare person who has received specific healthcare education and training in the management and care of people with diagnosed conditions, their family members, significant others or caregivers (e.g. nurses, medical doctors, social workers, physiotherapists, occupational therapists, counsellors/psychologists, and dieticians/nutritionists).
How the intervention might work
Professional support
Healthcare professionals provide services to patients and families/caregivers that includes direct care to people with diagnosed illnesses and indirect care, in the form of supportive advice, professional information, and psychosocial/educational support. In general, the benefits of professional support are likely to be dependent on the issues being addressed (Rosland 2008), and the readiness and receptivity of the person receiving the support (Hogan 2002; Toseland 1989). Reinhard 2008 demonstrated that professional support selectively reduces caregiver burden for those caring for people with mental health problems. Specific types of professional support, such as practical advice in managing behaviours, were found to be helpful in reducing objective burden (family arguments, missing days at work, household disruptions) (Reinhard 2008). Deek 2016 also reported favourably on family‐centred self‐care interventions, delivered by trained personnel, for adults living with chronic conditions and concluded that appropriate education and support should be provided by healthcare professionals (Deek 2016). Professionals have the education and training to provide emotional support to caregivers, helping ease the social isolation and emotional demands of caregiving (Mittelman 1996).
Strategies to improve caregiver outcomes
Caregiver support programmes help promote caregiver health by providing psychological support, information, and education to caregivers, while taking cognisance of caregivers’ limited time and resources (Gendron 2013). These psychoeducational programmes help carers develop skills in identifying signs of distress, managing symptoms, coping strategies/skills, and provide help with finding and accessing social support services (Riess‐Sherwood 2002). The telephone has been described as a good means of exchanging information, providing health education and advice, managing symptoms, recognising complications early, giving reassurance, and providing quality service (Thompson 2007).
Strategies to improve caregiver outcomes include providing education or information, assisting carers with problem‐solving, learning coping skills/behaviours, effective use of resources, seeking out social support, and identification of signs of distress (Riess‐Sherwood 2002). Coping strategies have been effective in improving the psychological health of caregivers of people with dementia (Selwood 2007). Likewise preparedness to care was found to reduce caregiver burden for caregivers of older persons (Zwicker 2010), and those with cancer (Scherbring 2002; Zwicker 2010). It was also found to ameliorate some aspects of role strain (Archbold 1990), and was the strongest predictor for lowering caregiver stress in stroke caregivers (Ostwald 2009). Failure to help caregivers master the skills and ability to manage their own health and well‐being during the early phases of caregiving may lead to greater difficulty integrating strategies, such as coping strategies, into daily life in later stages of the caregiving process (Riess‐Sherwood 2002). All of these strategies are amenable to delivery via the telephone. Reinhard 2008 contends that "...even a simple one‐to‐one telephone call may be effective in helping the caregiver..." (p.345). In this review, any strategy involving education or psychosocial support, or a combination of these, that focused on improving caregiver outcomes (see 'Types of outcome measures' for further detail) was considered.
Barriers to supporting caregivers
Many factors mitigate against the delivery of strategies to provide support for caregivers. Professional support services in the community often lack funding and availability; and, when available, may be insufficient to meet the needs of people with chronic illnesses (Rosland 2010). The large numbers of caregivers means that face‐to‐face interventions are unlikely to be feasible (Wilz 2016), because of distance (Hartke 2003) or cost, time, and inconvenience (Hartke 2003; Wilz 2016).
Factors that help overcome barriers to supporting caregivers
When distance, inconvenience, being homebound, or reluctance to leave the care‐recipient hinder face‐to‐face interventions (Hartke 2003), telecommunications and other media can be used (Badr 2016). Wilz 2016 concluded that the telephone is highly acceptable to family carers and reported on two qualitative studies which indicated that such interventions may meet caregivers' needs in respect of information, guidance, professional, and emotional support. Badr 2016 also suggested that telecommunications and other media interventions would enable caregivers to manage their own feelings and promote their ability to care. These findings support earlier qualitative research which reported that telephone support was a convenient and trouble‐free means of providing support to caregivers of people with dementia (Salfi 2005).
Reported benefits of telephone support interventions for caregivers
Previous research indicated that caregiver telephone interventions lead to positive outcomes (Chi 2015; Topo 2009). In a systematic review of telehealth tools and interventions to support caregivers, 20 of the 65 included studies reported on telephone‐based interventions (Chi 2015). Detailed results from individual telephone‐based studies were not reported in the review, rather, a collective summary of the findings of all technology‐based interventions, such as videoconferencing, telemetry and remote monitoring were presented, with the authors stating that 62 of the 65 included studies (95%) reported that caregivers had significantly improved outcomes (Chi 2015). In a systematic review of social support interventions for caregivers of people with dementia, Dam 2016 reported mixed findings from telephone interventions, but further analysis of the included studies revealed that various research designs, including the 'pre‐test post‐test' design, were used, and, in some instances, the telephone was only a component of the intervention upon which the conclusions were formed.
The benefits of any intervention are dependent on timing, readiness of the recipient, and the nature of the issues that need to be addressed. Research indicated that support may only be effective when the recipient perceived a need for the support (Melrose 2015). In this sense, the appropriateness of professional support is likely to be dependent on the required effects. Although we could not find any studies that explicitly explored the differences between the effectiveness of professional and peer support for caregivers, a study by Rosland 2008 found that support from family and friends impacted on different self‐management behaviours for people with diabetes to those impacted upon by professionals. This suggests that, for some self‐management behaviours, family support may be required; but professional support is more appropriate for others and that the type of support offered should be guided by the desired outcomes. In general, professionals are more likely than non‐professionals to affect outcomes that require therapeutic intervention (e.g. psychological functioning and personal change), while non‐professionals are more likely to positively change participation in informal social support networks (Toseland 1989).
Why it is important to do this review
The number of caregivers internationally varies according to overall population with figures varying from 60,000 in Finland to 43.5 million in the USA (International Alliance of Carer Organisations 2016). It is estimated that across the Organisation for Economic Co‐Operation and Development (OECD) countries, more than one in 10 adults provide informal care. Across the European Union (EU), 19 million people provide care of which 9.6 million provide at least 35 hours' care a week (Glendinning 2009). This number is expected to grow by 2030 (Glendinning 2009). While the financial contribution of informal caregivers to international reduction in healthcare expenditure is unknown, it is estimated that informal caregivers contribute an annual estimated national reduction in healthcare expenditure varying from EUR 20 billion in Sweden to USD 470 billion in the USA (International Alliance of Carer Organisations 2016). This is likely to reflect the contribution of estimated care hours provided by informal caregivers.
The contribution of family members is being increasingly recognised as important to the provision and management of care in chronic illness (Rosland 2010), and across the spectrum of illnesses (Coleman 2015; Haines 2015). However, uptake of the support provided may not be feasible for caregivers owing to geographical location, time, and cost. A report on a survey of eight European countries highlighted that, while the availability of support for caregivers of people with dementia was high, uptake was low, and utilisation may depend on the degree of accessibility of the support and caregivers' ability to perceive, seek, reach out, pay, and engage with the services (Lethin 2016). The telephone provides a mode of intervention delivery that has the potential to increase accessibility and affordability of support programmes.
Distribution of caregivers and telephone availability
As caregivers live in the community, are regionally and nationally dispersed, and are often in paid employment in addition to their unpaid caregiving role (International Alliance of Carer Organisations 2016; OECD 2011), face‐to‐face contact with people who can provide emotional support and advice is not always feasible. Attendance‐based interventions can be time‐consuming and expensive for the caregiver (Kaltenbaugh 2015; Ravenson 2016). Telephone communication is widely available internationally, with almost everyone having some form of access to a telephone including individuals living in remote settings (Lavender 2013). Pew Research Centre 2015 reported a median of 84% mobile phone ownership in emerging and developing countries with mobile phone ownership rates ranging from 47% to 97% in Pakistan and China, respectively. In 2011, of the 5.3 billion users of mobile phones worldwide, 3.5 billion were from developing countries (Shozi 2013), and it is projected that 70% of the world population will use smartphones by 2020 (Williams 2015), which will equate to more than 6.1 billion users (Lunden 2015). However, 10% of the world's population do not have access to mobile phones, with the majority of these from the rural areas of Asia and sub‐Saharan Africa (Consumer Technology Association 2015). Seventeen percent of people in sub‐Saharan Africa do not own a mobile phone but more than half of those people have, at times, access to a fixed line phone (Pew Research Centre 2015). Despite this, the mobile market growth rate in sub‐Saharan Africa is one of the highest worldwide (Deloitte 2012); and the growth in mobile phone networks has transformed communications in sub‐Saharan Africa, an area with the highest disease burden (Vos 2015).
Feasibility of technology‐based interventions
Research studies, in particular studies in stroke, dementia, and human immunodeficiency virus, indicate that technology‐based interventions can be feasibly implemented for caregivers of people with many different conditions (Brereton 2007; Herman 2006). Integrating telephone/mobile technology into current healthcare strategies provides a potential means for new ways for healthcare professionals to deliver care to patients and their caregivers (Deloitte 2014). Finkel 2007 argued that "...technology offers a cost effective and practical method for delivering interventions to caregivers” (p.443). Despite this assertion, there is little evidence currently of economic advantage (an aspect explored in this review) other than the suggestion that the need for healthcare professionals and caregivers to travel is eliminated, and caregiver access to existing resources and programmes is enhanced (Finkel 2007).
Factors that mitigate against implementation of findings to date
A number of factors mitigate against the usefulness of the findings from existing literature reviews and individual studies that included a telephone component. For example, in a literature review on technology studies to meet the needs of people with dementia and their caregivers, in which 15 of the included studies focused on caregiver interventions (Topo 2009), most of the interventions were complex interventions with the telephone as one component. As outcomes from the specific components of the intervention were not isolated or presented individually, the benefit of the telephone alone was difficult to determine. Failure to isolate or present findings from individual components of a multicomponent intervention can limit the application of such interventions. If the benefits from a multicomponent intervention could be realised with the application of any one component of the intervention, this needs to be highlighted so that healthcare resources are applied in an efficient and effective manner. Likewise, the potential benefits of telephone‐only support interventions, delivered by healthcare professionals to individuals or groups, need to be established. There is little empirical evidence to support the effectiveness of group interventions over interventions delivered to participants individually (Toseland 1989). While studies evaluated the effects of different modes of delivering interventions to groups, e.g. telephone versus face‐to‐face, we were unable to find any studies that evaluated the effects of a telephone group versus telephone one‐to‐one approach to intervention delivery, although these studies may be conducted in the future.
No Cochrane review was found that focused on telephone‐only support interventions for informal caregivers across a range of medical conditions. We found one Cochrane review that used the telephone for delivering a counselling intervention by healthcare professionals to caregivers of people with dementia only (Lins 2014). In a meta‐analysis of three trials in this review, depressive symptoms from telephone counselling alone were reduced and potential positive effects of other outcomes, including distress, burden, anxiety, quality of life, self‐efficacy, satisfaction, and social support, were also suggested. While the studies included in Lins 2014 were likely to be included in this review, we planned to analyse them along with telephone support interventions for a range of conditions, so improving our knowledge on the telephone's effectiveness as a means of delivering psychosocial support or education to caregivers of people across a broad spectrum of conditions. This Cochrane review differs from other Cochrane reviews on caregiver interventions (Aubin 2012; Chan 2011; Ellis 2010; Forster 2012; Legg 2011; Vernooij‐Dassen 2011), as, unlike these reviews, the main objective of our review was to determine whether or not the telephone alone as a mode of delivering a support intervention to caregivers of diagnosed illnesses was effective. Other Cochrane reviews that differ from our review include those by Candy 2011 and Lavender 2013. Candy 2011, who evaluated peer‐support interventions for caregivers, did not report any findings specific to the telephone. Lavender 2013 concluded that there was insufficient evidence to recommend routine telephone support for women accessing maternity services.
Two Cochrane protocols where telephone interventions were likely to be included as part of the review were identified (González‐Fraile 2015; Santin 2012). González‐Fraile 2015 focused on the provision of information, support, and training for informal caregivers of people with dementia and indicated that the telephone is a potential format for administering the intervention. Santin 2012 focused on psychosocial interventions for informal caregivers of people living with cancer, stating that interventions that included telephone counselling would be included. Although there may be some overlap between these two reviews and our review, the overall scope of this review is broader and has a specific focus on the telephone only as the mode of intervention delivery across a range of conditions.
In summary, the need for professional support for caregivers across a range of conditions is well established. As difficulties for caregivers attending face‐to‐face interventions have been highlighted (Badr 2016; Wilz 2016), telephone‐based interventions across caregiver groups provide a potentially important alternative. To date, there is no Cochrane review on the effectiveness of telephone support interventions alone, delivered by healthcare professionals, for caregivers across a range of medical conditions. It is therefore important to determine whether or not support interventions delivered by telephone are effective so that healthcare professionals can make informed decisions about whether or how to use the telephone in providing support to caregivers, should it be shown to be effective. Consequently, this review set out to determine the effectiveness of education or psychosocial support interventions, or a combination of both, delivered exclusively by telephone and by healthcare professionals, for informal caregivers of people with diagnosed illness. The results of this review have the potential to inform strategy on the use of the telephone as an easily accessible, low‐cost method to provide high‐quality care with the potential to benefit hundreds of thousands of informal caregivers worldwide. It can also contribute to the primary care agenda by delivering healthcare to caregivers and patients in remote and rural areas. In addition, the findings will assist with research, resource allocation, and future planning for the promotion and optimisation of the health and well‐being of informal caregivers.
Objectives
To evaluate the effectiveness of telephone support interventions, delivered by healthcare professionals, when compared to usual care or non‐telephone‐based support interventions for providing education and psychosocial support to informal carers of people with acute and chronic diagnosed illnesses, on these carers' quality of life, psychosocial, and physical well‐being. We aim, additionally, to evaluate the cost‐effectiveness of telephone interventions.
Methods
Criteria for considering studies for this review
Types of studies
We included randomised controlled trials (RCTs) (including cluster‐RCTs) and quasi‐RCTs. We included multi‐arm studies that used a pairwise comparison of groups that otherwise met the inclusion criteria for this review (Higgins 2011), and where data specific to the telephone component of the intervention could be extracted in isolation. We excluded studies where the caregivers and care‐recipients received the intervention together or caregivers were only included if they chose to take part in the intervention which was offered to the care‐recipient. We also excluded cross‐over trials as there is a high risk of carry‐over effects from one intervention to another (Higgins 2011).
Types of participants
We included informal adult caregivers, defined as persons aged 18 years or over, caring for adult individuals with a diagnosed illness and in receipt of telephone intervention support from a healthcare professional. For the purpose of this review, a caregiver was defined as a person (family member, friend, or significant other) who provides personal help (support or care) for a person with an acute or chronic illness, and was not a paid healthcare provider. Caregivers are also commonly referred to as 'carers' in the literature, and are used interchangeably in this review. An acute illness was defined as a diagnosed condition lasting less than six months and a chronic illness was defined as a diagnosed condition lasting for six months or more. We included caregivers of people with both acute and chronic illnesses because categorisation of conditions can be difficult. Acute conditions can become chronic and chronic conditions can have acute episodes of illness. Many patients have multiple conditions and may have an acute condition superimposed upon a previously diagnosed chronic condition. In this context, separation of diseases into acute and chronic categories, or exclusion of one category from the review, did not seem appropriate, as the experiences and needs of caregivers were not likely to be neatly divided along these lines. The inclusion of both acute and chronic conditions therefore enabled us to capture and consider studies across the range of illnesses impacting on caregivers in the community.
We included telephone support interventions delivered by healthcare professionals to caregivers of people with a range of diagnosed illnesses who were living in a hospital, residential care, or in the community. The following provides an indicative list of examples, based on author familiarity with the subject area and referenced sources, as available. These examples of condition categories are intended to be illustrative rather than exhaustive.
-
Complex critical illness survivors (i.e. people who need caregivers on the path to recover from the intensive care unit to the home environment).
-
Mental health: severe mental illnesses (e.g. schizophrenia, depression, bipolar affective disorders) (Vermeulen 2015).
-
Neurological conditions (e.g. dementia, epilepsy, multiple sclerosis, Parkinson's disease, stroke, traumatic brain injuries, Huntington's disease, headache disorders, neuro‐infections, pain associated with neurological disorders) (WHO 2006).
-
Respiratory conditions (e.g. asthma, chronic obstructive airways disease).
-
Cardiac conditions (e.g. congestive heart failure, myocardial infarction).
-
Renal conditions (e.g. renal failure).
-
Orthopaedic conditions (e.g. hip fractures, spinal injuries).
-
Musculoskeletal (e.g. degenerative osteoarthritis).
-
Infections (e.g. HIV/AIDS).
-
Haematological conditions (e.g. post‐bone marrow transplant).
-
Endocrine (e.g. diabetes 1 and 2).
-
Alcohol, drug or substances issues/misuse.
-
Cancer: any category.
-
Terminal illness: due to any of the above conditions.
-
Older persons: frail older persons or older persons with any of the above conditions.
-
People with comorbidity or multimorbidity.
Types of interventions
We included all telephone support interventions delivered by healthcare professionals that provided education or psychosocial support or a combination of these for informal caregivers. Telephone interventions where the first session was an introductory session either delivered by telephone or face‐to‐face and where all remaining sessions were delivered by telephone were included. Accordingly, we excluded all caregiver interventions that were not telephone‐based, telephone interventions delivered by non‐healthcare professionals and telephone interventions targeted towards paid caregivers, patients, people living in the community who were not informal caregivers, and healthcare professionals. Neither did we include interventions that included the telephone as a component of a multicomponent intervention where the findings for the telephone component of the interventions could not be isolated. Telephone interventions with more than one face‐to‐face session or where the first face‐to‐face session followed an overall introductory session to the intervention were also excluded.
We included trials that compared a telephone support intervention delivered by a healthcare professional with either ‘usual’ care (as defined by the study's authors, and described in the Characteristics of included studies table), or a support intervention delivered by a healthcare professional that was not telephone‐based (for example, online or face‐to‐face delivery at the individual or group level), analysing these comparisons separately. Educational, psychosocial, and combined psychosocial educational interventions were included. The term 'psychosocial interventions' refers to the cognitive, behavioural and/or social mechanisms of action, e.g. counselling, psychoeducation, behavioural and cognitive intervention and social support, that aim to improve the psychosocial and physical well‐being of carers of people with chronic conditions.
Educational interventions, which in many instances include information provision, are often more difficult to pin down and define. For the purposes of this review, we categorised an education intervention as one in which information was provided for the purpose of increasing the carer's factual knowledge, as well as interventions that included a component that ensured that the carer understood the information given and could put it into action (Mahan 1963), and/or where the intervention was defined or described as an education intervention by the trial/study authors. The following operational definitions were used to identify papers for inclusion in our review:
-
A healthcare professional was defined as a registered healthcare practitioner, who might or might not be a member of the wider clinical team, who had received an education or training qualification and who provided telephone education and psychosocial support to caregivers. This included nurses, social workers, medical doctors, counsellors, psychologists, and other related allied healthcare professionals.
-
A telephone intervention referred to any intervention, delivered via the telephone, with an education or psychosocial (mental, emotional, social, or spiritual) focus, or a combination of these, that was designed to provide knowledge, advice, or help to caregivers in order to enable them to manage their own well‐being or that of the person they cared for. This support could be provided individually or in group format. For the purpose of this review, telephone interventions included calls from any device that enabled audio communication between healthcare professionals and caregivers, including calls made using landlines, mobile phone devices, and devices that enabled the use of Skype or other applications that facilitated verbal communication between healthcare professionals and caregivers. Telehealth interventions that provided online education or interventions other than telephone calls between healthcare professionals and caregivers were excluded.
Types of outcome measures
The following outcomes, where reported, were assessed at several time points, reflecting the possible changes in caregiver outcomes over time. All outcomes were assessed at the end of intervention delivery and at short‐term (≤ 3 months), medium‐term (> 3 to ≤ 6 months) and longer‐term time points (> 6 to 12 months) following intervention delivery.
Primary outcomes
-
Caregiver quality of life (QoL) as measured by the trial/study authors or using a standardised/validated measurement instrument (e.g. SF 36, WHOQoL or caregiver QoL index).
-
Caregiver burden as measured by the trial/study authors or using a standardised/validated measurement instrument (e.g. Caregiver Reaction Assessment, Carer Burden Inventory, or Caregiver Strain Index).
Secondary outcomes
The following secondary outcomes, where reported, were measured.
-
Skill acquisition (preparedness to care, caregiver competence, problem‐solving).
-
Psychological health (depression, anxiety, stress, coping).
-
Knowledge and understanding (knowledge).
-
Health status and well‐being (physical health, self‐efficacy, social activity).
-
Family functioning.
-
Satisfaction (satisfaction with the intervention, perceived satisfaction with practical or other supports such as technical aids, peer support, or self‐help groups).
-
Economic outcome data as reported from cost benefit analysis, cost‐effectiveness analysis, cost utility analysis.
Unintended outcomes that could be attributed to the intervention were considered adverse events. These included any worsening of the above outcomes in the intervention group, as reported by the study authors or as evident in worsening at the end of intervention from baseline (pre‐intervention) measurement, where provided in the included studies, in particular, anxiety and depression. Reported incidents of suicide ideation and suicide were also considered adverse events.
Outcomes reported in the included studies were categorised to the groupings above by two authors working independently. Had any differences in categorisation occurred, they would have been resolved by involvement of a third author, but this was not necessary.
The results of the following outcomes, where reported are presented in a 'Summary of findings' table (summary of findings Table for the main comparison and summary of findings Table 2).
-
Caregiver quality of life.
-
Caregiver burden.
-
Psychological health (depression, anxiety, stress, coping).
-
Satisfaction (satisfaction with the intervention).
-
Suicide ideation and suicide.
Search methods for identification of studies
Electronic searches
We searched the following electronic databases using a combination of appropriate keywords and controlled vocabulary terms.
-
The Cochrane Central Register of Controlled Trials (CENTRAL) in the Cochrane Library (searched on 3 April 2017, updated 16 November 2018);
-
MEDLINE [Ovid] (1946 to 3 April 2017, updated 16 November 2018);
-
Embase [Ovid] (1947 to 3 April 2017, updated 16 November 2018);
-
PsycINFO [Ovid] (1597 to 3 April 2017, updated 16 November 2018);
-
ProQuest Dissertations and Theses A&I [ProQuest] (1743 to 18 April 2017, updated 16 November 2018);
-
CINAHL Complete [Ebsco] (1937 to 3 April 2017, updated 16 November 2018).
The strategy for MEDLINE [Ovid] is presented in Appendix 1. This strategy was tailored to the other databases, as appropriate, and provided in Appendix 2; Appendix 3; Appendix 4; Appendix 5; Appendix 6; Appendix 7; and Appendix 8. No language or date restrictions were applied.
Searching other resources
To identify any further potentially eligible studies that might not have been captured in our search of the electronic databases, we searched the grey literature database Open Grey and manually searched the reference lists of the studies included in our review. We also searched online trial registers, including the World Health Organization (WHO) International Clinical Trials Registry Platform (ICTRP), searched on 18 April 2017, and ClinicalTrials.gov, searched on 6 June 2017, for ongoing and recently completed studies. We contacted experts in the field and authors of included studies for advice as to other potentially relevant studies. In addition, we searched the following websites: Grey Matters, primarily for details of international Health Technology Assessment agencies; RIAN, for Irish open access research; various caregiver associations (Care Alliance Ireland, Canadian Caregiver Coalition, Carers UK, Carers Friends UK, Crossroads, Eurocarers, Family Caregiver Alliance (US), New Zealand Carers, Patient View, The Princess Royal Trust for Carers, International Caregivers Association); and conference links (Dementia Care Events ‐ International Caregivers Association, Caregiver Intervention database – The Rosalynn Carter Institute for Caregiving and the US Department of Veteran Affairs, Health Services Research & Development).
Data collection and analysis
Data collection was conducted in accordance with the published protocol (Corry 2017). Due to the small number of studies identified for each intervention type, duration, and caregiver group, data were analysed by outcome at each outcome time point following intervention delivery (end of intervention, short‐term (≤ 3 months), medium‐term (> 3 to ≤ 6 months) and longer‐term time points (> 6 to 12 months)).
Selection of studies
All database search results were merged using reference management software EndNote and duplicate citations were removed. Two pairs of two review authors (MC & KN and MC & SB) screened the titles and abstracts identified from the searches to determine those that met the inclusion criteria. Each pair independently screened half of the selected titles and abstracts, with MC screening all citations. We retrieved the full text of any papers identified as potentially relevant by at least one author. The same pairs of reviewers independently screened full‐text articles for inclusion or exclusion, with discrepancies resolved by discussion and by consulting a third reviewer (VS) as was necessary, to reach consensus. Studies were not excluded on the basis of non‐measurement/reporting of our reviews’ prespecified outcomes, where all other inclusion criteria were fulfilled. All potentially relevant papers excluded from the review at this stage are listed, with reason(s) for exclusion, in the 'Characteristics of excluded studies' table. We also provided citation details and any available information about ongoing studies, and collated and reported details of duplicate publications, as each study (rather than each report) was the unit of interest in the review. We reported the screening and selection process in an adapted PRISMA flow chart (Mohler 2009) (Figure 1).

Study flow diagram.
Data extraction and management
The same pairs of review authors extracted data independently from the included studies. For the included study conducted by one of the review authors (Corry 2015), data extraction was undertaken by other review authors. Clear decision rules based on participants, interventions, comparators, and outcomes were developed to assist the reviewers prior to commencing data extraction. Any discrepancies were resolved by discussion until consensus was reached, or through consultation with a third reviewer (VS) as was necessary. If disagreements had remained unresolved, the study authors would have been contacted for study details that would lead to a resolution of the disagreement; however, this was not necessary.
We developed and piloted a data extraction form using the Cochrane Consumers and Communication Review Group Data Extraction Template (available at: cccrg.cochrane.org/author‐resources). We extracted the following data: aim of study, location, study design and methods, medical condition of care‐recipient, intervention type and detail, comparison, number and detail of participants, ethical approval, risk of bias, outcomes of interest, data and results, and funding sources.
As recommended by Herbert 2005, we noted and recorded any reported quality descriptions or rating by the study authors. We modified Section 5 of the data extraction form to ensure that we extracted data that allowed us to evaluate the quality of the intervention in terms of the framework used to develop the intervention, stated aim/goal of the intervention, match between intervention and stated goal, intensity of the intervention in terms of frequency of delivery/receipt (weekly, bi‐weekly, two‐weekly, monthly) and duration (in months), and fidelity to the intervention in terms of the extent to which it was delivered in a consistent manner (Bellg 2004; Mars 2013), and in accordance with the intervention trial protocol (Gearing 2011; Mars 2013). The extent to which contamination was minimised and monitored, the selection and standardisation of training the interventionists, standardisation and monitoring the delivery of the intervention, monitoring receipt of the intervention and the ability of participants to use the skills are all important aspects of fidelity which were evaluated (Bellg 2004; Mars 2013; Resnick 2005). We devised and piloted a quality‐assessment instrument based on Section 5 of the data extraction form, which enabled us to categorise the interventions as low‐, medium‐, or high‐quality based on the extent to which it was developed and delivered in accordance with best practice guidelines (Bellg 2004; Corry 2010; Gearing 2011; Mars 2013; MRC 2008).
One review author (MC) entered all extracted data into Review Manager 5 (RevMan 2014), and a second review author (VS) working independently, checked it for accuracy against the data extraction sheets.
Assessment of risk of bias in included studies
We assessed and reported on the methodological risk of bias of included studies in accordance with the Cochrane Handbook for Systematic Reviews of Interventions (Higgins 2011a) and the guidelines of the Cochrane Consumers and Communication Group (Ryan 2013), which recommend the explicit reporting of the following individual elements for RCTs: random sequence generation; allocation sequence concealment; blinding (participants, personnel); blinding (outcome assessment); completeness of outcome data; selective outcome reporting; and other sources of bias such as unbalanced groups and risk of contamination. We considered the 'risk of bias' domains separately for the different outcomes, and judged each outcome as high, low, or unclear risk of bias using the guidance provided by Higgins 2011a, and provided a quote or used information from the study reports to support our judgements for each domain provided in the 'Risk of bias' tables.
Studies were deemed to have the highest risk of bias if they were scored as high or unclear risk of bias on both sequence generation and allocation concealment and high or unclear on either risk of contamination, selective outcome reporting, or attrition bias domains, based on growing empirical evidence that these factors are particularly important potential sources of bias (Higgins 2011a). Blinding is not always possible at the point of intervention delivery and receipt due to the nature of the intervention, and, for this reason, lack of blinding of participants and personnel was not considered as a critical source of bias in this review and this domain was not rated as at high risk of bias.
In all cases, two review authors (MC & KN or MC & SB) independently assessed the risk of bias of included studies, with any disagreements resolved by discussion to reach consensus. For the lead review author's included study (Corry 2015), two other reviewers (KN & SB) assessed the study's risk of bias. We contacted study authors for additional information about the included studies, or for clarification of the study methods, as required. Had quasi‐RCTs been included in the review, we would have assessed and reported quasi‐RCTs as being at high risk of bias on random sequence generation; this was not necessary, however, as no quasi‐RCTs were included. If cluster‐RCTs had been included in the review, we would have assessed and reported the risk of bias associated with an additional domain: selective recruitment of cluster participants; this was not necessary, however, as no cluster‐RCTs were included in the review. For the one multi‐arm trial included in the review (Vazquez 2016), had the outcomes not been reported for each arm of the trial separately, we would have evaluated the risk of selective reporting of comparisons of intervention arms; this, however, was not necessary. 'Risk of bias' judgements for the included studies are presented in Figure 2 and Figure 3.
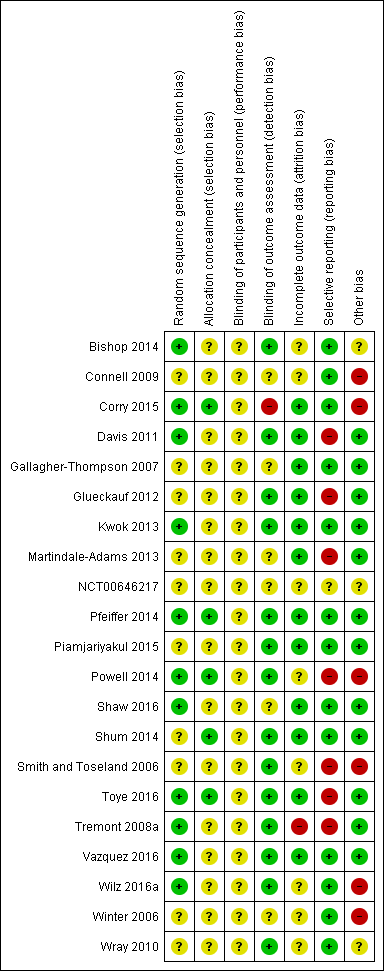
Risk of bias summary: review authors' judgements about each risk of bias item for each included study.

Risk of bias graph: review authors' judgements about each risk of bias item presented as percentages across all included studies.
Measures of treatment effect
For dichotomous outcomes, such as those that may have been reported on the Caregiver Strain Index (CSI)/Caregiver Burden Scale (CBS‐M), we had planned to analyse data based on the number of events and the number of people assessed in the intervention and comparison groups, and use these to calculate the risk ratio (RR) and 95% confidence interval (CI). As none of the included studies reported any of the review's prespecified outcomes in this way, RRs were not reported in the review. For continuous measures, we analysed data based on the mean, standard deviation (SD), and number of people assessed for both the intervention and comparison groups to calculate mean difference (MD) and 95% CI. If the MD was reported without individual group data, we used this to report the study results. Where more than one study measured the same outcome but used a different measurement scale, we calculated the standardised mean difference (SMD) and 95% CI using the inverse variance method in RevMan 2014.
Where a study reported on more than one outcome from an outcome category, and the outcomes were included in a meta‐analysis, we selected the outcome that the study authors had identified as being their primary outcome. Where no primary outcome had been identified, we selected the one specified in the study's sample size calculation. If there were no sample size calculations, we ranked the effect estimates of the outcomes (as presented in the study’s results) and selected the median effect estimate. Where there was an even number of outcomes, the outcome whose effect estimate was ranked n/2, where n is the number of outcomes, was selected. Results, where feasible, were reported at different follow‐up times: end of intervention, short‐term (following end of intervention to ≤ 3 months), medium‐term (> 3 to ≤ 6 months) and long‐term (> 6 to 12 months).
Unit of analysis issues
For multi‐arm trials, we extracted data from comparisons relevant to our review; i.e. we extracted data from study arms that compared the effects of telephone‐only interventions delivered by healthcare professionals to usual care or a support intervention delivered by healthcare professionals that was not telephone‐based, for caregivers of persons with diagnosed acute illness who were living in a hospital, residential care, or the community. To avoid a unit of analysis error, in accordance with Higgins 2011a guidelines, in the one multi‐arm trial included in the review (Vazquez 2016), because the intervention groups' data were analysed separately, we divided the numbers for the comparator group by half prior to analysis to avoid over‐counting of data. Although no cluster‐RCTs were included in the review, for future updates, where cluster‐RCTs are included, we will check for unit of analysis errors. If errors are found, and sufficient information is available, we will re‐analyse the data using the appropriate unit of analysis, by taking account of the intracluster correlation (ICC). We will obtain estimates of the ICC by contacting authors of included studies, or impute the ICC using estimates from external sources. If it is not possible to obtain sufficient information to re‐analyse the data, we will report effect estimates and annotate unit of analysis errors. If necessary, we will seek further expert statistical advice when analysing data from cluster trials in any future update of this review.
Dealing with missing data
We contacted study authors to obtain missing data (participant, outcome, or summary data), where it was necessary and appropriate to do so. For participant data, where possible, we conducted analyses on an intention‐to‐treat basis; otherwise, data were analysed as reported and noted as a potential source of bias in our 'Risk of bias' assessments. Studies of telephone interventions for caregivers are likely to have high loss to follow‐up, with attrition rates of up to 45% reported in intervention groups (Tremont 2008) and 65% for control groups (Glueckauf 2007). We reported on the levels of loss to follow‐up and assessed this as a source of potential bias where more than 40% loss to follow‐up on primary outcomes was reported and considered this high risk of bias. Following attempts to contact study authors, where we failed to obtain missing outcome data, the denominator for each outcome in each trial was the number randomised minus any participants whose outcomes were known to be missing; that is, we used the numbers as reported in the included study. For continuous data, where measures of central tendency and variance, for example, medians and standard errors, were sufficiently provided in a study report, we converted these to means and SDs where possible, using the appropriate formulae, and inputted these values accordingly. If means only were available, we used the SD from another study in the review for the same outcome, where it was appropriate to do so (Higgins 2008).
Assessment of heterogeneity
The included studies were analysed by outcome, irrespective of care‐recipients' condition or duration of the intervention, and by follow‐up time‐frames (end of intervention, short‐term follow‐up to ≤ 3 months, medium‐term > 3 to ≤ 6 months and long‐term > 6 to 12 months). Where studies were considered similar enough in terms of populations, intervention, outcome measures, and timing of outcome assessment to allow pooling of data using meta‐analysis, we assessed the degree of heterogeneity by visual inspection of forest plots and by examining the Chi² test for heterogeneity. Heterogeneity was quantified using the I² statistic. An I² value of 50% or more was considered to represent substantial levels of heterogeneity, but this value was interpreted in light of the size and direction of effects and the strength of the evidence for heterogeneity, based on the P value from the Chi² test (Higgins 2011a). Where there are few trials included in a meta‐analysis, the Chi² test has little power to detect heterogeneity. In such instances, a non‐significant result was interpreted with care and was not taken as evidence of no heterogeneity. Where we detected substantial clinical, methodological or statistical heterogeneity across included studies, we did not report pooled results from meta‐analysis but, instead, used a narrative approach to data synthesis. In this event, we attempted to minimise clinical or methodological heterogeneity by grouping studies that were similar in terms of populations, intervention features, and timing of outcome assessment in the analyses.
Assessment of reporting biases
We assessed reporting bias qualitatively based on the characteristics of the included studies (e.g. if only small studies that indicated positive findings were identified for inclusion), and if information that we obtained from contacting experts and authors of studies suggested that there were relevant unpublished studies. Had we identified sufficient studies (at least 10) for inclusion in a meta‐analysis for an outcome, we would have constructed a funnel plot to investigate small‐study effects, which may indicate the presence of publication bias; this, however, was not required. Had it been necessary, we would have formally tested for funnel plot asymmetry, with the choice of test made based on advice in Sterne 2011 and bearing in mind, when interpreting the results, that there may be several reasons for funnel plot asymmetry; we will consider this in any future updates, as necessary.
Data synthesis
Decisions on whether to meta‐analyse data were based on whether the included studies were similar enough in terms of populations, intervention, outcome measures, and timing of outcome assessment to ensure meaningful conclusions from a statistically pooled result. Owing to the observed variability in the caregiver groups, intervention types, duration of intervention delivery, and timing of outcome measurements, we used a random‐effects model for the meta‐analyses. Within the data categories, the main comparisons of the review were telephone support interventions delivered by healthcare professionals versus usual care and telephone support interventions delivered by healthcare professionals versus an alternative support intervention delivered by a healthcare professional that was not telephone‐based, for persons caring for adults with diagnosed illness. For outcomes that could not be meta‐analysed, we reported the results narratively according to timing of outcome assessment (end of intervention, short‐term completion of the intervention to ≤ 3 months; medium‐term > 3 to ≤ 6 months; and long‐term > 6 to 12 months).
Subgroup analysis and investigation of heterogeneity
Potential explanatory factors included type of condition (acute or chronic), caregiver group (diagnosis), intervention type (education or psychosocial support) and form of delivery (individual or group). There were insufficient included studies providing data for subgroup analyses; however, had there been sufficient studies, we would have conducted subgroup analyses separately on the primary outcomes for the following groups.
-
Intervention type (education, psychosocial, education and psychosocial combined).
-
Approach to telephone intervention delivery (group, one‐to‐one).
-
Caregiver characteristics (condition of the person being cared for grouped by category of condition (e.g. cardiac, cancer, or respiratory), gender, age (young/older caregivers), relationship to the care‐recipient).
-
Acute versus chronic illnesses.
-
Intervention duration (≤ 6 weeks, 7 to 12 weeks, 13 to 23 weeks, ≥ 24 weeks).
Sensitivity analysis
We had planned to examine the impact of studies that were categorised as high risk of bias on the outcomes in the overall meta‐analyses. However, most studies were rated as at high risk of bias overall, and, in many cases, meta‐analyses did not include a large enough number of studies to make such analysis meaningful. Similarly, we did not explore the influence of excluding unpublished studies and large studies on the overall effect size as planned, as this was not possible due to limited study numbers in meta‐analyses; we will, however, consider these methods for future updates.
‘Summary of findings’ table
We prepared a 'Summary of findings' table to present the results based on the methods described in chapter 11 of the Cochrane Handbook for Systematic Reviews of Interventions (Schünemann 2011) and the guidelines of the Cochrane Consumers and Communication Group (Ryan 2016; Ryan 2016a). We presented the results for the major comparisons of the review, for each of the primary outcomes (quality of life and burden), psychological health (depression), satisfaction (with the intervention) and the potential harms/adverse events, as outlined in the Types of outcome measures section. Where more than one outcome was reported per category we used the methods described above to select outcomes for reporting in the ‘Summary of findings’ tables. We used the GRADE system to rank the quality of the evidence using the GRADEprofiler (GRADEpro) software (Schünemann 2011). In future updates, if necessary, we will provide a source and rationale for each assumed risk cited in the table(s), as needed. For outcomes where a meta‐analysis was not possible, we presented the results narratively.
Ensuring relevance to decisions in health care
The protocol and the review received feedback from at least one consumer referee in addition to a health professional as part of the Cochrane Consumers and Communication Group’s standard editorial process. During the development of the review, a caregiver provided comment; no changes were made to the review on receipt of the comments.
Results
Description of studies
See: Characteristics of included studies; Characteristics of ongoing studies; Characteristics of excluded studies and Characteristics of studies awaiting classification.
Results of the search
Electronic searches generated a total of 10,719 citations, of which 3,405 were duplicate citations across databases and were removed, resulting in 7,314 records. Searching of additional sources identified twenty further records for potential inclusion, resulting in 7,334 records for assessing for relevance on title and abstract. Of these, 7,114 citations were excluded following title and abstract screening, resulting in 220 for full‐text screening. Following full‐text review, a further 184 were excluded primarily because the comparator also included the telephone or a component of the comparator was telephone‐based, the intervention was patient‐focused, both the caregivers and care‐recipients received the intervention together, or the study did not use a randomised design (see Characteristics of excluded studies). Fourteen citations are awaiting classification (Au 2014; Bass 2017a; Chodosh 2015a; Chwalisz 2017; Gitlin 2018; Mavandadi; NCT00031265; NCT00183781; NCT00416078; NCT00869739; NCT02152033; NCT02215187; NCT02505425; NCT03260608) and ten are classified as ongoing studies (Gitlin 2013; Gopinah 2017; Heckel 2015; Mavandadi 2017; Nasiriani 2017; NCT00646074; NCT02505737; NCT02806583; Soellner 2015; Wilz 2018).
Included studies
Twenty‐one studies involving 1,690 caregivers, across 36 citations, reporting on randomised trials of healthcare professional‐led telephone caregiver support, were included in the review (Bishop 2014; Connell 2009; Corry 2015; Davis 2011; Gallagher‐Thompson 2007; Glueckauf 2012; Kwok 2013; Martindale‐Adams 2013; NCT00646217; Pfeiffer 2014; Piamjariyakul 2015; Powell 2014; Shaw 2016; Shum 2014; Smith and Toseland 2006; Toye 2016; Tremont 2008a; Vazquez 2016; Wilz 2016a; Winter 2006; Wray 2010). Two studies compared the intervention to a non‐telephone professional‐led support intervention (Gallagher‐Thompson 2007; Glueckauf 2012), both self‐identified pilot studies. All others compared the intervention to a usual care/control group, of which three were self‐identified pilot studies (Bishop 2014; Piamjariyakul 2015; Vazquez 2016). One study did not contribute any data for analyses (NCT00646217): this was a completed trial, available only as a registered trial, with no available data following author contact. Thirteen studies were conducted in the USA (Bishop 2014; Connell 2009; Davis 2011; Gallagher‐Thompson 2007; Glueckauf 2012; Martindale‐Adams 2013; NCT00646217; Piamjariyakul 2015; Powell 2014; Smith and Toseland 2006; Tremont 2008a; Winter 2006; Wray 2010), two in Hong Kong (Kwok 2013; Shum 2014), two in Germany (Pfeiffer 2014; Wilz 2016a), two in Australia (Shaw 2016; Toye 2016), one in the Republic of Ireland (Corry 2015) and one in North West Spain (Vazquez 2016). Almost half of the studies (n = 10) were conducted with carers of persons with chronic conditions (Connell 2009; Corry 2015; Davis 2011; Glueckauf 2012; Martindale‐Adams 2013; Pfeiffer 2014; Piamjariyakul 2015; Tremont 2008a; Wilz 2016a; Winter 2006), two were conducted with caregivers of persons with acute conditions (Powell 2014; Shaw 2016), one for caregivers of persons with an acute condition which may have included persons with an acute exacerbation of a chronic condition (Toye 2016), and eight studies did not indicate if the care‐recipients were in the acute or chronic phase of the condition (Bishop 2014; Gallagher‐Thompson 2007; Kwok 2013; NCT00646217; Shum 2014; Smith and Toseland 2006; Vazquez 2016; Wray 2010). In one study, care‐recipients were admitted to a nursing home (Davis 2011); this study was included because the intervention was designed to help caregivers adjust to the new burdens and stresses of nursing home placement in the first few months after placement had occurred. Nursing homes are community‐based and many caregivers spend a considerable time and continue to provide much care to care‐recipients, in particular spousal caregivers in the initial few months of admission. Most interventions were delivered to caregivers individually (i.e. one‐to‐one) (n = 14), four were delivered solely by group, two used a combined group and individual delivery format, and one did not provide sufficient information to determine whether the intervention was delivered individually to caregivers or in group format. Total sample sizes across the included studies ranged from 11 (Glueckauf 2012) to 175 (Toye 2016).
Attempts were made to contact all authors to confirm study details or to request further details. Most authors provided some detail on the study and intervention. Only four provided missing outcome data for inclusion in this review (Corry 2015; Davis 2011; Toye 2016; Wilz 2016a). Contact could not be made with two study authors (Bishop 2014; Smith and Toseland 2006). All other study authors provided detail on the study for categorisation at the screening stage or the study and intervention details, or both. All authors were contacted for information on studies awaiting categorisation and, where necessary, ongoing studies.
Eighteen of the 21 included studies received funding from reputable sources (e.g. national organisations or funding bodies). Three study authors did not detail sources of funding (Kwok 2013; NCT00646217; Shum 2014). One study author declared a conflict of interest (Corry 2015), and seven declared no conflict of interest (Davis 2011; Piamjariyakul 2015; Powell 2014; Shaw 2016; Shum 2014; Toye 2016; Vazquez 2016). The remaining studies did not provide details on conflicts of interest.
-
Summary characteristics of informal caregivers
Ten studies focused on caregivers of people with dementia (Connell 2009; Davis 2011; Gallagher‐Thompson 2007; Glueckauf 2012; Kwok 2013; Martindale‐Adams 2013; Tremont 2008a; Wilz 2016a; Winter 2006; Wray 2010), three on caregivers of people with stroke (Bishop 2014; NCT00646217; Pfeiffer 2014), and one study each for the following conditions: colorectal cancer (Shum 2014), heart failure (Piamjariyakul 2015), traumatic brain injury (Powell 2014), gastrointestinal cancers (Shaw 2016), frail older persons (Smith and Toseland 2006), older people (Toye 2016), multiple sclerosis (Corry 2015), and people with various conditions (Vazquez 2016). The minimum and maximum mean age of the caregivers in the included studies was 49 years (Powell 2014) and 74 years (Wray 2010), respectively, with a reported age range of 19 years (Shum 2014) to 87 years (Martindale‐Adams 2013). The majority of participants in the individual studies were female (> 70.5%). Two trials included females only (Connell 2009; Winter 2006), and, for two trials, the gender of participants was not provided (NCT00646217; Wray 2010). Most studies comprised family member caregivers, with the majority being spousal caregivers, in particular wives, except one trial where most of the participants were non‐spousal family caregivers (Gallagher‐Thompson 2007). Other family members included adult children and, to a lesser extent, siblings and mothers, grandchild, sons‐in‐law, or daughters in‐law (see Characteristics of included studies). The majority of the studies reported that caregivers were educated beyond secondary or high school level or had the equivalent in years of education (i.e. over 12 years of education). Three reported that the majority had post‐secondary school education (Piamjariyakul 2015; Powell 2014; Winter 2006). One study reported that most of the participants were literate or had primary education (Vazquez 2016) while two studies included participants who were either illiterate (Shum 2014) or had no primary education (Shaw 2016), albeit the majority had secondary level education or above in both studies.
-
Category of interventions
Ten interventions were categorised as psychosocial interventions (Bishop 2014; Connell 2009; Gallagher‐Thompson 2007; Glueckauf 2012; Pfeiffer 2014; Shaw 2016; Toye 2016; Vazquez 2016; Wilz 2016a; Winter 2006), 10 as combined psychosocial education interventions (Corry 2015; Davis 2011; Kwok 2013; Martindale‐Adams 2013; Piamjariyakul 2015; Powell 2014; Shum 2014; Smith and Toseland 2006; Tremont 2008a; Wray 2010), and one was not classified due to insufficient detail to enable an accurate classification (NCT00646217). No study evaluated an intervention that was exclusively educational (see Characteristics of included studies).
Two interventions were rated as high‐ (Bishop 2014; Glueckauf 2012), 16 as medium‐ (Connell 2009; Corry 2015; Davis 2011; Martindale‐Adams 2013; Pfeiffer 2014; Piamjariyakul 2015; Powell 2014; Shaw 2016; Shum 2014; Smith and Toseland 2006; Toye 2016; Tremont 2008a; Vazquez 2016; Wilz 2016a; Winter 2006; Wray 2010) and two as low‐quality interventions (Gallagher‐Thompson 2007; Kwok 2013). One intervention was not assessed as there was insufficient information available (NCT00646217) (Table 1).
| Y=YES, PY=Partly YES, N=NO | |||||||||||||||||||||||
| ITEM | 1 | 2* | 3 | 4 | 5* | 6* | 7 | 8* | 9 | 10 | 11 | 12* | 13 | 14 | 15 | 16 | 17 | 18 | 19* | 20 | 21 | 22 | Overall rating |
| Y | Y | Y | Y | Y | Y | Y | Y | Y | Y | Y | N | N | PY | N | Y | PY | Y | Y | Y | N | N/A | High | |
| PY | PY | PY | Y | PY | PY | Y | PY | N | Y | N | N | N | N | N/A | Y | N | Y | Y | N | N | N/A | Medium | |
| Y | Y | Y | Y | Y | Y | Y | N/A | Y | Y | N | Y | PY | PY | N/A | Y | N | Y | Y | Y | Y | PY | Medium | |
| Y | Y | PY | Y | Y | PY | Y | N | N/A | N/A | Y | N | PY | N | Y | PY | N | Y | Y | Y | PY | N | Medium | |
| Y | PY | PY | N | PY | PY | N/A | N | N | N | N | N | N | N | N/A | N | N | N | Y | N | N | N/A | Low | |
| Y | Y | Y | Y | Y | Y | PY | Y | PY | Y | N | N | N | PY | N/A | Y | Y | Y | Y | Y | N | N/A | High | |
| Y | PY | Y | PY | PY | PY | N/A | N | N | N | N/A | N | N | Y | N | N | N | N | N | N/A | N | N/A | Low | |
| Y | PY | Y | PY | PY | PY | Y | N | N | Y | N | N | N | N | Y | N | N | Y | N | N/A | N | N/A | Medium | |
| ‐ | ‐ | ‐ | ‐ | ‐ | ‐ | ‐ | ‐ | ‐ | ‐ | ‐ | ‐ | ‐ | ‐ | ‐ | ‐ | ‐ | ‐ | ‐ | ‐ | ‐ | ‐ | No information | |
| PY | PY | Y | N | PY | PY | PY | PY | N | N | PY | N | N | N | PY | N | N | N | PY | N | N | N | Medium | |
| Y | Y | Y | Y | Y | PY | Y | PY | N/A | PY | Y | N | PY | N | N/A | PY | Y | PY | Y | N | N | N/A | Medium | |
| Y | PY | Y | PY | PY | PY | Y | N | N/A | N/A | Y | N | N | N | Y | PY | Y | Y | PY | Y | PY | N | Medium | |
| Y | PY | Y | Y | Y | PY | Y | Y | N/A | N/A | Y | N | N | N | PY | Y | N | N | Y | N | N | N/A | Medium | |
| Y | PY | Y | N | PY | PY | Y | PY | N/A | PY | Y | N | N | N | Y | PY | PY | PY | Y | N | PY | N | Medium | |
| Y | PY | Y | PY | PY | Y | Y | PY | N/A | N/A | N/A | N | PY | N | Y | PY | N | Y | Y | PY | PY | N | Medium | |
| Y | PY | Y | PY | Y | PY | Y | Y | N/A | N/A | PY | N | N | N | Y | PY | PY | Y | Y | N | PY | PY | Medium | |
| Y | Y | Y | PY | Y | PY | PY | PY | N | Y | NA | N | N | N | Y | Y | Y | Y | Y | Y | N | N/A | Medium | |
| Y | Y | Y | PY | Y | PY | N/A | PY | Y | PY | PY | N | N | PY | Y | Y | Y | Y | Y | N | N | N/A | Medium | |
| Y | PY | Y | PY | Y | PY | PY | PY | Y | Y | N/A | N | N | PY | PY | Y | Y | Y | Y | Y | N | N/A | Medium | |
| Y | Y | Y | N | PY | Y | N/A | PY | N/A | N | N/A | N | N | N | N/A | N | N | N | N | N/A | N | N/A | Medium | |
| Y | Y | Y | N | Y | Y | PY | PY | PY | N | PY | N | N | N | N | PY | N | N | N | N/A | N | N/A | Medium | |
| Items assessed (Inclusion of detail for all Items with a * was essential for a high rating) 1. Did the researchers/authors provide a clear definition of the intervention so it could be replicated?* (this should include type, overview of content but very in‐depth details such as the manual do not have to be included) 2. Were the aims/goal of the intervention clearly stated?* (the aim/goal of the intervention may be the same/similar to the goal of the study) 3. Did the researchers/authors provide clear rationale for the intervention? 4. Did the researchers/authors provide an overview of the theory underpinning the intervention/framework used to develop the intervention? 5. Was the content of the intervention consistent with the stated aim/goal of the intervention?* 6. Was a clear description provided of how (method) the intervention was delivered? (e.g. phoned using mobile phone, skype, landline)* 7. If appropriate, did the researchers/authors provide an overview of other materials used e.g. Guidebook, information sent by post, etc? 8. Did the researchers/authors justify the selection of interventionists?* (e.g. appropriateness in terms of professional background/education of the person delivering the intervention) 9. If relevant, did the researchers/authors provide appropriate justification for the selection of co‐interventionists? 10. If more than one interventionist was involved in delivery of the intervention, did the researchers/authors indicate how delivery of the intervention was standardised across interventionists?* 11. Did the researchers/authors indicate that the intervention was delivered at an appropriate time period for the caregivers, which was in accordance to the overall goal? (e.g. if the goal is to support caregivers who are new to the role then it should be delivered during the early stages of caregiving) 12. Was there any potential risk of intervention contamination across the study groups?* 13. Did the researchers/authors justify the intensity of the intervention (in terms of frequency of delivery and duration of each session)? 14. Duration: Did the researchers/authors indicate that the complete intervention was delivered to the participants i.e. 100% of the intervention was delivered? 15. If the intervention was tailored/modified/adapted, did the researchers/authors indicate why? what? and how? 16. Did the researchers assess consistency in intervention delivery? 17. Did the researchers/authors state that the intervention was delivered in accordance with the trial protocol? 18. Was interventionist training standardised? 19. Did the authors indicate that intervention delivery was monitored?* 20. If yes/PY to item 19, was intervention delivery monitored using an objective measure? 21. Did the authors indicate that caregiver receipt of the intervention was monitored? (i.e. Caregivers’ understanding of and use of the intervention) 22. If ‘yes/PY’ to item 21, was caregiver receipt of the intervention monitored using an objective measure? | |||||||||||||||||||||||
N/A: not applicable
-
Comparison groups
Thirteen of the included studies indicated that the comparison group was usual care, standard medical follow‐up or no intervention with very little or no additional explanation (Bishop 2014; Connell 2009; Corry 2015; Davis 2011; Powell 2014; Shaw 2016; Smith and Toseland 2006; Toye 2016; Tremont 2008a; Vazquez 2016; Wilz 2016a; Winter 2006; Wray 2010). Five studies described the comparator as no formal intervention other than resource or education information, or both, which may or may not have been part of standard care (Davis 2011; Kwok 2013; Pfeiffer 2014; Piamjariyakul 2015; Shum 2014) and one study included a telephone help line number (Shum 2014) (Characteristics of included studies).
The two non‐telephone support intervention studies indicated that the comparator comprised six modules(Gallagher‐Thompson 2007) or that the structure and content of the programme were the same as the intervention group (Glueckauf 2012) and provided an explanation of the content and duration and mode of delivery (Characteristics of included studies).
Excluded studies
Studies were excluded because the intervention was for patients, caregivers and care‐recipients who received the intervention together or caregivers were only included if they chose to take part in the intervention which was offered to the care‐recipient (Achie 2015; Bell 2005; Hori 2009; Mendyk 2018; NCT00067171; NCT00131092; NCT00247000; NCT00271739; NCT00288132; NCT00483522; NCT00693563; NCT00829361; NCT02094846; NCT02483494; NCT03164239; Porter 2011; Samus 2014), the study design was not a randomised trial (Aguirrezabal 2013; Bailey 1997; Bauman 2015; Bauman 2018; Brown 1999; Cox 2012; Demiris 2011; Erten‐Lyons 2017; Gilliss 1992; Greaves 2016; Hirsch 2014; Lindauer 2016; Morgan 2015; NCT03177447; Nichols 2011; Piamjariyakul 2012; Piamjariyakul 2013; Pirrraglia 2005; Richardson 2007; Schinköthe 2014; Shanley 2008; Stewart 2001; Teel 2005; Tompkins 2009; Tsai 2005; Uphold 2015; Van Mierlo 2012a), the intervention was not a telephone intervention or a telephone‐only intervention (Badr 2015; Barclay 2016; Belle 2006; Berwig 2017; Callahan 2006; Chang 2004; Czaja 2013; Dellasega 2002; Demiris 2012; Duncan 2017; Elliott 2009; Finkel 2007a; Garand 2002; Gaugler 2008; Gitlin 2003; Gitlin 2010; Gitlin 2010a; Gitlin 2016; Gonyea 2016; Graham‐Philips 2016; Grant 1999; Grant 2002; Hasan 2015; Hicken 2017; Huang 2013; Hudson 2015; Johnson 2018; Kozachik 2001; Kuo 2017; Kwok 2012; Linton 2018; Martín‐Carrasco 2009; Mazanec 2017; McCann 2015a; NCT00721383; NCT02036294; NCT02347202; NCT02364505; NCT02475954; NCT02703532; NCT03127930; NCT03142841; NCT03506945; Nobili 2004; Penner 2016; Piette 2015; Prick 2015; Radziewicz 2009; Reeves 2018; Rivera 2008; Schure 2006; Schwarz 2008; Sherrod 2013; Silveira 2016; Sneed 1997; Uphold 2014; Valeberg 2013; Van Knippenberg 2016; Williams 2010; Yamada 2011; Yan 2016), the comparator was also a telephone intervention or included a telephone component (Badger 2007; Bakas 2009a; Bakas 2015; Blumenthal 2009; Chambers 2014; Chodosh 2015; Gant 2007a; Livingston 2013; McCann 2015; McLennon 2016; Mosher 2018; NCT00052104; NCT00822510; NCT01993550; NCT03378050; NCT03635151; Sherwood 2012; Tremont 2014; Tremont 2015; Tremont 2017; Wilder ongoing), or the trial was withdrawn due to lack of funding (ACTRN12616000467437).
Risk of bias in included studies
The 'risk of bias' assessment across the domains for each reported outcome was assessed and 'risk of bias' judgements summarised for each included study (see Characteristics of included studies). The summary results are presented in 'risk of bias' tables and illustrated in Figure 2 and Figure 3. Due to the nature of the intervention, blinding of participants and personnel was highly unlikely or possible and was therefore judged to be unclear for all included studies; this domain was not considered critical in assessing the overall risk of bias of each included study. Only one study included in this review was assessed as having an overall low risk of bias (Pfeiffer 2014), with the remainder receiving an overall rating of high risk of bias. Table 2 and Table 3 present the 'risk of bias' assessments for each included study for each 'risk of bias' domain by outcome, for each comparator, respectively.
| Sequence generation | Allocation concealment | Blinding | Incomplete outcome data (attrition bias) | Selective outcome reporting (reporting bias) | Other potential sources of bias | ||
| Burden | Low | ||||||
| High | |||||||
| Unclear | |||||||
| Psychological Health: Depression | Low | ||||||
| High | |||||||
| Unclear | |||||||
| Psychological Health: Stress | Low | ||||||
| High | |||||||
| Unclear | |||||||
| Health Status and Well‐Being: Physical Health | Low | ||||||
| High | |||||||
| Unclear | |||||||
| Health Status and Well‐Being: Self‐efficacy | Low | ||||||
| High | |||||||
| Unclear | |||||||
Allocation
Of the included studies, 11 reported adequate randomisation methods and were rated as having low risk of bias (Bishop 2014; Corry 2015; Davis 2011; Kwok 2013; Pfeiffer 2014; Powell 2014; Shaw 2016; Toye 2016; Tremont 2008a; Vazquez 2016; Wilz 2016a). All remaining studies were rated as having unclear risk for sequence generation (Figure 2).
Only 5 of the included studies (Corry 2015; Powell 2014; Pfeiffer 2014; Shum 2014; Toye 2016) reported adequate methods to ensure that allocation to groups was concealed and were rated as having low risk of bias. The remaining studies provided insufficient information to be able to judge the likelihood of allocation concealment bias and were therefore rated as having unclear risk of bias (Figure 2).
Blinding
All 21 included studies were judged as having unclear risk of bias for blinding of participants and personnel. Fourteen reported adequate blinding of outcome assessments (Bishop 2014; Davis 2011; Glueckauf 2012; Kwok 2013; Pfeiffer 2014; Piamjariyakul 2015; Powell 2014; Shum 2014; Smith and Toseland 2006; Toye 2016; Tremont 2008a; Vazquez 2016; Wilz 2016a; Wray 2010), six were unclear due to insufficient information to assess (Connell 2009; Gallagher‐Thompson 2007; Martindale‐Adams 2013; NCT00646217; Shaw 2016; Winter 2006), and one was rated as having high risk of bias due to non‐blinding (Corry 2015) of outcome assessment (Figure 2).
Incomplete outcome data
Of the included studies, 12 were judged as having low risk of bias for incomplete outcome data reporting (Corry 2015; Davis 2011; Gallagher‐Thompson 2007; Glueckauf 2012; Kwok 2013; Martindale‐Adams 2013; Pfeiffer 2014; Piamjariyakul 2015; Shaw 2016; Shum 2014; Toye 2016; Vazquez 2016), eight as having unclear risk of bias, of which five were due to insufficient information to assess (NCT00646217; Smith and Toseland 2006; Wilz 2016a; Winter 2006; Wray 2010), one due to non‐reporting of attrition by group (Bishop 2014), and two due to lack of adequate rationale for imbalance in attrition across the groups (Connell 2009; Powell 2014). One was judged as having high risk of bias due to greater than 40% loss to follow‐up in both groups (Tremont 2008a) overall (Figure 2). 'Risk of bias' assessments by outcome are presented in Table 2 and Table 3.
Selective reporting
Of the included studies, 13 were assessed as having low risk of bias (Bishop 2014; Connell 2009; Corry 2015; Gallagher‐Thompson 2007; Kwok 2013; Pfeiffer 2014; Piamjariyakul 2015; Shaw 2016; Shum 2014; Vazquez 2016; Wilz 2016a; Winter 2006; Wray 2010), one as unclear due to insufficient information to assess(NCT00646217), seven as high, of which six were due to non‐reporting of one or more prespecified outcomes(Davis 2011; Glueckauf 2012; Martindale‐Adams 2013; Powell 2014; Toye 2016; Tremont 2008a) and one due to reporting outcomes for a subsample of the included participants(Smith and Toseland 2006) (Figure 2).'Risk of bias' assessment by outcome is presented in Table 2 and Table 3.
Other potential sources of bias
Of the included studies, 12 were assessed as having an overall low risk of bias (Davis 2011; Gallagher‐Thompson 2007; Glueckauf 2012; Kwok 2013; Martindale‐Adams 2013; Pfeiffer 2014; Piamjariyakul 2015; Shaw 2016; Shum 2014; Toye 2016; Tremont 2008a; Vazquez 2016) for this domain and three were assessed as unclear, two due to insufficient information to assess (NCT00646217; Wray 2010), and one due to non‐reporting of caregiver characteristics separately for each group (Bishop 2014). Five were assessed as having high risk of bias due to baseline imbalances (Connell 2009; Powell 2014; Smith and Toseland 2006; Wilz 2016a; Winter 2006) and one high risk of bias due to risk of contamination (Corry 2015) (Figure 2). 'Risk of bias' assessment by outcome is presented in Table 2 and Table 3.
Effects of interventions
See: Summary of findings for the main comparison Telephone support intervention compared to Usual care for providing education and psychosocial support for informal caregivers of adults with diagnosed illnesses; Summary of findings 2 Telephone support compared to non‐telephone support intervention for providing education and psychosocial support for informal caregivers of adults with diagnosed illnesses
All outcomes reported for comparator 1 and 2 below refer to caregivers.
Comparator 1: Telephone intervention versus usual care
Quality of Life
Of the five studies that reported on caregiver quality of life (QoL), one evaluated a psychosocial intervention (Shaw 2016) and the remainder evaluated combined psychosocial‐education interventions (Corry 2015; Davis 2011; Powell 2014; Shum 2014). The duration of the interventions varied from ≤ 6 weeks (Shum 2014), to from 7 to 12 weeks (Corry 2015; Davis 2011; Shaw 2016) and 13 to 23 weeks (Powell 2014). Mode of intervention delivery was individual. The care‐recipients across the studies included people with cancer (Shaw 2016; Shum 2014), dementia (Davis 2011), multiple sclerosis (MS) (Corry 2015) and traumatic brain injury (TBI) (Powell 2014). The conditions were categorised as acute in two studies (Powell 2014; Shaw 2016), chronic in two studies (Corry 2015; Davis 2011), and, for one study, it was unclear if the condition was acute or chronic (Shum 2014). No study reporting QoL evaluated an education‐only intervention. All five studies reported on caregiver QoL at the end of intervention, and three studies also reported QoL at short‐term follow‐up (≤ 3 months) (Corry 2015; Shaw 2016; Shum 2014).
There is probably little or no difference between telephone support interventions and usual care for QoL at the end of intervention (SMD ‐0.02, 95% CI ‐0.24 to 0.19, 4 studies, 364 carers) (moderate‐certainty evidence) (Analysis 1.1) and at short‐term follow‐up (≤ 3 months) (MD 0.00, 95% CI ‐4.43 to 4.43, 1 study, 128 carers) (Analysis 1.2). In the fifth study, for caregivers of people with colorectal cancer, mean QoL was marginally higher (mean score 67.87) in the intervention group than in the control group (mean score 67.42) at the end of intervention and at short‐term follow‐up (mean 73.25 versus 70.84, intervention versus control group) using the WHOQoL BREF (Hong Kong) subscale scores (Shum 2014) (see Table 4). Due to clinical heterogeneity, it was not possible to impute SD data for this study from another study, and no response was received for these data from contacting the author.
| Outcome and time point | Study | Result (as presented by study authors) | Notes/comments |
| QoL End of intervention | Intervention group mean 67.87, n = 70, versus control group mean 67.42, n = 69 | No data available for each group SD or 95% CI | |
| Short‐term | Intervention group mean 73.25 versus control group 70.84, N = 140 | Reported numbers assessed by group, n = 68 intervention group and n = 67 control group. No data available for each group SD or 95% CI | |
| Burden End of intervention | Intervention group mean 17.37, n = 70 versus control group mean 26.26, n = 69, P < 0.001 | No data available for each group SD. Reported mean change data with 95% CI | |
| Mean and SD: Intervention group mean 31.7, SD 15.2 versus control group mean 31.7, SD 17.3, N = 81, P = 0.49 | No data available for the numbers by study group. No response from author contact | ||
| Short‐term | Intervention group mean 8.6 versus control group mean 17.34, N = 140, P < 0.001 | Reported numbers assessed by group, n = 68 intervention group and n = 67 control group. No data available for each group SD | |
| Skill Acquisition: Competence End of intervention | Intervention group mean 13.52, SD 2.85 versus control mean 14.17, SD 2.57, total N = 94, P = 0.932 | No data available for the numbers by study group. No response from author contact | |
| Psychological Health: Caregiver Depression End of intervention | Intervention group mean 18.17, SD 7.19 versus control group 20.2, SD 7.2, N = 94, P = 0.121 | No data available for the numbers by study group. No response from author contact | |
| Intervention group mean 4.57, n = 70 versus control group mean 7.45, n = 69, P = 0.013 | No data available for each group SD | ||
| intervention mean ‐0.16, SD 2.6 versus control mean ‐1.22, SD 3.1, P > 0.05 | Mean change data from baseline only provided. No mean difference for each arm available. No data available for the numbers in each group, SD or 95% CI | ||
| Psychological Health: Caregiver Depression Short‐term | Intervention group mean 2.41, versus control group mean 4.21, N = 70, P = 0.144 | Reported numbers assessed by group, n = 68 intervention group and n = 67 control group. No data available for each group SD | |
| Psychological Health: Caregiver Anxiety End of intervention | Intervention group mean 3.97, n = 70 versus control group 6.41, n = 69 | No data available for each group SD or 95% CI | |
| Short‐term | Intervention group mean 1.15 versus control group 2.90, N = 140 | Reported numbers assessed by group, n = 68 intervention group and n = 67 control group. No data available for each group SD or 95% CI | |
| Psychological Health: Caregiver Stress End of intervention | Intervention group mean 9.06, n =70 versus control group 12.45, n = 69 | Reported numbers assessed by group, n = 68 intervention group and n = 67 control group. No SD or 95% CI | |
| Short‐term | Intervention group mean 3.71 versus control group 7.79, N = 140 | Reported numbers assessed by group, n = 68 intervention group and n = 67 control group. No data available for each group SD or 95% CI | |
| Health Status and Well‐Being: Physical Health End of intervention | Mean change ‐0.84, SD 4.5 intervention and mean change 1.74, SD 3.8 control group; P < 0.10 | Mean change data only provided. No participant number, means or standard deviation score reported. No response from author contact | |
| Family Functioning End of intervention | Mean change scores from baseline of 2.7, SD 6.4 and ‐2.8, SD 4.0: P < 0.05 | Mean change data from baseline only provided. No mean difference for each arm available. No participant number, means or standard deviation score reported. No response from author contact | |
| Cost End of intervention | Intervention mean 352.53 Australian Dollars, SD = 81.5, n = 62 versus control mean 15.89 Australian Dollars, SD = N/A, n = 69 | Reported figures for total acute care costs which included hospital admissions, ED presentations, and ambulance services, and were not isolated to the intervention costs. Communication with the author resulted in retrieving further cost data specific to intervention costs (e.g. nurses time, cost, of training and telephone charges, etc). | |
| Short‐term | Mean (SD) and study numbers (US Dollars): Intervention mean 7008.3 SD 9226.2, n = 83 versus control mean 8831.4 SD 13,245.8, n = 75 | Cost utility analysis, mean, SD and study group numbers provided by the authors | |
| Medium‐term | Mean (SD) and study numbers (US Dollars): Intervention mean 6783.9, SD 7767, n = 83 versus control mean 5648, SD 6353.4, n = 75 |
CI:Confidence interval
ED: Emergency department
N/A: Not applicable
SD: Standard deviation
Overall, telephone interventions compared with usual care probably have little or no effect on QoL (moderate‐certainty evidence) at the end of intervention or at short‐term follow‐up.
Caregiver Burden
Of the 12 studies that reported on caregiver burden, four evaluated psychosocial interventions (Connell 2009; Shaw 2016; Toye 2016; Winter 2006) and eight evaluated combined psychosocial‐education interventions (Corry 2015; Davis 2011; Kwok 2013; Martindale‐Adams 2013; Piamjariyakul 2015; Shum 2014; Smith and Toseland 2006; Tremont 2008a). Eleven studies reported burden at the end of intervention. Two also reported burden at short‐term follow‐up (≤ 3 months) and two at medium‐term follow‐up (> 3 to ≤ 6 months). Mode of intervention delivery was individual except for two studies which used a group format (Martindale‐Adams 2013; Winter 2006). The duration of the interventions varied from ≤ 6 weeks (Piamjariyakul 2015; Shum 2014; Toye 2016), 7 to 12 weeks (Corry 2015; Davis 2011; Kwok 2013; Smith and Toseland 2006) and ≥ 24 weeks (Connell 2009; Martindale‐Adams 2013; Tremont 2008a; Winter 2006). Care‐recipient conditions were dementia (Connell 2009; Davis 2011; Kwok 2013; Martindale‐Adams 2013; Tremont 2008a; Winter 2006), MS (Corry 2015), colorectal cancer (Shum 2014), heart failure (Piamjariyakul 2015) GI cancer (Shaw 2016), frail older persons (Smith and Toseland 2006), and older persons with mixed conditions (Toye 2016). None of the included studies evaluated an education‐only intervention.
There may be little or no difference between telephone support interventions and usual care for burden at the end of intervention (SMD ‐0.11, 95% CI ‐0.30 to 0.07, 9 studies, 788 carers) (low‐certainty evidence) (Analysis 1.3), at short‐term follow‐up (≤ 3 months) (MD ‐0.20, 95% CI ‐0.75 to 0.35, 1 study, 128 carers) (Analysis 1.4), and at medium‐term follow‐up (> 3 to ≤ 6 months) (SMD ‐0.00, 95% CI ‐0.32 to 0.33, 2 studies, 147 carers), (Analysis 1.3). As the numbers analysed were not reported by group and the authors did not report use of an intention‐to‐treat approach to analysis, the results of one study (Winter 2006) were not included in the meta‐analysis.
Shum 2014, reported reduced burden in the intervention group at the end of intervention (mean 17.37) compared to the control group (mean 26.26) (P < 0.001), and at short‐term follow‐up in the intervention group (mean 8.6), in the control group (mean 17.34) (P < 0.001). In comparison, Winter 2006 found no difference between the intervention (mean 31.7; SD 15.2) and usual care (mean 31.7; SD 17.3) for caregiver burden at the end of intervention (Table 4).
Overall, telephone support interventions, compared with usual care, may have little or no effect on burden (low‐certainty evidence) at the end of intervention or at short‐ or medium‐term follow‐up.
Skill Acquisition: Problem‐Solving
Of three studies that reported on caregiver problem‐solving, two evaluated a combined intervention of 7 to 12 weeks duration (Corry 2015; Smith and Toseland 2006) and one evaluated a psychosocial intervention, also of 7 to 12 weeks duration (Pfeiffer 2014). All three studies reported effects at the end of intervention.
For problem‐solving, there may be little or no difference between telephone support interventions and usual care at the end of intervention (SMD 0.25, 95% CI ‐0.21 to 0.71, 3 studies, 236 carers) (Analysis 1.5).
Overall, telephone interventions, compared with usual care, may have little or no effect on problem‐solving at the end of intervention.
Skill Acquisition: Preparedness to Care
Of the three studies that reported on caregiver preparedness to care, one evaluated a psychosocial intervention (Toye 2016) and two evaluated combined interventions (Corry 2015; Piamjariyakul 2015). Interventions were of ≤ 6 weeks (Piamjariyakul 2015; Toye 2016) and 7 to 12 weeks (Corry 2015) duration.
There may be some evidence of a small benefit in favour of the telephone support intervention for preparedness to care at the end of intervention (SMD 0.37, 95% CI 0.09 to 0.64, 2 studies, 208 carers) (Analysis 1.6), but little or no difference at the medium‐term follow‐up (> 3 months to ≤ 6 months) (MD ‐0.30, 96% CI ‐1.02 to 0.42, 1 study, 17 carers) (Analysis 1.7). Overall, telephone interventions may have some small benefit in terms of caregiver preparedness to care when compared with usual care at the end of intervention but not at medium‐term follow‐up.
Skill Acquisition: Competence
Two studies evaluated psychosocial interventions, one with a duration of 7 to 12 weeks (Pfeiffer 2014) and one with a duration of ≥ 24 weeks (Winter 2006), on caregiver competence at the end of intervention in carers of people with stroke and dementia, respectively.
The results demonstrated that when compared to usual care, telephone support interventions may have little or no effect on caregiver competence scores at the end of intervention (MD 4.10, 95% CI ‐2.19 to 10.39, 1 study, 107 carers) (Analysis 1.8). Similarly, for Winter 2006, there was little or no effect in favour of telephone support interventions; mean caregiver competence in the intervention group (mean 13.52; SD 2.85) compared to the control group (mean 14.17; SD 2.57) (P = 0.932) using the 6‐item scale adapted from Kaye’s Gain Through Group Involvement Scale to assess perceived personal gains over the past few months (Table 4).
Overall, telephone support interventions, compared with usual care, may have little or no effect on caregiver competence at the end of intervention or at short‐term follow‐up.
Psychological Health: Caregiver Depression
Of the 13 studies that reported on caregiver depression, five evaluated psychosocial interventions, one of ≤ 6 weeks duration (Vazquez 2016), one of 7 to 12 weeks duration (Pfeiffer 2014), one of 13 to 23 weeks duration (Wilz 2016a), and two of ≥ 24 weeks duration (Connell 2009; Winter 2006). The remaining eight evaluated combined interventions, two that were of ≤ 6 weeks duration (Piamjariyakul 2015; Shum 2014), two of 7 to 12 weeks duration (Davis 2011; Smith and Toseland 2006), two of 13 to 23 weeks duration (Bishop 2014; Powell 2014), and two of ≥ 24 weeks duration (Martindale‐Adams 2013; Tremont 2008a).
The effects of telephone interventions on depression at the end of intervention were uncertain (SMD ‐0.37, 95% CI ‐0.70 to ‐0.05, 9 studies, 792 carers) (very low‐certainty evidence). Telephone interventions may have little or no effect at medium‐term follow‐up (> 3 to ≤ 6 months) (SMD ‐0.05, 95% CI ‐0.56 to 0.45, 3 studies, 227 carers) (Analysis 1.9). Three studies were not included in meta‐analysis. At the end of intervention, Shum 2014 reported reduced depression in the intervention group (intervention group mean 4.57 versus control group mean 7.45, P = 0.013). Winter 2006, however, found no difference in depression scores between the groups (intervention mean 18.172; SD 7.19 versus control mean 20.2; SD 7.2, P = 0.121, total N = 94). Likewise, Bishop 2014 found no differences between the groups in depression at the end of intervention (intervention mean ‐0.16, SD 2.6 versus control mean ‐1.22, SD 3.1, P > 0.05), nor did Shum 2014 at the short‐term follow‐up (intervention group mean 2.41 versus control group mean 4.21, P = 0.144) (Table 4).
Overall, we are uncertain of the effects of telephone interventions compared with usual care for caregiver depression.
Psychological Health: Caregiver Anxiety
Two studies reported on caregiver anxiety, one evaluating a combined intervention of ≤ 6 weeks duration (Shum 2014) and the second a combined intervention of 7 to 12 weeks duration (Smith and Toseland 2006). For Smith and Toseland 2006, the results demonstrated that telephone support interventions may slightly decrease anxiety at the end of intervention (MD ‐6.0, 95% CI ‐11.68 to ‐0.32, 1 study; 61 carers) (Analysis 1.10). Similarly Shum 2014 reported lower mean anxiety scores for the intervention versus control group (3.97 versus 6.41, respectively) at the end of intervention and at short‐term follow‐up (1.15 versus 2.90, respectively) using the DASS‐21 (Shum 2014) (Table 4).
Overall, telephone interventions compared with usual care may slightly decrease anxiety levels at the end of intervention and short‐term follow‐up; the quality of this evidence (GRADE) was not formally assessed, but both studies contributing data for this outcome had methodological limitations that may reduce certainty in the findings.
Psychological Health: Caregiver Coping
One study reported on caregiver coping at the end of intervention (Powell 2014). The results showed that telephone support interventions may have little or no effect on caregiver coping, when compared to usual care (MD 1.00, 95% CI ‐0.45 to 2.45, 1 study, 121 carers) (Analysis 1.11).
Psychological Health: Caregiver Stress
Of the two studies that reported caregiver stress, one evaluated a psychosocial intervention of ≥ 24 weeks duration (Connell 2009) and one a combined intervention of ≤ 6 weeks duration (Shum 2014).
Telepone support interventions compared to usual care may have little or no effect on caregiver stress at the end of intervention (MD ‐0.10, 95% CI ‐0.30 to 0.10, 1 study, 137 carers) (Analysis 1.12) or at medium‐term follow‐up (MD 0.10, 95% CI ‐0.11 to 0.31, 1 study, 130 carers) (Analysis 1.12). Shum 2014 provided mean data only, and not SDs at the end of intervention and at short‐term follow‐up; the reported means for the intervention and control groups, respectively, were 9.06 and 12.45 at the end of intervention, and 3.71 and 7.79 at short‐term follow‐up, using DASS‐21 (Table 4).
Overall, telephone support interventions may have little or no benefit over usual care for caregiver stress at the end of intervention or at short‐term follow‐up.
Knowledge and Understanding: Knowledge
Three studies prespecified the outcome knowledge (Powell 2014; Smith and Toseland 2006; Tremont 2008a) but only one study reported data for this outcome (Smith and Toseland 2006) at the end of intervention. Telephone support interventions may have little or no effect on overall knowledge scores (i.e. knowledge of services and on how to access them combined) (MD 1.90; 95% CI ‐0.63 to 4.43, 1 study, 61 carers) (Analysis 1.13).
Health Status and Well‐Being: Physical Health
Three studies reported on caregiver physical health, of which two evaluated a psychosocial intervention, one of ≤ 6 weeks duration (Toye 2016) and one of 7 to 12 weeks duration (Pfeiffer 2014) and one a combined intervention with 13 to 23 weeks duration (Bishop 2014),
Telephone support interventions, when compared to usual care may have little or no effect on caregiver physical health at the end of intervention (SMD ‐0.09, 95% CI ‐0.35 to 0.17, 2 studies, 248 carers) (Analysis 1.14). In the third study (Bishop 2014), mean change was reported (‐0.84 (SD 4.5) and 1.74 (SD 3.8), P < 0.10 for intervention and control groups) following the intervention as measured by the Frenchay Activity Index; no difference between the groups was noted (Table 4).
Overall, telephone support interventions, compared with usual care, may have little or no effect on physical health at the end of intervention.
Health Status and Well‐Being: Self‐efficacy
Of the two studies that reported on caregiver self‐efficacy, one evaluated a psychosocial intervention of ≥ 24 weeks duration (Connell 2009) and one a combined intervention of 7 to 12 weeks duration (Kwok 2013).
There may be little or no effect of a telephone intervention on caregiver self‐efficacy at the end or intervention (SMD 0.04, 95% CI ‐0.26 to 0.33, 2 studies, 175 carers) (Analysis 1.15) or at medium‐term follow‐up (MD 0.00, 95% CI ‐0.29 to 0.29, 1 study, 130 carers) (Analysis 1.16).
Overall, telephone support interventions, compared with usual care, may have little or no effect on caregiver self‐efficacy at the end of intervention.
Health Status and Well‐Being: Social Activity
One study only reported on this outcome (Powell 2014). The study evaluated a combined intervention of 12 to 23 weeks duration, at the end of intervention in carers of people with TBI. The results demonstrated that, when compared to usual care, telephone support interventions may have little or no effect on caregiver social activity (MD 0.04, 95% CI ‐0.10 to 0.18, 1 study, 121 carers) (Analysis 1.17).
Family Functioning
Two studies reported on caregiver family functioning, one evaluating a psychosocial intervention of ≤ 6 weeks duration for carers of older persons with acute conditions (Toye 2016) and one a combined psychoeducation intervention of 13 to 23 weeks in duration for carers of people with stroke (Bishop 2014).
The results demonstrated there may be little or no effect of telephone support interventions, when compared to usual care, for caregiver family functioning at the end of intervention (MD 0.20, 95% CI ‐0.04 to 0.44, 1 study, 141 carers) (Analysis 1.19). Bishop 2014, reporting on a combined psychoeducation intervention of 13 to 23 weeks duration for carers of people with stroke, reported mean change scores from baseline of 2.7 (SD 6.4) and ‐2.8 (SD 4.0) (P < 0.05), for intervention and control groups, respectively (Table 4).
Overall, telephone support interventions may have little or no effect on family functioning at the end of intervention, compared with usual care.
Perceived satisfaction with practical or other supports
Three studies reported on perceived satisfaction with supports; one evaluating a psychosocial intervention of 7 to 12 weeks duration (Pfeiffer 2014) and the other two combined interventions, one of 7 to 12 weeks duration (Davis 2011) and the other of ≥ 24 weeks duration (Martindale‐Adams 2013).
The finding suggested that there may be little or no effect of telephone support interventions compared to usual care at the end of intervention (SMD 0.10, 95% CI ‐0.24 to 0.44 3 studies, 291 carers) (Analysis 1.18).
Overall, telephone support interventions may have little or no benefit over usual care for caregiver satisfaction with supports at the end of intervention.
Satisfaction with the intervention
Satisfaction with the intervention was evaluated in six studies for the intervention arm of the study only, thus results for this outcome are indicative and not comparative. Satisfaction was reported for carers of people with MS (Corry 2015), dementia (Davis 2011; Martindale‐Adams 2013; Tremont 2008a; Wilz 2016a) and mixed conditions (Vazquez 2016). All six studies reported high satisfaction scores following the intervention; that is 'mostly', 'very much so', 'good' or 'excellent' to specific questions according to the descriptors used for and within the scales (see Characteristics of included studies). Similarly, most reported that their needs were met (Corry 2015; Davis 2011; Wilz 2016a) or would recommend the service to friends or others who had similar needs (Corry 2015; Davis 2011; Wilz 2016a) or return to the service or seek similar treatment again, if required (Corry 2015; Davis 2011Tremont 2008a).
Cost
Two included studies reported cost data, one evaluating a psychosocial intervention of ≤ 6 weeks duration in older persons of mixed conditions (Toye 2016) and the other a combined intervention of 7 to 12 weeks duration in people with dementia (Wray 2010).
Toye 2016 reported figures for total acute care costs (in Australian Dollars) at the end of intervention, with higher costs associated with the intervention, (intervention mean 352.53, SD 81.5 (n = 62) and control group mean 15.89, SD N/A (n = 69)). There were no differences in total costs (in US Dollars) between the groups at short‐term assessment (intervention group mean 7,008.3, SD 9,226.2 (n = 83) and control group mean 8,831.4, SD 13,245.8 (n= 75)), with a reported mean difference of MD ‐1823.10 (95% CI ‐5418.41 to 1772.21, 1 study, 158 carers) or at medium‐term follow‐up (intervention group mean 6,784, SD 7,767 (n = 83) and control group mean 5,648, SD 6,353 (n = 75)) with a reported mean difference of MD 1135.90, 95% CI ‐1068.54 to 3340.34, 1 study, 158 carers) (Wray 2010), (Table 4).
Overall, the evidence to suggest that telephone interventions are more or less costly than usual care at the end of intervention is inconclusive.
Adverse events: Worsening of outcome following intervention
None identified or reported in any of the included studies.
Adverse events: Suicide ideation and suicide
Not measured or reported in any of the included studies.
Comparator 2: Telephone Intervention versus non‐telephone professional support intervention
The outcomes of quality of life, skill acquisition (problem‐solving, preparedness to care, competence), psychological health (caregiver anxiety, caregiver coping), knowledge and understanding, health status and well‐being (self‐efficacy, family functioning, social activity), satisfaction, and adverse events were not measured or reported for this comparison.
Burden
One study evaluated a psychosocial intervention of 7 to 12 weeks duration for carers of people with dementia (Glueckauf 2012). We are uncertain of the effects of a telephone support intervention, compared with non‐telephone support intervention, on caregiver burden at the end of intervention (MD ‐0.20, 95% CI ‐0.74 to 0.34, 1 study, 11 carers) (very low‐certainty evidence) (Analysis 2.1).
Health Status and Well‐Being: Depression
Two studies evaluated psychosocial interventions of 7 to 12 weeks duration on depression in carers of people with dementia (Gallagher‐Thompson 2007; Glueckauf 2012). We are uncertain of the effects of telephone support interventions compared with non‐telephone professional support interventions, at the end of intervention (MD ‐4.30, 95% CI ‐9.57 to 0.97, 1 study, 11 carers) (very low‐certainty evidence) (Analysis 2.2) and at an unknown time point post‐intervention (MD 1.20, 95% CI ‐5.35 to 7.75, 1 study; 45 carers) (Analysis 2.2).
Overall, we are uncertain of the effects of telephone support when compared to non‐telephone support interventions for caregiver depression at the end of intervention.
Psychological Health: Caregiver stress
Gallagher‐Thompson 2007 evaluated a psychosocial intervention of 7 to 12 weeks duration and reported on caregiver stress at an unknown time point post‐intervention. We are uncertain of the effects of telephone support compared to non‐telephone support interventions on stress (MD ‐0.6, 95% CI ‐3.17 to 1.97, 1 study, 45 carers) (Analysis 2.3).
Health Status and Well‐Being: Physical Health
One study (Glueckauf 2012) evaluated a psychosocial intervention of 7 to 12 weeks duration and reported on carers' physical health at the end of intervention for carers of people with dementia . We are uncertain of the effects of telephone support compared to non‐telephone support interventions on physical health (MD 1.9, 95% CI ‐0.65 to 4.45 1 study; 11 carers) (Analysis 2.4).
Discussion
Summary of main results
The objective of this review was to evaluate the effectiveness of telephone‐only support interventions, delivered by healthcare professionals, when compared to usual care or non‐telephone‐based support interventions for educating and psychosocially supporting informal caregivers of people with diagnosed illnesses, on these caregivers' quality of life, psychosocial, and physical well‐being. In addition, the aim was to evaluate the cost‐effectiveness of telephone support interventions.
The review's prespecified primary and secondary outcomes, where reported, were assessed at the end of intervention delivery and at short‐term (≤ 3 months), medium‐term (> 3 to ≤ 6 months) and longer‐term follow‐up time points (> 6 to 12 months) following the intervention. The quality of evidence, assessed using GRADE summary of findings Table for the main comparison; summary of findings Table 2, indicated evidence ranging from very low‐ to moderate‐quality for three important caregiver outcomes (burden, depression, and quality of life).
Eighteen included studies reported on the comparison of telephone‐only support versus usual care; two reported on the comparison of telephone‐only with a non‐telephone support intervention (Gallagher‐Thompson 2007; Glueckauf 2012). No adverse effects were reported or noted in the included studies.
For the review's primary outcomes of quality of life and burden, there is probably little or no difference between telephone‐only support interventions and usual care. The quality of the evidence for quality of life was moderate and of low certainty for burden. Of the secondary outcomes, telephone‐only support interventions may slightly reduce anxiety and improve preparedness to care to a small degree at the end of intervention. The quality of the evidence (GRADE) for the outcome of depression, however, was very low: we are therefore uncertain of the effects on this outcome. Results for anxiety and preparedness to care were based on small studies with methodological limitations, which may also reduce our confidence in these results. For all of the remaining secondary outcomes in our overall comparison of telephone support interventions compared to usual care, we found that the intervention may have little no effect at any follow‐up time point.
For the review's second comparison of telephone support interventions versus a non‐telephone support intervention, only two studies were included. Of these studies, one reported our prespecified outcomes of burden, depression, and physical health at the end of intervention (Glueckauf 2012) and the second reported depression and stress at an unknown time point (Gallagher‐Thompson 2007). There may be little or no difference between telephone‐only support interventions and non‐telephone support interventions on any outcome measured at all follow‐up time points, based on these two studies.
No evidence of adverse effects was found for worsening of any of the outcomes sought. The adverse outcome of suicide or suicide ideation was not reported in any of the included studies.
Overall completeness and applicability of evidence
Using the evaluation method developed for this review, the quality of the interventions varied with the majority considered to be of medium quality. Two were of low quality, and two were of high quality (Table 1). There was considerable variation in intervention content and duration across the included studies, with few studies providing justification for the intervention duration or intensity. Although most studies provided a reasonably comprehensive description of the intervention, the theory underpinning the intervention was not always explicit; five studies mentioned a theory, while seven did not specify what theory, if any, was used. The effectiveness of interventions can also be influenced by the intensity and duration of the intervention. As only five of the included studies made an attempt to provide some justification for the duration or intensity of the intervention, outcome results may have differed if the impact of intervention intensity and duration on planned outcomes were considered. There is, however, a dearth of methodological studies exploring the impact of intervention intensity and duration on outcomes and no study examining this potential influencing factor was found for including in this review. Despite this, intervention intensity has been identified as an important but complicated aspect of intervention testing (Yoder 2012) with studies on maternal well‐being highlighting its importance on the impact of an outcome (Schwichtenberg 2007). Likewise, fidelity to the intervention may impact on outcomes. Although in this review a number of studies indicated that intervention delivery and fidelity were monitored, most did not describe the results of these assessments. Such limitations in the conduct or reporting of intervention studies limit the applicability of the results, as confidence in these is reduced and it is unclear as to whether effectiveness or non‐effectiveness may be due to deficits in the intensity, duration, or delivery of the intervention rather than the intervention itself.
The considerable heterogeneity across the studies in terms of health conditions, intervention duration, intervention type, and typically small numbers of studies included in meta‐analyses precluded performing subgroup meta‐analyses by intervention duration and care‐recipient condition for the review's prespecified outcomes. Categorising conditions as acute and chronic was also difficult due to non‐reporting of time since diagnosis by some authors, the different categorisation systems used across studies, and the unpredictable nature of some conditions. For example, for one study(Toye 2016), the author described the care‐recipients as having acute medical conditions but later clarified that some care‐recipients may have had an acute episode linked to a chronic condition. Only three studies with very different care‐recipient diagnoses fulfilled our definition for acute conditions. The lack of necessary data prevented subgroup analyses, and outcome data which was derived from a single study for a number of outcomes, many with small and under powered sample sizes, leads to uncertainty regarding the findings for these interventions. Similarly, even where a greater number of studies contributed data to an outcome, (such as for caregiver burden and depression), the findings need to be interpreted with caution as the findings show there may be little or no effect of telephone support interventions over usual care, and there is uncertainty even about these results because of underlying limitations in the quality of the evidence that contributed to these outcomes. This means that with further studies the results are likely to change. While some slight benefit may exist for anxiety for telephone support interventions compared to usual care, the difference was small and the single study assessing this outcome was assessed as having high risk of bias (Smith and Toseland 2006), with a very small and underpowered sample size (n = 61). Likewise, for preparedness to care at the end of intervention, a small difference may exist in favour of the telephone support intervention when compared to usual care from two studies assessed as having high risk of bias. The amount of heterogeneity in the included studies may be due to the range of factors that can impact on caregiver outcomes, such as their own health and well‐being, age, gender, and relationship to care‐recipient. Variability of the comparator group may also impact on outcomes as some comparators included educational information beyond 'standard' usual care. The one study with caregivers of persons transitioning to a nursing home setting may also have increased heterogeneity.
The non‐reporting of the prespecified outcome of QoL (Davis 2011), stress (Glueckauf 2012), knowledge (Powell 2014), physical health (Martindale‐Adams 2013; Toye 2016), mental health (Toye 2016), and incomplete reporting of outcome data (Tremont 2008a) may also have impacted on the outcome of this review, as the inclusion of such data in the analysis may impact on the reported results. In addition to being unable to obtain data for some of these outcomes from the study authors, other outcomes, such as adverse event outcomes were not reported and, for the second comparison, only very limited outcomes were reported.
Quality of the evidence
Only one study included in this review was assessed as having an overall low risk of bias (Pfeiffer 2014), with the remaining studies receiving either a high or unclear rating overall, due to high risk or unclear judgements for any one of the domains of sequence generation, allocation concealment, selective outcome reporting, or attrition bias. The quality of the evidence for the outcomes assessed using GRADE were found to vary from very low‐ to low‐quality evidence, with the exception of QoL which was of moderate‐quality evidence (summary of findings Table for the main comparison; summary of findings Table 2). In particular, for the main comparison of telephone interventions versus usual care, the quality of the evidence for the primary outcomes of QoL and burden was of moderate‐ and low‐certainty evidence respectively, reducing our confidence in these results. For the outcome of depression, although the pooled results indicated reduced depression with the intervention, the quality of the evidence was of very low‐certainty, meaning that we are uncertain about the effects of telephone support interventions on this outcome. Downgrading the evidence was primarily based on methodological limitations reflected by the risk of bias assessments, inconsistency (statistical heterogeneity) and imprecision (few participants). These findings suggested that more studies of high quality within a programme of caregiver telephone research are required in order to conduct meaningful analyses and such studies are likely to change the conclusions of the review or our certainty, or both, in the findings.
Potential biases in the review process
We believe that the potential for bias in the review process is low. In accordance with the protocol, a broad search of the literature with no language restrictions, including grey literature to minimise the possible influence of publication bias, was conducted. Missing data were requested from study authors. All author conflict of interests were reported and, for the included study conducted by one of the review authors (Corry 2015), data extraction and 'risk of bias' assessment was undertaken by other review authors.
Agreements and disagreements with other studies or reviews
Although a number of other reviews included telephone interventions, these reviews differed from our review. One review focused exclusively on the effectiveness of telephone counselling interventions for caregivers of people with dementia (Lins 2014). A second review looked at telephone and computer interventions, also focusing on benefit for caregivers of people with dementia (Waller 2017), with findings reported separately for computer and telephone‐based interventions.
In the Lins 2014 review, the inclusion criteria for telephone interventions were broader than those in our review. All telephone counselling interventions, for example, those that included video series were included providing there was no face‐to‐face component to the intervention. The authors did, however, conduct separate analysis for those studies categorised as ‘without an additional intervention' (n = 6) (Davis 2011; Finkel 2007a; Glueckauf 2012; Tremont 2008a; Wilz 2016a; Winter 2006) and for telephone interventions that included video–series (n = 3) (Chang 1999; Gant 2007; Steffen 2000). As in our review, Lins 2014 did not separate out the studies by intervention duration and conducted a meta‐analysis on three studies of differing intervention duration; three months (Wilz 2016a), six months (Finkel 2007a) and one year, respectively (Tremont 2008a). Five of the six studies included in Lins 2014 were included in this review. One study (Finkel 2007) did not fulfil our inclusion criteria as the intervention included both text and voice, which makes comparing findings difficult. Despite this, however, the findings of the review were consistent with our review's findings, as reduced depressive symptoms were reported for telephone counselling delivered without additional interventions. Likewise, as in our review, there was little or no difference reported between telephone support interventions and usual care on the studies meta‐analysed on the outcome of burden.
Similarly, in a non‐Cochrane review by Waller 2017, which assessed the scope, volume, and quality of research on the acceptability, utilisation, and effectiveness of telephone‐ and computer‐delivered interventions for caregivers of people living with dementia, the inclusion criteria were broad. The review authors included all interventions that included the telephone either alone or as a component of the intervention. Although the review authors categorised the telephone interventions as telephone interventions alone separate to those with video and respite, the findings were not separated for the telephone interventions alone. The interventions termed ‘telephone interventions alone’ differed from the inclusion criteria used in our review as we excluded telephone intervention studies that also had a telephone component in the usual care group.
A number of other reviews included telephone support interventions and although the effectiveness of interventions delivered by telephone were reported, the effectiveness of the telephone‐only as the mode of intervention delivery was not the focus of the review or specifically evaluated within reviews. Broader telephone intervention inclusion criteria were used such as telephone plus video, more than one face‐to‐face contact, or use of the telephone as a follow‐up method after face‐to‐face sessions (Aubin 2012; Ellis 2010; Forster 2012; Legg 2011; Vernooij‐Dassen 2011), therefore telephone‐only interventions as per our inclusion criterion were not reported separately making it impossible to compare our findings with the findings from these reviews.
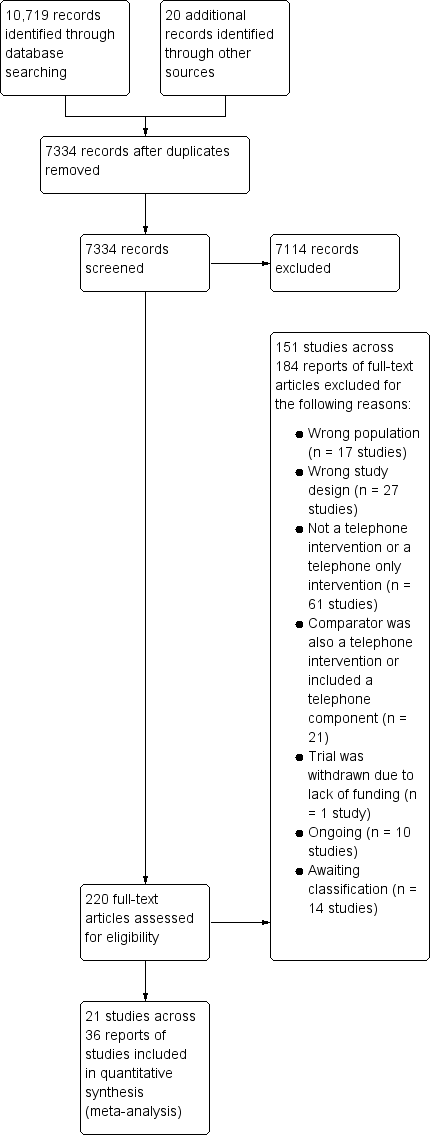
Study flow diagram.

Risk of bias summary: review authors' judgements about each risk of bias item for each included study.
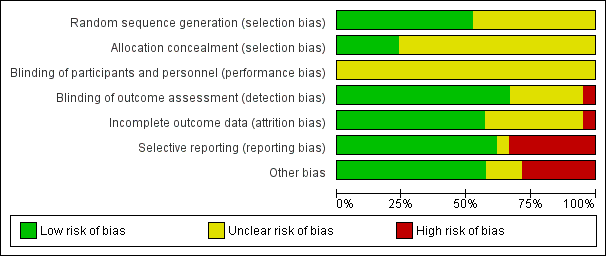
Risk of bias graph: review authors' judgements about each risk of bias item presented as percentages across all included studies.
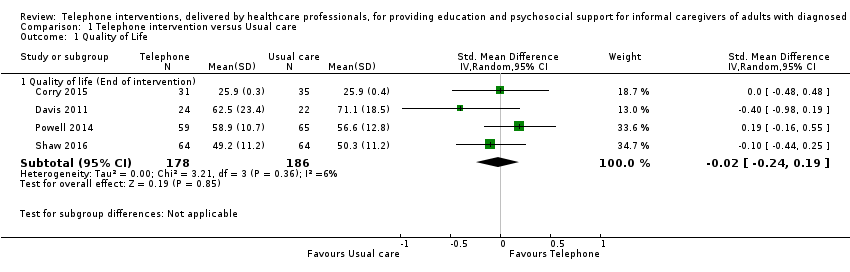
Comparison 1 Telephone intervention versus Usual care, Outcome 1 Quality of Life.
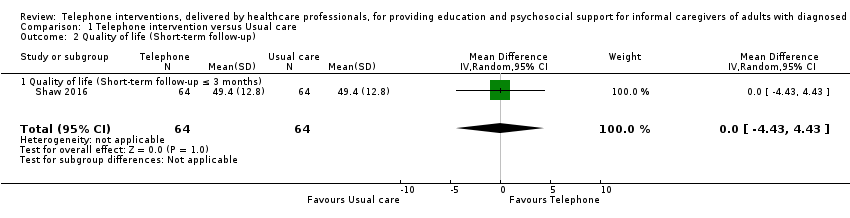
Comparison 1 Telephone intervention versus Usual care, Outcome 2 Quality of life (Short‐term follow‐up).

Comparison 1 Telephone intervention versus Usual care, Outcome 3 Burden.
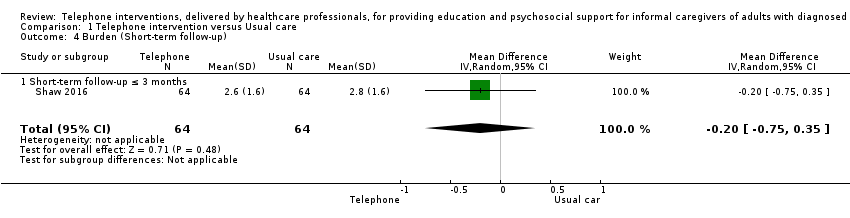
Comparison 1 Telephone intervention versus Usual care, Outcome 4 Burden (Short‐term follow‐up).
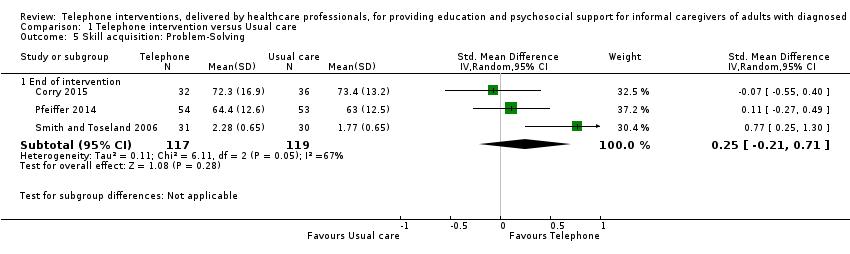
Comparison 1 Telephone intervention versus Usual care, Outcome 5 Skill acquisition: Problem‐Solving.

Comparison 1 Telephone intervention versus Usual care, Outcome 6 Skill acquisition: Preparedness to Care.

Comparison 1 Telephone intervention versus Usual care, Outcome 7 Skill acquisition: Preparedness to Care (medium‐term follow‐up).
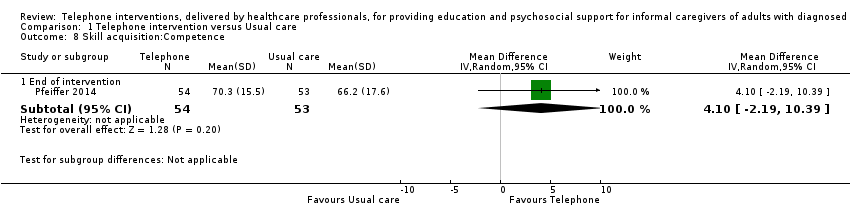
Comparison 1 Telephone intervention versus Usual care, Outcome 8 Skill acquisition:Competence.
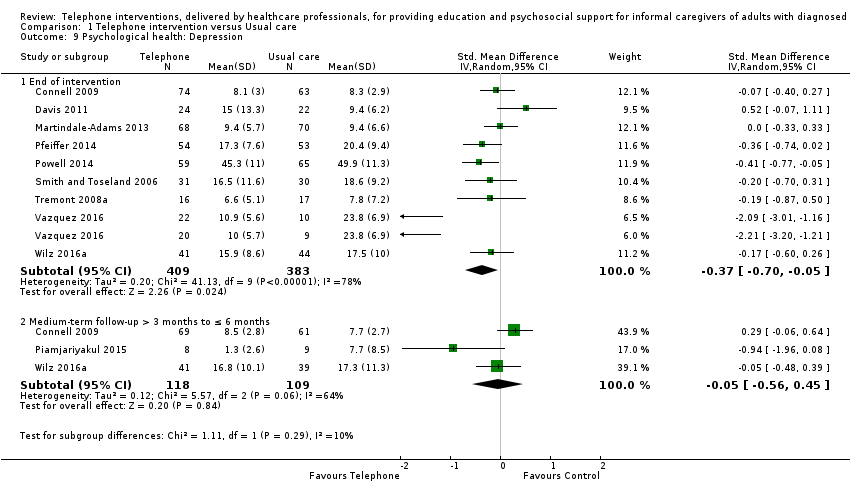
Comparison 1 Telephone intervention versus Usual care, Outcome 9 Psychological health: Depression.

Comparison 1 Telephone intervention versus Usual care, Outcome 10 Psychological health: Anxiety.

Comparison 1 Telephone intervention versus Usual care, Outcome 11 Psychological health: Coping.
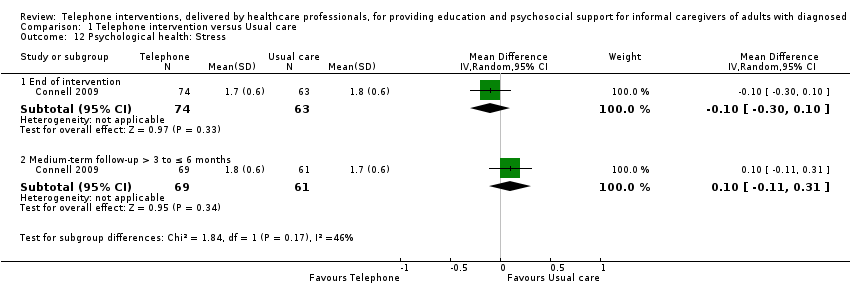
Comparison 1 Telephone intervention versus Usual care, Outcome 12 Psychological health: Stress.
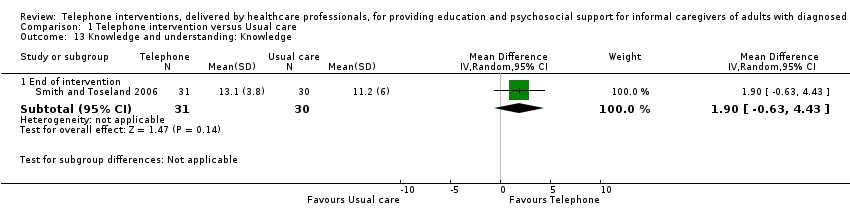
Comparison 1 Telephone intervention versus Usual care, Outcome 13 Knowledge and understanding: Knowledge.

Comparison 1 Telephone intervention versus Usual care, Outcome 14 Health status and well‐being: Physical health.

Comparison 1 Telephone intervention versus Usual care, Outcome 15 Health status and well‐being: Self‐efficacy.
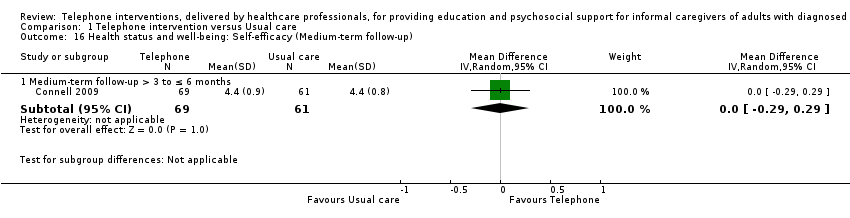
Comparison 1 Telephone intervention versus Usual care, Outcome 16 Health status and well‐being: Self‐efficacy (Medium‐term follow‐up).
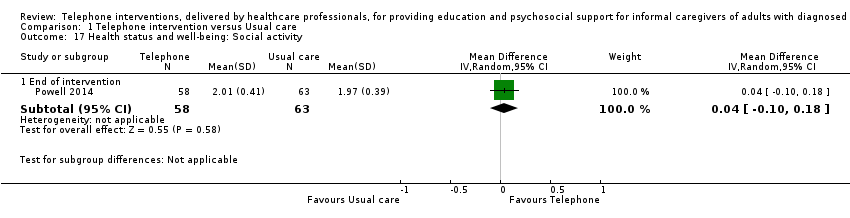
Comparison 1 Telephone intervention versus Usual care, Outcome 17 Health status and well‐being: Social activity.

Comparison 1 Telephone intervention versus Usual care, Outcome 18 Satisfaction: Satisfaction with supports.
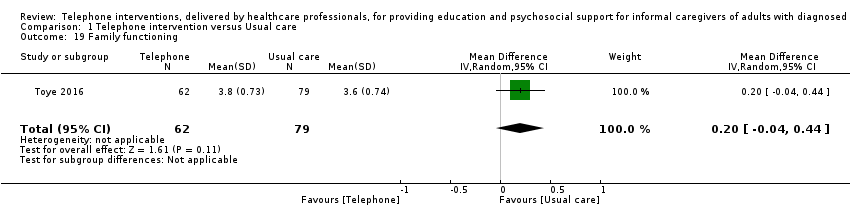
Comparison 1 Telephone intervention versus Usual care, Outcome 19 Family functioning.

Comparison 2 Telephone versus non‐telephone support intervention, Outcome 1 Burden.

Comparison 2 Telephone versus non‐telephone support intervention, Outcome 2 Depression.
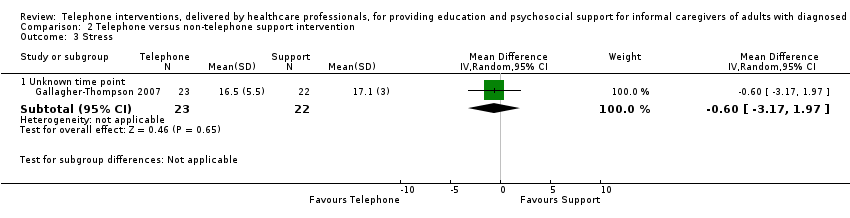
Comparison 2 Telephone versus non‐telephone support intervention, Outcome 3 Stress.
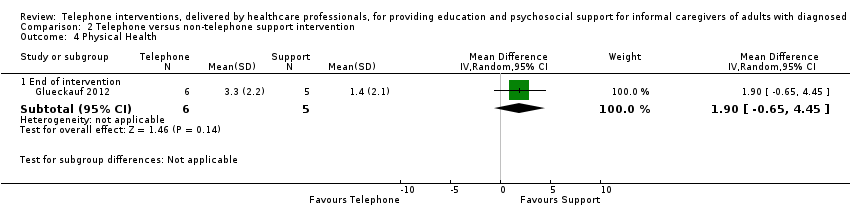
Comparison 2 Telephone versus non‐telephone support intervention, Outcome 4 Physical Health.
| Telephone intervention compared to Usual care for providing education and psychosocial support for informal caregivers of adults with diagnosed illnesses | ||||
| Patient or population: Informal caregivers of adults with diagnosed illnesses | ||||
| Outcomes | Anticipated absolute effects* (95% CI) | № of participants | Certainty of the evidence | Comments |
| Risk with Telephone intervention | ||||
| Quality of Life End of intervention For all scales, higher scores indicated higher QoL. | The mean score for QoL in the intervention group was 0.02 standard deviations lower (0.24 lower to 0.19 higher) | 364 | ⊕⊕⊕⊝ | One further study reported that caregivers receiving a telephone intervention may have slightly higher QoL at end of intervention, compared with usual care. Overall, at the end of intervention, telephone interventions probably have little or no effect on caregiver QoL |
| Burden End of intervention Assessed with: Revised Memory and Behaviour Problem Checklist (0‐24 range), 24‐ and 26‐item Caregiver Reaction Assessment, Family Appraisal of Caregiving Questionnaire (Caregiver Strain subscale – Palliative Care), Burden Interview (22‐ and 12‐item inventories; 0‐4 scale), Modified BKOS scale (22‐item, 5‐point scale) For all scales, higher scores indicated higher burden. | The mean score for Burden in the telephone group was 0.11 standard deviations lower | 788 | ⊕⊕⊝⊝ | Two further studies reported caregiver burden. One reported that telephone interventions may decrease burden; the other reported no change in the intervention group, compared with usual care. Overall, at the end of intervention, telephone interventions may have little or no effect on caregiver burden. |
| Psychological health: Depression End of intervention Assessed with: Center for Epidemiologic Studies Depression Scale 11‐item SF, 10‐item and, 20‐item measures (including German version) (0‐3 scales), Brief Symptom Inventory (18‐item, 5‐point scale), and the Geriatric Depression Scale (30‐item, score range 0‐30) For all scales, higher scores were associated with increased depression/symptoms of depression. | The mean score for depression in the telephone group was 0.37 standard deviations lower (0.7 to 0.05 lower ) | 792 | ⊕⊝⊝⊝ | Three further studies reported caregiver depression. One reported that telephone interventions may decrease depression; the other two reported no change in the intervention group, compared with usual care. Overall, we are uncertain of the effects of telephone interventions on caregiver depression at the end of intervention. |
| Satisfaction with the intervention End of intervention | See comment | ‐ | ‐ | No study was found that assessed this outcome comparatively. Six studies measured satisfaction with the intervention in the intervention group only. All six reported high levels of satisfaction with the intervention (i.e. 'mostly', 'very much so', 'good' or 'excellent'). |
| Adverse events including suicide and suicide ideation | See comment | ‐ | ‐ | No studies measured these outcomes. |
| GRADE Working Group grades of evidence | ||||
| 1 Although participant numbers were relatively few at n = 364, they were deemed sufficient for studies evaluating these types of intervention in a population of informal caregivers; we therefore did not downgrade on sample size (imprecision) for this reason. 2 Most information was from studies at low or unclear risk of bias on most items in the 'risk of bias' tool, although in some studies, one or two risk of bias criteria were assessed as having high risk of bias. We therefore downgraded by 1 level for plausible risk of bias that could seriously alter the results. 3 Some variation in the effect estimates and moderate heterogeneity; evidence downgraded by 1 level (serious inconsistency). 4 Variation in the effect estimates across studies and substantial heterogeneity; evidence downgraded by 2 levels (very serious inconsistency). BKOS: Bakas Caregiver Outcomes Scale | ||||
| Telephone compared to non‐telephone support intervention for providing education and psychosocial support for informal caregivers of adults with diagnosed illnesses | ||||
| Patient or population: Informal caregivers of adults with diagnosed illnesses | ||||
| Outcomes | Anticipated absolute effects* (95% CI) | № of participants | Certainty of the evidence | Comments |
| Risk with Telephone | ||||
| Quality of Life | No studies measured this outcome | ‐ | ‐ | |
| Burden End of intervention Higher scores indicated greater burden. | The mean score for burden in the telephone group was 0.2 lower | 11 | ⊕⊝⊝⊝ | We are uncertain of the effects of telephone interventions on caregiver burden at the end of intervention. |
| Psychological health: Depression: End of intervention Assessed with: Center for Epidemiological Studies Survey‐Depression scale (20‐item, 0‐3 scale) Higher scores indicated higher levels of depression. | The mean score for depression in the telephone group was 4.3 lower (9.57 lower to 0.97 higher) | 11 | ⊕⊝⊝⊝ | We are uncertain of the effects of telephone interventions on caregiver depression at the end of intervention |
| Satisfaction with the intervention | No studies measured this outcome | ‐ | ‐ | |
| Adverse events including suicide and suicide ideation | No studies measured these outcomes | ‐ | ‐ | |
| GRADE Working Group grades of evidence | ||||
| 1 Most information from the 1 included study indicated low or unclear risk of bias on most items on the 'risk of bias' tool, although risk of bias was high for selective reporting. We therefore downgraded by 1 level for plausible risk of bias that could seriously alter the results. 2 Participant numbers were deemed insufficient at 11 and the upper and lower CI limits were > 0.5 from the effect size (downgraded by 2 levels for imprecision). | ||||
| Y=YES, PY=Partly YES, N=NO | |||||||||||||||||||||||
| ITEM | 1 | 2* | 3 | 4 | 5* | 6* | 7 | 8* | 9 | 10 | 11 | 12* | 13 | 14 | 15 | 16 | 17 | 18 | 19* | 20 | 21 | 22 | Overall rating |
| Y | Y | Y | Y | Y | Y | Y | Y | Y | Y | Y | N | N | PY | N | Y | PY | Y | Y | Y | N | N/A | High | |
| PY | PY | PY | Y | PY | PY | Y | PY | N | Y | N | N | N | N | N/A | Y | N | Y | Y | N | N | N/A | Medium | |
| Y | Y | Y | Y | Y | Y | Y | N/A | Y | Y | N | Y | PY | PY | N/A | Y | N | Y | Y | Y | Y | PY | Medium | |
| Y | Y | PY | Y | Y | PY | Y | N | N/A | N/A | Y | N | PY | N | Y | PY | N | Y | Y | Y | PY | N | Medium | |
| Y | PY | PY | N | PY | PY | N/A | N | N | N | N | N | N | N | N/A | N | N | N | Y | N | N | N/A | Low | |
| Y | Y | Y | Y | Y | Y | PY | Y | PY | Y | N | N | N | PY | N/A | Y | Y | Y | Y | Y | N | N/A | High | |
| Y | PY | Y | PY | PY | PY | N/A | N | N | N | N/A | N | N | Y | N | N | N | N | N | N/A | N | N/A | Low | |
| Y | PY | Y | PY | PY | PY | Y | N | N | Y | N | N | N | N | Y | N | N | Y | N | N/A | N | N/A | Medium | |
| ‐ | ‐ | ‐ | ‐ | ‐ | ‐ | ‐ | ‐ | ‐ | ‐ | ‐ | ‐ | ‐ | ‐ | ‐ | ‐ | ‐ | ‐ | ‐ | ‐ | ‐ | ‐ | No information | |
| PY | PY | Y | N | PY | PY | PY | PY | N | N | PY | N | N | N | PY | N | N | N | PY | N | N | N | Medium | |
| Y | Y | Y | Y | Y | PY | Y | PY | N/A | PY | Y | N | PY | N | N/A | PY | Y | PY | Y | N | N | N/A | Medium | |
| Y | PY | Y | PY | PY | PY | Y | N | N/A | N/A | Y | N | N | N | Y | PY | Y | Y | PY | Y | PY | N | Medium | |
| Y | PY | Y | Y | Y | PY | Y | Y | N/A | N/A | Y | N | N | N | PY | Y | N | N | Y | N | N | N/A | Medium | |
| Y | PY | Y | N | PY | PY | Y | PY | N/A | PY | Y | N | N | N | Y | PY | PY | PY | Y | N | PY | N | Medium | |
| Y | PY | Y | PY | PY | Y | Y | PY | N/A | N/A | N/A | N | PY | N | Y | PY | N | Y | Y | PY | PY | N | Medium | |
| Y | PY | Y | PY | Y | PY | Y | Y | N/A | N/A | PY | N | N | N | Y | PY | PY | Y | Y | N | PY | PY | Medium | |
| Y | Y | Y | PY | Y | PY | PY | PY | N | Y | NA | N | N | N | Y | Y | Y | Y | Y | Y | N | N/A | Medium | |
| Y | Y | Y | PY | Y | PY | N/A | PY | Y | PY | PY | N | N | PY | Y | Y | Y | Y | Y | N | N | N/A | Medium | |
| Y | PY | Y | PY | Y | PY | PY | PY | Y | Y | N/A | N | N | PY | PY | Y | Y | Y | Y | Y | N | N/A | Medium | |
| Y | Y | Y | N | PY | Y | N/A | PY | N/A | N | N/A | N | N | N | N/A | N | N | N | N | N/A | N | N/A | Medium | |
| Y | Y | Y | N | Y | Y | PY | PY | PY | N | PY | N | N | N | N | PY | N | N | N | N/A | N | N/A | Medium | |
| Items assessed (Inclusion of detail for all Items with a * was essential for a high rating) 1. Did the researchers/authors provide a clear definition of the intervention so it could be replicated?* (this should include type, overview of content but very in‐depth details such as the manual do not have to be included) 2. Were the aims/goal of the intervention clearly stated?* (the aim/goal of the intervention may be the same/similar to the goal of the study) 3. Did the researchers/authors provide clear rationale for the intervention? 4. Did the researchers/authors provide an overview of the theory underpinning the intervention/framework used to develop the intervention? 5. Was the content of the intervention consistent with the stated aim/goal of the intervention?* 6. Was a clear description provided of how (method) the intervention was delivered? (e.g. phoned using mobile phone, skype, landline)* 7. If appropriate, did the researchers/authors provide an overview of other materials used e.g. Guidebook, information sent by post, etc? 8. Did the researchers/authors justify the selection of interventionists?* (e.g. appropriateness in terms of professional background/education of the person delivering the intervention) 9. If relevant, did the researchers/authors provide appropriate justification for the selection of co‐interventionists? 10. If more than one interventionist was involved in delivery of the intervention, did the researchers/authors indicate how delivery of the intervention was standardised across interventionists?* 11. Did the researchers/authors indicate that the intervention was delivered at an appropriate time period for the caregivers, which was in accordance to the overall goal? (e.g. if the goal is to support caregivers who are new to the role then it should be delivered during the early stages of caregiving) 12. Was there any potential risk of intervention contamination across the study groups?* 13. Did the researchers/authors justify the intensity of the intervention (in terms of frequency of delivery and duration of each session)? 14. Duration: Did the researchers/authors indicate that the complete intervention was delivered to the participants i.e. 100% of the intervention was delivered? 15. If the intervention was tailored/modified/adapted, did the researchers/authors indicate why? what? and how? 16. Did the researchers assess consistency in intervention delivery? 17. Did the researchers/authors state that the intervention was delivered in accordance with the trial protocol? 18. Was interventionist training standardised? 19. Did the authors indicate that intervention delivery was monitored?* 20. If yes/PY to item 19, was intervention delivery monitored using an objective measure? 21. Did the authors indicate that caregiver receipt of the intervention was monitored? (i.e. Caregivers’ understanding of and use of the intervention) 22. If ‘yes/PY’ to item 21, was caregiver receipt of the intervention monitored using an objective measure? | |||||||||||||||||||||||
| N/A: not applicable | |||||||||||||||||||||||
| Sequence generation | Allocation concealment | Blinding | Incomplete outcome data (attrition bias) | Selective outcome reporting (reporting bias) | Other potential sources of bias | ||
| Burden | Low | ||||||
| High | |||||||
| Unclear | |||||||
| Psychological Health: Depression | Low | ||||||
| High | |||||||
| Unclear | |||||||
| Psychological Health: Stress | Low | ||||||
| High | |||||||
| Unclear | |||||||
| Health Status and Well‐Being: Physical Health | Low | ||||||
| High | |||||||
| Unclear | |||||||
| Health Status and Well‐Being: Self‐efficacy | Low | ||||||
| High | |||||||
| Unclear | |||||||
| Outcome and time point | Study | Result (as presented by study authors) | Notes/comments |
| QoL End of intervention | Intervention group mean 67.87, n = 70, versus control group mean 67.42, n = 69 | No data available for each group SD or 95% CI | |
| Short‐term | Intervention group mean 73.25 versus control group 70.84, N = 140 | Reported numbers assessed by group, n = 68 intervention group and n = 67 control group. No data available for each group SD or 95% CI | |
| Burden End of intervention | Intervention group mean 17.37, n = 70 versus control group mean 26.26, n = 69, P < 0.001 | No data available for each group SD. Reported mean change data with 95% CI | |
| Mean and SD: Intervention group mean 31.7, SD 15.2 versus control group mean 31.7, SD 17.3, N = 81, P = 0.49 | No data available for the numbers by study group. No response from author contact | ||
| Short‐term | Intervention group mean 8.6 versus control group mean 17.34, N = 140, P < 0.001 | Reported numbers assessed by group, n = 68 intervention group and n = 67 control group. No data available for each group SD | |
| Skill Acquisition: Competence End of intervention | Intervention group mean 13.52, SD 2.85 versus control mean 14.17, SD 2.57, total N = 94, P = 0.932 | No data available for the numbers by study group. No response from author contact | |
| Psychological Health: Caregiver Depression End of intervention | Intervention group mean 18.17, SD 7.19 versus control group 20.2, SD 7.2, N = 94, P = 0.121 | No data available for the numbers by study group. No response from author contact | |
| Intervention group mean 4.57, n = 70 versus control group mean 7.45, n = 69, P = 0.013 | No data available for each group SD | ||
| intervention mean ‐0.16, SD 2.6 versus control mean ‐1.22, SD 3.1, P > 0.05 | Mean change data from baseline only provided. No mean difference for each arm available. No data available for the numbers in each group, SD or 95% CI | ||
| Psychological Health: Caregiver Depression Short‐term | Intervention group mean 2.41, versus control group mean 4.21, N = 70, P = 0.144 | Reported numbers assessed by group, n = 68 intervention group and n = 67 control group. No data available for each group SD | |
| Psychological Health: Caregiver Anxiety End of intervention | Intervention group mean 3.97, n = 70 versus control group 6.41, n = 69 | No data available for each group SD or 95% CI | |
| Short‐term | Intervention group mean 1.15 versus control group 2.90, N = 140 | Reported numbers assessed by group, n = 68 intervention group and n = 67 control group. No data available for each group SD or 95% CI | |
| Psychological Health: Caregiver Stress End of intervention | Intervention group mean 9.06, n =70 versus control group 12.45, n = 69 | Reported numbers assessed by group, n = 68 intervention group and n = 67 control group. No SD or 95% CI | |
| Short‐term | Intervention group mean 3.71 versus control group 7.79, N = 140 | Reported numbers assessed by group, n = 68 intervention group and n = 67 control group. No data available for each group SD or 95% CI | |
| Health Status and Well‐Being: Physical Health End of intervention | Mean change ‐0.84, SD 4.5 intervention and mean change 1.74, SD 3.8 control group; P < 0.10 | Mean change data only provided. No participant number, means or standard deviation score reported. No response from author contact | |
| Family Functioning End of intervention | Mean change scores from baseline of 2.7, SD 6.4 and ‐2.8, SD 4.0: P < 0.05 | Mean change data from baseline only provided. No mean difference for each arm available. No participant number, means or standard deviation score reported. No response from author contact | |
| Cost End of intervention | Intervention mean 352.53 Australian Dollars, SD = 81.5, n = 62 versus control mean 15.89 Australian Dollars, SD = N/A, n = 69 | Reported figures for total acute care costs which included hospital admissions, ED presentations, and ambulance services, and were not isolated to the intervention costs. Communication with the author resulted in retrieving further cost data specific to intervention costs (e.g. nurses time, cost, of training and telephone charges, etc). | |
| Short‐term | Mean (SD) and study numbers (US Dollars): Intervention mean 7008.3 SD 9226.2, n = 83 versus control mean 8831.4 SD 13,245.8, n = 75 | Cost utility analysis, mean, SD and study group numbers provided by the authors | |
| Medium‐term | Mean (SD) and study numbers (US Dollars): Intervention mean 6783.9, SD 7767, n = 83 versus control mean 5648, SD 6353.4, n = 75 | ||
| CI:Confidence interval | |||
| Outcome or subgroup title | No. of studies | No. of participants | Statistical method | Effect size |
| 1 Quality of Life Show forest plot | 4 | Std. Mean Difference (IV, Random, 95% CI) | Subtotals only | |
| 1.1 Quality of life (End of intervention) | 4 | 364 | Std. Mean Difference (IV, Random, 95% CI) | ‐0.02 [‐0.24, 0.19] |
| 2 Quality of life (Short‐term follow‐up) Show forest plot | 1 | 128 | Mean Difference (IV, Random, 95% CI) | 0.0 [‐4.43, 4.43] |
| 2.1 Quality of life (Short‐term follow‐up ≤ 3 months) | 1 | 128 | Mean Difference (IV, Random, 95% CI) | 0.0 [‐4.43, 4.43] |
| 3 Burden Show forest plot | 10 | Std. Mean Difference (IV, Random, 95% CI) | Subtotals only | |
| 3.1 End of intervention | 9 | 788 | Std. Mean Difference (IV, Random, 95% CI) | ‐0.11 [‐0.30, 0.07] |
| 3.2 Medium‐term follow up > 3 to ≤ 6 months | 2 | 147 | Std. Mean Difference (IV, Random, 95% CI) | 0.00 [‐0.32, 0.33] |
| 4 Burden (Short‐term follow‐up) Show forest plot | 1 | 128 | Mean Difference (IV, Random, 95% CI) | ‐0.20 [‐0.75, 0.35] |
| 4.1 Short‐term follow‐up ≤ 3 months | 1 | 128 | Mean Difference (IV, Random, 95% CI) | ‐0.20 [‐0.75, 0.35] |
| 5 Skill acquisition: Problem‐Solving Show forest plot | 3 | Std. Mean Difference (IV, Random, 95% CI) | Subtotals only | |
| 5.1 End of intervention | 3 | 236 | Std. Mean Difference (IV, Random, 95% CI) | 0.25 [‐0.21, 0.71] |
| 6 Skill acquisition: Preparedness to Care Show forest plot | 2 | Std. Mean Difference (IV, Random, 95% CI) | Subtotals only | |
| 6.1 End of intervention | 2 | 208 | Std. Mean Difference (IV, Random, 95% CI) | 0.37 [0.09, 0.64] |
| 7 Skill acquisition: Preparedness to Care (medium‐term follow‐up) Show forest plot | 1 | Mean Difference (IV, Random, 95% CI) | Subtotals only | |
| 7.1 Medium‐term follow‐up > 3 months to ≤ 6 months | 1 | 17 | Mean Difference (IV, Random, 95% CI) | ‐0.30 [‐1.02, 0.42] |
| 8 Skill acquisition:Competence Show forest plot | 1 | Mean Difference (IV, Random, 95% CI) | Subtotals only | |
| 8.1 End of intervention | 1 | 107 | Mean Difference (IV, Random, 95% CI) | 4.10 [‐2.19, 10.39] |
| 9 Psychological health: Depression Show forest plot | 10 | Std. Mean Difference (IV, Random, 95% CI) | Subtotals only | |
| 9.1 End of intervention | 9 | 792 | Std. Mean Difference (IV, Random, 95% CI) | ‐0.37 [‐0.70, ‐0.05] |
| 9.2 Medium‐term follow‐up > 3 months to ≤ 6 months | 3 | 227 | Std. Mean Difference (IV, Random, 95% CI) | ‐0.05 [‐0.56, 0.45] |
| 10 Psychological health: Anxiety Show forest plot | 1 | Mean Difference (IV, Random, 95% CI) | Subtotals only | |
| 10.1 End of intervention | 1 | 61 | Mean Difference (IV, Random, 95% CI) | ‐4.00 [‐11.68, ‐0.32] |
| 11 Psychological health: Coping Show forest plot | 1 | Mean Difference (IV, Random, 95% CI) | Subtotals only | |
| 11.1 End of intervention | 1 | 121 | Mean Difference (IV, Random, 95% CI) | 1.0 [‐0.45, 2.45] |
| 12 Psychological health: Stress Show forest plot | 1 | Mean Difference (IV, Random, 95% CI) | Subtotals only | |
| 12.1 End of intervention | 1 | 137 | Mean Difference (IV, Random, 95% CI) | ‐0.10 [‐0.30, 0.10] |
| 12.2 Medium‐term follow‐up > 3 to ≤ 6 months | 1 | 130 | Mean Difference (IV, Random, 95% CI) | 0.10 [‐0.11, 0.31] |
| 13 Knowledge and understanding: Knowledge Show forest plot | 1 | Mean Difference (IV, Random, 95% CI) | Subtotals only | |
| 13.1 End of intervention | 1 | 61 | Mean Difference (IV, Random, 95% CI) | 1.90 [‐0.63, 4.43] |
| 14 Health status and well‐being: Physical health Show forest plot | 2 | Std. Mean Difference (IV, Random, 95% CI) | Subtotals only | |
| 14.1 End of intervention | 2 | 248 | Std. Mean Difference (IV, Random, 95% CI) | ‐0.09 [‐0.35, 0.17] |
| 15 Health status and well‐being: Self‐efficacy Show forest plot | 2 | Std. Mean Difference (IV, Random, 95% CI) | Subtotals only | |
| 15.1 End of intervention | 2 | 175 | Std. Mean Difference (IV, Random, 95% CI) | 0.04 [‐0.26, 0.33] |
| 16 Health status and well‐being: Self‐efficacy (Medium‐term follow‐up) Show forest plot | 1 | Mean Difference (IV, Random, 95% CI) | Subtotals only | |
| 16.1 Medium‐term follow‐up > 3 to ≤ 6 months | 1 | 130 | Mean Difference (IV, Random, 95% CI) | 0.0 [‐0.29, 0.29] |
| 17 Health status and well‐being: Social activity Show forest plot | 1 | Mean Difference (IV, Random, 95% CI) | Subtotals only | |
| 17.1 End of intervention | 1 | 121 | Mean Difference (IV, Random, 95% CI) | 0.04 [‐0.10, 0.18] |
| 18 Satisfaction: Satisfaction with supports Show forest plot | 3 | Std. Mean Difference (IV, Random, 95% CI) | Subtotals only | |
| 18.1 End of intervention | 3 | 291 | Std. Mean Difference (IV, Random, 95% CI) | 0.10 [‐0.24, 0.44] |
| 19 Family functioning Show forest plot | 1 | 141 | Mean Difference (IV, Random, 95% CI) | 0.20 [‐0.04, 0.44] |
| Outcome or subgroup title | No. of studies | No. of participants | Statistical method | Effect size |
| 1 Burden Show forest plot | 1 | Mean Difference (IV, Random, 95% CI) | Subtotals only | |
| 1.1 End of intervention | 1 | 11 | Mean Difference (IV, Random, 95% CI) | ‐0.20 [‐0.74, 0.34] |
| 2 Depression Show forest plot | 2 | Mean Difference (IV, Random, 95% CI) | Subtotals only | |
| 2.1 End of intervention | 1 | 11 | Mean Difference (IV, Random, 95% CI) | ‐4.3 [‐9.57, 0.97] |
| 2.2 Unknown time point | 1 | 45 | Mean Difference (IV, Random, 95% CI) | 1.20 [‐5.35, 7.75] |
| 3 Stress Show forest plot | 1 | Mean Difference (IV, Random, 95% CI) | Subtotals only | |
| 3.1 Unknown time point | 1 | 45 | Mean Difference (IV, Random, 95% CI) | ‐0.60 [‐3.17, 1.97] |
| 4 Physical Health Show forest plot | 1 | Mean Difference (IV, Random, 95% CI) | Subtotals only | |
| 4.1 End of intervention | 1 | 11 | Mean Difference (IV, Random, 95% CI) | 1.9 [‐0.65, 4.45] |