| 1 SGRQ Total: mean difference Show forest plot | 1 | | Mean Difference (IV, Fixed, 95% CI) | Subtotals only |
|
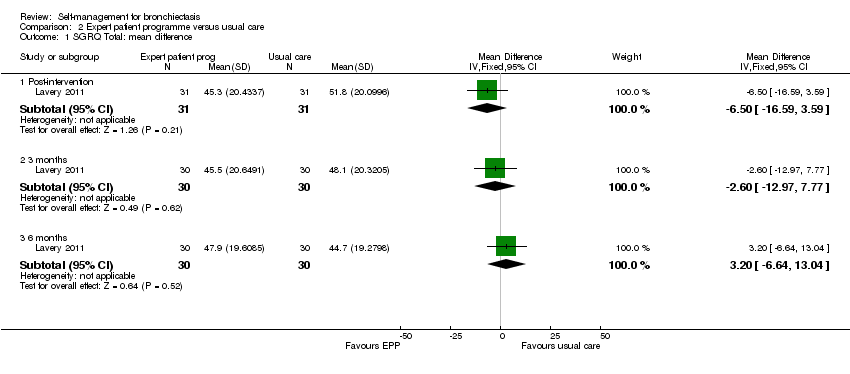
| 1.1 Post‐intervention | 1 | 62 | Mean Difference (IV, Fixed, 95% CI) | ‐6.5 [‐16.59, 3.59] |
| 1.2 3 months | 1 | 60 | Mean Difference (IV, Fixed, 95% CI) | ‐2.60 [‐12.97, 7.77] |
| 1.3 6 months | 1 | 60 | Mean Difference (IV, Fixed, 95% CI) | 3.20 [‐6.64, 13.04] |
| 2 Self‐efficacy: Exercise Show forest plot | 1 | | Mean Difference (IV, Fixed, 95% CI) | Subtotals only |
|
| 2.1 Postintervention | 1 | 62 | Mean Difference (IV, Fixed, 95% CI) | 2.10 [0.89, 3.31] |
| 2.2 3 months | 1 | 60 | Mean Difference (IV, Fixed, 95% CI) | 1.40 [0.14, 2.66] |
| 2.3 6 months | 1 | 60 | Mean Difference (IV, Fixed, 95% CI) | 0.80 [‐0.46, 2.06] |
| 3 Self‐efficacy: Disease info Show forest plot | 1 | | Mean Difference (IV, Fixed, 95% CI) | Subtotals only |
|
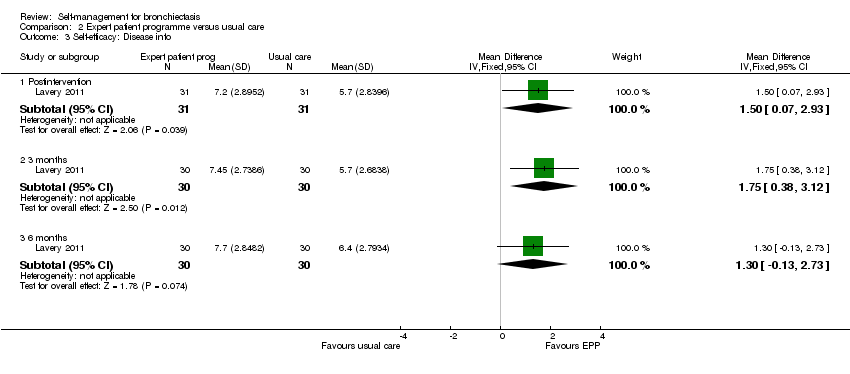
| 3.1 Postintervention | 1 | 62 | Mean Difference (IV, Fixed, 95% CI) | 1.5 [0.07, 2.93] |
| 3.2 3 months | 1 | 60 | Mean Difference (IV, Fixed, 95% CI) | 1.75 [0.38, 3.12] |
| 3.3 6 months | 1 | 60 | Mean Difference (IV, Fixed, 95% CI) | 1.30 [‐0.13, 2.73] |
| 4 Self‐efficacy: Obtain help Show forest plot | 1 | | Mean Difference (IV, Fixed, 95% CI) | Subtotals only |
|
| 4.1 Postintervention | 1 | 62 | Mean Difference (IV, Fixed, 95% CI) | 1.10 [0.05, 2.15] |
| 4.2 3 months | 1 | 60 | Mean Difference (IV, Fixed, 95% CI) | 0.80 [‐0.34, 1.94] |
| 4.3 6 months | 1 | 60 | Mean Difference (IV, Fixed, 95% CI) | 1.0 [‐0.19, 2.19] |
| 5 Self‐efficacy: Communication Show forest plot | 1 | | Mean Difference (IV, Fixed, 95% CI) | Subtotals only |
|
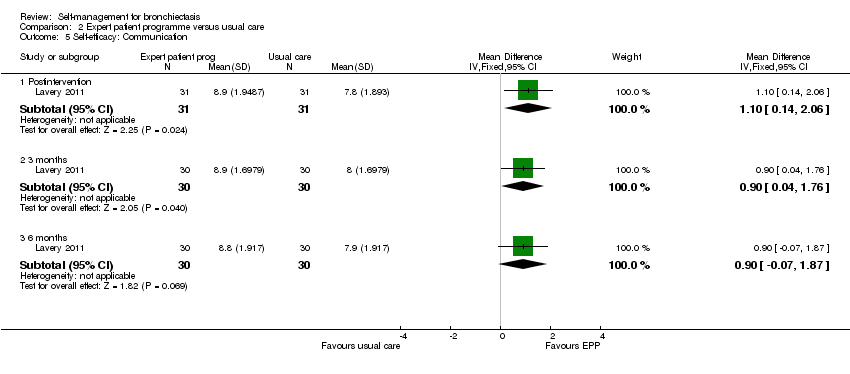
| 5.1 Postintervention | 1 | 62 | Mean Difference (IV, Fixed, 95% CI) | 1.10 [0.14, 2.06] |
| 5.2 3 months | 1 | 60 | Mean Difference (IV, Fixed, 95% CI) | 0.90 [0.04, 1.76] |
| 5.3 6 months | 1 | 60 | Mean Difference (IV, Fixed, 95% CI) | 0.90 [‐0.07, 1.87] |
| 6 Self‐efficacy: Manage disease Show forest plot | 1 | | Mean Difference (IV, Fixed, 95% CI) | Subtotals only |
|
| 6.1 Postintervention | 1 | 62 | Mean Difference (IV, Fixed, 95% CI) | 1.10 [0.17, 2.03] |
| 6.2 3 months | 1 | 60 | Mean Difference (IV, Fixed, 95% CI) | 1.10 [0.27, 1.93] |
| 6.3 6 months | 1 | 60 | Mean Difference (IV, Fixed, 95% CI) | 0.70 [‐0.27, 1.67] |
| 7 Self‐efficacy: Do chores Show forest plot | 1 | | Mean Difference (IV, Fixed, 95% CI) | Subtotals only |
|
| 7.1 Postintervention | 1 | 62 | Mean Difference (IV, Fixed, 95% CI) | 2.0 [0.78, 3.22] |
| 7.2 3 months | 1 | 60 | Mean Difference (IV, Fixed, 95% CI) | 1.20 [‐0.14, 2.54] |
| 7.3 6 months | 1 | 60 | Mean Difference (IV, Fixed, 95% CI) | 1.20 [‐0.01, 2.41] |
| 8 Self‐efficacy: Social activity Show forest plot | 1 | | Mean Difference (IV, Fixed, 95% CI) | Subtotals only |
|
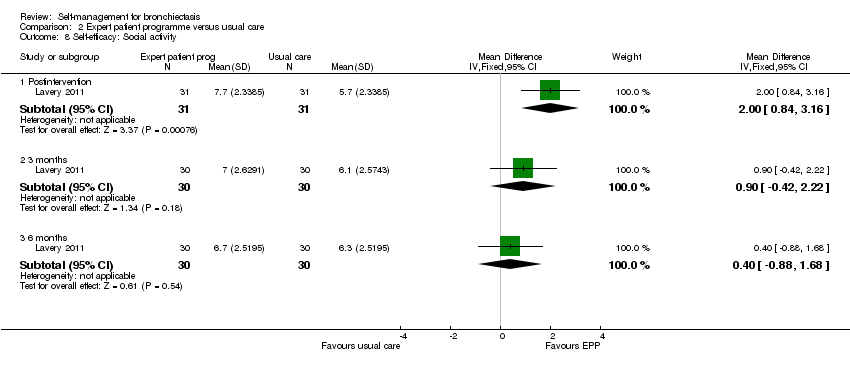
| 8.1 Postintervention | 1 | 62 | Mean Difference (IV, Fixed, 95% CI) | 2.0 [0.84, 3.16] |
| 8.2 3 months | 1 | 60 | Mean Difference (IV, Fixed, 95% CI) | 0.90 [‐0.42, 2.22] |
| 8.3 6 months | 1 | 60 | Mean Difference (IV, Fixed, 95% CI) | 0.40 [‐0.88, 1.68] |
| 9 Self‐efficacy: Manage symptoms Show forest plot | 1 | | Mean Difference (IV, Fixed, 95% CI) | Subtotals only |
|
| 9.1 Postintervention | 1 | 62 | Mean Difference (IV, Fixed, 95% CI) | 1.90 [0.78, 3.02] |
| 9.2 3 months | 1 | 60 | Mean Difference (IV, Fixed, 95% CI) | 1.20 [0.13, 2.27] |
| 9.3 6 months | 1 | 60 | Mean Difference (IV, Fixed, 95% CI) | 0.70 [‐0.41, 1.81] |
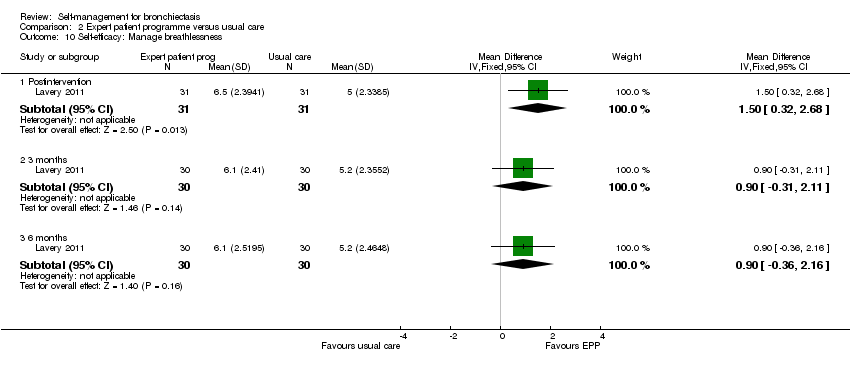
| 10 Self‐efficacy: Manage breathlessness Show forest plot | 1 | | Mean Difference (IV, Fixed, 95% CI) | Subtotals only |
|
| 10.1 Postintervention | 1 | 62 | Mean Difference (IV, Fixed, 95% CI) | 1.5 [0.32, 2.68] |
| 10.2 3 months | 1 | 60 | Mean Difference (IV, Fixed, 95% CI) | 0.90 [‐0.31, 2.11] |
| 10.3 6 months | 1 | 60 | Mean Difference (IV, Fixed, 95% CI) | 0.90 [‐0.36, 2.16] |
| 11 Self‐efficacy: Manage depression Show forest plot | 1 | | Mean Difference (IV, Fixed, 95% CI) | Subtotals only |
|
| 11.1 Postintervention | 1 | 62 | Mean Difference (IV, Fixed, 95% CI) | 2.0 [0.91, 3.09] |
| 11.2 3 months | 1 | 60 | Mean Difference (IV, Fixed, 95% CI) | 1.40 [0.19, 2.61] |
| 11.3 6 months | 1 | 60 | Mean Difference (IV, Fixed, 95% CI) | 1.30 [0.09, 2.51] |