Betabloqueantes para el infarto agudo de miocardio presunto o diagnosticado
Resumen
Antecedentes
La enfermedad cardiovascular es la causa principal de muerte en todo el mundo. Según la Organización Mundial de la Salud, 7 400 000 de personas murieron a causa de cardiopatías isquémicas en 2012, lo que constituye el 15% de todas las muertes. El infarto agudo de miocardio es causado por la obstrucción de la sangre que irriga el músculo cardíaco. Los betabloqueantes se utilizan a menudo en pacientes con infarto agudo de miocardio. Los metanálisis anteriores sobre el tema han mostrado resultados contradictorios que incluyen efectos perjudiciales, neutrales y beneficiosos. Ninguna revisión sistemática anterior que utilizara la metodología Cochrane ha evaluado los efectos de los betabloqueantes para el infarto agudo de miocardio.
Objetivos
Evaluar los efectos beneficiosos y perjudiciales de los betabloqueantes en comparación con placebo o ninguna intervención en pacientes con infarto agudo de miocardio presunto o diagnosticado.
Métodos de búsqueda
Se hicieron búsquedas en CENTRAL, MEDLINE, Embase, LILACS, Science Citation Index Expanded y BIOSIS Citation Index en junio 2019. También se realizaron búsquedas en la International Clinical Trials Registry Platform de la OMS, ClinicalTrials.gov, Turning Research into Practice, Google Scholar, SciSearch y en las listas de referencias de los ensayos incluidos y las revisiones anteriores en agosto 2019.
Criterios de selección
Se incluyeron todos los ensayos clínicos aleatorizados que evaluaron los efectos de los betabloqueantes versus placebo o ninguna intervención en pacientes con infarto agudo de miocardio presunto o diagnosticado. Los ensayos se incluyeron independientemente del diseño del ensayo, el ámbito, el cegamiento, el estado de la publicación, el año de publicación, el idioma y el informe de los resultados.
Obtención y análisis de los datos
Se siguieron las recomendaciones metodológicas Cochrane. Dos autores de la revisión extrajeron los datos de forma independiente. Los resultados primarios fueron: la mortalidad por todas las causas, los eventos adversos graves según la International Conference on Harmonization ‐ Good Clinical Practice (ICH‐GCP) y los eventos cardiovasculares adversos importantes (compuestos por la mortalidad cardiovascular y el infarto de miocardio no mortal durante el seguimiento). Los resultados secundarios fueron: la calidad de vida, la angina, la mortalidad cardiovascular y el infarto de miocardio durante el seguimiento. El punto temporal primario de interés fue menos de tres meses después de la asignación al azar. También se evaluaron los resultados en el seguimiento máximo más allá de los tres meses. Debido al riesgo de multiplicidad, se calculó un intervalo de confianza (IC) del 97,5% para los resultados primarios y un IC del 98% para los resultados secundarios. Se evaluaron los riesgos de errores sistemáticos a través de siete dominios del sesgo de acuerdo con las instrucciones del Manual Cochrane (Cochrane Handbook). La calidad del conjunto de evidencia fue evaluada con los criterios GRADE.
Resultados principales
Se incluyeron 63 ensayos que asignaron al azar a un total de 85 550 participantes (media de edad 57,4 años). Sólo un ensayo presentó bajo riesgo de sesgo. Los ensayos restantes presentaron un riesgo de sesgo alto. La calidad de la evidencia según los criterios GRADE varió de muy baja a alta. Cincuenta y seis ensayos iniciaron los betabloqueantes durante la fase aguda del infarto agudo de miocardio y siete durante la fase subaguda.
En el punto temporal primario de «menos de tres meses de seguimiento», el metanálisis mostró que los betabloqueantes versus placebo o ninguna intervención probablemente reducen el riesgo de un nuevo infarto durante el seguimiento (riesgo relativo [RR] 0,82; intervalo de confianza [IC] del 98%: 0,73 a 0,91; 67 562 participantes; 18 ensayos; evidencia de calidad moderada) con una reducción del riesgo absoluto del 0,5% y un número necesario a tratar para lograr un resultado beneficioso adicional (NNTB) de 196 participantes. Sin embargo, se encontró poco o ningún efecto de los betabloqueantes cuando se evaluó la mortalidad por todas las causas (RR 0,94; IC del 97,5%: 0,90 a 1,00; 80 452 participantes; 46 ensayos/47 comparaciones; evidencia de calidad alta) con una reducción del riesgo absoluto del 0,4% y la mortalidad cardiovascular (RR 0,99; IC del 95%: 0,91 a 1,08; 45 852 participantes; 1 ensayo; evidencia de calidad moderada) con una reducción del riesgo absoluto del 0,4%. Con respecto a la angina, no se sabe si los betabloqueantes tienen un efecto beneficioso o perjudicial (RR 0,70; IC del 98%: 0,25 a 1,84; 98 participantes; 3 ensayos; evidencia de calidad muy baja) con una reducción del riesgo absoluto del 7,1%. Ninguno de los ensayos evaluó específicamente ni informó de eventos adversos graves según la ICH‐GCP. Sólo dos ensayos evaluaron específicamente los eventos cardiovasculares adversos graves, sin embargo, no hubo eventos cardiovasculares adversos graves en ninguno de los dos ensayos.
En el seguimiento máximo más allá de los tres meses, los metanálisis mostraron que los betabloqueantes versus placebo o ninguna intervención probablemente reducen el riesgo de mortalidad por todas las causas (RR 0,93; IC del 97,5%: 0,86 a 0,99; 25 210 participantes; 21 ensayos/22 comparaciones; evidencia de calidad moderada) con una reducción del riesgo absoluto de 1,1% y un NNTB de 91 participantes, y la mortalidad cardiovascular (RR 0,90; IC del 98%: 0,83 a 0,98; 22 457 participantes; 14 ensayos/15 comparaciones; evidencia de calidad moderada) con una reducción del riesgo absoluto del 1,2% y un NNTB de 83 participantes. Sin embargo, no se sabe con certeza si los betabloqueantes tienen un efecto beneficioso o perjudicial cuando se evalúan los eventos cardiovasculares adversos importantes (RR 0,81; IC del 97,5%: 0,40 a 1,66; 475 participantes; 4 ensayos; evidencia de calidad muy baja) con una reducción del riesgo absoluto de 1,7%; el nuevo infarto (RR 0,89; IC del 98%: 0,75 a 1,08; 6825 participantes; 14 ensayos; evidencia de calidad baja) con una reducción del riesgo absoluto del 0,9%; y la angina (RR 0,64; IC del 98%: 0,18 a 2,0; 844 participantes; 2 ensayos; evidencia de calidad muy baja). Ninguno de los ensayos evaluó específicamente ni informó de eventos adversos graves según la ICH‐GCP.
Ninguno de los ensayos evaluó la calidad de vida.
Se identificaron dos ensayos clínicos aleatorizados en curso que investigan el efecto de la administración temprana de betabloqueantes después de la intervención coronaria percutánea o la trombólisis en pacientes con un infarto agudo de miocardio y un ensayo en curso que investigó el efecto del tratamiento con betabloqueantes a largo plazo.
Conclusiones de los autores
Esta revisión indica que los betabloqueantes para el infarto agudo de miocardio presunto o diagnosticado probablemente reducen el riesgo a corto plazo de un nuevo infarto y el riesgo a largo plazo de mortalidad por todas las causas y mortalidad cardiovascular. Sin embargo, es muy probable que los betabloqueantes tengan poco o ningún efecto sobre el riesgo a corto plazo de mortalidad por todas las causas y mortalidad cardiovascular. Con respecto a todos los resultados restantes (eventos adversos graves según la ICH‐GCP, eventos cardiovasculares adversos graves [compuestos por mortalidad cardiovascular e infarto de miocardio no mortal durante el seguimiento], riesgo a largo plazo de un nuevo infarto durante el seguimiento, calidad de vida y angina), se necesita información adicional para confirmar o rechazar los efectos clínicos de los betabloqueantes en estos resultados para los pacientes con infarto agudo de miocardio o sospecha del mismo.
PICO
Resumen en términos sencillos
Betabloqueantes versus placebo o ninguna intervención en pacientes con infarto de miocardio presunto o diagnosticado
Antecedentes
Según la Organización Mundial de la Salud, 7 400 000 de personas murieron a causa de cardiopatías isquémicas en 2012, lo que representa el 15% de todas las muertes a nivel mundial. El papel del tratamiento agudo o subagudo con betabloqueantes en pacientes con sospecha o diagnóstico de ataque cardíaco se basa en la inhibición de los llamados receptores beta. Lo anterior puede resultar en una reducción de la demanda de oxígeno del corazón. Por lo tanto, la inhibición del receptor beta puede o no disminuir las complicaciones asociadas con el ataque cardíaco.
Pregunta de la revisión
El objetivo de esta revisión sistemática Cochrane fue evaluar los efectos beneficiosos y perjudiciales de los betabloqueantes en pacientes con infarto agudo de miocardio (ataque cardíaco) presunto o diagnosticado.
Fecha de la búsqueda
Se realizaron búsquedas en bases de datos científicas desde su inicio hasta junio 2019.
Características de los estudios
Se encontraron 63 ensayos clínicos aleatorizados en que los pacientes que presentaban un ataque cardíaco o sospecha del mismo fueron asignadas al azar para recibir betabloqueantes en comparación con placebo o ninguna intervención. Los 63 ensayos incluyeron a 85 550 adultos con una media de edad de 57,4 años. Sólo un ensayo presentó bajo riesgo de sesgo. Los ensayos restantes presentaron un riesgo de sesgo alto. La calidad de la evidencia según los criterios GRADE varió de muy baja a alta. Cincuenta y seis ensayos iniciaron los betabloqueantes versus control durante la fase aguda del infarto agudo de miocardio y siete durante la fase subaguda.
Fuentes de financiación de los estudios
Se encontraron 33 ensayos financiados total o parcialmente por la industria, 20 ensayos que no informaron de su fuente de financiamiento, y diez financiados por otras fuentes diferentes a la industria.
Resultados clave y conclusiones
Esta revisión muestra que los pacientes que reciben betabloqueantes en comparación con los que reciben placebo o ninguna intervención parecen tener un riesgo menor de un nuevo ataque cardíaco en la fase aguda después de un ataque cardíaco. Los pacientes que reciben betabloqueantes también parecen estar en menor riesgo de muerte por cualquier causa y por cualquier causa cardíaca en un seguimiento a largo plazo después de un ataque cardíaco. No obstante, los pacientes que reciben betabloqueantes no parecen tener un riesgo menor o mayor de muerte por cualquier causa o por cualquier causa cardíaca en la fase aguda después de un ataque cardíaco. Los efectos de los betabloqueantes sobre todos los resultados restantes (eventos adversos graves según la International Conference on Harmonization ‐ Good Clinical Practice, eventos cardiovasculares adversos importantes [compuestos por muerte por una causa cardíaca y un nuevo ataque cardíaco no mortal], nuevo ataque cardíaco durante el seguimiento a largo plazo, calidad de vida y angina) son inciertos debido a la ausencia o la escasez de datos.
Authors' conclusions
Summary of findings
| Beta‐blockers versus placebo or no intervention for patients with suspected or diagnosed myocardial infarction at the time point less than three months follow‐up | ||||||
| Patient or population: patients with suspected or diagnosed myocardial infarction Settings: any setting Intervention: any beta‐blocker Comparison: placebo or no intervention | ||||||
| Outcomes | Illustrative comparative risks* | Relative effect (adjusted CI) | No of Participants | Quality of the evidence | Comments | |
| Assumed risk with placebo or no intervention | Corresponding risk with beta‐blockers | |||||
| All‐cause mortality at 'less than 3 months' follow‐up. Follow‐up: mean 21.8 days (range 1 hour to 90 days). | 70 per 1000 | 67 per 1000 | RR 0.94, 97.5% CI (0.90 to 1.0) | 80,452 (46 RCTs with 47 comparisons) | ⊕⊕⊕⊕1 | Since the sensitivity analysis excluding trials at high risk of bias and the overall meta‐analysis showed similar results, we based our summary of findings and conclusion on the overall meta‐analysis. No events occurred in either group in three trials (Hanada 2012; Norris 1978; Shirotani 2010). |
| Serious adverse events at 'less than 3 months' follow‐up. No data was reported in the included trials. | ‐ | ‐ | ‐ | ‐ | ‐ | None of the trials specifically assessed nor reported serious adverse events according to ICH‐GCP. |
| MACE (major adverse cardiovascular event) at 'less than 3 months' follow‐up. No data were reported in the included trials. | ‐ | ‐ | ‐ | ‐ | ‐ | Only two trials specifically assessed major adverse cardiovascular events (defined as a composite of cardiovascular mortality and myocardial infarction during follow‐up). However, no major adverse cardiovascular events occurred in either trial. |
| Quality of life at 'less than 3 months' follow‐up. No data were reported in the included trials. | ‐ | ‐ | ‐ | ‐ | ‐ | No data reported. |
| Angina at 'less than 3 months' follow‐up. Follow‐up: mean 21 days (range 12 to 30 days). | 222 per 1000 | 155 per 1000 (69 to 351) | RR 0.70, 98% CI (0.25 to 1.84) | 98 (3 RCTs) | ⊕⊝⊝⊝2,3 VERY LOW | |
| Cardiovascular mortality at 'less than 3 months' follow‐up. Follow‐up: mean 28 days. | 43 per 1000 | 42 per 1000 | RR 0.99, 95% CI (0.91 to 1.08) | 45,852 (1 RCT) | ⊕⊕⊕⊝4 | Since the sensitivity analysis excluding trials at high risk of bias differed from the overall meta‐analysis, we based our summary of findings and conclusion on the sensitivity analysis. |
| Myocardial infarction at 'less than 3 months' follow‐up. Follow‐up: mean 23.3 days (range 3 to 90 days). | 28 per 1000 | 23 per 1000 | RR 0.82, 98% CI (0.74 to 0.90) | 67,562 (18 RCTs) | ⊕⊕⊕⊝5 | Since the sensitivity analysis excluding trials at high risk of bias and the overall meta‐analysis showed similar results, we based our summary of findings and conclusion on the overall meta‐analysis. No events occurred in either group in two trials (Hanada 2012; Shirotani 2010). |
| *The basis for the assumed risk (e.g. the median control group risk across studies) is provided in footnotes. The corresponding risk (and its adjusted confidence interval) is based on the assumed risk in the comparison group and the relative effect of the intervention (and its adjusted CI). | ||||||
| GRADE Working Group grades of evidence | ||||||
| 1 When assessing the risk of bias, the trial contributing most weight (COMMIT 2005, 63.4%) was assessed as at low risk of bias in all domains. The trial contributing the second highest weight (ISIS‐1 1986, 17.4%) was assessed as low risk of bias in random sequence generation, allocation concealment, and incomplete outcome data;'unclear for blinding of outcome assessors and selective reporting and at high risk for blinding of participants and personnel. Since a lack of blinding is less important for the assessment of all‐cause mortality, the overall limitations were not serious and the evidence is not downgraded for risk of bias. 2 Downgraded by one level due to serious risk of bias. All the included trials were at high risk of bias due to either unclear or high risk in several bias domains. 3 Downgraded by two levels due to very serious risk of imprecision based on the optimal information size not being reached, the very small sample size, and the absolute and relative 98% CI being very wide showing both appreciable benefit and harm. 4 Downgraded by one level due to serious risk of imprecision based on the wide absolute and relative 98% where the upper CI does not exclude the possibility of no difference between the groups. When assessing the risk of bias, the evidence was not downgraded since the result was based on the sensitivity analysis consisting of trials at low risk of bias (COMMIT 2005). 5 Downgraded by one level due to serious risk of bias. The overall limitations and specially in regard to blinding of outcome assessors were serious (around 50% of the trials were assessed at unclear risk of bias in blinding of outcome assessors). | ||||||
| Beta‐blockers compared with placebo or no intervention for patients with suspected or diagnosed myocardial infarction | ||||||
| Patient or population: patients with suspected or diagnosed myocardial infarction Settings: any setting Intervention: beta‐blockers Comparison: placebo or no intervention | ||||||
| Outcomes | Illustrative comparative risks* | Relative effect | No of Participants | Quality of the evidence | Comments | |
| Assumed risk with placebo or no intervention | Corresponding risk with beta‐blockers | |||||
| All‐cause mortality at maximum follow‐up beyond 3 months. Follow‐up: mean 16.4 months (range 6 to 60 months). | 148 per 1000 | 138 per 1000 | RR 0.93, 97.5% CI (0.86 to 0.99) | 25,210 (21 RCTs with 22 comparisons) | ⊕⊕⊕⊝3 | No events occurred in either group in one trial (Hanada 2012). |
| Serious adverse events at maximum follow‐up beyond 3 months. No data were reported in the included trials. | ‐ | ‐ | ‐ | ‐ | ‐ | None of the trials specifically assessed nor reported serious adverse events according to ICH‐GCP. |
| MACE (major adverse cardiovascular event) at maximum follow‐up beyond 3 months. Follow‐up: mean7.5 months (range 6 to 12 months). | 84 per 1000 | 68 per 1000 | RR 0.81, 97.5% CI (0.43 to 1.52) | 475 (4 RCTs) | ⊕⊝⊝⊝1, 2 | |
| Quality of life at maximum follow‐up beyond 3 months. No data were reported in the included trials. | ‐ | ‐ | ‐ | ‐ | ‐ | No data reported. |
| Angina at maximum follow‐up beyond 3 months (mean = 6 months). | 24 per 1000 | 15 per 1000 (5 to 48) | RR 0.64, 98% CI 0.18 to 2.0 | 844 ( 2 RTCs) | ⊕⊝⊝⊝1,5 | |
| Cardiovascular mortality at maximum follow‐up beyond 3 months. Follow‐up: mean 12.9 months (range 6 to 24 months). | 124 per 1000 | 112 per 1000 | RR 0.90, 98% CI (0.83 to 0.98) | 22,457 (14 RCTs with 15 comparisons) | ⊕⊕⊕⊝1 | No events occurred in either group in one trial (Hanada 2012). |
| Myocardial infarction at maximum follow‐up beyond 3 months. Follow‐up: mean 15.5 months (range 6 to 60 months). | 92 per 1000 | 83 per 1000 | RR 0.89, 98% CI (0.75 to 1.08) | 6825 (14 RCTs) | ⊕⊕⊝⊝1, 6 Low | |
| *The basis for the assumed risk (e.g. the median control group risk across studies) is provided in footnotes. The corresponding risk (and its confidence interval) is based on the assumed risk in the comparison group and the relative effect of the intervention (and its CI). | ||||||
| GRADE Working Group grades of evidence | ||||||
| 1 Downgraded by one level due to serious risk of bias. All the included trials were at high risk of bias due to either unclear or high risk in several bias domains. 2 Downgraded by two levels due to very serious risk of imprecision based on the optimal information size not being reached, the wide absolute and relative 97.5% CI showing both appreciable benefit and harm, and a small sample size. 3 Downgraded by one level due to serious risk of bias. All but one of the included trials were at high risk of bias due to either unclear or high risk in several bias domains and the sensitivity analysis excluding trials at high risk of bias showed different results than the overall analysis including trials at high risk of bias. However, the sensitivity analysis was based on only one small trial, so we have used the main analysis for the 'Summary of findings' table. 5 Downgraded by two levels due to very serious risk of imprecision based on the very small sample size included. 6 Downgraded by one level due to serious risk of imprecision based on the wide absolute and relative 98% where the upper CI does not exclude the possibility of no difference between the groups. | ||||||
Antecedentes
Por qué es importante realizar esta revisión
Resultadosa largo plazo
Objectives
We assessed the benefits and harms of beta‐blockers compared with placebo or no intervention in people with suspected or diagnosed acute myocardial infarction.
The present review is based on our peer‐reviewed, published protocol (Nielsen 2016) with amendments during the review process (see Differences between protocol and review).
Métodos
Criterios de inclusión de estudios para esta revisión
Tipos de medida de resultado
Resultados primarios
-
Mortalidad por todas las causas.
-
eventos adversos graves.
Resultados secundarios
-
Mortalidad cardiovascular.
Métodos de búsqueda para la identificación de los estudios
Búsquedas electrónicas
We searched the following databases on 18 June 2019 to identify reports of relevant randomised clinical trials (Royle 2003).
-
Cochrane Central Register of Controlled Trials (CENTRAL; 2019, Issue 6) in the Cochrane Library
-
Epub Ahead of Print, In‐Process & Other Non‐Indexed Citations, MEDLINE Daily and MEDLINE (Ovid, 1946 to 14 June 2019)
-
Embase (Ovid, 1974 to 17 June 2019)
-
LILACS (Latin American and Caribbean Health Science Information Database) (Bireme, 1982 to 18 June 2019)
-
Science Citation Index Expanded on the Web of Science (Clarivate Analytics, 1900 to 18 June 2019)
-
BIOSIS Citation Index on the Web of Science (Clarivate Analytics, 1926 to 18 June 2019)
We adapted the preliminary search strategy for MEDLINE (Ovid) for use in these databases. We applied the Cochrane sensitivity‐maximising filter for randomised clinical trials (Lefebvre 2011) to MEDLINE Ovid and adaptations of it to the other databases, except CENTRAL. The search strategy can be found in Appendix 1.
We searched all databases from their inception to the present and we imposed no restriction on language of publication or publication status. We assessed non‐English language papers by asking individuals that speak the language fluently for help. This is acknowledged in the Acknowledgements section.
Búsqueda de otros recursos
We searched the reference lists of included randomised clinical trials, previous systematic reviews, and other kinds of reviews for any unidentified randomised clinical trials.
Furthermore, we searched for ongoing and unidentified randomised clinical trials on 14 August 2019:
-
the World Health Organization (WHO) International Clinical Trials Registry Platform (ICTRP) search portal (apps.who.int/trialsearch);
-
ClinicalTrials.gov (www.clinicaltrials.gov);
-
Turning Research Into Practice (TRIP) (http://www.tripdatabase.com/);
-
Google Scholar (http://scholar.google.dk/); and
-
Scisearch (http://ipscience.thomsonreuters.com/).
We also examined relevant retraction statements and errata for included trials.
Obtención y análisis de los datos
We performed this systematic review following the recommendations of Cochrane (Higgins 2011). The analyses were performed using Review Manager 5.3 (RevMan 2014).
Selección de los estudios
Two review authors (Sanam Safi (SS) and Naqash J Sethi (NJS)) independently screened titles and abstracts for inclusion of all the potentially eligible trials. We coded all these studies as 'retrieve' (eligible or potentially eligible/unclear) or 'do not retrieve'. If there was any disagreements, a third author were asked to arbitrate (Janus C Jakobsen (JCJ)). We retrieved the full‐text study reports/publications and four review authors (SS, NJS, Emil Eik Nielsen (EEN), and Joshua Feinberg (JF)) independently screened the full‐text reports and identified trials for inclusion. Reasons for exclusion of the ineligible studies were reported (Excluded studies). We resolved any disagreement through discussion or, if required, we consulted a third author (JCJ). We identified and excluded duplicated and collated multiple reports of the same trial so that each trial rather than each report is the unit of interest in the review. We recorded the selection process in sufficient detail to complete a PRISMA flow diagram (Moher 2009) Figure 1 and 'Characteristics of excluded studies' table.
Extracción y manejo de los datos
Four review authors (SS, NJS, EEN, JF) extracted and validated data independently from included trials. Any disagreement concerning the extracted data were discussed between the two authors. If no agreement could be reached, a third author (JCJ) resolved the issue. In case of relevant data not being available, we contacted the trial authors.
We used a data collection form for trial data and outcome data which was piloted on at least one trial in the review.
We extracted the following data mentioned below.
-
Trial characteristics: trial design (parallel, factorial, or cross‐over); number of intervention arms; duration of the trial; details of any 'run‐in' period; date of publication; inclusion and exclusion criteria; and 'Risk of bias' components (as defined below).
-
Participants characteristics: number of participants randomised; number of participants analysed; number of participants lost to follow‐up; mean age, and sex ratio.
-
Intervention characteristics: type of beta‐blocker; dose of beta‐blocker; duration of beta‐blocker therapy; and mode of administration.
-
Control characteristics: placebo or no intervention.
-
Co‐intervention characteristics: type of co‐intervention; dose of co‐intervention; duration of co‐intervention; and mode of administration.
-
Outcomes: primary, secondary, and exploratory outcomes specified and collected, and time points reported.
-
Notes: funding for trial, and notable conflicts of interest of trial authors.
Evaluación del riesgo de sesgo de los estudios incluidos
We used the instructions given in the Cochrane Handbook for Systematic Reviews of Interventions in our evaluation of the methodology and the risk of bias of the included trials (Higgins 2017). Four review authors (SS, NJS, EEN, and JF) assessed the included trials independently. We evaluated the risk of bias in the following 'Risk of bias' domains:
-
random sequence generation;
-
allocation concealment;
-
blinding of participants and personnel;
-
blinding of outcome assessment;
-
incomplete outcome data;
-
selective outcome reporting; and
-
other risks of bias.
This was done because these domains enable classification of randomised clinical trials at low risk of bias and at high risk of bias. The latter trials overestimate positive intervention effects (benefits) and underestimate negative effects (harms) (Gluud 2006; Kjaergard 2001; Lundh 2017; Moher 1998; Savovic 2012; Savovic 2012a; Schulz 1995; Wood 2008). For additional details on how the risk of bias was assessed, please see Appendix 2.
We graded each potential source of bias as high, low, or unclear and provided evidence from the study report together with a justification for our judgement in the 'Risk of bias' table. We have summarised the 'Risk of bias' judgments across different trials for each of the domains listed (see below).
Overall risk of bias
-
Low risk of bias: the outcome result was classified as at overall low risk of bias only if all of the bias domains described in the above paragraphs were classified as at low risk of bias.
-
High risk of bias: the outcome result was classified as at overall high risk of bias if any of the bias risk domains described above were classified as at unclear or high risk of bias.
Medidas del efecto del tratamiento
We calculated risk ratios (RR) with 95% confidence intervals (CI) for dichotomous outcomes. We planned to calculate mean differences (MD) with 95% CI for continuous outcomes. However, none of the included trials adequately reported quality of life (our only continuous outcome).
Cuestiones relativas a la unidad de análisis
We only included randomised clinical trials. For trials using cross‐over design, we planned to only include data from the first period (Elbourne 2002; Deeks 2017). For trials where multiple trial intervention groups were reported, we included only the relevant groups. If two comparisons were combined in the same meta‐analysis, we halved the control group to avoid double‐counting (Deeks 2017).
Manejo de los datos faltantes
We contacted trial authors to obtain missing data (i.e. for data extraction and for assessment of risk of bias, as specified above). However, not all trial authors responded (see Characteristics of included studies).
Dichotomous outcomes
If included trials used rigorous methodology (i.e. reporting on outcomes for all participants or multiple imputation to deal with missing data), we used these data in our primary analysis (Sterne 2009). We did not impute missing values for any outcomes in our primary analysis. In two of our sensitivity analyses ('best‐worst' and 'worst‐best'), we imputed data; see below.
Continuous outcomes
If included trials used rigorous methodology (i.e. reporting on outcomes for all participants or multiple imputation to deal with missing data), we planned to use these data in our primary analysis (Sterne 2009). We did not impute missing values for any outcomes in our primary analysis. If standard deviations (SDs) were not reported, we planned to calculate the SDs using data from the trial if possible. In two of our sensitivity analyses outcomes ('best‐worst' and 'worst‐best'), we planned to impute data, see below. However, none of the included trials adequately reported quality of life (our only continuous outcome).
Best‐worst and worst‐best case scenarios
To assess the potential impact of the missing data for dichotomous outcomes, we performed the following two sensitivity analyses when assessing each dichotomous outcome (all‐cause mortality, cardiovascular mortality, and myocardial infarction during follow‐up). We were not able to perform the following sensitivity analyses on 'MACE' as limited data were available and on serious adverse events as no data were available.
-
'Best‐worst' case scenario: we assumed that all participants lost to follow‐up in the experimental group survived and had no cardiovascular event; and all those participants with missing outcomes in the control group did not survive and had a cardiovascular event.
-
'Worst‐best' case scenario: we assumed that all participants lost to follow‐up in the experimental group did not survive and had a cardiovascular event; and all those participants with missing outcomes in the control group survived and had no cardiovascular event.
Results from both scenarios are presented in our review.
We planned that when analysing quality of life (our only continuous outcome), a ‘beneficial outcome’ would have been the group mean plus two SDs (we would then have used one SD in another sensitivity analysis) of the group mean, and a ‘harmful outcome’ would have been the group mean minus two SDs (we would then have used one SD in another sensitivity analysis) of the group mean (Jakobsen 2014).
To assess the potential impact of missing SDs for continuous outcomes, we performed the following sensitivity analysis.
-
Where SDs were missing and not possible to calculate, we planned to impute SDs from trials with similar populations and low risk of bias. If no such trials could be found, we planned to impute SDs from trials with a similar population. As the final option, we planned to impute SDs from all trials.
We planned to present results of this scenario in our review. However, none of the included trials adequately reported quality of life (our only continuous outcome).
Evaluación de la heterogeneidad
Initially, we investigated forest plots to visually assess any sign of heterogeneity. We secondly assessed the presence of statistical heterogeneity by Chi2 test (threshold P < 0.10) and measured the quantities of heterogeneity by the I2 statistic (Higgins 2002; Higgins 2003).
We followed the recommendations for threshold by the Cochrane Handbook for Systematic Reviews of Interventions (Deeks 2017):
-
0% to 40%: might not be important;
-
30% to 60%: may represent moderate heterogeneity;
-
50% to 90%: may represent substantial heterogeneity;
-
75% to 100%: may represent considerable heterogeneity.
We investigated possible heterogeneity through subgroup analyses. We had to decide whether or not a meta‐analysis might have to be avoided (Higgins 2011). Ultimately however, none of the planned meta‐analyses were avoided.
Evaluación de los sesgos de notificación
We used a funnel plot to assess reporting bias in the meta‐analyses including 10 or more trials. We visually inspected the funnel plots to assess the risk of bias. For dichotomous outcomes, we tested asymmetry with the Harbord test (Harbord 2006) if tau2 < 0.1 and with the Rücker test (Rücker 2008) if tau2 > 0.1. For continuous outcomes, we planned to use the regression asymmetry test (Egger 1997). However, none of the included trials adequately reported quality of life (our only continuous outcome).
Síntesis de los datos
Meta‐analysis
We undertook this systematic review according to the recommendations stated in the Cochrane Handbook for Systematic Reviews ofInterventions (Deeks 2017; Higgins 2011) for better validation of meta‐analytic results in systematic reviews. We used the statistical software Review Manager 5.3 (RevMan 2014) provided by Cochrane to meta‐analyse data.
Assessment of significance
We assessed our intervention effects with both random‐effects model meta‐analyses (DerSimonian 1986) and fixed‐effect model meta‐analyses (DeMets 1987). We used the more conservative result of the two as out primary result (Jakobsen 2014). The more conservative result was the result with the highest P value and the widest confidence interval (CI). If there was a substantial discrepancy between the results of the two models, we reported both and discussed the results (Amrhein 2019; Jakobsen 2014). We used three primary outcomes and due to the risk of multiplicity we calculated a P value less than P ≤ 0.025 and a 97.5% CI for the primary outcomes (Jakobsen 2014). We used four secondary outcomes and we, therefore, calculated a P value less than P ≤ 0.020 and a 98% CI for the secondary outcomes (Jakobsen 2014). We used an online calculator for the 97.5% and 98% CI (/www.omnicalculator.com/statistics/relative‐risk).
Análisis de subgrupos e investigación de la heterogeneidad
We performed the following subgroup analyses when assessing each outcome (all‐cause mortality, cardiovascular mortality, and myocardial infarction during follow‐up) at both our time points. We were not able to perform subgroup analyses on 'MACE' and angina as limited data were available and on serious adverse events according to ICH‐GCP and quality of life as no data were available.
A: Comparison of the effects between trials where the participants commenced beta‐blockers at different time points.
-
Acute phase ‐ suspected of myocardial infarction.
-
Subacute phase ‐ diagnosed with myocardial infarction.
B: Comparison of the effects between trials where the participants received intervention for reperfusion (coronary artery bypass graft, percutaneous coronary intervention or thrombolytics) to that in trials where the participants did not receive intervention for reperfusion.
C: Comparison of the effects between trials where the experimental group received different types of beta‐blockers.
D: Comparison of the effects between trials with different age of participants.
-
Age 0 to 18 years.
-
Age 19 to 75 years.
-
Age 76 years or above.
E: Comparision of the effects between trials with different clinical trial registration status.
-
Pre‐registration.
-
Post‐registration.
-
No registration.
F: Comparison of the effects between trials including different types of acute myocardial infarction.
-
NSTEMI.
-
STEMI.
-
Unstable angina pectoris.
-
Mixed.
Post hoc subgroup analysis
After the publication of the protocol, we added two subgroups.
G: Comparison of the effects between trials with different lengths of intervention period. This subgroup analysis was only performed at maximum follow‐up.
-
0 to 7 days length of intervention,
-
7 to 30 days length of intervention,
-
1 month or more length of intervention.
H: Comparison of the effects between trials with different funding.
-
Industry funded trials or unknown funding,
-
Non‐industry funded trials.
We used the formal test for subgroup differences in RevMan 5.3 (RevMan 2014).
Análisis de sensibilidad
To assess the potential impact of bias, we performed a sensitivity analysis in which we excluded trials at overall high risk of bias.
To assess the potential impact of the missing data for dichotomous outcomes, we performed best‐worst and worst‐best case scenarios (see Dealing with missing data).
'Summary of findings' tables
We used the GRADE system (Guyatt 2008; https://gdt.gradepro.org/app/handbook/handbook.html) to assess the quality of the body of evidence associated with each of the primary outcomes (all‐cause mortality, serious adverse events according to ICH‐GCP, and major adverse cardiovascular events); and secondary outcomes (quality of life, angina, cardiovascular mortality, and myocardial infarction during follow‐up) at both our time points constructing 'Summary of Findings' tables using the GRADEpro GDT software (ims.cochrane.org/revman/other‐resources/gradepro). The GRADE approach appraises the quality of a body of evidence based on the extent to which one can be confident that an estimate of effect or association reflects the item being assessed (Schünemann 2003; Guyatt 2008; Guyatt 2011). We assessed the GRADE levels of evidence as high, moderate, low, and very low and downgraded the evidence by one or two levels depending on the following quality measures: within‐study risk of bias, the directness of the evidence, heterogeneity of the data, precision of effect estimates, and risk of publication bias (Schünemann 2003; Guyatt 2008; Guyatt 2011). We used the methods and recommendations described in Chapter 8 (section 8.5) (Higgins 2017) and chapter 12 (Schünemann 2017) of the Cochrane Handbook for Systematic Reviews of Interventions (Higgins 2011) and the GRADE handbook (https://gdt.gradepro.org/app/handbook/handbook.html). We justified all decisions to downgrade the quality of trials using footnotes and we made comments to aid the reader's understanding of the review where necessary.
We included all trials in our analyses, and conducted a sensitivity analysis excluding trials at high risk of bias. If the results were similar, we based our 'Summary of findings' tables and conclusions on the overall analysis. If they differed, we based our 'Summary of findings' tables and conclusions on trials at low risk of bias.
We found one low risk of bias trial and reported its findings. For cardiovascular mortality, the results on all trials and on trials at low risk of bias differed significantly. For all other outcomes, the results did not differ significantly. Consequently, we based our 'Summary of findings' tables and conclusions on the results of trials at low risk of bias when assessing cardiovascular mortality and on the results of all trials when assessing all other outcomes (Summary of findings table 1 (less than three months follow‐up) and Summary of findings table 2 (maximum follow‐up beyond three months)).
Results
Description of studies
We assessed all trials according to the Cochrane Handbook for Systematic Reviews of Interventions (Higgins 2011a), and the protocol for this review (Nielsen 2016). Characteristics of each trial can be found in 'Characteristics of included studies' and 'Characteristics of excluded studies'. We identified three eligible ongoing studies (Characteristics of ongoing studies).
Results of the search
We identified a total of 18,450 potentially relevant references through searching CENTRAL (the Cochrane Library) (n = 2749), MEDLINE (n = 2412), Embase (n = 5798), Science Citation Index Expanded (n = 4862), BIOSIS (n = 2537), LILACS (n = 92), and four additional records were identified through other sources. The search strategies are presented in Appendix 1. After removing duplicates, 12,315 records were screened, and 11,842 references were excluded based on titles and abstracts. Four hundred and seventy‐three full‐text articles were assessed for eligibility and we excluded 50 reports reporting on 22 trials according to our inclusion criteria and exclusion criteria (only the main references are listed for these trials). Reasons for exclusion are listed in the table 'Characteristics of excluded studies'. We therefore included 423 publications reporting results from 66 trials. Accordingly, 63 trials could be included in our analyses while three trials were still on‐going. The study flow chart can be seen in Figure 1.
Included studies
We included 417 publications reporting on 63 trials comparing beta‐blockers versus placebo or no intervention in patients with suspected or diagnosed acute myocardial infarction (Figure 1). The trials were conducted between 1966 and 2018. The trials (often conducted in more than one country) were conducted at sites in 31 different countries: 15 from the UK; eight each from Australia and New Zealand; seven each from Ireland, Norway, and Sweden; five each from Belgium, Denmark, and Germany; four each from Italy and the USA; three each from Canada, Japan, Scotland, France, Russia, and Spain; two each from Finland, India, and the Netherlands; one each from Argentina, Austria, China, Hungary, Israel, Lithuania, Luxemborg, Malaysia,the Phillippines, Singapore, South Africa, and Switzerland.
We included 56 trials where the beta‐blockers were commenced in the acute phase of a myocardial infarction (48 trials enrolled patients within 24 hours of the onset of symptoms, three trials within 48 hours of the onset of symptoms, and five trials did not report the specific time point of enrolment). The remaining seven trials were included where the beta‐blockers were commenced in the subacute phase of a myocardial infarction (timing from the initial symptoms to randomisation varied from three to 21 days after a myocardial infarction).
Twenty‐four trials received the intervention for zero to seven days; 23 trials received the intervention for seven to 30 days; and the remaining 16 trials received the intervention for at least one month or more.
Seven trials specifically randomised participants suspected of or diagnosed with ST‐elevation myocardial infarction, 20 trials randomised a mixed group of participants (ST‐myocardial infarction, non‐ST myocardial infarction, unstable angina), and the remaining 36 trials did not report data on the different kinds of acute coronary syndrome included.
Two trials were multi‐arm trials with more than one comparison (Waagstein 1975; Wilcox 1980).
Four trials did not report data on any of our outcomes (Azancot 1982; Daga 2003; Korochkin 1991; Waagstein 1975). Forty‐nine out of the 63 included trials reported data on all‐cause mortality at less than three months follow‐up and 22 trials reported data at maximum follow‐up beyond three months. None of the trials specifically assessed serious adverse events according to ICH‐GCP. Only two trials at the time point 'less than three months' follow‐up (with no events reported) and four trials at maximum follow‐up specifically assessed major adverse cardiovascular events according to our definition (composite of cardiovascular mortality and non‐fatal myocardial infarction during follow‐up).
Thirty‐three trials were fully or partly funded by the industry, 20 trials did not report how they were funded, and 10 trials were funded by other sources than the industry.
For further details on included studies and baseline characteristics of included participants, see 'Characteristics of included studies'.
Participants
A total of 85,550 participants with suspected or diagnosed acute myocardial infarction were randomised in the 63 included trials. The number of participants in each trial ranged from 18 participants to 45,852 participants. The mean age was 57.4 years (mean range 45.9 to 70.0 years) (13 out of the 63 trials did not report the mean age among the participants). Fifteen trials included participants older than 75 years. The mean proportion of women was 25.5% (10 out of the 63 trials did not report the sex distribution). The mean proportion of participants with a myocardial infarction at the time of randomisation was 80.2%. The mean proportion of participants with a former myocardial infarction was 11.8%. The majority of the trials based their inclusion criteria only on signs and symptoms suggestive of myocardial infarction. Hence, the majority of the trials included participants with suspected myocardial infarction, while a few trials only included participants with diagnosed myocardial infarction.
Experimental intervention
The included trials used 16 different types of beta‐blockers as their experimental intervention: 12 trials used propranolol, eight trials used metoprolol, five trials used timolol, four trials used atenolol, four trials used carvedilol, three trials used practolol, two trials used alprenolol, two trials used pindolol, two trials used sotalol, one trial used acebutolol, one trial used betaxolol, one trial used H 87/07, one trial used labetalol, one trial used oxprenolol, one trial used xamoterol, one trial used esmolol, one trial used landiolol, and one trial used mixed beta‐blockers (esmolol + metoprolol).
Control intervention
We included 41 trials where the control group received placebo. In the remaining 22 trials, the control group either received only the co‐intervention (in 18 trials) or no intervention (in four trials).
Co‐interventions
We included 40 trials where the participants received a co‐intervention. In 27 trials, the co‐interventions consisted of digitalis, diuretics, nitrates, antiarrhythmics, anticoagulants, and aspirin; in six trials, the co‐intervention consisted of either percutaneous coronary intervention or thrombolysis; in two trials, the co‐intervention consisted of only heparin; in two trials, the co‐intervention consisted of only morphine; in two trials, the co‐intervention consisted of only lidocaine; and in one trial, the co‐intervention consisted of only captopril. In the remaining 23 trials,any use of co‐interventions was not mentioned. For further details, see 'Characteristics of included studies'.
Excluded studies
We excluded 22 studies after full‐text assessment based on our inclusion and exclusion criteria: eight studies were not randomised, six studies did not use a control or placebo group, three studies did not assess acute or subacute patients with myocardial infarction, two studies where either the control group or the experimental group did not meet our criteria, one study assessed participants with Ischaemic heart disease, one study was a cohort study, and one study was quasi‐randomised. For further details, see 'Characteristics of excluded studies'.
Risk of bias in included studies
Based on information that we collected from published reports and from study authors, we considered one trial to be at low risk of bias (COMMIT 2005) and the remaining 62 trials to be at high risk of bias. We judged many trials to be at unclear risk of bias in several domains and could not obtain additional information from study authors when we contacted them. We have provided additional information in the 'Risk of bias' summary (Figure 2), the 'Risk of bias' graph (Figure 3), and the Characteristics of included studies table.

'Risk of bias' summary: review authors' judgements about each risk of bias item for each included study.

'Risk of bias' graph: review authors' judgements about each risk of bias item presented as percentages across all included studies.
Allocation
The generation of the random sequence was at low risk of bias in eight trials. The remaining 55 trials were described as being randomised, but the method used for sequence generation was either not described or insufficiently described and were therefore judged to be of unclear risk of bias.
The method used to conceal allocation was at low risk of bias in 11 trials. The remaining 52 trials were described as being randomised, but the method used for allocation concealment was either not described or insufficiently described and were judged to be of unclear risk of bias.
Blinding
The blinding of participants and personnel was performed and adequately described in five trials and were judged to be at low risk of bias. Sixteen trials were either open‐label or single‐blinded and were judged to be at high risk of bias. In the remaining 42 trials, the method for blinding of participants and personnel was either not described or insufficiently described and were judged to be of unclear risk of bias.
The blinding of outcome assessors was performed and adequately described in 17 trials and were judged to be at low risk of bias. In one trial, the outcome assessors were not blinded and were judged to be at high risk of bias (RIMA 1999). In the remaining 45 trials, the method for blinding of outcome assessors were either not described or insufficiently described and were judged to be at unclear risk of bias.
Incomplete outcome data
Incomplete outcome data were addressed adequately in 25 trials and were judged to be at low risk of bias. Seven trials did not properly deal with incomplete outcome data and were judged to be at high risk of bias. In the remaining 31 trials, incomplete outcome data was either not described or insufficiently described and were judged to be at unclear risk of bias.
Selective reporting
Six trials reported the results of the outcomes stated in their respective protocols, or reported our primary outcomes, resulting in low risk of bias according to our predefined bias risk assessment. In the remaining 57 trials, no protocol could be obtained and the trial did not adequately report on our primary outcomes and were judged to be of unclear risk of bias.
Other potential sources of bias
Fifty‐seven trials had no other biases resulting in low risk of bias. The remaining six trials reported insufficient information to assess whether an important risk of bias exists or terminated the trial prematurely and were judged to be at 'unclear risk of bias'.
Effects of interventions
See: Summary of findings for the main comparison Beta‐blockers versus placebo or no intervention for suspected or diagnosed acute myocardial infarction at the time point less than three months follow‐up; Summary of findings 2 Beta‐blockers versus placebo or no intervention for suspected or diagnosed acute myocardial infarction at maximum follow‐up beyond three months
Primary outcomes
All‐cause mortality
Time point at less than three months follow‐up
In total 46/63 trials involving 80,452 participants and a median follow‐up of 21.8 days (range one hour to 90 days) reported all‐cause mortality at the time point 'less than three months follow‐up'. The specific assessment time points in each trial are presented in Table 1. No events occurred in either group in three trials (Hanada 2012; Norris 1978; Shirotani 2010). A total of 2686/40,347 (6.66%) participants receiving beta‐blockers died versus 2825/40,105 (7.04%) control participants. Fixed‐effect meta‐analysis showed no sufficient evidence of a difference (risk ratio (RR) 0.94, 97.5% confidence interval (CI) 0.90 to 1.00; I2 = 0%; 80,452 participants; 46 trials/47 comparisons; high‐quality evidence; Analysis 1.1). Hence, the absolute risk for mortality at less than three months follow‐up corresponds to 67 out of 1000 participants receiving beta‐blockers dying of any reason compared with 71 out of 1000 participants receiving placebo or no intervention. The optimal information size according to the GRADE Handbook using a proportion of 7.04% in the control group, a relative risk reduction (RRR) of 10%, an alpha of 2.5%, and a beta of 10% was estimated to be 63,246 participants and we included 80,452 participants (see summary of findings Table for the main comparison).
| Trial | Year | All‐cause mortality | Major adverse cardiovascular events | Cardiovascular mortality | Myocardial infarction during follow‐up |
| Andersen | 1979 | 28 days | NR | NR | NR |
| Åström | 1986 | NR | NR | NR | NR |
| Australian | 1984 | 28 days | NR | NR | NR |
| Australia & Swedish | 1983 | 28 days | NR | NR | NR |
| Balcon | 1967 | 28 days | NR | NR | NR |
| Barbar | 1967 | 28 days | NR | NR | NR |
| Barber | 1976 | 90 days | NR | NR | NR |
| BEAT‐AMI trial | 2016 | During hospitalisation (no mean time) | NR | During hospitalisation (no mean time) | During hospitalisation (no mean time) |
| Briant | 1970 | 3 days | NR | NR | NR |
| Campbell | 1984 | 7 days | NR | NR | NR |
| CAPRICORN | 2001 | 30 days | NR | NR | NR |
| Clausen | 1966 | 28 days | NR | NR | NR |
| COMMIT | 2005 | 28 days | NR | 28 days | 28 days |
| CPRG | 1980 | 60 days | NR | 56 days | 56 days |
| EARLY‐BAMI | 2016 | 30 days | NR | 30 days | 30 days |
| EMIT | 2002 | 42 days | NR | NR | 42 days |
| Evemy | 1977 | 30 days | NR | NR | NR |
| Gardtman | 1999 | 30 days | NR | NR | NR |
| Göteborg Metoprolol Trial | 1981 | 90 days | NR | 90 days | 90 days |
| Hanada | 2012 | During hospitalisation (no mean time) (no events) | During hospitalisation (no mean time) (no events) | During hospitalisation (no mean time) (no events) | During hospitalisation (no mean time) (no events) |
| Heber | 1986 | 5 days | NR | NR | NR |
| ICSG | 1984 | During hospitalisation (no mean time) | NR | During hospitalisation (no mean time) | During hospitalisation (no mean time) |
| ISIS‐1 | 1986 | 14 days | NR | 7 days | 7 days |
| Johannessen | 1987 | 10 days | NR | NR | NR |
| Ledwich | 1968 | 7 days | NR | NR | NR |
| McMurray | 1991 | NR | NR | NR | 10 days |
| METOCARD‐CNIC | 2013 | 7 days | NR | NR | 7 days |
| MIAMI | 1985 | 15 days | NR | 15 days | 15 days |
| MILIS | 1984 | 30 days | NR | NR | NR |
| Mueller | 1980 | 3 days | NR | 10 days | NR |
| Multicenter trial | 1966 | 30 days | NR | 30 days | NR |
| Nielsen | 1967 | 28 days | NR | NR | 28 days |
| Norris | 1968 | 21 days | NR | NR | NR |
| Norris | 1978 | 8.5 days (no events) | NR | 8.5 days (no events) | NR |
| Norris | 1980 | During hospitalisation (no mean time) | NR | During hospitalisation (no mean time) | NR |
| Norris | 1984 | 21 days | NR | 21 days | NR |
| Owensby | 1985 | 3 days | NR | NR | 3 days |
| Peter | 1978 | 3 days | NR | NR | 3 days |
| Raeder | 1967 | 21 days | NR | 21 days | NR |
| Ranganathan | 1988 | 2 days | NR | NR | NR |
| Rolli | 1980 | NR | NR | NR | NR |
| Salathia | 1985 | During hospitalisation (no mean time) | NR | 90 days | NR |
| Shirotani | 2010 | 30 days (no events) | 30 days (no events) | 30 days (no events) | 30 days (no events) |
| Tereschenko | 2005 | 30 days | NR | 30 days | NR |
| Thompson | 1979 | 5 days | NR | NR | NR |
| TIARA | 1987 | 30 days | NR | 30 days | 30 days |
| Tonkin | 1981 | 7 days | NR | NR | 7 days |
| Van De Werf | 1993 | 14 days | NR | 14 days | 14 days |
| Von Essen | 1982 | 14 days | NR | 14 days | NR |
| Wilcox | 1980 | 42 days | NR | NR | NR |
| Yang | 1984 | NR | NR | NR | NR |
| Yusuf | 1980 | 10 days | NR | NR | During hospitalisation (no mean time) |
Heterogeneity
The visual inspection of the forest plot and the tests for statistical heterogeneity (I2 = 0%; P = 0.94) indicated no signs of heterogeneity.
Risk of bias and sensitivity analyses
One trial was assessed at low risk of bias in all domains (COMMIT 2005). One trial was assessed at low risk of bias in all but one domain and since the blinding of participants and personnel was not considered of key importance for an objective outcome like all‐cause mortality, the study was assessed at overall low risk of bias (METOCARD‐CNIC 2013). Hence, the most weighted trials of the meta‐analysis were either at overall low risk of bias or had few domains of key importance that were not at low risk of bias and the risk of bias of the outcome result was assessed as low risk of bias.
The sensitivity analysis excluding trials at high risk of bias showed no evidence of a difference (RR 0.99, 95% CI 0.93 to 1.05; 46,122 participants; 2 trials; high‐quality evidence; Analysis 1.10). Since the sensitivity analysis and the overall meta‐analysis showed similar results, we based our summary of findings and conclusion on the overall meta‐analysis.
The sensitivity analysis on incomplete outcome data showed that incomplete outcome data bias alone had the potential to influence the results in the best‐worst sensitivity analysis, but not in the worst‐best sensitivity analysis: best‐worst fixed‐effect meta‐analysis (RR 0.93, 95% CI 0.89 to 0.98; I2 = 1%; 80,522 participants; 45 trials/46 comparisons; Analysis 1.11); worst‐best random‐effects meta‐analysis (RR 0.93, 95% CI 0.86 to 1.02; I2 = 9%; 80,522 participants; 45 trials/46 comparisons; Analysis 1.12). Data were imputed for 5 trials.
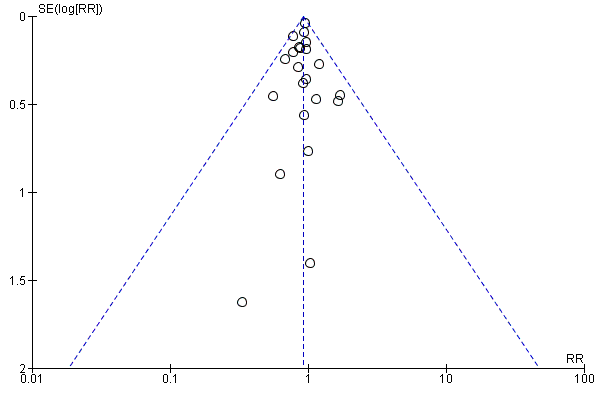
Visual inspection of the funnel plot showed no signs of asymmetry (Figure 4). Based on the visual inspection of the funnel plot, we assessed the risk of publication bias as low.

Funnel plot of comparison: 1 Beta‐blockers versus placebo or no intervention at 'less than 3 months' follow‐up, outcome: 1.1 All‐cause mortality.
Subgroup analyses
Tests for subgroup differences showed evidence of a difference when comparing trials according to the clinical trial registration status (I2 = 67.8%; P = 0.04; Analysis 1.8). The unregistered trials showed evidence of a beneficial effect of beta‐blockers versus placebo or no intervention on all‐cause mortality (RR 0.87, 95% CI 0.80 to 0.95; I2 = 0%; 32,541 participants; 40 trials; Analysis 1.8), while the pre‐registered trials (RR 0.99, 95% CI 0.93 to 1.05; I2 = 0%; 47,642 participants, 5 trials; Analysis 1.8) and the post‐registered trial (RR 0.50, 95% CI 0.16 to 1.63; 269 participants, 1 trial; Analysis 1.8) showed no evidence of a difference on all‐cause mortality.
All remaining tests for subgroup differences showed no evidence of a difference in subgroup analyses according to the acute and subacute phase of commencing beta‐blockers (Analysis 1.2); reperfusion compared to no reperfusion (Analysis 1.3); types of beta‐blockers (Analysis 1.4); intravenously compared to orally commenced beta‐blockers (Analysis 1.5); age either below compared to a mixture of above/below 75 years (40/45 trials reported the age of the participants) (Analysis 1.6); different types of acute myocardial infarction (NSTEMI, STEMI, UAP, or mixed) (24/45 trials reported data on the different types of acute myocardial infarction) (Analysis 1.7), and funding (Analysis 1.9).
Maximum follow‐up beyond three months
A total of 21/63 trials involving 25,210 participants and a median follow‐up of 17.7 months (range 6 to 60 months) reported all‐cause mortality at maximum follow‐up beyond three months. The specific assessment time points in each trial are presented in Table 2. No events occurred in either group in one trial (Hanada 2012). A total of 1742/12,708 (13.7%) participants receiving beta‐blockers died versus 1850/12,502 (14.8%) control participants. Fixed‐effect meta‐analysis showed evidence of a beneficial effect of beta‐blockers versus placebo or no intervention (RR 0.93, 97.5% CI 0.86 to 0.99; I2 = 0%; 25,210 participants; 21 trials/22 comparisons; moderate‐quality evidence, Analysis 2.1). Hence, the absolute risk for mortality at maximum follow‐up corresponds to 140 out of 1000 participants receiving beta‐blockers dying of any reason compared with 151 out of 1000 participants receiving placebo or no intervention and a number needed to treat for an additional beneficial outcome (NNTB) of 91 participants. The optimal information size according to the GRADE Handbook using a proportion of 14.8% in the control group, a RRR of 10%, an alpha of 2.5%, and a beta of 10% was estimated to be 27,387 participants and we included 25,210 participants.
| Trial | Year | All‐cause mortality | Major adverse cardiovascular events | Cardiovascular mortality | Myocardial infarction |
| Andersen | 1979 | 12 months | NR | NR | NR |
| Australia & Swedish | 1983 | 24 months | NR | 24 months | 24 months |
| Barber | 1976 | 24 months | NR | NR | NR |
| Basu | 1997 | 6 months | 6 months | 6 months | 6 months |
| BEAT‐AMI trial | 2016 | 6 months | NR | 6 months | 6 months |
| Briant | 1970 | 12 months | 12 months | 12 months | 12 months |
| CAPRICORN | 2001 | 15.6 months | NR | 15.6 months | 15.6 months |
| EARLY‐BAMI | 2016 | 1 month (not included) | NR | 12 months | 12 months |
| Evemy | 1977 | 7 months | NR | NR | NR |
| Göteborg Metoprolol Trial | 1981 | 60 months | NR | 3 months | 60 months |
| Hanada | 2012 | 6 months (no events) | 6 months | 6 months (no events) | 6 months |
| Heber | 1986 | 12 months | NR | NR | NR |
| ISIS‐1 | 1986 | 20 months | NR | 20 months | 0.23 months (not included) |
| Kaul | 1988 | 6 months | NR | 6 months | 6 months |
| METOCARD‐CNIC | 2013 | 24 months | NR | 24 months | 24 months |
| MILIS | 1984 | 36 months | NR | NR | NR |
| NPT | 1982 | 12 months | NR | 12 months | 12 months |
| RIMA | 1999 | 6 months | 6 months | 6 months | 6 months |
| Salathia | 1985 | 12 months | NR | 12 months | NR |
| TIARA | 1987 | 24 months | NR | 1 month (not included) | 1 month (not included) |
| Tonkin | 1981 | 0.23 months (not included) | NR | NR | 12 months |
| Wilcox | 1980 | 12 months | NR | 12 months | NR |
| Yusuf | 1980 | 24 months | NR | NR | During hospitalisation (no mean time) (not included) |
Heterogeneity
The visual inspection of the forest plot and the tests for statistical heterogeneity (I2 = 0%; P = 0.95) indicated no sign of heterogeneity.
Risk of bias and sensitivity analyses
One trial was assessed at low risk of bias in all but one domain (blinding) and since the blinding of participants and personnel was not considered of key importance for an objective outcome like all‐cause mortality, the study was assessed at low risk of bias (METOCARD‐CNIC 2013). All other trials were at high risk of bias mainly due to domains being at unclear risk of bias. Overall, the risk of bias of the outcome result was assessed as high risk of bias.
The sensitivity analysis excluding trials at high risk of bias showed, however, no evidence of a difference (RR 0.94, 95% CI 0.31 to 2.85; 270 participants; 1 trial; low‐quality evidence; Analysis 2.11). Nevertheless, only one small trial (METOCARD‐CNIC 2013) with a low event rate in the control group (4.56%) was included in this sensitivity analysis. Hence, the result from this sensitivity analysis might be assessed at low risk of bias, but has other very serious problems such as imprecision and indirectness. As a consequence of these serious limitations, we have not based our summary of findings and conclusions on this sensitivity analysis. Instead, we have based our summary of findings and conclusion on the overall meta‐analysis.
The sensitivity analysis on incomplete outcome data showed that incomplete outcome data bias alone had the potential to influence the results in the best‐worst sensitivity analysis, but not in the worst‐best sensitivity analysis: best‐worst random‐effects meta‐analysis (RR 0.89, 95% CI 0.81 to 0.97; I2 = 15%; 25,283 participants; 21 trials/22 comparisons; Analysis 2.12); worst‐best random‐effects meta‐analysis (RR 0.95, 95% CI 0.85 to 1.06; I2 = 33%; 25,283 participants; 21 trials/22 comparisons; Analysis 2.13). Data were imputed for five trials.
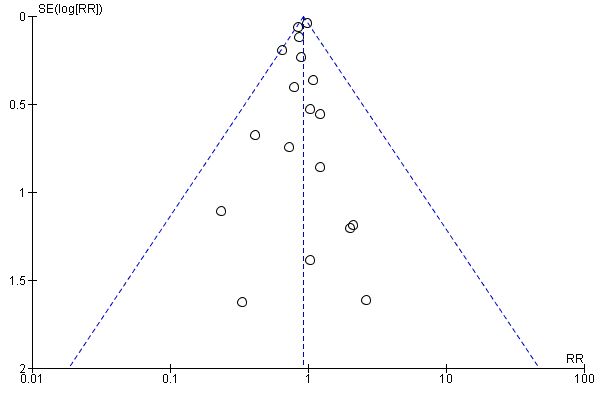
Visual inspection of the funnel plot showed no signs of asymmetry (Figure 5). Based on the visual inspection of the funnel plot, we assessed the risk of publication bias as low.
Funnel plot of comparison: 2 Beta‐blockers versus placebo or no intervention at maximum follow‐up beyond 3 months, outcome: 2.1 All‐cause mortality.
Subgroup analyses
Tests for subgroup differences showed no evidence of a difference in subgroup analyses according to the acute and subacute phase of commencing beta‐blockers (Analysis 2.2); reperfusion compared to no reperfusion (Analysis 2.3); types of beta‐blockers (Analysis 2.4); age either below compared to a mixture of above/below 75 years (Analysis 2.5); intravenously compared to orally commenced (Analysis 2.6); different types of acute myocardial infarction (NSTEMI, STEMI, UAP, or mixed) (7/20 trials reported data on the different types of acute myocardial infarction) (Analysis 2.8); clinical trial registration status (Analysis 2.7); length of the intervention period (Analysis 2.9); and funding (Analysis 2.10).
Serious adverse events
Time point less than three months follow‐up
None of the trials specifically assessed nor reported serious adverse events according to ICH‐GCP. Instead, the trials either reported composites of several specific serious adverse events or one specific serious adverse event.
We reported narratively the individual types of serious adverse events in each trial at the time point less than three months follow‐up in Table 3.
| Trial | Year | Type and number of serious adverse events (beta‐blocker group) | Type and number of serious adverse events (control group) |
| Andersen | 1979 |
|
|
| Åstrøm | 1986 | None |
|
| Australian trial | 1984 |
|
|
| Australia & Swedish | 1983 |
|
|
| Balcon | 1967 |
|
|
| Barbar | 1967 |
|
|
| Barber | 1976 |
|
|
| BEAT‐AMI | 2016 |
|
|
| Briant | 1970 |
|
|
| Campbell | 1984 |
|
|
| CAPRICORN | 2001 |
|
|
| Clausen | 1966 |
|
|
| COMMIT | 2005 |
|
|
| CPRG | 1980 |
|
|
| EARLY‐BAMI | 2016 |
|
|
| EMIT | 2002 |
|
|
| Evemy | 1977 |
|
|
| Gardtman | 1999 |
|
|
| Göteborg | 1981 |
|
|
| Heber | 1986 |
|
|
| ICSG | 1984 |
|
|
| ISIS‐1 | 1986 |
|
|
| Johannessen | 1987 |
|
|
| Ledwich | 1968 |
|
|
| Lloyd | 1988 |
|
|
| Mcmurray | 1991 |
|
|
| METOCARD‐CNIC | 2013 |
|
|
| Miami | 1985 |
|
|
| MILIS | 1984 |
|
|
| Mueller | 1980 |
|
|
| Multicenter trial | 1966 |
|
|
| Nielsen | 1967 |
|
|
| Norris | 1968 |
|
|
| Norris | 1978 |
|
|
| Norris | 1980 |
|
|
| Norris | 1984 |
|
|
| Owensby | 1985 |
|
|
| Peter | 1978 |
|
|
| Raeder | 1967 |
|
|
| Ramsdale | 1982 | None |
|
| Ranganathan | 1988 |
|
|
| Rolli | 1980 |
|
|
| Salathia | 1985 |
|
|
| Tereschenko | 2005 |
|
|
| Thompson | 1979 |
|
|
| TIARA | 1987 |
|
|
| Tonkin | 1981 |
|
|
| Van De Werf | 1993 |
|
|
| Von Essen | 1982 |
|
|
| Wilcox (atenolol) | 1980 |
|
|
| Wilcox (propranolol) | 1980 |
|
|
| Yang | 1984 |
|
|
| Yusuf | 1980 |
|
|
Maximum follow‐up beyond three months
None of the trials specifically assessed nor reported serious adverse events according to ICH‐GCP. Instead, the trials either reported composites of several specific serious adverse events or one specific serious adverse event.
We reported narratively the individual types of serious adverse events in each trial at maximum follow‐up beyond three months in Table 4.
| Trial | Year | Type and number of serious adverse events (beta‐blocker group) | Type and number of serious adverse events (control group) |
| Andersen | 1979 |
|
|
| Åstrøm | 1986 | None |
|
| Australian trial | 1984 |
|
|
| Australia & Swedish | 1983 |
|
|
| Balcon | 1967 |
|
|
| Barbar | 1967 |
|
|
| Barber | 1976 |
|
|
| Basu | 1997 |
|
|
| BEAT‐AMI | 2016 |
|
|
| Briant | 1970 |
|
|
| Campbell | 1984 |
|
|
| CAPRICORN | 2001 |
|
|
| Clausen | 1966 |
|
|
| COMMIT | 2005 |
|
|
| CPRG | 1980 |
|
|
| EARLY‐BAMI | 2016 |
|
|
| EMIT | 2002 |
|
|
| Evemy | 1977 |
|
|
| Gardtman | 1999 |
|
|
| Göteborg | 1981 |
|
|
| Hanada | 2012 | None |
|
| Heber | 1986 |
|
|
| ICSG | 1984 |
|
|
| ISIS‐1 | 1986 |
|
|
| Johannessen | 1987 |
|
|
| Kaul | 1988 |
|
|
| Ledwich | 1968 |
|
|
| Lloyd | 1988 |
|
|
| Mcmurray | 1991 |
|
|
| METOCARD‐CNIC | 2013 |
|
|
| Miami | 1985 |
|
|
| MILIS | 1984 |
|
|
| Mueller | 1980 |
|
|
| Multicenter trial | 1966 |
|
|
| Nielsen | 1967 |
|
|
| Norris | 1968 |
|
|
| Norris | 1978 |
|
|
| Norris | 1980 |
|
|
| Norris | 1984 |
|
|
| NPT | 1982 |
|
|
| Owensby | 1985 |
|
|
| Peter | 1978 |
|
|
| Raeder | 1967 |
|
|
| Ramsdale | 1982 | None |
|
| Ranganathan | 1988 |
|
|
| RIMA | 1999 |
|
|
| Rolli | 1980 |
|
|
| Salathia | 1985 |
|
|
| Tereschenko | 2005 |
|
|
| Thompson | 1979 |
|
|
| TIARA | 1987 |
|
|
| Tonkin | 1981 |
|
|
| Van De Werf | 1993 |
|
|
| Von Essen | 1982 |
|
|
| Wilcox (atenolol) | 1980 |
|
|
| Wilcox (propranolol) | 1980 |
|
|
| Yang | 1984 |
|
|
| Yusuf | 1980 |
|
|
Major adverse cardiovascular events
Time point less than three months follow‐up
Only two trials specifically assessed major adverse cardiovascular events (defined as a composite of cardiovascular mortality and non‐fatal myocardial infarction during follow‐up) at the time point less than three months follow‐up. Nevertheless, no major adverse cardiovascular events occurred in either trial (Analysis 3.1). The specific assessment time points in each trial are presented in Table 1.
The rest of the trials reported either cardiovascular mortality or myocardial infarction during follow‐up.
Maximum follow‐up beyond three months
In total 4/62 trials involving 475 participants with a median follow‐up of 7.5 months (range 6 to 12 months) reported major adverse cardiovascular events (defined as a composite of cardiovascular mortality and non‐fatal myocardial infarction during follow‐up) at maximum follow‐up beyond three months. The specific assessment time points in each trial are presented in Table 2. A total of 16/237 (6.74%) participants receiving beta‐blockers had a major adverse cardiovascular event versus 20/238 (8.40%) control participants. Random‐effects meta‐analysis showed no evidence of a difference of beta‐blockers versus placebo or no intervention on major adverse cardiovascular events (RR 0.81, 97.5% CI 0.40 to 1.66; I2 = 0%; 475 participants; 4 trials; very low‐quality evidence; Analysis 4.1). Hence, the absolute risk for a major adverse cardiovascular event at maximum follow‐up corresponds to 68 out of 1000 participants receiving beta‐blockers having a major adverse cardiovascular event compared with 84 out of 1000 participants receiving placebo or no intervention. The optimal information size according to the GRADE Handbook using a proportion of 8.40% in the control group, a RRR of 10%, an alpha of 2.5%, and a beta of 10% was estimated to be 51,666 participants and we only included 475 participants.
No further analyses were conducted due to sparse data.
Secondary outcomes
Cardiovascular mortality
Time point less than three months follow‐up
In total 18/62 trials involving 72,622 participants and a median follow‐up of 27.0 days (range 7 to 90 days) reported cardiovascular mortality at the time point less than three months follow‐up. The specific assessment time points in each trial are presented in Table 1. No events occurred in either group in three trials (Hanada 2012; Norris 1978; Shirotani 2010). A total of 1640/36,364 (4.51%) participants receiving beta‐blockers died because of a cardiovascular event versus 1765/36,258 (4.87%) control participants. Fixed‐effect meta‐analysis showed no sufficient evidence of a difference when assessing beta‐blockers versus placebo or no intervention on cardiovascular mortality (RR 0.93, 98% CI 0.86 to 1.00; I2 = 0%; 72,622 participants; 18 trials; low‐quality evidence; Analysis 5.1). Hence, the absolute risk for a cardiovascular death at less than three months follow‐up corresponds to 45 out of 1000 participants receiving beta‐blockers dying of a cardiovascular event compared with 49 out of 1000 participants receiving placebo or no intervention and a NNTB of 278 participants.The optimal information size according to the GRADE Handbook using a proportion of 4.85% in the control group, a RRR of 10%, an alpha of 2.0%, and a beta of 10% was estimated to be 95,569 participants and we included 72,622 participants.
Heterogeneity
The visual inspection of the forest plot and the tests for statistical heterogeneity (I2 = 0 %; P = 0.72) indicated no signs of heterogeneity.
Risk of bias and sensitivity analyses
One trial was assessed at low risk of bias (COMMIT 2005) contributing to 55.4% of the weight to the analysis. All other trials were at high risk of bias mainly due to domains being at unclear risk of bias. Overall, the risk of bias of the outcome result was assessed as high risk of bias.
The sensitivity analysis excluding trials at high risk of bias showed, however, no evidence of a difference (RR 0.99, 95% CI 0.91 to 1.08; 45,852 participants; 1 trial; moderate‐quality evidence; Analysis 5.10). Hence, the absolute risk for a cardiovascular death at less than three months follow‐up corresponds to 42 out of 1000 participants receiving beta‐blockers dying of a cardiovascular event compared with 43 out of 1000 participants receiving placebo or no intervention. The optimal information size according to the GRADE Handbook using a proportion of 4.28% in the control group, a RRR of 10%, an alpha of 2.0%, and a beta of 10% was estimated to be 109,817 participants and we included 45,852 participants (see summary of findings Table for the main comparison). Since the sensitivity analysis and the overall meta‐analysis showed different results, we based our summary of findings and conclusions on the sensitivity meta‐analysis only including trials at low risk of bias.
The sensitivity analyses on incomplete outcome data showed that incomplete outcome data bias alone had the potential to influence the results in the best‐worst sensitivity analysis, but not in the worst‐best sensitivity analysis: best‐worst random‐effects meta‐analysis (RR 0.84, 95% CI 0.72 to 0.97; I2 = 38%; 72,681 participants; 18 trials; Analysis 5.11); worst‐best random‐effects meta‐analysis (RR 0.93, 95% CI 0.79 to 1.10; I2 = 46%; 72,681 participants; 18 trials; Analysis 5.12). Data were imputed for three trials.
Visual inspection of the funnel plots showed no signs of asymmetry (Figure 6). Based on the visual inspection of the funnel plot, we assessed the risk of publication bias as low.
Funnel plot of comparison: 5 Beta‐blockers versus placebo or no intervention at 'less than 3 months' follow‐up beyond 3 months, outcome: 5.1 Cardiovascular mortality.
Subgroup analyses
Tests for subgroup differences showed evidence of a difference when comparing trials according to the clinical trial registration status (I2 = 81.8%; P = 0.02; Analysis 5.8). The unregistered trials showed evidence of a beneficial effect of beta‐blockers versus placebo or no intervention on cardiovascular mortality (RR 0.84, 95% CI 0.76 to 0.93; I2 = 0%; 26,044 participants; 15 trials; Analysis 5.8), while the pre‐registered trials showed no evidence of a difference on cardiovascular mortality (RR 0.99, 95% CI 0.91 to 1.08; I2 = 0%; 46,578 participants; 3 trials; Analysis 5.8).
All remaining tests for subgroup differences showed no evidence of a difference in subgroup analyses according to the acute and subacute phase of commencing beta‐blockers (Analysis 5.2); reperfusion compared to no reperfusion (Analysis 5.3); types of beta‐blockers (Analysis 5.4); age either below compared to a mixture of above/below 75 years (Analysis 5.5); intravenous compared to oral administration of beta‐blockers (Analysis 5.6); different types of acute myocardial infarction (NSTEMI, STEMI, UAP or mixed) (9/18 trials reported data on the different types of acute myocardial infarction) (Analysis 5.7); and funding (Analysis 5.9).
Maximum follow‐up beyond three months
In total, 14/63 trials involving 22,457 participants and a median follow‐up of 12.9 months (range 6 to 24 months) reported cardiovascular mortality at maximum follow‐up beyond three months. The specific assessment time points in each trial are presented in Table 2. No events occurred in either group in one trial (Hanada 2012). A total of 1269/11.323 (11.2%) participants receiving beta‐blockers died because of a cardiovascular event versus 1379/11,134 (12.4%) control participants. Fixed‐effect meta‐analysis showed evidence of a beneficial effect of beta‐blockers versus placebo or no intervention on cardiovascular mortality (RR 0.90, 98% CI 0.83 to 0.98; I2 = 0%; 22,457 participants; 14 trials/15 comparisons; moderate‐quality evidence; Analysis 6.1). Hence, the absolute risk for a cardiovascular death at maximum follow‐up corresponds to 116 out of 1000 participants receiving beta‐blockers dying of a cardiovascular event compared with 128 out of 1000 participants receiving placebo or no intervention and a NNTB of 83 participants (see summary of findings Table 2). The optimal information size according to the GRADE Handbook using a proportion of 12.4% in the control group, a RRR of 10%, an alpha of 2.0%, and a beta of 10% was estimated to be 35,192 participants and we included 22,457 participants.
Heterogeneity
The visual inspection of the forest plot and the tests for statistical heterogeneity (I2 = 0 %; P = 0.96) indicated no signs of heterogeneity.
Risk of bias and sensitivity analyses
All trials were at high risk of bias mainly due to domains being at unclear risk of bias. Overall, the risk of bias of the outcome result was assessed as high risk of bias.
The sensitivity analyses on incomplete outcome data showed that incomplete outcome data bias alone had the potential to influence the results in the best‐worst sensitivity analysis, but not in the worst‐best sensitivity analysis: best‐worst random‐effects meta‐analysis (RR 0.67, 95% CI 0.53 to 0.86; I2 = 65%; 22,587 participants; 14 trials/15 comparisons; Analysis 6.11); worst‐best random‐effects meta‐analysis (RR 1.06, 95% CI 0.83 to 1.36; I2 = 67%; 22,587 participants; 14 trials/15 comparisons; Analysis 6.12). Data were imputed for five trials.
Visual inspection of the funnel plots showed no signs of asymmetry (Figure 7). Based on the visual inspection of the funnel plot, we assessed the risk of publication bias as low.
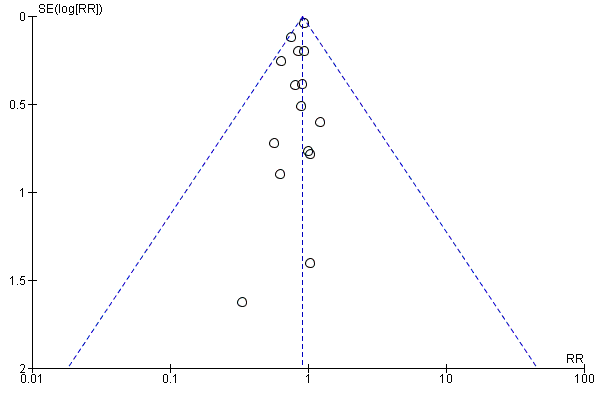
Funnel plot of comparison: 6 Beta‐blockers versus placebo or no intervention at maximum follow‐up beyond 3 months, outcome: 6.1 Cardiovascular mortality.
Subgroup analyses
All remaining tests for subgroup differences showed no evidence of a difference in subgroup analyses according to the acute and subacute phase of commencing beta‐blockers (Analysis 6.2); reperfusion compared to no reperfusion (Analysis 6.3); types of beta‐blockers (Analysis 6.4); age either below compared to a mixture of above/below 75 years (Analysis 6.5); intravenous compared to oral administration of beta‐blockers (Analysis 6.6); different types of acute myocardial infarction (NSTEMI, STEMI, UAP or mixed) (6/14 trials reported data on the different types of acute myocardial infarction) (Analysis 6.7); clinical trial registration status (Analysis 6.8); different lengths of the intervention period (Analysis 6.9); and funding (Analysis 6.10).
Myocardial infarction during follow‐up
Time point less than three months follow up
In total, 18/62 trials involving 67,562 participants and a median follow‐up of 20.6 days (range 3 to 90 days) reported myocardial infarction during follow‐up at the time point less than three months follow‐up. The specific assessment time points in each trial are presented in Table 1. No events occurred in either group in two trials (Hanada 2012; Shirotani 2010). A total of 764/33,788 (2.26%) participants receiving beta‐blockers had a reinfarction versus 936/33,744 (2.77%) control participants. Fixed‐effect meta‐analysis showed evidence of a beneficial effect of beta‐blockers versus placebo or no intervention on myocardial infarction during follow‐up (RR 0.82, 98% CI 0.73 to 0.91; I2 = 0%; 67,562 participants; 18 trials; moderate‐quality evidence; Analysis 7.1). Hence, the absolute risk for a reinfarction at less than three months follow‐up corresponds to 23 out of 1000 participants receiving beta‐blockers having a reinfarction compared with 28 out of 1000 participants receiving placebo or no intervention and a NNTB of 196 participants (see summary of findings Table for the main comparison). The optimal information size according to the GRADE Handbook using a proportion of 2.77% in the control group, a RRR of 10%, an alpha of 2.0%, and a beta of 10% was estimated to be 170,073 participants and we only included 67,562 participants.
Heterogeneity
The visual inspection of the forest plot and the tests for statistical heterogeneity (I2 = 0 %; P = 0.66) indicated no signs of heterogeneity.
Risk of bias and sensitivity analyses
One trial was assessed at overall low risk of bias (COMMIT 2005). All other trials were at high risk of bias mainly due to domains being at unclear risk of bias. Overall, the risk of bias of the outcome result was assessed as high risk of bias.
The sensitivity analysis excluding trials at high risk of bias showed evidence of a beneficial effect of beta‐blockers versus placebo or no intervention on myocardial infarction during follow‐up at the time point less than three months follow‐up (RR 0.82, 95% CI 0.72 to 0.92; 45,852 participants; 1 trial; high‐quality evidence; Analysis 7.10). Since the sensitivity analysis and the overall meta‐analysis showed similar results, we based our'Ssummary of findings' tables and conclusion on the overall meta‐analysis.
The sensitivity analyses on incomplete outcome data showed that incomplete outcome data bias alone had the potential to influence the results in the best‐worst sensitivity analysis, but not in the worst‐best sensitivity analysis: (best‐worst random‐effects meta‐analysis: RR 0.75, 95% CI 0.61 to 0.92; I2 = 34%; 67,620 participants; 18 trials; Analysis 7.11); worst‐best random‐effects meta‐analysis: RR 0.85, 95% CI 0.67 to 1.07; I2 = 45%; 67,620 participants; 18 trials; Analysis 7.12). Data were imputed for two trials.
Visual inspection of the funnel plots showed no signs of asymmetry (Figure 8). Based on the visual inspection of the funnel plot, we assessed the risk of publication bias as low.

Funnel plot of comparison: 7 Beta‐blockers versus placebo or no intervention at 'less than 3 months' follow‐up, outcome: 7.1 Myocardial infarction.
Subgroup analyses
Tests for subgroup differences showed no evidence of a difference in subgroup analyses according to the acute and subacute phase of commencing beta‐blockers (Analysis 7.2); reperfusion compared to no reperfusion (Analysis 7.3); types of beta‐blockers (Analysis 7.4); age either below compared to a mixture of above/below 75 years (Analysis 7.5); intravenous compared to oral administration of beta‐blockers (Analysis 7.6); different types of acute myocardial infarction (NSTEMI, STEMI, UAP, or mixed) (11/18 trials reported data on the different types of acute myocardial infarction) (Analysis 7.7); clinical trial registration status (Analysis 7.8); and funding (Analysis 7.9).
Maximum follow‐up beyond three months
In total, 14/63 trials involving 6825 participants and a median follow‐up of 15.5 months (range 6 to 60 months) reported myocardial infarction during follow‐up at maximum follow‐up beyond three months. The specific assessment time points in each trial are presented in Table 2. A total of 282/3401 (8.3%) participants receiving beta‐blockers had a reinfarction versus 314/3424 (9.2%) control participants. Random‐effects meta‐analysis showed no evidence of a difference on myocardial infarction during follow‐up at maximum follow‐up beyond three months (RR 0.89, 98% CI 0.75 to 1.08; I2 = 10%; 6825 participants; 14 trials; low‐quality evidence; Analysis 8.1). (see summary of findings Table for the main comparison). Hence, the absolute risk for a reinfarction at maximum follow‐up corresponds to 89 out of 1000 participants receiving beta‐blockers having a reinfarction compared with 102 out of 1000 participants receiving placebo or no intervention. The optimal information size according to the GRADE Handbook using a proportion of 9.2% in the control group, a RRR of 10%, an alpha of 2.0%, and a beta of 10% was estimated to be 49,069 participants and we only included 6825 participants.
Heterogeneity
The visual inspection of the forest plot and the tests for statistical heterogeneity (I2 = 10%; P = 0.35) indicated no signs of heterogeneity.
Risk of bias and sensitivity analyses
All trials were at high risk of bias mainly due to domains being at unclear risk of bias. Overall, the risk of bias of the outcome result was assessed as high risk of bias.
The sensitivity analyses on incomplete outcome data showed that incomplete outcome data bias alone had the potential to influence the results in the best‐worst sensitivity analysis, but not in the worst‐best sensitivity analysis: best‐worst random‐effects meta‐analysis (RR 0.56, 95% CI 0.37 to 0.85; I2 = 71%; 6951 participants; 14 trials; Analysis 8.11); worst‐best random‐effects meta‐analysis: RR 1.10, 95% CI 0.95 to 1.26; I2 = 74%; 6951 participants; 14 trials; Analysis 8.12). Data were imputed for four trials.
Visual inspection of the funnel plots showed no signs of asymmetry (Figure 9). Based on the visual inspection of the funnel plot, we assessed the risk of publication bias as low.
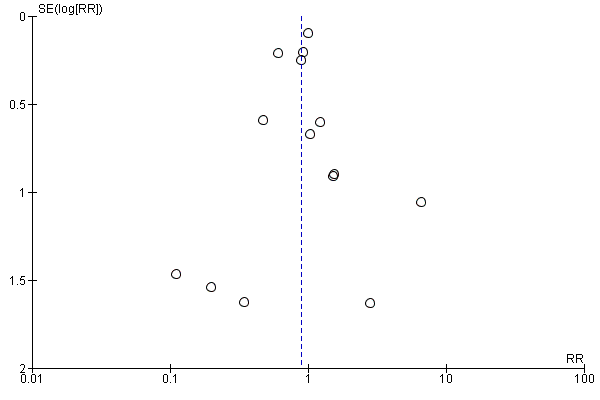
Funnel plot of comparison: 8 Beta‐blockers versus placebo or no intervention at maximum follow‐up beyond 3 months, outcome: 8.1 Myocardial infarction.
Subgroup analyses
Tests for subgroup differences showed no evidence of a difference in subgroup analyses according to the acute and subacute phase of commencing beta‐blockers (Analysis 8.2); reperfusion compared to no reperfusion (Analysis 8.3); types of beta‐blockers (Analysis 8.4); age either below compared to a mixture of above/below 75 years (12/13 trials reported the age of the participants) (Analysis 8.5); intravenous compared to oral administration of beta‐blockers (Analysis 8.6); different types of acute myocardial infarction (NSTEMI, STEMI, UAP, or mixed) (6/13 trials reported data on the different types of acute myocardial infarction) (Analysis 8.7); clinical trial registration status (Analysis 8.8); different lengths of the intervention periods (Analysis 8.9); and funding (Analysis 8.10).
Quality of life
None of the included trials reported any data on quality of life on a continuous or any other scale at any time point.
Angina
Time point less than three months follow‐up
Four trials reported angina with a median follow‐up of 29 days (range 12 days to 42 days) at the time point less than three months follow‐up (EMIT 2002; Norris 1980; Tereshchenko 2005; and Yang 1986). Different definitions and ways of measuring angina were used: Norris 1980 and Yang 1986 reported angina on exercise testing, Tereshchenko 2005 reported post‐infarction angina without defining it, and EMIT 2002 reported angina on an ordinal scale using anginal status defined by the NYHA functional capacity classification.
In total, 3/62 trials involving 98 participants reported on the proportion of participants with angina (Norris 1980; Tereshchenko 2005; Yang 1986). A total of 8/53 (15.1%) participants receiving beta‐blockers had angina compared with 10/45 (22.2%) control participants. Random‐effects meta‐analysis showed no evidence of a difference of beta‐blockers versus placebo or no intervention on angina (RR 0.70, 98% CI 0.25 to 1.84; I2 = 0%; 98 participants; 3 trials; very low‐quality evidence; Analysis 9.1). The optimal information size according to the GRADE Handbook using a proportion of 22.2% in the control group, a RRR of 10%, an alpha of 2.0%, and a beta of 10% was estimated to be 17,583 participants and we only included 98 participants.
No further analyses were conducted due to sparse data.
Narrative description of the remaining trials reporting angina
EMIT 2002 reported angina on an ordinal scale using anginal status defined by the NYHA functional capacity classification. This classification reported four categories of angina: class I, II, III, and IV. In the experimental group, 34 patients were classified with class I, four with class II, two with class III, and two with class IV. In the control group, 34 patients were classified with class I, two with class II, two with class III, and one with class IV.
Maximum follow‐up beyond three months
Two trials reported angina with a total of 844 participants reported on the proportion of participants with angina at maximum follow‐up beyond three months (average months) (Kaul 1988; CAPITAL ‐ RCT 2018). Kaul 1988 reported post‐infarction angina without further definition, and CAPITAL ‐ RCT 2018 reported vasospastic angina. A total of 6/419 (1.43%) participants receiving beta‐blockers had angina compared with 10/425 (2.35%%) control participants. Random‐effects meta‐analysis showed no evidence of a difference of beta‐blockers versus placebo or no intervention on angina (RR 0.64, 98% CI 0.18 to 2.00; I2 = 24%; 844 participants; 2 trials; very low‐quality evidence; Analysis 10.1). The optimal information size according to the GRADE Handbook using a proportion of 2.35% in the control group, a RRR of 10%, an alpha of 2.0%, and a beta of 10% was estimated to be 215,068 participants and we only included 844 participants.
No further analyses were conducted due to sparse data.
'Summary of findings' tables
Our main results (i.e. primary and secondary outcomes) are summarised in the summary of findings Table for the main comparison (time point less than three months follow‐up) and summary of findings Table 2 (maximum follow‐up beyond three months).
Discusión
Calidad de la evidencia
Falta de direccionalidad de la evidencia
Sesgo de publicación
Financiamiento
GRADE
Sesgos potenciales en el proceso de revisión
Fortalezas
Esta revisión presenta varias fortalezas.
Limitaciones
Incomplete outcome data
Eventos adversos graves

Study flow diagram.

'Risk of bias' summary: review authors' judgements about each risk of bias item for each included study.

'Risk of bias' graph: review authors' judgements about each risk of bias item presented as percentages across all included studies.

Funnel plot of comparison: 1 Beta‐blockers versus placebo or no intervention at 'less than 3 months' follow‐up, outcome: 1.1 All‐cause mortality.

Funnel plot of comparison: 2 Beta‐blockers versus placebo or no intervention at maximum follow‐up beyond 3 months, outcome: 2.1 All‐cause mortality.

Funnel plot of comparison: 5 Beta‐blockers versus placebo or no intervention at 'less than 3 months' follow‐up beyond 3 months, outcome: 5.1 Cardiovascular mortality.

Funnel plot of comparison: 6 Beta‐blockers versus placebo or no intervention at maximum follow‐up beyond 3 months, outcome: 6.1 Cardiovascular mortality.

Funnel plot of comparison: 7 Beta‐blockers versus placebo or no intervention at 'less than 3 months' follow‐up, outcome: 7.1 Myocardial infarction.

Funnel plot of comparison: 8 Beta‐blockers versus placebo or no intervention at maximum follow‐up beyond 3 months, outcome: 8.1 Myocardial infarction.

Comparison 1 Beta‐blockers versus placebo or no intervention less than 3 months follow‐up, Outcome 1 All‐cause mortality.

Comparison 1 Beta‐blockers versus placebo or no intervention less than 3 months follow‐up, Outcome 2 All‐cause mortality ‐ Acute/subacute phase.
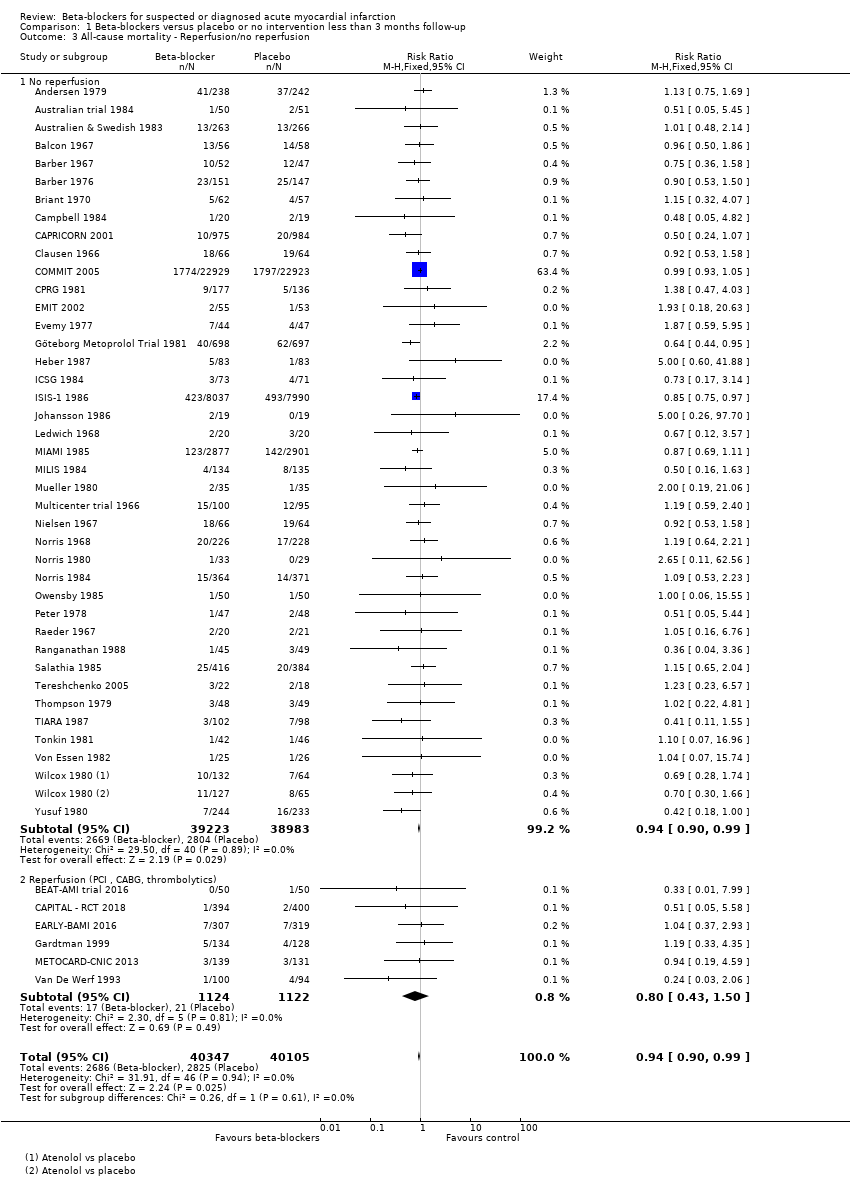
Comparison 1 Beta‐blockers versus placebo or no intervention less than 3 months follow‐up, Outcome 3 All‐cause mortality ‐ Reperfusion/no reperfusion.

Comparison 1 Beta‐blockers versus placebo or no intervention less than 3 months follow‐up, Outcome 4 All‐cause mortality ‐ Type of beta‐blocker.

Comparison 1 Beta‐blockers versus placebo or no intervention less than 3 months follow‐up, Outcome 5 All‐cause mortality ‐ Intravenously/orally commenced.

Comparison 1 Beta‐blockers versus placebo or no intervention less than 3 months follow‐up, Outcome 6 All‐cause mortality ‐ Above/below 75 years of age.

Comparison 1 Beta‐blockers versus placebo or no intervention less than 3 months follow‐up, Outcome 7 All‐cause mortality ‐ NSTEMI/STEMI/UAP.
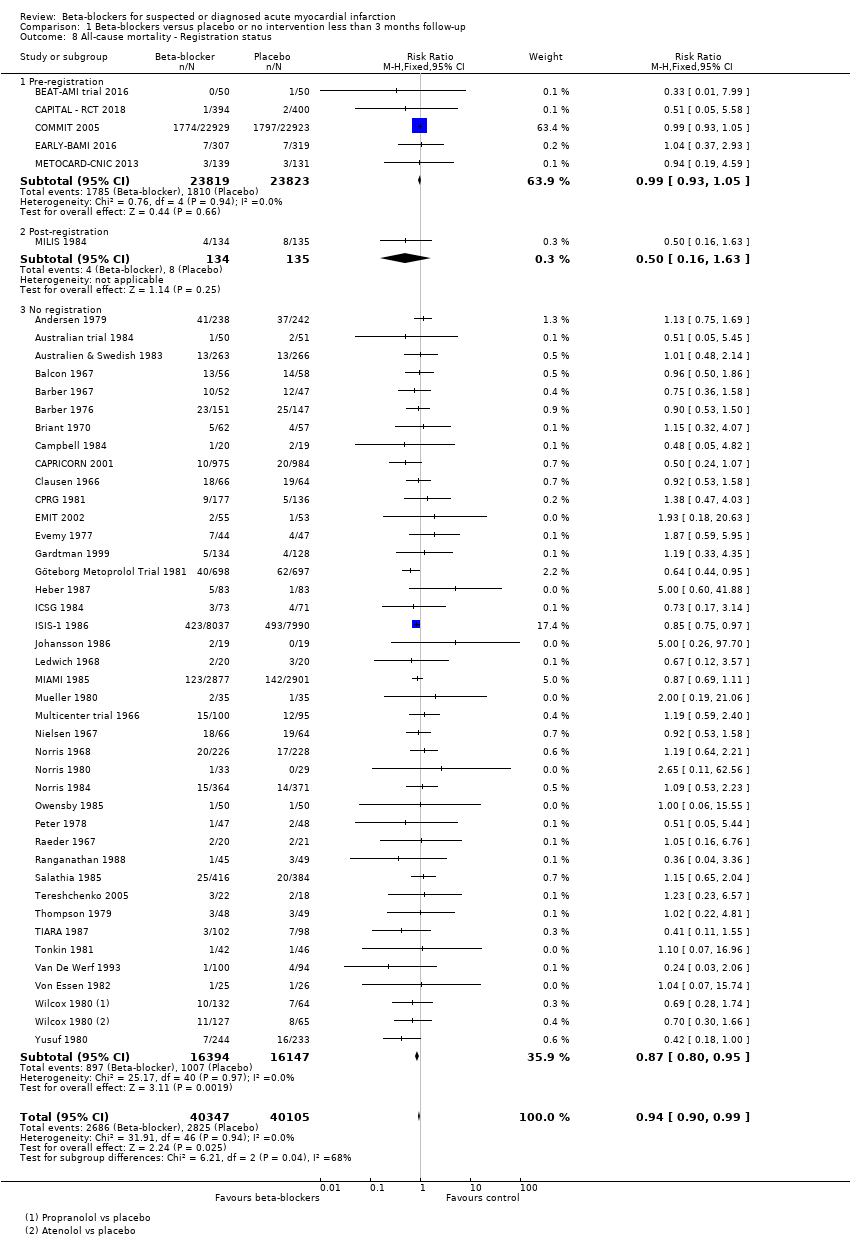
Comparison 1 Beta‐blockers versus placebo or no intervention less than 3 months follow‐up, Outcome 8 All‐cause mortality ‐ Registration status.
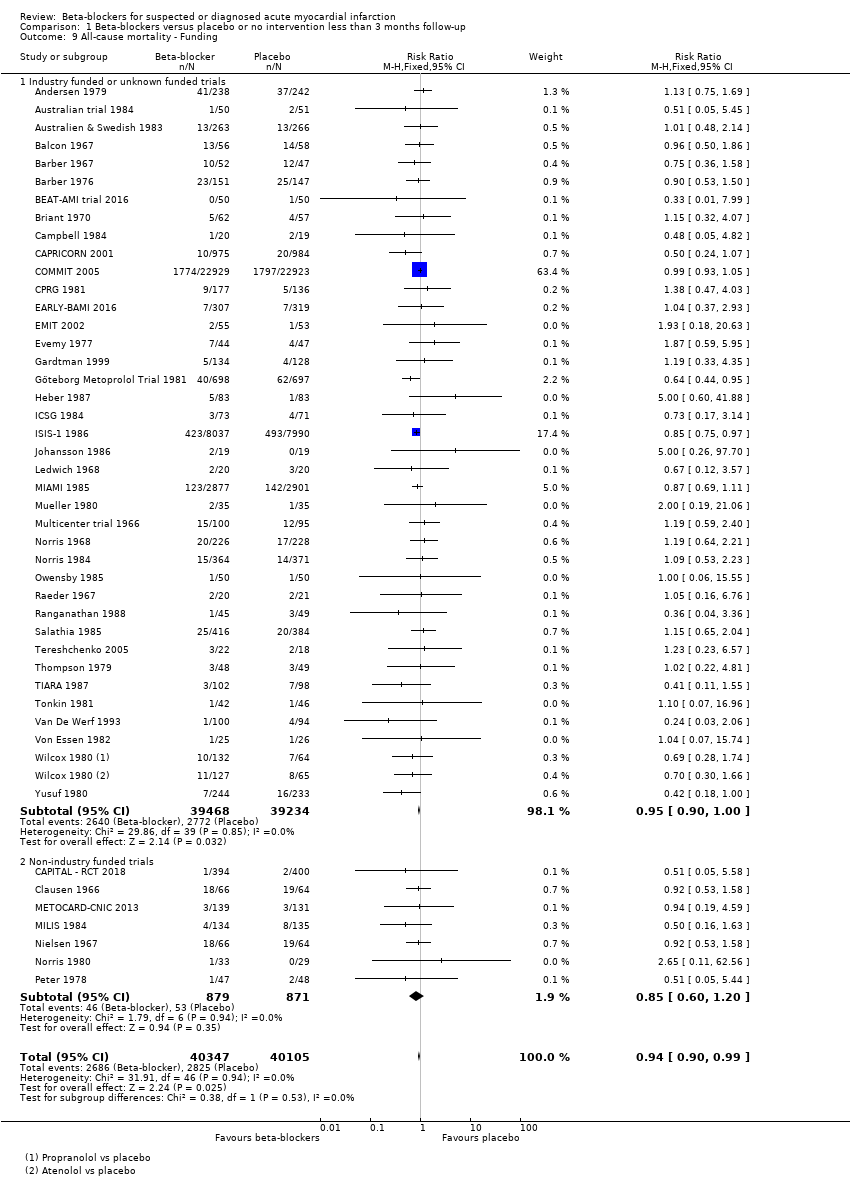
Comparison 1 Beta‐blockers versus placebo or no intervention less than 3 months follow‐up, Outcome 9 All‐cause mortality ‐ Funding.

Comparison 1 Beta‐blockers versus placebo or no intervention less than 3 months follow‐up, Outcome 10 All‐cause mortality ‐ Trials at low risk of bias.

Comparison 1 Beta‐blockers versus placebo or no intervention less than 3 months follow‐up, Outcome 11 All‐cause mortality ‐ 'Best‐worst case scenario'.

Comparison 1 Beta‐blockers versus placebo or no intervention less than 3 months follow‐up, Outcome 12 All‐cause mortality ‐ 'Worst‐best case scenario'.

Comparison 2 Beta‐blockers versus placebo or no intervention at maximum follow‐up beyond 3 months, Outcome 1 All‐cause mortality.

Comparison 2 Beta‐blockers versus placebo or no intervention at maximum follow‐up beyond 3 months, Outcome 2 All‐cause mortality ‐ Acute/subacute phase.

Comparison 2 Beta‐blockers versus placebo or no intervention at maximum follow‐up beyond 3 months, Outcome 3 All‐cause mortality ‐ Reperfusion/no reperfusion.

Comparison 2 Beta‐blockers versus placebo or no intervention at maximum follow‐up beyond 3 months, Outcome 4 All‐cause mortality ‐ Type of beta‐blocker.

Comparison 2 Beta‐blockers versus placebo or no intervention at maximum follow‐up beyond 3 months, Outcome 5 All‐cause mortality ‐ Above/below 75 years of age.

Comparison 2 Beta‐blockers versus placebo or no intervention at maximum follow‐up beyond 3 months, Outcome 6 All‐cause mortality ‐ Intravenously/orally commenced.

Comparison 2 Beta‐blockers versus placebo or no intervention at maximum follow‐up beyond 3 months, Outcome 7 All‐cause mortality ‐ Registration status.

Comparison 2 Beta‐blockers versus placebo or no intervention at maximum follow‐up beyond 3 months, Outcome 8 All‐cause mortality ‐ NSTEMI/STEMI/UAP.

Comparison 2 Beta‐blockers versus placebo or no intervention at maximum follow‐up beyond 3 months, Outcome 9 All‐cause mortality ‐ Length of intervention period.

Comparison 2 Beta‐blockers versus placebo or no intervention at maximum follow‐up beyond 3 months, Outcome 10 All‐cause mortality ‐ Funding.

Comparison 2 Beta‐blockers versus placebo or no intervention at maximum follow‐up beyond 3 months, Outcome 11 All‐cause mortality ‐ Trials at low risk of bias.

Comparison 2 Beta‐blockers versus placebo or no intervention at maximum follow‐up beyond 3 months, Outcome 12 All‐cause mortality ‐ 'Best‐worst case scenario'.

Comparison 2 Beta‐blockers versus placebo or no intervention at maximum follow‐up beyond 3 months, Outcome 13 All‐cause mortality ‐ 'Worst‐best case scenario'.

Comparison 3 Beta‐blockers versus placebo or no intervention less than 3 months follow‐up, Outcome 1 MACE (Composite of cardiovascular death and non‐fatal myocardial infarction).

Comparison 4 Beta‐blockers versus placebo or no intervention at maximum follow‐up beyond 3 months, Outcome 1 MACE (Composite of cardiovascular death and non‐fatal myocardial infarction).
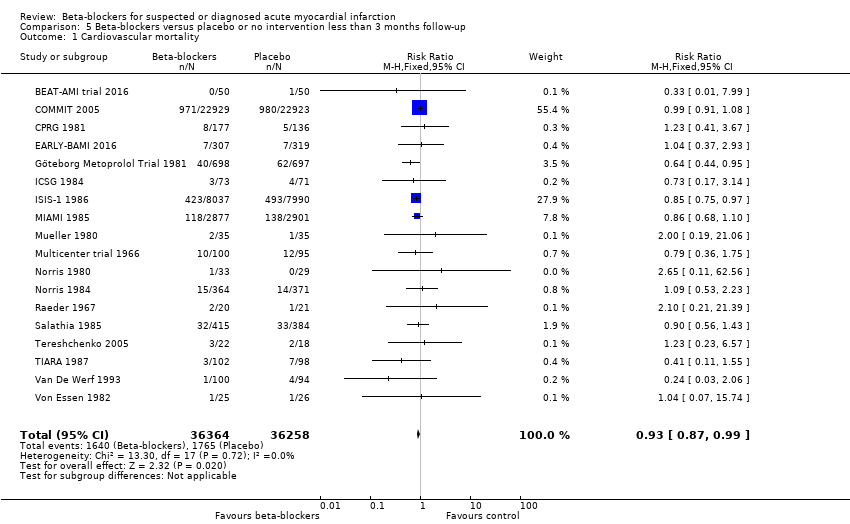
Comparison 5 Beta‐blockers versus placebo or no intervention less than 3 months follow‐up, Outcome 1 Cardiovascular mortality.

Comparison 5 Beta‐blockers versus placebo or no intervention less than 3 months follow‐up, Outcome 2 Cardiovascular mortality ‐ Acute/subacute phase.

Comparison 5 Beta‐blockers versus placebo or no intervention less than 3 months follow‐up, Outcome 3 Cardiovascular mortality ‐ Reperfusion/no reperfusion.

Comparison 5 Beta‐blockers versus placebo or no intervention less than 3 months follow‐up, Outcome 4 Cardiovascular mortality ‐ Type of beta‐blocker.

Comparison 5 Beta‐blockers versus placebo or no intervention less than 3 months follow‐up, Outcome 5 Cardiovascular mortality ‐ Above/below 75 years of age.
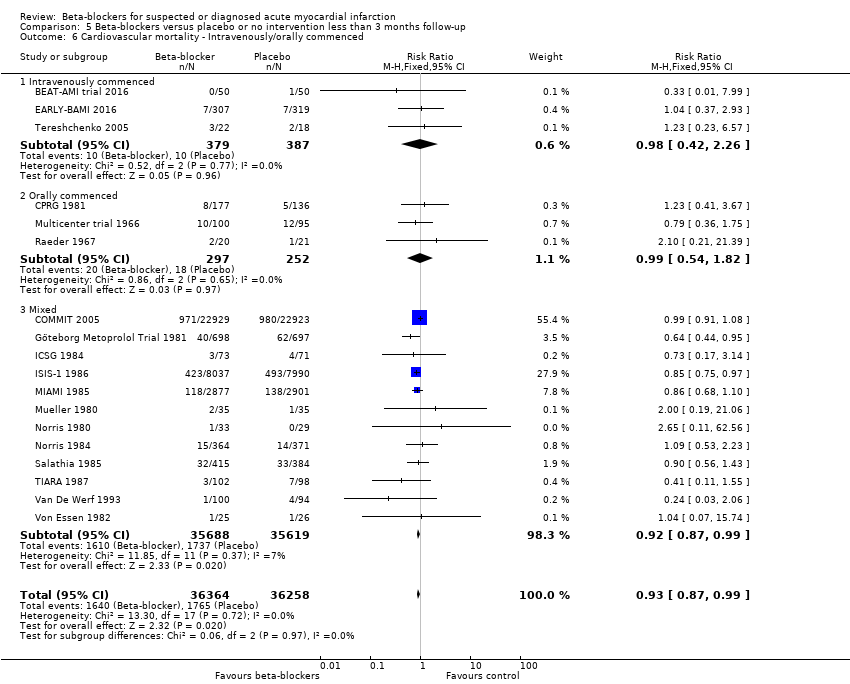
Comparison 5 Beta‐blockers versus placebo or no intervention less than 3 months follow‐up, Outcome 6 Cardiovascular mortality ‐ Intravenously/orally commenced.

Comparison 5 Beta‐blockers versus placebo or no intervention less than 3 months follow‐up, Outcome 7 Cardiovascular mortality ‐ NSTEMI/STEMI/UAP.

Comparison 5 Beta‐blockers versus placebo or no intervention less than 3 months follow‐up, Outcome 8 Cardiovascular mortality ‐ Registration status.

Comparison 5 Beta‐blockers versus placebo or no intervention less than 3 months follow‐up, Outcome 9 Cardiovascular mortality ‐ Funding.

Comparison 5 Beta‐blockers versus placebo or no intervention less than 3 months follow‐up, Outcome 10 Cardiovascular mortality ‐ Trials with low risk of bias.

Comparison 5 Beta‐blockers versus placebo or no intervention less than 3 months follow‐up, Outcome 11 Cardiovascular mortality ‐ 'Best‐worst case scenario'.

Comparison 5 Beta‐blockers versus placebo or no intervention less than 3 months follow‐up, Outcome 12 Cardiovascular mortality ‐ 'Worst‐best case scenario'.

Comparison 6 Beta‐blockers versus placebo or no intervention at maximum follow‐up beyond 3 months, Outcome 1 Cardiovascular mortality.

Comparison 6 Beta‐blockers versus placebo or no intervention at maximum follow‐up beyond 3 months, Outcome 2 Cardiovascular mortality ‐ Acute/subacute phase.

Comparison 6 Beta‐blockers versus placebo or no intervention at maximum follow‐up beyond 3 months, Outcome 3 Cardiovascular mortality ‐ Reperfusion/no reperfusion.
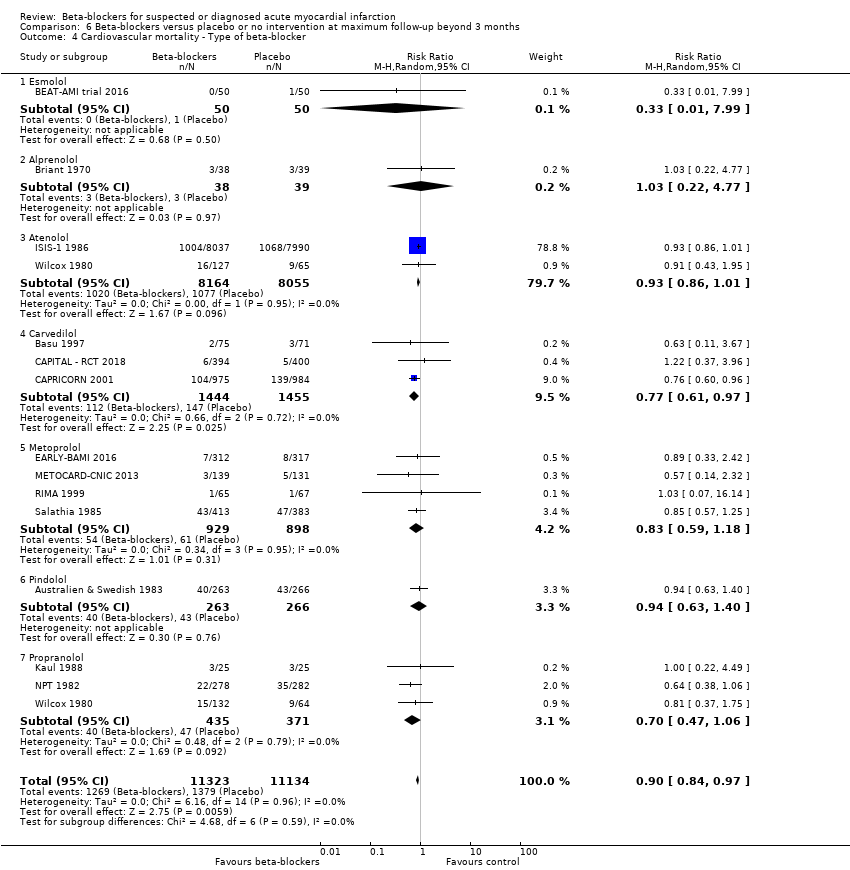
Comparison 6 Beta‐blockers versus placebo or no intervention at maximum follow‐up beyond 3 months, Outcome 4 Cardiovascular mortality ‐ Type of beta‐blocker.

Comparison 6 Beta‐blockers versus placebo or no intervention at maximum follow‐up beyond 3 months, Outcome 5 Cardiovascular mortality ‐ Above/below 75 years of age.

Comparison 6 Beta‐blockers versus placebo or no intervention at maximum follow‐up beyond 3 months, Outcome 6 Cardiovascular mortality ‐ Intravenously/orally commenced.

Comparison 6 Beta‐blockers versus placebo or no intervention at maximum follow‐up beyond 3 months, Outcome 7 Cardiovascular mortality ‐ NSTEMI/STEMI/UAP.
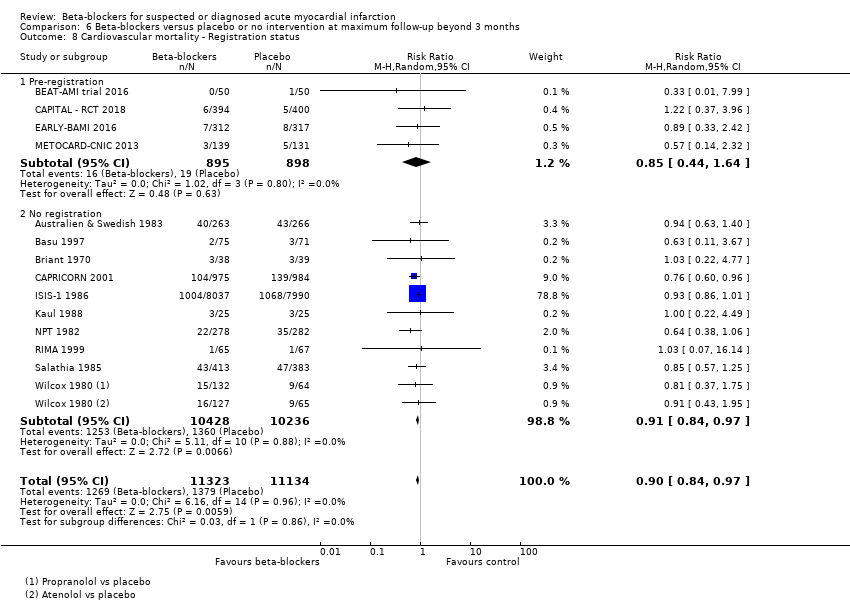
Comparison 6 Beta‐blockers versus placebo or no intervention at maximum follow‐up beyond 3 months, Outcome 8 Cardiovascular mortality ‐ Registration status.

Comparison 6 Beta‐blockers versus placebo or no intervention at maximum follow‐up beyond 3 months, Outcome 9 Cardiovascular mortality ‐ Length of intervention period.

Comparison 6 Beta‐blockers versus placebo or no intervention at maximum follow‐up beyond 3 months, Outcome 10 Cardiovascular mortality ‐ Funding.

Comparison 6 Beta‐blockers versus placebo or no intervention at maximum follow‐up beyond 3 months, Outcome 11 Cardiovascular mortality ‐ 'Best‐worst case scenario'.

Comparison 6 Beta‐blockers versus placebo or no intervention at maximum follow‐up beyond 3 months, Outcome 12 Cardiovascular mortality ‐ 'Worst‐best case scenario'.

Comparison 7 Beta‐blockers versus placebo or no intervention less than 3 months follow‐up, Outcome 1 Myocardial infarction.

Comparison 7 Beta‐blockers versus placebo or no intervention less than 3 months follow‐up, Outcome 2 Myocardial infarction ‐ Acute/subacute phase.

Comparison 7 Beta‐blockers versus placebo or no intervention less than 3 months follow‐up, Outcome 3 Myocardial infarction ‐ Reperfusion/no reperfusion.
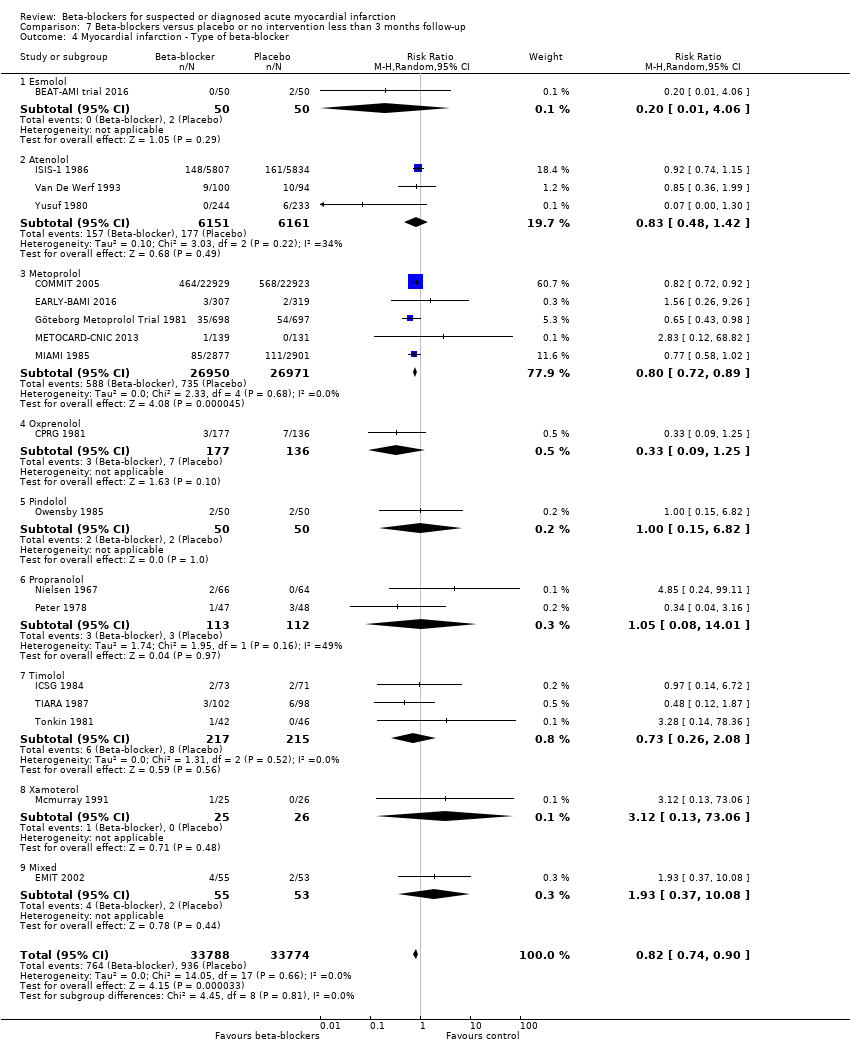
Comparison 7 Beta‐blockers versus placebo or no intervention less than 3 months follow‐up, Outcome 4 Myocardial infarction ‐ Type of beta‐blocker.
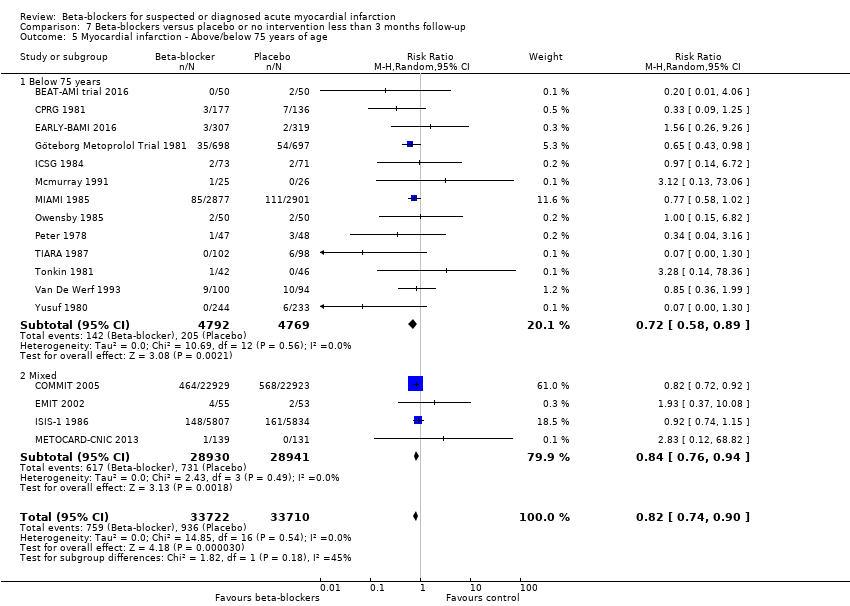
Comparison 7 Beta‐blockers versus placebo or no intervention less than 3 months follow‐up, Outcome 5 Myocardial infarction ‐ Above/below 75 years of age.
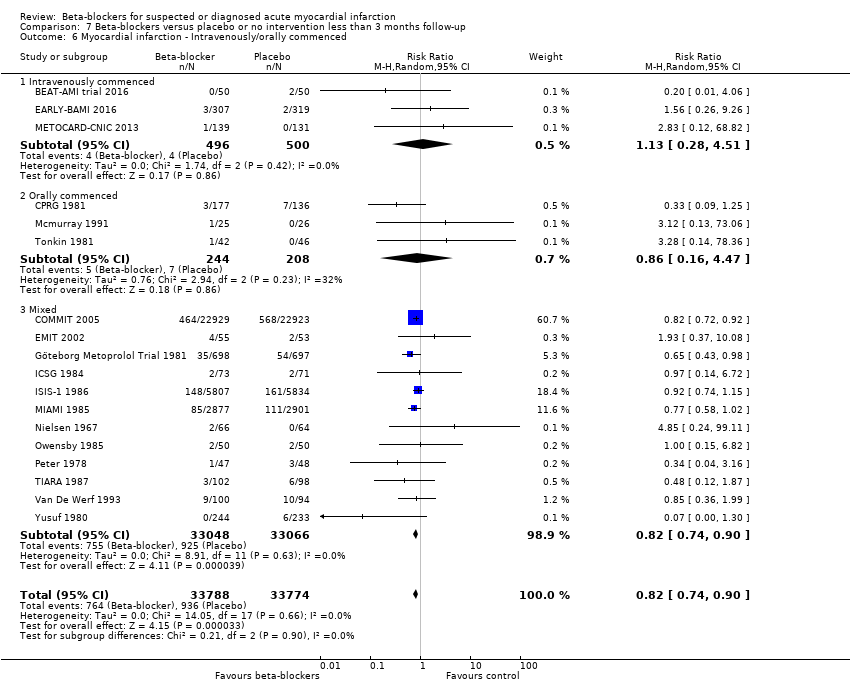
Comparison 7 Beta‐blockers versus placebo or no intervention less than 3 months follow‐up, Outcome 6 Myocardial infarction ‐ Intravenously/orally commenced.

Comparison 7 Beta‐blockers versus placebo or no intervention less than 3 months follow‐up, Outcome 7 Myocardial infarction ‐ NSTEMI/STEMI/UAP.

Comparison 7 Beta‐blockers versus placebo or no intervention less than 3 months follow‐up, Outcome 8 Myocardial infarction ‐ Registration status.

Comparison 7 Beta‐blockers versus placebo or no intervention less than 3 months follow‐up, Outcome 9 Myocardial infarction ‐ Funding.

Comparison 7 Beta‐blockers versus placebo or no intervention less than 3 months follow‐up, Outcome 10 Myocardial infarction ‐ Trials with low risk of bias.

Comparison 7 Beta‐blockers versus placebo or no intervention less than 3 months follow‐up, Outcome 11 Myocardial infarction ‐ 'Best‐worst case scenario'.

Comparison 7 Beta‐blockers versus placebo or no intervention less than 3 months follow‐up, Outcome 12 Myocardial infarction ‐ 'Worst‐best case scenario'.

Comparison 8 Beta‐blockers versus placebo or no intervention at maximum follow‐up beyond 3 months, Outcome 1 Myocardial infarction.

Comparison 8 Beta‐blockers versus placebo or no intervention at maximum follow‐up beyond 3 months, Outcome 2 Myocardial infarction ‐ Acute/subacute phase.
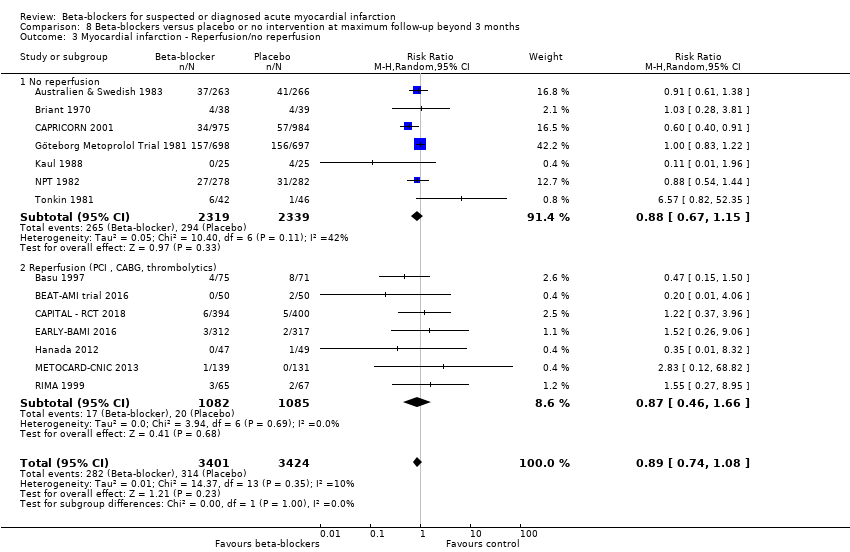
Comparison 8 Beta‐blockers versus placebo or no intervention at maximum follow‐up beyond 3 months, Outcome 3 Myocardial infarction ‐ Reperfusion/no reperfusion.

Comparison 8 Beta‐blockers versus placebo or no intervention at maximum follow‐up beyond 3 months, Outcome 4 Myocardial infarction ‐ Type of beta‐blocker.

Comparison 8 Beta‐blockers versus placebo or no intervention at maximum follow‐up beyond 3 months, Outcome 5 Myocardial infarction ‐ Above/below 75 years of age.

Comparison 8 Beta‐blockers versus placebo or no intervention at maximum follow‐up beyond 3 months, Outcome 6 Myocardial infarction ‐ Intravenously/orally commenced.

Comparison 8 Beta‐blockers versus placebo or no intervention at maximum follow‐up beyond 3 months, Outcome 7 Myocardial infarction ‐ NSTEMI/STEMI/UAP.

Comparison 8 Beta‐blockers versus placebo or no intervention at maximum follow‐up beyond 3 months, Outcome 8 Myocardial infarction ‐ Registration status.

Comparison 8 Beta‐blockers versus placebo or no intervention at maximum follow‐up beyond 3 months, Outcome 9 Myocardial infarction ‐ Length of intervention period.

Comparison 8 Beta‐blockers versus placebo or no intervention at maximum follow‐up beyond 3 months, Outcome 10 Myocardial infarction ‐ Funding.

Comparison 8 Beta‐blockers versus placebo or no intervention at maximum follow‐up beyond 3 months, Outcome 11 Myocardial infarction ‐ 'Best‐worst case scenario'.

Comparison 8 Beta‐blockers versus placebo or no intervention at maximum follow‐up beyond 3 months, Outcome 12 Myocardial infarction ‐ 'Worst‐best case scenario'.

Comparison 9 Beta‐blockers versus placebo or no intervention less than 3 months follow‐up, Outcome 1 Angina on a dichotomous scale.

Comparison 10 Beta‐blockers versus placebo or no intervention at maximum follow‐up beyond 3 months, Outcome 1 Angina on a dichotomous scale.
| Beta‐blockers versus placebo or no intervention for patients with suspected or diagnosed myocardial infarction at the time point less than three months follow‐up | ||||||
| Patient or population: patients with suspected or diagnosed myocardial infarction Settings: any setting Intervention: any beta‐blocker Comparison: placebo or no intervention | ||||||
| Outcomes | Illustrative comparative risks* | Relative effect (adjusted CI) | No of Participants | Quality of the evidence | Comments | |
| Assumed risk with placebo or no intervention | Corresponding risk with beta‐blockers | |||||
| All‐cause mortality at 'less than 3 months' follow‐up. Follow‐up: mean 21.8 days (range 1 hour to 90 days). | 70 per 1000 | 67 per 1000 | RR 0.94, 97.5% CI (0.90 to 1.0) | 80,452 (46 RCTs with 47 comparisons) | ⊕⊕⊕⊕1 | Since the sensitivity analysis excluding trials at high risk of bias and the overall meta‐analysis showed similar results, we based our summary of findings and conclusion on the overall meta‐analysis. No events occurred in either group in three trials (Hanada 2012; Norris 1978; Shirotani 2010). |
| Serious adverse events at 'less than 3 months' follow‐up. No data was reported in the included trials. | ‐ | ‐ | ‐ | ‐ | ‐ | None of the trials specifically assessed nor reported serious adverse events according to ICH‐GCP. |
| MACE (major adverse cardiovascular event) at 'less than 3 months' follow‐up. No data were reported in the included trials. | ‐ | ‐ | ‐ | ‐ | ‐ | Only two trials specifically assessed major adverse cardiovascular events (defined as a composite of cardiovascular mortality and myocardial infarction during follow‐up). However, no major adverse cardiovascular events occurred in either trial. |
| Quality of life at 'less than 3 months' follow‐up. No data were reported in the included trials. | ‐ | ‐ | ‐ | ‐ | ‐ | No data reported. |
| Angina at 'less than 3 months' follow‐up. Follow‐up: mean 21 days (range 12 to 30 days). | 222 per 1000 | 155 per 1000 (69 to 351) | RR 0.70, 98% CI (0.25 to 1.84) | 98 (3 RCTs) | ⊕⊝⊝⊝2,3 VERY LOW | |
| Cardiovascular mortality at 'less than 3 months' follow‐up. Follow‐up: mean 28 days. | 43 per 1000 | 42 per 1000 | RR 0.99, 95% CI (0.91 to 1.08) | 45,852 (1 RCT) | ⊕⊕⊕⊝4 | Since the sensitivity analysis excluding trials at high risk of bias differed from the overall meta‐analysis, we based our summary of findings and conclusion on the sensitivity analysis. |
| Myocardial infarction at 'less than 3 months' follow‐up. Follow‐up: mean 23.3 days (range 3 to 90 days). | 28 per 1000 | 23 per 1000 | RR 0.82, 98% CI (0.74 to 0.90) | 67,562 (18 RCTs) | ⊕⊕⊕⊝5 | Since the sensitivity analysis excluding trials at high risk of bias and the overall meta‐analysis showed similar results, we based our summary of findings and conclusion on the overall meta‐analysis. No events occurred in either group in two trials (Hanada 2012; Shirotani 2010). |
| *The basis for the assumed risk (e.g. the median control group risk across studies) is provided in footnotes. The corresponding risk (and its adjusted confidence interval) is based on the assumed risk in the comparison group and the relative effect of the intervention (and its adjusted CI). | ||||||
| GRADE Working Group grades of evidence | ||||||
| 1 When assessing the risk of bias, the trial contributing most weight (COMMIT 2005, 63.4%) was assessed as at low risk of bias in all domains. The trial contributing the second highest weight (ISIS‐1 1986, 17.4%) was assessed as low risk of bias in random sequence generation, allocation concealment, and incomplete outcome data;'unclear for blinding of outcome assessors and selective reporting and at high risk for blinding of participants and personnel. Since a lack of blinding is less important for the assessment of all‐cause mortality, the overall limitations were not serious and the evidence is not downgraded for risk of bias. 2 Downgraded by one level due to serious risk of bias. All the included trials were at high risk of bias due to either unclear or high risk in several bias domains. 3 Downgraded by two levels due to very serious risk of imprecision based on the optimal information size not being reached, the very small sample size, and the absolute and relative 98% CI being very wide showing both appreciable benefit and harm. 4 Downgraded by one level due to serious risk of imprecision based on the wide absolute and relative 98% where the upper CI does not exclude the possibility of no difference between the groups. When assessing the risk of bias, the evidence was not downgraded since the result was based on the sensitivity analysis consisting of trials at low risk of bias (COMMIT 2005). 5 Downgraded by one level due to serious risk of bias. The overall limitations and specially in regard to blinding of outcome assessors were serious (around 50% of the trials were assessed at unclear risk of bias in blinding of outcome assessors). | ||||||
| Beta‐blockers compared with placebo or no intervention for patients with suspected or diagnosed myocardial infarction | ||||||
| Patient or population: patients with suspected or diagnosed myocardial infarction Settings: any setting Intervention: beta‐blockers Comparison: placebo or no intervention | ||||||
| Outcomes | Illustrative comparative risks* | Relative effect | No of Participants | Quality of the evidence | Comments | |
| Assumed risk with placebo or no intervention | Corresponding risk with beta‐blockers | |||||
| All‐cause mortality at maximum follow‐up beyond 3 months. Follow‐up: mean 16.4 months (range 6 to 60 months). | 148 per 1000 | 138 per 1000 | RR 0.93, 97.5% CI (0.86 to 0.99) | 25,210 (21 RCTs with 22 comparisons) | ⊕⊕⊕⊝3 | No events occurred in either group in one trial (Hanada 2012). |
| Serious adverse events at maximum follow‐up beyond 3 months. No data were reported in the included trials. | ‐ | ‐ | ‐ | ‐ | ‐ | None of the trials specifically assessed nor reported serious adverse events according to ICH‐GCP. |
| MACE (major adverse cardiovascular event) at maximum follow‐up beyond 3 months. Follow‐up: mean7.5 months (range 6 to 12 months). | 84 per 1000 | 68 per 1000 | RR 0.81, 97.5% CI (0.43 to 1.52) | 475 (4 RCTs) | ⊕⊝⊝⊝1, 2 | |
| Quality of life at maximum follow‐up beyond 3 months. No data were reported in the included trials. | ‐ | ‐ | ‐ | ‐ | ‐ | No data reported. |
| Angina at maximum follow‐up beyond 3 months (mean = 6 months). | 24 per 1000 | 15 per 1000 (5 to 48) | RR 0.64, 98% CI 0.18 to 2.0 | 844 ( 2 RTCs) | ⊕⊝⊝⊝1,5 | |
| Cardiovascular mortality at maximum follow‐up beyond 3 months. Follow‐up: mean 12.9 months (range 6 to 24 months). | 124 per 1000 | 112 per 1000 | RR 0.90, 98% CI (0.83 to 0.98) | 22,457 (14 RCTs with 15 comparisons) | ⊕⊕⊕⊝1 | No events occurred in either group in one trial (Hanada 2012). |
| Myocardial infarction at maximum follow‐up beyond 3 months. Follow‐up: mean 15.5 months (range 6 to 60 months). | 92 per 1000 | 83 per 1000 | RR 0.89, 98% CI (0.75 to 1.08) | 6825 (14 RCTs) | ⊕⊕⊝⊝1, 6 Low | |
| *The basis for the assumed risk (e.g. the median control group risk across studies) is provided in footnotes. The corresponding risk (and its confidence interval) is based on the assumed risk in the comparison group and the relative effect of the intervention (and its CI). | ||||||
| GRADE Working Group grades of evidence | ||||||
| 1 Downgraded by one level due to serious risk of bias. All the included trials were at high risk of bias due to either unclear or high risk in several bias domains. 2 Downgraded by two levels due to very serious risk of imprecision based on the optimal information size not being reached, the wide absolute and relative 97.5% CI showing both appreciable benefit and harm, and a small sample size. 3 Downgraded by one level due to serious risk of bias. All but one of the included trials were at high risk of bias due to either unclear or high risk in several bias domains and the sensitivity analysis excluding trials at high risk of bias showed different results than the overall analysis including trials at high risk of bias. However, the sensitivity analysis was based on only one small trial, so we have used the main analysis for the 'Summary of findings' table. 5 Downgraded by two levels due to very serious risk of imprecision based on the very small sample size included. 6 Downgraded by one level due to serious risk of imprecision based on the wide absolute and relative 98% where the upper CI does not exclude the possibility of no difference between the groups. | ||||||
| Trial | Year | All‐cause mortality | Major adverse cardiovascular events | Cardiovascular mortality | Myocardial infarction during follow‐up |
| Andersen | 1979 | 28 days | NR | NR | NR |
| Åström | 1986 | NR | NR | NR | NR |
| Australian | 1984 | 28 days | NR | NR | NR |
| Australia & Swedish | 1983 | 28 days | NR | NR | NR |
| Balcon | 1967 | 28 days | NR | NR | NR |
| Barbar | 1967 | 28 days | NR | NR | NR |
| Barber | 1976 | 90 days | NR | NR | NR |
| BEAT‐AMI trial | 2016 | During hospitalisation (no mean time) | NR | During hospitalisation (no mean time) | During hospitalisation (no mean time) |
| Briant | 1970 | 3 days | NR | NR | NR |
| Campbell | 1984 | 7 days | NR | NR | NR |
| CAPRICORN | 2001 | 30 days | NR | NR | NR |
| Clausen | 1966 | 28 days | NR | NR | NR |
| COMMIT | 2005 | 28 days | NR | 28 days | 28 days |
| CPRG | 1980 | 60 days | NR | 56 days | 56 days |
| EARLY‐BAMI | 2016 | 30 days | NR | 30 days | 30 days |
| EMIT | 2002 | 42 days | NR | NR | 42 days |
| Evemy | 1977 | 30 days | NR | NR | NR |
| Gardtman | 1999 | 30 days | NR | NR | NR |
| Göteborg Metoprolol Trial | 1981 | 90 days | NR | 90 days | 90 days |
| Hanada | 2012 | During hospitalisation (no mean time) (no events) | During hospitalisation (no mean time) (no events) | During hospitalisation (no mean time) (no events) | During hospitalisation (no mean time) (no events) |
| Heber | 1986 | 5 days | NR | NR | NR |
| ICSG | 1984 | During hospitalisation (no mean time) | NR | During hospitalisation (no mean time) | During hospitalisation (no mean time) |
| ISIS‐1 | 1986 | 14 days | NR | 7 days | 7 days |
| Johannessen | 1987 | 10 days | NR | NR | NR |
| Ledwich | 1968 | 7 days | NR | NR | NR |
| McMurray | 1991 | NR | NR | NR | 10 days |
| METOCARD‐CNIC | 2013 | 7 days | NR | NR | 7 days |
| MIAMI | 1985 | 15 days | NR | 15 days | 15 days |
| MILIS | 1984 | 30 days | NR | NR | NR |
| Mueller | 1980 | 3 days | NR | 10 days | NR |
| Multicenter trial | 1966 | 30 days | NR | 30 days | NR |
| Nielsen | 1967 | 28 days | NR | NR | 28 days |
| Norris | 1968 | 21 days | NR | NR | NR |
| Norris | 1978 | 8.5 days (no events) | NR | 8.5 days (no events) | NR |
| Norris | 1980 | During hospitalisation (no mean time) | NR | During hospitalisation (no mean time) | NR |
| Norris | 1984 | 21 days | NR | 21 days | NR |
| Owensby | 1985 | 3 days | NR | NR | 3 days |
| Peter | 1978 | 3 days | NR | NR | 3 days |
| Raeder | 1967 | 21 days | NR | 21 days | NR |
| Ranganathan | 1988 | 2 days | NR | NR | NR |
| Rolli | 1980 | NR | NR | NR | NR |
| Salathia | 1985 | During hospitalisation (no mean time) | NR | 90 days | NR |
| Shirotani | 2010 | 30 days (no events) | 30 days (no events) | 30 days (no events) | 30 days (no events) |
| Tereschenko | 2005 | 30 days | NR | 30 days | NR |
| Thompson | 1979 | 5 days | NR | NR | NR |
| TIARA | 1987 | 30 days | NR | 30 days | 30 days |
| Tonkin | 1981 | 7 days | NR | NR | 7 days |
| Van De Werf | 1993 | 14 days | NR | 14 days | 14 days |
| Von Essen | 1982 | 14 days | NR | 14 days | NR |
| Wilcox | 1980 | 42 days | NR | NR | NR |
| Yang | 1984 | NR | NR | NR | NR |
| Yusuf | 1980 | 10 days | NR | NR | During hospitalisation (no mean time) |
| Trial | Year | All‐cause mortality | Major adverse cardiovascular events | Cardiovascular mortality | Myocardial infarction |
| Andersen | 1979 | 12 months | NR | NR | NR |
| Australia & Swedish | 1983 | 24 months | NR | 24 months | 24 months |
| Barber | 1976 | 24 months | NR | NR | NR |
| Basu | 1997 | 6 months | 6 months | 6 months | 6 months |
| BEAT‐AMI trial | 2016 | 6 months | NR | 6 months | 6 months |
| Briant | 1970 | 12 months | 12 months | 12 months | 12 months |
| CAPRICORN | 2001 | 15.6 months | NR | 15.6 months | 15.6 months |
| EARLY‐BAMI | 2016 | 1 month (not included) | NR | 12 months | 12 months |
| Evemy | 1977 | 7 months | NR | NR | NR |
| Göteborg Metoprolol Trial | 1981 | 60 months | NR | 3 months | 60 months |
| Hanada | 2012 | 6 months (no events) | 6 months | 6 months (no events) | 6 months |
| Heber | 1986 | 12 months | NR | NR | NR |
| ISIS‐1 | 1986 | 20 months | NR | 20 months | 0.23 months (not included) |
| Kaul | 1988 | 6 months | NR | 6 months | 6 months |
| METOCARD‐CNIC | 2013 | 24 months | NR | 24 months | 24 months |
| MILIS | 1984 | 36 months | NR | NR | NR |
| NPT | 1982 | 12 months | NR | 12 months | 12 months |
| RIMA | 1999 | 6 months | 6 months | 6 months | 6 months |
| Salathia | 1985 | 12 months | NR | 12 months | NR |
| TIARA | 1987 | 24 months | NR | 1 month (not included) | 1 month (not included) |
| Tonkin | 1981 | 0.23 months (not included) | NR | NR | 12 months |
| Wilcox | 1980 | 12 months | NR | 12 months | NR |
| Yusuf | 1980 | 24 months | NR | NR | During hospitalisation (no mean time) (not included) |
| Trial | Year | Type and number of serious adverse events (beta‐blocker group) | Type and number of serious adverse events (control group) |
| Andersen | 1979 |
|
|
| Åstrøm | 1986 | None |
|
| Australian trial | 1984 |
|
|
| Australia & Swedish | 1983 |
|
|
| Balcon | 1967 |
|
|
| Barbar | 1967 |
|
|
| Barber | 1976 |
|
|
| BEAT‐AMI | 2016 |
|
|
| Briant | 1970 |
|
|
| Campbell | 1984 |
|
|
| CAPRICORN | 2001 |
|
|
| Clausen | 1966 |
|
|
| COMMIT | 2005 |
|
|
| CPRG | 1980 |
|
|
| EARLY‐BAMI | 2016 |
|
|
| EMIT | 2002 |
|
|
| Evemy | 1977 |
|
|
| Gardtman | 1999 |
|
|
| Göteborg | 1981 |
|
|
| Heber | 1986 |
|
|
| ICSG | 1984 |
|
|
| ISIS‐1 | 1986 |
|
|
| Johannessen | 1987 |
|
|
| Ledwich | 1968 |
|
|
| Lloyd | 1988 |
|
|
| Mcmurray | 1991 |
|
|
| METOCARD‐CNIC | 2013 |
|
|
| Miami | 1985 |
|
|
| MILIS | 1984 |
|
|
| Mueller | 1980 |
|
|
| Multicenter trial | 1966 |
|
|
| Nielsen | 1967 |
|
|
| Norris | 1968 |
|
|
| Norris | 1978 |
|
|
| Norris | 1980 |
|
|
| Norris | 1984 |
|
|
| Owensby | 1985 |
|
|
| Peter | 1978 |
|
|
| Raeder | 1967 |
|
|
| Ramsdale | 1982 | None |
|
| Ranganathan | 1988 |
|
|
| Rolli | 1980 |
|
|
| Salathia | 1985 |
|
|
| Tereschenko | 2005 |
|
|
| Thompson | 1979 |
|
|
| TIARA | 1987 |
|
|
| Tonkin | 1981 |
|
|
| Van De Werf | 1993 |
|
|
| Von Essen | 1982 |
|
|
| Wilcox (atenolol) | 1980 |
|
|
| Wilcox (propranolol) | 1980 |
|
|
| Yang | 1984 |
|
|
| Yusuf | 1980 |
|
|
| Trial | Year | Type and number of serious adverse events (beta‐blocker group) | Type and number of serious adverse events (control group) |
| Andersen | 1979 |
|
|
| Åstrøm | 1986 | None |
|
| Australian trial | 1984 |
|
|
| Australia & Swedish | 1983 |
|
|
| Balcon | 1967 |
|
|
| Barbar | 1967 |
|
|
| Barber | 1976 |
|
|
| Basu | 1997 |
|
|
| BEAT‐AMI | 2016 |
|
|
| Briant | 1970 |
|
|
| Campbell | 1984 |
|
|
| CAPRICORN | 2001 |
|
|
| Clausen | 1966 |
|
|
| COMMIT | 2005 |
|
|
| CPRG | 1980 |
|
|
| EARLY‐BAMI | 2016 |
|
|
| EMIT | 2002 |
|
|
| Evemy | 1977 |
|
|
| Gardtman | 1999 |
|
|
| Göteborg | 1981 |
|
|
| Hanada | 2012 | None |
|
| Heber | 1986 |
|
|
| ICSG | 1984 |
|
|
| ISIS‐1 | 1986 |
|
|
| Johannessen | 1987 |
|
|
| Kaul | 1988 |
|
|
| Ledwich | 1968 |
|
|
| Lloyd | 1988 |
|
|
| Mcmurray | 1991 |
|
|
| METOCARD‐CNIC | 2013 |
|
|
| Miami | 1985 |
|
|
| MILIS | 1984 |
|
|
| Mueller | 1980 |
|
|
| Multicenter trial | 1966 |
|
|
| Nielsen | 1967 |
|
|
| Norris | 1968 |
|
|
| Norris | 1978 |
|
|
| Norris | 1980 |
|
|
| Norris | 1984 |
|
|
| NPT | 1982 |
|
|
| Owensby | 1985 |
|
|
| Peter | 1978 |
|
|
| Raeder | 1967 |
|
|
| Ramsdale | 1982 | None |
|
| Ranganathan | 1988 |
|
|
| RIMA | 1999 |
|
|
| Rolli | 1980 |
|
|
| Salathia | 1985 |
|
|
| Tereschenko | 2005 |
|
|
| Thompson | 1979 |
|
|
| TIARA | 1987 |
|
|
| Tonkin | 1981 |
|
|
| Van De Werf | 1993 |
|
|
| Von Essen | 1982 |
|
|
| Wilcox (atenolol) | 1980 |
|
|
| Wilcox (propranolol) | 1980 |
|
|
| Yang | 1984 |
|
|
| Yusuf | 1980 |
|
|
| Outcome or subgroup title | No. of studies | No. of participants | Statistical method | Effect size |
| 1 All‐cause mortality Show forest plot | 46 | 80452 | Risk Ratio (M‐H, Fixed, 95% CI) | 0.94 [0.90, 0.99] |
| 2 All‐cause mortality ‐ Acute/subacute phase Show forest plot | 46 | 80452 | Risk Ratio (M‐H, Fixed, 95% CI) | 0.94 [0.90, 0.99] |
| 2.1 Acute phase | 42 | 76857 | Risk Ratio (M‐H, Fixed, 95% CI) | 0.95 [0.90, 1.00] |
| 2.2 Subacute phase | 4 | 3595 | Risk Ratio (M‐H, Fixed, 95% CI) | 0.79 [0.50, 1.25] |
| 3 All‐cause mortality ‐ Reperfusion/no reperfusion Show forest plot | 46 | 80452 | Risk Ratio (M‐H, Fixed, 95% CI) | 0.94 [0.90, 0.99] |
| 3.1 No reperfusion | 40 | 78206 | Risk Ratio (M‐H, Fixed, 95% CI) | 0.94 [0.90, 0.99] |
| 3.2 Reperfusion (PCI , CABG, thrombolytics) | 6 | 2246 | Risk Ratio (M‐H, Fixed, 95% CI) | 0.80 [0.43, 1.50] |
| 4 All‐cause mortality ‐ Type of beta‐blocker Show forest plot | 46 | 80452 | Risk Ratio (M‐H, Fixed, 95% CI) | 0.94 [0.90, 0.99] |
| 4.1 Alprenolol | 2 | 599 | Risk Ratio (M‐H, Fixed, 95% CI) | 1.13 [0.77, 1.66] |
| 4.2 Atenolol | 4 | 16890 | Risk Ratio (M‐H, Fixed, 95% CI) | 0.83 [0.74, 0.94] |
| 4.3 Esmolol | 2 | 140 | Risk Ratio (M‐H, Fixed, 95% CI) | 0.86 [0.21, 3.62] |
| 4.4 Labetolol | 1 | 166 | Risk Ratio (M‐H, Fixed, 95% CI) | 5.0 [0.60, 41.88] |
| 4.5 Metoprolol | 8 | 55034 | Risk Ratio (M‐H, Fixed, 95% CI) | 0.97 [0.91, 1.03] |
| 4.6 Oxprenolol | 1 | 313 | Risk Ratio (M‐H, Fixed, 95% CI) | 1.38 [0.47, 4.03] |
| 4.7 Pindolol | 2 | 629 | Risk Ratio (M‐H, Fixed, 95% CI) | 1.01 [0.49, 2.08] |
| 4.8 Practolol | 3 | 486 | Risk Ratio (M‐H, Fixed, 95% CI) | 1.02 [0.65, 1.60] |
| 4.9 Propranolol | 14 | 2630 | Risk Ratio (M‐H, Fixed, 95% CI) | 0.95 [0.76, 1.18] |
| 4.10 Timolol | 7 | 704 | Risk Ratio (M‐H, Fixed, 95% CI) | 0.65 [0.33, 1.31] |
| 4.11 Carvedilol | 2 | 2753 | Risk Ratio (M‐H, Fixed, 95% CI) | 0.50 [0.25, 1.04] |
| 4.12 Mixed | 1 | 108 | Risk Ratio (M‐H, Fixed, 95% CI) | 1.93 [0.18, 20.63] |
| 5 All‐cause mortality ‐ Intravenously/orally commenced Show forest plot | 46 | 80452 | Risk Ratio (M‐H, Fixed, 95% CI) | 0.94 [0.90, 0.99] |
| 5.1 Intravenously commenced | 4 | 1036 | Risk Ratio (M‐H, Fixed, 95% CI) | 0.97 [0.46, 2.04] |
| 5.2 Orally commenced | 16 | 5658 | Risk Ratio (M‐H, Fixed, 95% CI) | 0.90 [0.74, 1.10] |
| 5.3 Mixed | 26 | 73758 | Risk Ratio (M‐H, Fixed, 95% CI) | 0.95 [0.90, 1.00] |
| 6 All‐cause mortality ‐ Above/below 75 years of age Show forest plot | 39 | 79161 | Risk Ratio (M‐H, Fixed, 95% CI) | 0.94 [0.90, 0.99] |
| 6.1 Below 75 years | 24 | 12602 | Risk Ratio (M‐H, Fixed, 95% CI) | 0.86 [0.74, 0.99] |
| 6.2 Mixed | 15 | 66559 | Risk Ratio (M‐H, Fixed, 95% CI) | 0.96 [0.90, 1.01] |
| 7 All‐cause mortality ‐ NSTEMI/STEMI/UAP Show forest plot | 24 | 53337 | Risk Ratio (M‐H, Fixed, 95% CI) | 0.97 [0.92, 1.03] |
| 7.1 STEMI | 5 | 1828 | Risk Ratio (M‐H, Fixed, 95% CI) | 1.01 [0.48, 2.10] |
| 7.2 Mixed | 19 | 51509 | Risk Ratio (M‐H, Fixed, 95% CI) | 0.97 [0.92, 1.03] |
| 8 All‐cause mortality ‐ Registration status Show forest plot | 46 | 80452 | Risk Ratio (M‐H, Fixed, 95% CI) | 0.94 [0.90, 0.99] |
| 8.1 Pre‐registration | 5 | 47642 | Risk Ratio (M‐H, Fixed, 95% CI) | 0.99 [0.93, 1.05] |
| 8.2 Post‐registration | 1 | 269 | Risk Ratio (M‐H, Fixed, 95% CI) | 0.50 [0.16, 1.63] |
| 8.3 No registration | 40 | 32541 | Risk Ratio (M‐H, Fixed, 95% CI) | 0.87 [0.80, 0.95] |
| 9 All‐cause mortality ‐ Funding Show forest plot | 46 | 80452 | Risk Ratio (M‐H, Fixed, 95% CI) | 0.94 [0.90, 0.99] |
| 9.1 Industry funded or unknown funded trials | 39 | 78702 | Risk Ratio (M‐H, Fixed, 95% CI) | 0.95 [0.90, 1.00] |
| 9.2 Non‐industry funded trials | 7 | 1750 | Risk Ratio (M‐H, Fixed, 95% CI) | 0.85 [0.60, 1.20] |
| 10 All‐cause mortality ‐ Trials at low risk of bias Show forest plot | 2 | 46122 | Risk Ratio (M‐H, Fixed, 95% CI) | 0.99 [0.93, 1.05] |
| 11 All‐cause mortality ‐ 'Best‐worst case scenario' Show forest plot | 46 | 80522 | Risk Ratio (M‐H, Fixed, 95% CI) | 0.93 [0.89, 0.98] |
| 12 All‐cause mortality ‐ 'Worst‐best case scenario' Show forest plot | 46 | 80522 | Risk Ratio (M‐H, Random, 95% CI) | 0.93 [0.86, 1.02] |
| Outcome or subgroup title | No. of studies | No. of participants | Statistical method | Effect size |
| 1 All‐cause mortality Show forest plot | 21 | 25210 | Risk Ratio (M‐H, Fixed, 95% CI) | 0.93 [0.87, 0.98] |
| 2 All‐cause mortality ‐ Acute/subacute phase Show forest plot | 21 | 25210 | Risk Ratio (M‐H, Random, 95% CI) | 0.93 [0.87, 0.99] |
| 2.1 Acute phase | 17 | 21368 | Risk Ratio (M‐H, Random, 95% CI) | 0.95 [0.89, 1.01] |
| 2.2 Subacute phase | 4 | 3842 | Risk Ratio (M‐H, Random, 95% CI) | 0.81 [0.68, 0.96] |
| 3 All‐cause mortality ‐ Reperfusion/no reperfusion Show forest plot | 21 | 25210 | Risk Ratio (M‐H, Random, 95% CI) | 0.93 [0.87, 0.99] |
| 3.1 No reperfusion | 16 | 23768 | Risk Ratio (M‐H, Random, 95% CI) | 0.93 [0.87, 0.99] |
| 3.2 Reperfusion (PCI , CABG, thrombolytics) | 5 | 1442 | Risk Ratio (M‐H, Random, 95% CI) | 0.83 [0.52, 1.34] |
| 4 All‐cause mortality ‐ Type of beta‐blocker Show forest plot | 21 | 25098 | Risk Ratio (M‐H, Fixed, 95% CI) | 0.93 [0.87, 0.99] |
| 4.1 Alprenolol | 2 | 566 | Risk Ratio (M‐H, Fixed, 95% CI) | 0.99 [0.74, 1.31] |
| 4.2 Atenolol | 3 | 16696 | Risk Ratio (M‐H, Fixed, 95% CI) | 0.94 [0.88, 1.02] |
| 4.3 Carvedilol | 3 | 2899 | Risk Ratio (M‐H, Fixed, 95% CI) | 0.78 [0.64, 0.96] |
| 4.4 Labetolol | 1 | 166 | Risk Ratio (M‐H, Fixed, 95% CI) | 1.71 [0.71, 4.14] |
| 4.5 Metoprolol | 4 | 2593 | Risk Ratio (M‐H, Fixed, 95% CI) | 0.93 [0.79, 1.09] |
| 4.6 Pindolol | 1 | 529 | Risk Ratio (M‐H, Fixed, 95% CI) | 0.97 [0.67, 1.40] |
| 4.7 Practolol | 2 | 386 | Risk Ratio (M‐H, Fixed, 95% CI) | 0.95 [0.68, 1.33] |
| 4.8 Propranolol | 4 | 1075 | Risk Ratio (M‐H, Fixed, 95% CI) | 0.88 [0.64, 1.21] |
| 4.9 Timolol | 1 | 88 | Risk Ratio (M‐H, Fixed, 95% CI) | 1.10 [0.07, 16.96] |
| 4.10 Esmolol | 1 | 100 | Risk Ratio (M‐H, Fixed, 95% CI) | 0.33 [0.01, 7.99] |
| 5 All‐cause mortality ‐ Above/below 75 years of age Show forest plot | 21 | 25210 | Risk Ratio (M‐H, Fixed, 95% CI) | 0.93 [0.87, 0.98] |
| 5.1 Below 75 years | 16 | 5862 | Risk Ratio (M‐H, Fixed, 95% CI) | 0.93 [0.83, 1.04] |
| 5.2 Mixed | 5 | 19348 | Risk Ratio (M‐H, Fixed, 95% CI) | 0.93 [0.86, 0.99] |
| 6 All‐cause mortality ‐ Intravenously/orally commenced Show forest plot | 21 | 25210 | Risk Ratio (M‐H, Random, 95% CI) | 0.93 [0.87, 0.99] |
| 6.1 Intravenously commenced | 2 | 370 | Risk Ratio (M‐H, Random, 95% CI) | 0.84 [0.30, 2.39] |
| 6.2 Orally commenced | 7 | 4614 | Risk Ratio (M‐H, Random, 95% CI) | 0.83 [0.72, 0.96] |
| 6.3 Mixed | 12 | 20226 | Risk Ratio (M‐H, Random, 95% CI) | 0.95 [0.89, 1.01] |
| 7 All‐cause mortality ‐ Registration status Show forest plot | 21 | 25210 | Risk Ratio (M‐H, Random, 95% CI) | 0.93 [0.87, 0.99] |
| 7.1 Pre‐registration | 3 | 1164 | Risk Ratio (M‐H, Random, 95% CI) | 0.85 [0.51, 1.40] |
| 7.2 Post‐registration | 1 | 269 | Risk Ratio (M‐H, Random, 95% CI) | 1.21 [0.70, 2.08] |
| 7.3 No registration | 17 | 23777 | Risk Ratio (M‐H, Random, 95% CI) | 0.93 [0.87, 0.98] |
| 8 All‐cause mortality ‐ NSTEMI/STEMI/UAP Show forest plot | 7 | 2128 | Risk Ratio (M‐H, Fixed, 95% CI) | 0.91 [0.70, 1.18] |
| 8.1 STEMI | 3 | 1164 | Risk Ratio (M‐H, Fixed, 95% CI) | 0.84 [0.51, 1.39] |
| 8.2 Mixed | 4 | 964 | Risk Ratio (M‐H, Fixed, 95% CI) | 0.94 [0.69, 1.27] |
| 9 All‐cause mortality ‐ Length of intervention period Show forest plot | 21 | 25210 | Risk Ratio (M‐H, Random, 95% CI) | 0.93 [0.87, 0.99] |
| 9.1 0 to 7 days length of intervention | 5 | 16651 | Risk Ratio (M‐H, Random, 95% CI) | 0.96 [0.89, 1.03] |
| 9.2 7 to 30 days length of intervention | 3 | 946 | Risk Ratio (M‐H, Random, 95% CI) | 0.86 [0.60, 1.24] |
| 9.3 1 month and more length of intervention | 13 | 7613 | Risk Ratio (M‐H, Random, 95% CI) | 0.88 [0.80, 0.98] |
| 10 All‐cause mortality ‐ Funding Show forest plot | 21 | 25210 | Risk Ratio (M‐H, Fixed, 95% CI) | 0.93 [0.87, 0.98] |
| 10.1 Industry funded or unknown funded trials | 18 | 23877 | Risk Ratio (M‐H, Fixed, 95% CI) | 0.92 [0.87, 0.98] |
| 10.2 Non‐industry funded trials | 3 | 1333 | Risk Ratio (M‐H, Fixed, 95% CI) | 1.00 [0.69, 1.45] |
| 11 All‐cause mortality ‐ Trials at low risk of bias Show forest plot | 1 | 270 | Risk Ratio (M‐H, Fixed, 95% CI) | 0.94 [0.31, 2.85] |
| 12 All‐cause mortality ‐ 'Best‐worst case scenario' Show forest plot | 21 | 25283 | Risk Ratio (M‐H, Random, 95% CI) | 0.89 [0.81, 0.97] |
| 13 All‐cause mortality ‐ 'Worst‐best case scenario' Show forest plot | 21 | 25283 | Risk Ratio (M‐H, Random, 95% CI) | 0.95 [0.85, 1.06] |
| Outcome or subgroup title | No. of studies | No. of participants | Statistical method | Effect size |
| 1 MACE (Composite of cardiovascular death and non‐fatal myocardial infarction) Show forest plot | 2 | 165 | Risk Ratio (M‐H, Fixed, 95% CI) | 0.0 [0.0, 0.0] |
| Outcome or subgroup title | No. of studies | No. of participants | Statistical method | Effect size |
| 1 MACE (Composite of cardiovascular death and non‐fatal myocardial infarction) Show forest plot | 4 | 475 | Risk Ratio (M‐H, Random, 95% CI) | 0.81 [0.43, 1.52] |
| Outcome or subgroup title | No. of studies | No. of participants | Statistical method | Effect size |
| 1 Cardiovascular mortality Show forest plot | 18 | 72622 | Risk Ratio (M‐H, Fixed, 95% CI) | 0.93 [0.87, 0.99] |
| 2 Cardiovascular mortality ‐ Acute/subacute phase Show forest plot | 18 | 72622 | Risk Ratio (M‐H, Fixed, 95% CI) | 0.93 [0.87, 0.99] |
| 2.1 Acute phase | 17 | 72309 | Risk Ratio (M‐H, Fixed, 95% CI) | 0.92 [0.87, 0.99] |
| 2.2 Subacute phase | 1 | 313 | Risk Ratio (M‐H, Fixed, 95% CI) | 1.23 [0.41, 3.67] |
| 3 Cardiovascular mortality ‐ Reperfusion/no reperfusion Show forest plot | 18 | 72622 | Risk Ratio (M‐H, Fixed, 95% CI) | 0.93 [0.87, 0.99] |
| 3.1 No reperfusion | 15 | 71702 | Risk Ratio (M‐H, Fixed, 95% CI) | 0.93 [0.87, 0.99] |
| 3.2 Reperfusion (PCI , CABG, thrombolytics) | 3 | 920 | Risk Ratio (M‐H, Fixed, 95% CI) | 0.69 [0.29, 1.62] |
| 4 Cardiovascular mortality ‐ Type of beta‐blocker Show forest plot | 18 | 72622 | Risk Ratio (M‐H, Fixed, 95% CI) | 0.93 [0.87, 0.99] |
| 4.1 Esmolol | 2 | 140 | Risk Ratio (M‐H, Fixed, 95% CI) | 0.86 [0.21, 3.62] |
| 4.2 Atenolol | 2 | 16221 | Risk Ratio (M‐H, Fixed, 95% CI) | 0.85 [0.75, 0.96] |
| 4.3 Metoprolol | 6 | 54501 | Risk Ratio (M‐H, Fixed, 95% CI) | 0.96 [0.88, 1.03] |
| 4.4 Oxprenolol | 1 | 313 | Risk Ratio (M‐H, Fixed, 95% CI) | 1.23 [0.41, 3.67] |
| 4.5 Propranolol | 5 | 1103 | Risk Ratio (M‐H, Fixed, 95% CI) | 1.06 [0.65, 1.73] |
| 4.6 Timolol | 2 | 344 | Risk Ratio (M‐H, Fixed, 95% CI) | 0.53 [0.20, 1.39] |
| 5 Cardiovascular mortality ‐ Above/below 75 years of age Show forest plot | 18 | 72622 | Risk Ratio (M‐H, Fixed, 95% CI) | 0.93 [0.87, 0.99] |
| 5.1 Below 75 years | 14 | 56308 | Risk Ratio (M‐H, Fixed, 95% CI) | 0.95 [0.88, 1.03] |
| 5.2 Mixed | 4 | 16314 | Risk Ratio (M‐H, Fixed, 95% CI) | 0.85 [0.75, 0.97] |
| 6 Cardiovascular mortality ‐ Intravenously/orally commenced Show forest plot | 18 | 72622 | Risk Ratio (M‐H, Fixed, 95% CI) | 0.93 [0.87, 0.99] |
| 6.1 Intravenously commenced | 3 | 766 | Risk Ratio (M‐H, Fixed, 95% CI) | 0.98 [0.42, 2.26] |
| 6.2 Orally commenced | 3 | 549 | Risk Ratio (M‐H, Fixed, 95% CI) | 0.99 [0.54, 1.82] |
| 6.3 Mixed | 12 | 71307 | Risk Ratio (M‐H, Fixed, 95% CI) | 0.92 [0.87, 0.99] |
| 7 Cardiovascular mortality ‐ NSTEMI/STEMI/UAP Show forest plot | 9 | 49303 | Risk Ratio (M‐H, Fixed, 95% CI) | 0.97 [0.89, 1.05] |
| 7.1 STEMI | 2 | 726 | Risk Ratio (M‐H, Fixed, 95% CI) | 0.91 [0.35, 2.41] |
| 7.2 NSTEMI | 0 | 0 | Risk Ratio (M‐H, Fixed, 95% CI) | 0.0 [0.0, 0.0] |
| 7.3 Unstable angina pectoris | 0 | 0 | Risk Ratio (M‐H, Fixed, 95% CI) | 0.0 [0.0, 0.0] |
| 7.4 Mixed | 7 | 48577 | Risk Ratio (M‐H, Fixed, 95% CI) | 0.97 [0.89, 1.05] |
| 8 Cardiovascular mortality ‐ Registration status Show forest plot | 18 | 72622 | Risk Ratio (M‐H, Fixed, 95% CI) | 0.93 [0.87, 0.99] |
| 8.1 Pre‐registration | 3 | 46578 | Risk Ratio (M‐H, Fixed, 95% CI) | 0.99 [0.91, 1.08] |
| 8.2 Post‐registration | 0 | 0 | Risk Ratio (M‐H, Fixed, 95% CI) | 0.0 [0.0, 0.0] |
| 8.3 No registration | 15 | 26044 | Risk Ratio (M‐H, Fixed, 95% CI) | 0.84 [0.76, 0.93] |
| 9 Cardiovascular mortality ‐ Funding Show forest plot | 18 | 72622 | Risk Ratio (M‐H, Fixed, 95% CI) | 0.93 [0.87, 0.99] |
| 9.1 Industry funded or unknown funded trials | 17 | 72560 | Risk Ratio (M‐H, Fixed, 95% CI) | 0.92 [0.87, 0.99] |
| 9.2 Non‐industry funded trials | 1 | 62 | Risk Ratio (M‐H, Fixed, 95% CI) | 2.65 [0.11, 62.56] |
| 10 Cardiovascular mortality ‐ Trials with low risk of bias Show forest plot | 1 | 45852 | Risk Ratio (M‐H, Fixed, 95% CI) | 0.99 [0.91, 1.08] |
| 11 Cardiovascular mortality ‐ 'Best‐worst case scenario' Show forest plot | 18 | 72681 | Risk Ratio (M‐H, Random, 95% CI) | 0.84 [0.72, 0.97] |
| 12 Cardiovascular mortality ‐ 'Worst‐best case scenario' Show forest plot | 18 | 72681 | Risk Ratio (M‐H, Random, 95% CI) | 0.93 [0.79, 1.10] |
| Outcome or subgroup title | No. of studies | No. of participants | Statistical method | Effect size |
| 1 Cardiovascular mortality Show forest plot | 14 | 22457 | Risk Ratio (M‐H, Fixed, 95% CI) | 0.90 [0.84, 0.97] |
| 2 Cardiovascular mortality ‐ Acute/subacute phase Show forest plot | 14 | 22457 | Risk Ratio (M‐H, Random, 95% CI) | 0.90 [0.84, 0.97] |
| 2.1 Acute phase | 10 | 18615 | Risk Ratio (M‐H, Random, 95% CI) | 0.93 [0.86, 1.00] |
| 2.2 Subacute phase | 4 | 3842 | Risk Ratio (M‐H, Random, 95% CI) | 0.78 [0.65, 0.95] |
| 3 Cardiovascular mortality ‐ Reperfusion/no reperfusion Show forest plot | 14 | 22457 | Risk Ratio (M‐H, Random, 95% CI) | 0.90 [0.84, 0.97] |
| 3.1 No reperfusion | 8 | 20386 | Risk Ratio (M‐H, Random, 95% CI) | 0.91 [0.84, 0.97] |
| 3.2 Reperfusion (PCI , CABG, thrombolytics) | 6 | 2071 | Risk Ratio (M‐H, Random, 95% CI) | 0.83 [0.46, 1.51] |
| 4 Cardiovascular mortality ‐ Type of beta‐blocker Show forest plot | 14 | 22457 | Risk Ratio (M‐H, Random, 95% CI) | 0.90 [0.84, 0.97] |
| 4.1 Esmolol | 1 | 100 | Risk Ratio (M‐H, Random, 95% CI) | 0.33 [0.01, 7.99] |
| 4.2 Alprenolol | 1 | 77 | Risk Ratio (M‐H, Random, 95% CI) | 1.03 [0.22, 4.77] |
| 4.3 Atenolol | 2 | 16219 | Risk Ratio (M‐H, Random, 95% CI) | 0.93 [0.86, 1.01] |
| 4.4 Carvedilol | 3 | 2899 | Risk Ratio (M‐H, Random, 95% CI) | 0.77 [0.61, 0.97] |
| 4.5 Metoprolol | 4 | 1827 | Risk Ratio (M‐H, Random, 95% CI) | 0.83 [0.59, 1.18] |
| 4.6 Pindolol | 1 | 529 | Risk Ratio (M‐H, Random, 95% CI) | 0.94 [0.63, 1.40] |
| 4.7 Propranolol | 3 | 806 | Risk Ratio (M‐H, Random, 95% CI) | 0.70 [0.47, 1.06] |
| 5 Cardiovascular mortality ‐ Above/below 75 years of age Show forest plot | 14 | 22457 | Risk Ratio (M‐H, Random, 95% CI) | 0.90 [0.84, 0.97] |
| 5.1 Below 75 years | 11 | 5366 | Risk Ratio (M‐H, Random, 95% CI) | 0.80 [0.68, 0.94] |
| 5.2 Mixed | 3 | 17091 | Risk Ratio (M‐H, Random, 95% CI) | 0.93 [0.86, 1.01] |
| 6 Cardiovascular mortality ‐ Intravenously/orally commenced Show forest plot | 14 | 22457 | Risk Ratio (M‐H, Random, 95% CI) | 0.90 [0.84, 0.97] |
| 6.1 Intravenously commenced | 3 | 999 | Risk Ratio (M‐H, Random, 95% CI) | 0.73 [0.33, 1.60] |
| 6.2 Orally commenced | 6 | 4307 | Risk Ratio (M‐H, Random, 95% CI) | 0.79 [0.67, 0.95] |
| 6.3 Mixed | 5 | 17151 | Risk Ratio (M‐H, Random, 95% CI) | 0.93 [0.86, 1.01] |
| 7 Cardiovascular mortality ‐ NSTEMI/STEMI/UAP Show forest plot | 6 | 2002 | Risk Ratio (M‐H, Random, 95% CI) | 0.88 [0.49, 1.59] |
| 7.1 STEMI | 4 | 1793 | Risk Ratio (M‐H, Random, 95% CI) | 0.85 [0.44, 1.64] |
| 7.2 Mixed | 2 | 209 | Risk Ratio (M‐H, Random, 95% CI) | 1.03 [0.27, 3.93] |
| 8 Cardiovascular mortality ‐ Registration status Show forest plot | 14 | 22457 | Risk Ratio (M‐H, Random, 95% CI) | 0.90 [0.84, 0.97] |
| 8.1 Pre‐registration | 4 | 1793 | Risk Ratio (M‐H, Random, 95% CI) | 0.85 [0.44, 1.64] |
| 8.2 No registration | 10 | 20664 | Risk Ratio (M‐H, Random, 95% CI) | 0.91 [0.84, 0.97] |
| 9 Cardiovascular mortality ‐ Length of intervention period Show forest plot | 14 | 22457 | Risk Ratio (M‐H, Random, 95% CI) | 0.90 [0.84, 0.97] |
| 9.1 0 to 7 days length of intervention | 4 | 17026 | Risk Ratio (M‐H, Random, 95% CI) | 0.93 [0.86, 1.01] |
| 9.2 1 month and more length of intervention | 10 | 5431 | Risk Ratio (M‐H, Random, 95% CI) | 0.80 [0.69, 0.94] |
| 10 Cardiovascular mortality ‐ Funding Show forest plot | 14 | 22457 | Risk Ratio (M‐H, Random, 95% CI) | 0.90 [0.84, 0.97] |
| 10.1 Industry funded or unknown funded trials | 12 | 21393 | Risk Ratio (M‐H, Random, 95% CI) | 0.90 [0.84, 0.97] |
| 10.2 Non‐industry funded trials | 2 | 1064 | Risk Ratio (M‐H, Random, 95% CI) | 0.89 [0.36, 2.20] |
| 11 Cardiovascular mortality ‐ 'Best‐worst case scenario' Show forest plot | 14 | 22587 | Risk Ratio (M‐H, Random, 95% CI) | 0.67 [0.53, 0.86] |
| 12 Cardiovascular mortality ‐ 'Worst‐best case scenario' Show forest plot | 14 | 22587 | Risk Ratio (M‐H, Random, 95% CI) | 1.06 [0.83, 1.36] |
| Outcome or subgroup title | No. of studies | No. of participants | Statistical method | Effect size |
| 1 Myocardial infarction Show forest plot | 18 | 67562 | Risk Ratio (M‐H, Fixed, 95% CI) | 0.82 [0.74, 0.90] |
| 2 Myocardial infarction ‐ Acute/subacute phase Show forest plot | 18 | 67562 | Risk Ratio (M‐H, Fixed, 95% CI) | 0.82 [0.74, 0.90] |
| 2.1 Acute phase | 17 | 67249 | Risk Ratio (M‐H, Fixed, 95% CI) | 0.82 [0.75, 0.90] |
| 2.2 Subacute phase | 1 | 313 | Risk Ratio (M‐H, Fixed, 95% CI) | 0.33 [0.09, 1.25] |
| 3 Myocardial infarction ‐ Reperfusion/no reperfusion Show forest plot | 18 | 67562 | Risk Ratio (M‐H, Fixed, 95% CI) | 0.82 [0.74, 0.90] |
| 3.1 No reperfusion | 14 | 66372 | Risk Ratio (M‐H, Fixed, 95% CI) | 0.81 [0.74, 0.90] |
| 3.2 Reperfusion (PCI , CABG, thrombolytics) | 4 | 1190 | Risk Ratio (M‐H, Fixed, 95% CI) | 0.90 [0.44, 1.82] |
| 4 Myocardial infarction ‐ Type of beta‐blocker Show forest plot | 18 | 67562 | Risk Ratio (M‐H, Random, 95% CI) | 0.82 [0.74, 0.90] |
| 4.1 Esmolol | 1 | 100 | Risk Ratio (M‐H, Random, 95% CI) | 0.20 [0.01, 4.06] |
| 4.2 Atenolol | 3 | 12312 | Risk Ratio (M‐H, Random, 95% CI) | 0.83 [0.48, 1.42] |
| 4.3 Metoprolol | 5 | 53921 | Risk Ratio (M‐H, Random, 95% CI) | 0.80 [0.72, 0.89] |
| 4.4 Oxprenolol | 1 | 313 | Risk Ratio (M‐H, Random, 95% CI) | 0.33 [0.09, 1.25] |
| 4.5 Pindolol | 1 | 100 | Risk Ratio (M‐H, Random, 95% CI) | 1.0 [0.15, 6.82] |
| 4.6 Propranolol | 2 | 225 | Risk Ratio (M‐H, Random, 95% CI) | 1.05 [0.08, 14.01] |
| 4.7 Timolol | 3 | 432 | Risk Ratio (M‐H, Random, 95% CI) | 0.73 [0.26, 2.08] |
| 4.8 Xamoterol | 1 | 51 | Risk Ratio (M‐H, Random, 95% CI) | 3.12 [0.13, 73.06] |
| 4.9 Mixed | 1 | 108 | Risk Ratio (M‐H, Random, 95% CI) | 1.93 [0.37, 10.08] |
| 5 Myocardial infarction ‐ Above/below 75 years of age Show forest plot | 17 | 67432 | Risk Ratio (M‐H, Random, 95% CI) | 0.82 [0.74, 0.90] |
| 5.1 Below 75 years | 13 | 9561 | Risk Ratio (M‐H, Random, 95% CI) | 0.72 [0.58, 0.89] |
| 5.2 Mixed | 4 | 57871 | Risk Ratio (M‐H, Random, 95% CI) | 0.84 [0.76, 0.94] |
| 6 Myocardial infarction ‐ Intravenously/orally commenced Show forest plot | 18 | 67562 | Risk Ratio (M‐H, Random, 95% CI) | 0.82 [0.74, 0.90] |
| 6.1 Intravenously commenced | 3 | 996 | Risk Ratio (M‐H, Random, 95% CI) | 1.13 [0.28, 4.51] |
| 6.2 Orally commenced | 3 | 452 | Risk Ratio (M‐H, Random, 95% CI) | 0.86 [0.16, 4.47] |
| 6.3 Mixed | 12 | 66114 | Risk Ratio (M‐H, Random, 95% CI) | 0.82 [0.74, 0.90] |
| 7 Myocardial infarction ‐ NSTEMI/STEMI/UAP Show forest plot | 11 | 49361 | Risk Ratio (M‐H, Fixed, 95% CI) | 0.80 [0.71, 0.90] |
| 7.1 STEMI | 3 | 996 | Risk Ratio (M‐H, Fixed, 95% CI) | 1.01 [0.29, 3.46] |
| 7.2 NSTEMI | 0 | 0 | Risk Ratio (M‐H, Fixed, 95% CI) | 0.0 [0.0, 0.0] |
| 7.3 Unstable angina pectoris | 0 | 0 | Risk Ratio (M‐H, Fixed, 95% CI) | 0.0 [0.0, 0.0] |
| 7.4 Mixed | 8 | 48365 | Risk Ratio (M‐H, Fixed, 95% CI) | 0.80 [0.71, 0.89] |
| 8 Myocardial infarction ‐ Registration status Show forest plot | 18 | 67562 | Risk Ratio (M‐H, Random, 95% CI) | 0.82 [0.74, 0.90] |
| 8.1 Pre‐registration | 4 | 46848 | Risk Ratio (M‐H, Random, 95% CI) | 0.82 [0.73, 0.92] |
| 8.2 Post‐registration | 0 | 0 | Risk Ratio (M‐H, Random, 95% CI) | 0.0 [0.0, 0.0] |
| 8.3 No registration | 14 | 20714 | Risk Ratio (M‐H, Random, 95% CI) | 0.82 [0.70, 0.95] |
| 9 Myocardial infarction ‐ Funding Show forest plot | 18 | 67562 | Risk Ratio (M‐H, Random, 95% CI) | 0.82 [0.74, 0.90] |
| 9.1 Industry funded or unknown funded trials | 15 | 67067 | Risk Ratio (M‐H, Random, 95% CI) | 0.82 [0.74, 0.90] |
| 9.2 Non‐industry funded trials | 3 | 495 | Risk Ratio (M‐H, Random, 95% CI) | 1.23 [0.22, 6.77] |
| 10 Myocardial infarction ‐ Trials with low risk of bias Show forest plot | 1 | 45852 | Risk Ratio (M‐H, Fixed, 95% CI) | 0.82 [0.72, 0.92] |
| 11 Myocardial infarction ‐ 'Best‐worst case scenario' Show forest plot | 18 | 67620 | Risk Ratio (M‐H, Random, 95% CI) | 0.75 [0.61, 0.92] |
| 12 Myocardial infarction ‐ 'Worst‐best case scenario' Show forest plot | 18 | 67620 | Risk Ratio (M‐H, Random, 95% CI) | 0.85 [0.67, 1.07] |
| Outcome or subgroup title | No. of studies | No. of participants | Statistical method | Effect size |
| 1 Myocardial infarction Show forest plot | 14 | 6825 | Risk Ratio (M‐H, Random, 95% CI) | 0.89 [0.74, 1.08] |
| 2 Myocardial infarction ‐ Acute/subacute phase Show forest plot | 14 | 6825 | Risk Ratio (M‐H, Random, 95% CI) | 0.89 [0.74, 1.08] |
| 2.1 Acute phase | 10 | 2983 | Risk Ratio (M‐H, Random, 95% CI) | 0.98 [0.72, 1.33] |
| 2.2 Subacute phase | 4 | 3842 | Risk Ratio (M‐H, Random, 95% CI) | 0.79 [0.62, 1.01] |
| 3 Myocardial infarction ‐ Reperfusion/no reperfusion Show forest plot | 14 | 6825 | Risk Ratio (M‐H, Random, 95% CI) | 0.89 [0.74, 1.08] |
| 3.1 No reperfusion | 7 | 4658 | Risk Ratio (M‐H, Random, 95% CI) | 0.88 [0.67, 1.15] |
| 3.2 Reperfusion (PCI , CABG, thrombolytics) | 7 | 2167 | Risk Ratio (M‐H, Random, 95% CI) | 0.87 [0.46, 1.66] |
| 4 Myocardial infarction ‐ Type of beta‐blocker Show forest plot | 14 | 6825 | Risk Ratio (M‐H, Random, 95% CI) | 0.89 [0.74, 1.08] |
| 4.1 Esmolol | 1 | 100 | Risk Ratio (M‐H, Random, 95% CI) | 0.20 [0.01, 4.06] |
| 4.2 Alprenolol | 1 | 77 | Risk Ratio (M‐H, Random, 95% CI) | 1.03 [0.28, 3.81] |
| 4.3 Landiolol | 1 | 96 | Risk Ratio (M‐H, Random, 95% CI) | 0.35 [0.01, 8.32] |
| 4.4 Carvedilol | 3 | 2899 | Risk Ratio (M‐H, Random, 95% CI) | 0.63 [0.43, 0.91] |
| 4.5 Metoprolol | 4 | 2426 | Risk Ratio (M‐H, Random, 95% CI) | 1.02 [0.84, 1.24] |
| 4.6 Pindolol | 1 | 529 | Risk Ratio (M‐H, Random, 95% CI) | 0.91 [0.61, 1.38] |
| 4.7 Propranolol | 2 | 610 | Risk Ratio (M‐H, Random, 95% CI) | 0.51 [0.08, 3.15] |
| 4.8 Timolol | 1 | 88 | Risk Ratio (M‐H, Random, 95% CI) | 6.57 [0.82, 52.35] |
| 5 Myocardial infarction ‐ Above/below 75 years of age Show forest plot | 13 | 6729 | Risk Ratio (M‐H, Random, 95% CI) | 0.89 [0.72, 1.09] |
| 5.1 Below 75 years | 11 | 5665 | Risk Ratio (M‐H, Random, 95% CI) | 0.87 [0.69, 1.10] |
| 5.2 Mixed | 2 | 1064 | Risk Ratio (M‐H, Random, 95% CI) | 1.35 [0.45, 4.07] |
| 6 Myocardial infarction ‐ Intravenously/orally commenced Show forest plot | 14 | 6825 | Risk Ratio (M‐H, Random, 95% CI) | 0.89 [0.74, 1.08] |
| 6.1 Intravenously commenced | 4 | 1095 | Risk Ratio (M‐H, Random, 95% CI) | 0.93 [0.26, 3.29] |
| 6.2 Orally commenced | 6 | 4007 | Risk Ratio (M‐H, Random, 95% CI) | 0.85 [0.62, 1.17] |
| 6.3 Mixed | 4 | 1723 | Risk Ratio (M‐H, Random, 95% CI) | 0.83 [0.46, 1.50] |
| 7 Myocardial infarction ‐ NSTEMI/STEMI/UAP Show forest plot | 7 | 2098 | Risk Ratio (M‐H, Random, 95% CI) | 1.12 [0.57, 2.18] |
| 7.1 STEMI | 5 | 1889 | Risk Ratio (M‐H, Random, 95% CI) | 1.07 [0.45, 2.54] |
| 7.2 Mixed | 2 | 209 | Risk Ratio (M‐H, Random, 95% CI) | 1.19 [0.42, 3.40] |
| 8 Myocardial infarction ‐ Registration status Show forest plot | 14 | 6825 | Risk Ratio (M‐H, Random, 95% CI) | 0.89 [0.74, 1.08] |
| 8.1 Pre‐registration | 4 | 1793 | Risk Ratio (M‐H, Random, 95% CI) | 1.17 [0.48, 2.88] |
| 8.2 No registration | 10 | 5032 | Risk Ratio (M‐H, Random, 95% CI) | 0.86 [0.68, 1.09] |
| 9 Myocardial infarction ‐ Length of intervention period Show forest plot | 14 | 6913 | Risk Ratio (M‐H, Random, 95% CI) | 0.90 [0.71, 1.13] |
| 9.1 0 to 7 days length of intervention | 5 | 1183 | Risk Ratio (M‐H, Random, 95% CI) | 1.51 [0.46, 4.96] |
| 9.2 7 to 30 days length of intervention | 1 | 88 | Risk Ratio (M‐H, Random, 95% CI) | 6.57 [0.82, 52.35] |
| 9.3 1 month and more length of intervention | 9 | 5642 | Risk Ratio (M‐H, Random, 95% CI) | 0.88 [0.74, 1.06] |
| 10 Myocardial infarction ‐ Funding Show forest plot | 14 | 6825 | Risk Ratio (M‐H, Fixed, 95% CI) | 0.89 [0.77, 1.04] |
| 10.1 Industry funded or unknown funded trials | 11 | 5665 | Risk Ratio (M‐H, Fixed, 95% CI) | 0.90 [0.77, 1.04] |
| 10.2 Non‐industry funded trials | 3 | 1160 | Risk Ratio (M‐H, Fixed, 95% CI) | 0.79 [0.31, 2.04] |
| 11 Myocardial infarction ‐ 'Best‐worst case scenario' Show forest plot | 14 | 6951 | Risk Ratio (M‐H, Random, 95% CI) | 0.56 [0.37, 0.85] |
| 12 Myocardial infarction ‐ 'Worst‐best case scenario' Show forest plot | 14 | 6951 | Risk Ratio (M‐H, Fixed, 95% CI) | 1.10 [0.95, 1.26] |
| Outcome or subgroup title | No. of studies | No. of participants | Statistical method | Effect size |
| 1 Angina on a dichotomous scale Show forest plot | 3 | 98 | Risk Ratio (M‐H, Random, 95% CI) | 0.70 [0.31, 1.58] |
| Outcome or subgroup title | No. of studies | No. of participants | Statistical method | Effect size |
| 1 Angina on a dichotomous scale Show forest plot | 2 | 844 | Risk Ratio (M‐H, Random, 95% CI) | 0.64 [0.18, 2.30] |