Intraoperative neuromonitoring versus visual nerve identification for prevention of recurrent laryngeal nerve injury in adults undergoing thyroid surgery
Abstract
This is a protocol for a Cochrane Review (Intervention). The objectives are as follows:
To assess the effects of intraoperative neuromonitoring (IONM) versus visual nerve identification for prevention of recurrent laryngeal nerve injury in adults undergoing thyroid surgery.
Background
Description of the condition
The visual identification of the recurrent inferior laryngeal nerve (RILN) is considered the safest method to prevent nerve injury during thyroid and parathyroid surgery (Deniwar 2015a). Generally, the rate of nerve injury is higher in cases of thyroid carcinoma, Flajani‐Graves‐Basedow disease, goitre, thyroid reoperation surgery, failure of nerve identification and surgeon’s low experience (Calò 2014a). Intraoperative neuromonitoring (IONM) has been introduced in order to facilitate the localisation of the RILN and prevent its injury during surgery (Duclos 2011). A study that included 686 participants demonstrated that use of IONM decreased the incidence of RILN palsy (from 7.6% to 4.7%) (Duclos 2011). IONM was reported to reduce the prevalence of transient RILN injury (Barczyński 2009), and to increase surgeon's accuracy during nerve preparation, particularly during video‐assisted thyroid surgery (Dionigi 2009). When used by experienced thyroid surgeons (RILN injury rate of less than 1%), the IONM did not show a significant improvement in the postsurgery outcomes (Barczyński 2009). However, in procedures that low‐volume surgeons performed, the use of IONM was associated with a significant reduction in postsurgical permanent recurrent laryngeal nerve palsy (Dralle 2004). Low‐volume surgeons was defined as surgeons that perform fewer than 25 thyroidectomies per year (Adam 2016). With low‐volume surgeons, RILN monitoring helped to reduce the permanent RILN palsy rate (0.9%) (Sosa 1998). With low‐volume surgeons, the permanent RILN palsy rates were highest after visual nerve identification (1.4%) (Sosa 1998). RILN monitoring might be a useful technique that guides the cautious handling of the recurrent nerve by low‐volume surgeons. High‐volume surgeons may benefit from RILN monitoring in difficult situations (Dralle 2004). Zheng 2013 published a meta‐analysis of 14 different studies, which included 36,487 participants, and concluded that IONM decreases the risk of transient RILN palsy without affecting the rates of permanent injuries.
Description of the intervention
The RILN is normally identified by palpation and surgical dissection. The IONM was introduced in the attempt to identify the nerve by using an electrode (Dequanter 2015). In order to measure the nerve response, the electric field is converted to an acoustic signal, the potentials of which are recorded. In procedures performed by low‐volume surgeons, the use of IONM was associated with a significant reduction in postsurgical permanent recurrent laryngeal nerve palsy.
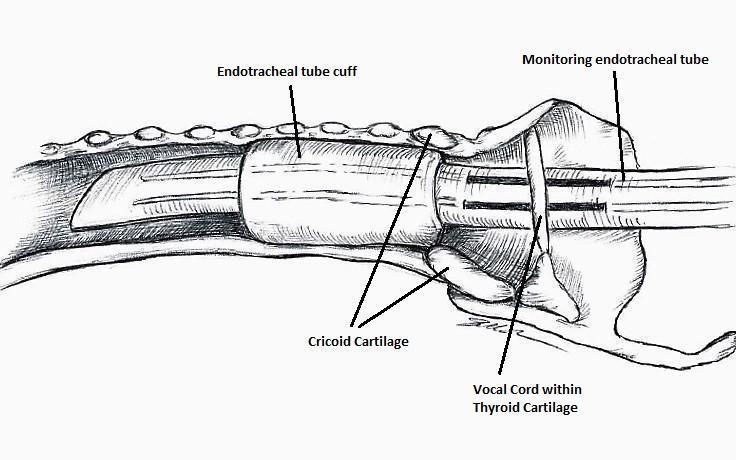
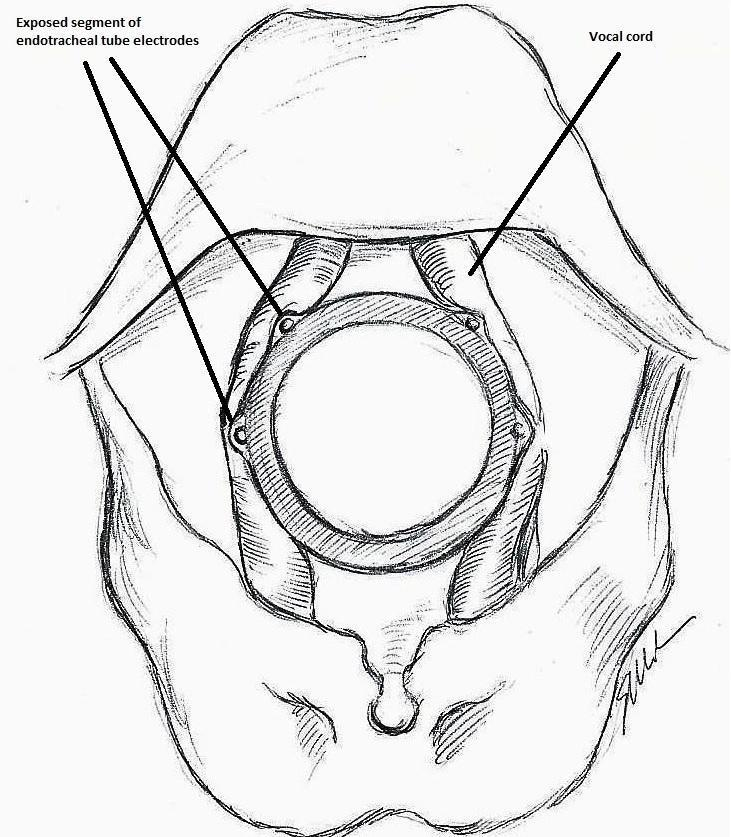
The IONM system operates with two surface electrodes positioned upon an endotracheal tube, which is 7 mm in diameter. During intubation, the anaesthetist inserts, under direct vision, the endotracheal tube between the vocal folds (Figure 1). The RILN is stimulated by a monopolar electrode, using the interrupted stimulation technique (1 mA, 100 ms impulse duration and 4 Hz frequency). In the case of a bifurcated RILN, the poststimulation response for each nerve branch is included. The endotracheal tube electromyography is used to detect the adduction of the vocal folds (Figure 2). A posterior cricoarytenoid muscle contraction, revealed by direct fingers palpation, is used to detect the abduction of the vocal folds (Figure 3).
Nerve integrity monitoring endotracheal tube for electromyography signals of a patient's laryngeal muscles
Monitoring endotracheal tube in position positioned at the patient's vocal folds

Basic monitoring equipment setup: ET = endotracheal tube; REC = recording electrodes; GND = ground electrodes; EMG = electromyography
During the intervention, the thyroid lobe is shifted medially and the upper thyroid vessels are tied and cut. The RILN is then identified, dissected and stimulated. At the beginning of thyroidectomy, to make sure that the neuromonitoring system is working, the vagus nerve is stimulated. Proceeding with the operation, the inferior laryngeal nerve is repeatedly stimulated. At the end of the operation, both the vagus and the recurrent nerve are stimulated in the attempt to predict the postoperative outcome (Calò 2014b). In IONM, the first stimulating electrode is used to contact with the RILN, followed with the conduction of the electrical stimulation of the RILN. The second recording electrode receives the electrical signal and a monitor records the signal with a sound. If the RILN is nearby, the surgeon sees the waveform on the displayer at the same time (Zheng 2015). Both the stimulating and recording electrodes are positioned on the sternum or the shoulder, while the interface connector device is linked to the monitoring system. Sonor systems with alarms indicate signal abnormalities, while optic waveform monitors show amplitude, threshold and latency records, which can discriminate true from false signals, giving a real time feedback by monitoring electromyography (EMG) responses.
IONM can also be performed in a continuous way, for instance when the stimulating and recording systems are connected to an interface connector device, which is linked to grounding electrodes. Continuous IONM can disclose earlier changes in nerve function, which may be a warning of impending nerve injury (Deniwar 2015a). Continuous IONM seems to be superior to intermitted intraoperative neural monitoring because it enhances standardisation by permanent vagus nerve stimulation, and it provides entire and constant RILN function monitoring as the surgeon dissects and removes the thyroid gland.
Following stimulation of the ipsilateral vagus nerve, the absence of an EMG signal is defined as a loss of signal. An intraoperative algorithm is employed to differentiate between true and false loss of signal. In cases of true loss of signal, the neuromapping technique is used to determine the type of nerve damage and localise the injury site. Following thyroid lobectomy, the loss of signal after vagal stimulation is considered a positive test result. When the laryngoscopy confirms an ipsilateral vocal cord paresis, it is considered a true positive result. Conversely, a normal mobility of the ipsilateral vocal fold is considered a false positive result. Following thyroid lobectomy, the detection of a normal signal after vagal stimulation is considered a negative test result. When the postoperative laryngoscopy confirms a normal mobility of the ipsilateral vocal fold, it is considered a true negative result. Conversely, the detection of an ipsilateral vocal fold paresis is considered as a false negative result of the EMG signal.
Co‐operation between the surgeon and the anaesthesiologist is essential for successful neuromonitoring. The use of neuromuscular blocking agents should be carefully considered and avoided if possible, as they reduce response amplitudes from the vagus, the RILN and the external branch of the superior laryngeal nerve, which may hinder injury detection.
Adverse effects of the intervention
Chen and colleagues analysed the adverse effects of the procedure of neuromonitoring in a cohort of 3029 patients undergoing thyroid surgery: preoperative complications (bucking, deep tracheal catheter placement, tracheal catheter rotation, over‐secretion and unstable signal, unstable blood flow dynamics and oral mucosa injury) and reported postoperative complications (throat pain, pharyngeal discomfort, hoarse voice and joint half‐dislocation, inhalation pneumonia, dry eye syndrome, ear and neck numbness and conjunctival congestion) (Chen 2015).
How the intervention might work
During surgery for thyroid carcinoma with lymph nodes dissection, thyroid reoperation surgery, or in the presence of anatomic variability, IONM can help surgeons to identify the RILN (Dequanter 2015), and may offer a real benefit for lowering nerve injury rates (Malik 2016). Regarding the vocal cord functionality, an intact monitoring signal at the end of the surgery is associated with a positive outcome. In fact, the negative predictive value of the procedure is very high (97% to 99%) (Calò 2014b). This means that if 100 patients have an intact monitoring signal at the end of the surgery, 97 to 99 patients out of these 100 patients will have normal vocal cord functionality. On the other hand, with a loss of signal at the end of operation, the positive predictive value of the procedure is low (33% to 37%), and the occurrence of vocal cord palsy is unpredictable (Calò 2014b). This means that if 100 patients have a loss of signal at the end of operation, just 33 to 37 out of these 100 patients will have vocal cord palsy. During thyroid surgery, neuromonitoring facilitates the identification of RILN, verifying the functional integrity of the nerve (Chiang 2011; Dequanter 2015). In fact, a positive IONM can demonstrate intact nerve function intraoperatively (Chiang 2010). Because most of the injured nerves appear intact, IONM can properly prognosticate postoperative nerve function, which is difficult to detect by visual identification (Dralle 2004). Neuromonitoring can also detect anatomical variation and abnormal courses of the nerves, which are at high risk of injury if not detected (Deniwar 2015b).
Why it is important to do this review
Recent guidelines from the American Academy of Otolaryngology ‐ Head and Neck Surgery recommend IONM use in thyroid surgery to prevent nerve damage (Chandrasekhar 2013). IONM is currently used in 80% of thyroidectomies performed by neck surgeons and by more than 50% of general surgeons in the USA. It is more commonly used by higher‐volume surgeons (Al‐Qurayshi 2016). More clinical trials are needed to further clarify the effects of IONM. In the meta‐analysis by Higgins 2011a and in the recent meta‐analysis by Pisanu 2014, IONM and visual nerve identification did not demonstrate a statistically significant difference in rates of transient, total or persistent vocal fold palsy. Pisanu 2014 analysed 20 trials that included 23,152 participants and showed that overall RILN palsy rates for IONM versus visualisation alone were 3.5% versus 3.7%. The role of IONM during thyroid surgery is still debatable, as no consensus exists regarding the prevention of recurrent nerve injury (Deniwar 2015a). There are three primary reasons that this review will improve upon the previous reviews by Higgins 2011a and Pisanu 2014. First, both Higgins 2011a and Pisanu 2014 highlighted the need for more studies on this topic that have fewer methodological flaws; both reviews called for more and better controlled randomised controlled trials (RCTs). Pisanu 2014 specifically called for further studies that include high‐quality multicentre, prospective, randomised trials based on strict criteria of standardisation and subsequent meta‐analysis to verify the outcomes of interest. If those calls have been heeded, we would expect this Cochrane review to include more trials with better methodological quality. Second, we will include trials published since the last search in August 2013 by Pisanu 2014. Finally, we propose to investigate additional patient‐important outcomes that have not yet been investigated in previous reviews, such as health‐related quality of life, all‐cause mortality and socioeconomic effects.
Objectives
To assess the effects of intraoperative neuromonitoring (IONM) versus visual nerve identification for prevention of recurrent laryngeal nerve injury in adults undergoing thyroid surgery.
Methods
Criteria for considering studies for this review
Types of studies
We will include randomised controlled trials (RCTs).
Types of participants
Adults (older than 18 years) undergoing thyroidectomy.
A thyroidectomy is an operation that involves the surgical removal of all or part of the thyroid gland. We will evaluate two techniques in this review: partial and total thyroidectomy. We define partial thyroidectomy as the surgical removal of a portion of the thyroid gland and total thyroidectomy as the surgical removal of the entire gland.
Types of interventions
We plan to investigate the following comparison of intervention versus control/comparator.
Intervention
-
Intraoperative neuromonitoring (IONM) with and without visual nerve identification during thyroidectomy.
Comparator
-
Visual nerve identification only during thyroidectomy.
Concomitant interventions will have to be the same in both the intervention and comparator groups to establish fair comparisons.
Minimum duration of follow‐up
Minimal duration of follow‐up will be six months.
We will define extended follow‐up periods (also called open‐label extension studies) as follow‐up of participants once the original trial, as specified in the trial protocol. has been terminated. However, such studies are frequently of an observational nature and we will only evaluate them for adverse events (Buch 2011; Megan 2012).
Specific exclusion criteria
-
Clinical trials that evaluate people with a previous history of neck surgery and laryngeal nerve injury.
Types of outcome measures
We will not exclude a trial only on the basis that one or several of our primary or secondary outcome measures were not reported in the publication. In case none of our primary or secondary outcomes was reported in the trial we will not include this trial but will provide some basic information in an additional table.
Primary outcomes
-
Permanent recurrent inferior laryngeal nerve (RILN) palsy.
-
Transient RILN palsy.
-
Health‐related quality of life.
Secondary outcomes
-
Adverse events other than permanent or transient RILN palsy.
-
Operative time.
-
All‐cause mortality.
-
Socioeconomic effects.
Method and timing of outcome measurement
-
Permanent RILN palsy: defined as an injury detected clinically, by laryngoscopy or both in which the motility of the vocal cords does not recover within six months after surgery.
-
Transient RILN palsy: defined as an injury detected clinically, by laryngoscopy or both in which the motility of the vocal cords recovered within six months after surgery.
-
Health‐related quality of life: evaluated by a validated instrument such as the Short Form 36 (SF‐36) or Quality of Life‐Thyroid Version (QOL‐TV) measured at 30 days and thereafter.
-
Adverse events other than permanent or transient RILN palsy: such as pain and measured at any time after participants were randomised to intervention/comparator groups.
-
Operative time: defined as the time from the first skin incision to skin closure; measured at the end of the operation.
-
All‐cause mortality: defined as death from any cause during the first 30 days after the operation (early mortality) and later (late mortality).
-
Socioeconomic effects: direct costs, including those related to surgical supplies and to hospital stay; measured at 30 days from the operation.
'Summary of findings' table
We will present a 'Summary of finding' table to report the following outcomes, listed according to priority.
-
Permanent RILN palsy.
-
Transient RILN palsy.
-
Health‐related quality of life.
-
Adverse events other than permanent or transient RILN palsy.
-
Operative time.
-
All‐cause mortality.
-
Socioeconomic effects.
Search methods for identification of studies
Electronic searches
We will search the following sources from inception of each database to the specified date and will place no restrictions on the language of publication.
-
Cochrane Central Register of Controlled Trials (CENTRAL) via the Cochrane Register of Studies Online (CRSO).
-
MEDLINE Ovid (Epub Ahead of Print, In‐Process & Other Non‐Indexed Citations, Ovid MEDLINE(R) Daily and Ovid MEDLINE(R); from 1946 onwards).
-
Embase Ovid (from 1974 onwards).
-
ClinicalTrials.gov (www.clinicaltrials.gov).
-
World Health Organization International Clinical Trials Registry Platform (ICTRP) (www.who.int/trialsearch/).
We will continuously apply a MEDLINE (via Ovid SP) email alert service established by the Cochrane Metabolic and Endocrine Disorders (CMED) Group, to identify newly published trials using the same search strategy as described for MEDLINE (for details on search strategies, see Appendix 1). After supplying the final review draft for editorial approval, the CMED Group will perform a complete updated search on all databases available at the editorial office and send the results to the review authors. Should we identify new trials for inclusion, we will evaluate these, incorporate the findings into our review and resubmit another review draft (Beller 2013).
If we detect additional relevant key words during any electronic or other searches, we will modify the electronic search strategies to incorporate these terms and will document the changes to the search strategy.
Searching other resources
We will try to identify other potentially eligible trials or ancillary publications by searching the reference lists of included trials, systematic reviews, meta‐analyses and health technology assessment reports. In addition we will contact the authors of included trials to identify any additional information on the retrieved trials and to determine if further trials exist, which we may have missed.
We will not use abstracts or conference proceedings for data extraction because this information source does not fulfil the Consolidated Standards of Reporting Trials (CONSORT) requirements which is "an evidence‐based, minimum set of recommendations for reporting randomized trials" (CONSORT 2016; Scherer 2007).
Data collection and analysis
Selection of studies
Two review authors (RC, VD) will independently screen the abstract or title, or both, of every record retrieved, to determine which trials we should assess further. We will investigate the full‐ text articles of all potentially relevant articles. We will resolve discrepancies through consensus or by recourse to a third review author (AA). If we cannot resolve a disagreement, we will categorise the trial as a 'study awaiting classification' and will contact the trial authors for clarification. We will present an adapted PRISMA flow diagram to show the process of trial selection (Liberati 2009). We will list all articles excluded after full‐text assessment in a 'Characteristics of excluded studies' table and will provide the reasons for exclusion.
Data extraction and management
For trials that fulfil inclusion criteria, two review authors (RC, VD) will independently extract key participant and intervention characteristics. We will report data on efficacy outcomes and adverse events using standard data extraction sheets from the CMED Group. We will resolve any disagreements by discussion or, if required, we will consult a third review author (AA).
We will provide information about potentially relevant ongoing trials, including trial identifiers, in the 'Characteristics of ongoing trials' table and in a joint appendix 'Matrix of trial endpoint (publications and trial documents)'. We will try to find the protocol for each included trial and will report primary, secondary and other outcomes in comparison with data in publications in a joint appendix.
We will email all authors of included trials to enquire whether they would be willing to answer questions regarding their trials. We will present the results of this survey in an appendix. We will thereafter seek relevant missing information on the trial from the primary trial author(s), if required.
Dealing with duplicate and companion publications
In the event of duplicate publications, companion documents or multiple reports of a primary trial, we will maximise the information yield by collating all available data and we will use the most complete dataset aggregated across all known publications. We will list duplicate publications, companion documents, multiple reports of a primary trial and trial documents of included trials (such as trial registry information) as secondary references under the study identifier (ID) of the included trial. Furthermore, we will also list duplicate publications, companion documents, multiple reports of a trial and trial documents of excluded trials (such as trial registry information) as secondary references under the study ID of the excluded trial.
Data from clinical trial registers
If data from included trials are available as study results in clinical trial registers such as ClinicalTrials.gov or similar sources, we will make full use of this information and extract the data. If there is also a full publication of the trial, we will collate and critically appraise all available data. If an included trial is marked as a completed study in a clinical trial register but no additional information (study results, publication or both) is available, we will add this trial to the 'Characteristics of studies awaiting classification' table.
Assessment of risk of bias in included studies
Two review authors (RC, VD) will independently assess the risk of bias of each included trial. We will resolve any disagreements by consensus, or by consulting a third review author (AA). In cases of disagreement, we will consult the rest of the review author team and we will make a judgement based on consensus. If adequate information is unavailable from the trials, trial protocols or both, we will contact the trial authors to recover missing data on 'Risk of bias' items.
We will use the Cochrane 'Risk of bias' assessment tool (Higgins 2011b; Higgins 2011c), and we will judge the 'Risk of bias' criteria as at either low, high or unclear risk. We will evaluate individual bias items as described in the Cochrane Handbook for Systematic Reviews of Interventions according to the criteria and associated categorisations contained therein (Higgins 2011c).
Random sequence generation (selection bias due to inadequate generation of a randomised sequence) ‐ assessment at trial level
For each included trial we will describe the method used to generate the allocation sequence in sufficient detail to allow an assessment of whether it should produce comparable groups.
-
Low risk of bias: the trial authors achieved sequence generation using computer‐generated random numbers or a random numbers table. Drawing of lots, tossing a coin, shuffling cards or envelopes, and throwing dice are adequate if an independent person performed this who was not otherwise involved in the trial. We will consider the use of the minimisation technique as equivalent to being random.
-
Unclear risk of bias: insufficient information about the sequence generation process.
-
High risk of bias: the sequence generation method was non‐random or quasi‐random (e.g. sequence generated by odd or even date of birth; sequence generated by some rule based on date (or day) of admission; sequence generated by some rule based on hospital or clinic record number; allocation by judgement of the clinician; allocation by preference of the participant; allocation based on the results of a laboratory test or a series of tests; or allocation by availability of the intervention).
Allocation concealment (selection bias due to inadequate concealment of allocation prior to assignment) ‐ assessment at trial level
We will describe for each included trial the method used to conceal allocation to interventions prior to assignment and we will assess whether intervention allocation could have been foreseen in advance of or during recruitment, or changed after assignment.
-
Low risk of bias: central allocation (including telephone, interactive voice‐recorder, internet‐based and pharmacy‐controlled randomisation); sequentially numbered drug containers of identical appearance; sequentially numbered, opaque, sealed envelopes.
-
Unclear risk of bias: insufficient information about the allocation concealment.
-
High risk of bias: using an open random allocation schedule (e.g. a list of random numbers); assignment envelopes were used without appropriate safeguards; alternation or rotation; date of birth; case record number; any other explicitly unconcealed procedure.
We will also evaluate trial baseline data to incorporate assessment of baseline imbalance into the 'Risk of bias' judgement for selection bias (Corbett 2014). Chance imbalances may also affect judgements on the risk of attrition bias. In the case of unadjusted analyses, we will distinguish between trials we rate as at low risk of bias on the basis of both randomisation methods and baseline similarity, and trials we judge as at low risk of bias on the basis of baseline similarity alone (Corbett 2014). We will re‐classify judgements of unclear, low or high risk of selection bias as specified in Appendix 2.
Blinding of participants and study personnel (performance bias due to knowledge of the allocated interventions by participants and personnel during the trial) ‐ assessment at outcome level
We will evaluate the risk of detection bias separately for each outcome (Hróbjartsson 2013). We will note whether endpoints were self‐reported, investigator‐assessed or adjudicated outcome measures (see below).
-
Low risk of bias: blinding of participants and key study personnel is ensured, and it is unlikely that the blinding could have been broken; no blinding or incomplete blinding, but we judge that the outcome is unlikely to have been influenced by lack of blinding.
-
Unclear risk of bias: insufficient information about the blinding of participants and study personnel; the trial does not address this outcome.
-
High risk of bias: no blinding or incomplete blinding, and the outcome is likely to have been influenced by lack of blinding; blinding of trial participants and key personnel attempted, but likely that the blinding could have been broken, and the outcome is likely to be influenced by lack of blinding.
Blinding of outcome assessment (detection bias due to knowledge of the allocated interventions by outcome assessment) ‐ assessment at outcome level
We will evaluate the risk of detection bias separately for each outcome (Hróbjartsson 2013). We will note whether endpoints were self‐reported, investigator‐assessed or adjudicated outcome measures (see below).
-
Low risk of bias: blinding of outcome assessment is ensured, and it is unlikely that the blinding could have been broken; no blinding of outcome assessment, but we judge that the outcome measurement is unlikely to have been influenced by lack of blinding.
-
Unclear risk of bias: insufficient information about the blinding of outcome assessors; the trial did not address this outcome.
-
High risk of bias: no blinding of outcome assessment, and the outcome measurement is likely to have been influenced by lack of blinding; blinding of outcome assessment, but likely that the blinding could have been broken, and the outcome measurement is likely to be influenced by lack of blinding.
Incomplete outcome data (attrition bias due to amount, nature or handling of incomplete outcome data) ‐ assessment at outcome level
For each included trial and or each outcome, we will describe the completeness of data, including attrition and exclusions from the analyses. We will state whether the trial reported attrition and exclusions, and the number of participants included in the analysis at each stage (compared with the number of randomised participants per intervention/comparator groups). We will also note if the trial reported the reasons for attrition or exclusion and whether missing data were balanced across groups or were related to outcomes. We will consider the implications of missing outcome data per outcome such as high dropout rates (e.g. above 15%) or disparate attrition rates (e.g. difference of 10% or more between trial arms).
-
Low risk of bias: no missing outcome data; reasons for missing outcome data unlikely to be related to true outcome (for survival data, censoring unlikely to introduce bias); missing outcome data balanced in numbers across intervention groups, with similar reasons for missing data across groups; for dichotomous outcome data, the proportion of missing outcomes compared with observed event risk is not enough to have a clinically relevant impact on the intervention effect estimate; for continuous outcome data, plausible effect size (mean difference or standardised mean difference) among missing outcomes is not enough to have a clinically relevant impact on observed effect size; appropriate methods, such as multiple imputation, were used to handle missing data.
-
Unclear risk of bias: insufficient information to assess whether missing data in combination with the method used to handle missing data were likely to induce bias; the trial did not address this outcome.
-
High risk of bias: reason for missing outcome data is likely to be related to true outcome, with either imbalance in numbers or reasons for missing data across intervention groups; for dichotomous outcome data, the proportion of missing outcomes compared with observed event risk enough to induce clinically relevant bias in the intervention effect estimate; for continuous outcome data, plausible effect size (mean difference or standardised mean difference) among missing outcomes enough to induce clinically‐relevant bias in observed effect size; 'as‐treated' or similar analysis done with substantial departure of the intervention received from that assigned at randomisation; potentially inappropriate application of simple imputation.
Selective reporting (reporting bias due to selective outcome reporting) ‐ assessment at trial level
We will assess outcome reporting bias by integrating the results of the appendix 'Matrix of trial endpoints (publications and trial documents)' (Boutron 2014; Jones 2015; Mathieu 2009), with those of the appendix 'High risk of outcome reporting bias according to ORBIT classification' (Kirkham 2010). This analysis will form the basis for the judgement of selective reporting.
-
Low risk of bias: the trial protocol is available and all of the trial's prespecified (primary and secondary) outcomes that are of interest in the review have been reported in the prespecified way; the study protocol is unavailable, but it is clear that the published reports include all expected outcomes (ORBIT classification).
-
Unclear risk of bias: insufficient information about selective reporting.
-
High risk of bias: not all of the trial's pre‐specified primary outcomes are reported; one or more primary outcomes are reported using measurements, analysis methods or subsets of the data (e.g. subscales) that were not prespecified; one or more reported primary outcomes were not prespecified (unless clear justification for their reporting is provided, such as an unexpected adverse effect); one or more outcomes of interest in the Cochrane review are reported incompletely so that we cannot enter them in a meta‐analysis; the trial report fails to include results for a key outcome that we would expect to have been reported for such a trial (ORBIT classification).
Other bias (bias due to problems not covered elsewhere) ‐ assessment at trial level
-
Low risk of bias: the trial appears to be free of other sources of bias.
-
Unclear risk of bias: there is insufficient information to assess whether an important risk of bias existed; insufficient rationale or evidence that an identified problem introduced bias.
-
High risk of bias: the trial has a potential source of bias related to the specific trial design used; the trial has been claimed to have been fraudulent; or the trial had some other serious problem.
We will present a 'Risk of bias' graph and a 'Risk of bias' summary figure.
We will distinguish between self‐reported, investigator‐assessed and adjudicated outcome measures.
We define the following outcomes as self‐reported.
-
Permanent RILN palsy, as reported by trial participants.
-
Transient RILN palsy, as reported by trial participants.
-
Health‐related quality of life.
-
Adverse events other than permanent or transient RILN palsy, as reported by trial participants.
We define the following outcomes as investigator‐assessed.
-
Permanent RILN palsy, as measured by trial personnel.
-
Transient RILN palsy, as measured by trial personnel.
-
Adverse events other than permanent or transient RILN palsy, as measured by trial personnel.
-
All‐cause mortality.
-
Operative time.
-
Socioeconomic effects.
Summary assessment of risk of bias
Risk of bias for a trial across outcomes: some 'Risk of bias' domains, such as selection bias (sequence generation and allocation sequence concealment), affect the risk of bias across all outcome measures in a trial. In case of high risk of selection bias, we will mark all endpoints investigated in the associated trial as at high risk. Otherwise, we will not perform a summary assessment of the risk of bias across all outcomes for a trial.
Risk of bias for an outcome within a trial and across domains: we will assess the risk of bias for an outcome measure by including all entries relevant to that outcome (i.e. both trial‐level entries and outcome‐specific entries). We consider low risk of bias to denote a low risk of bias for all key domains, unclear risk to denote an unclear risk of bias for one or more key domains and high risk to denote a high risk of bias for one or more key domains.
Risk of bias for an outcome across trials and across domains: these are our main summary assessments that we will incorporate into our judgements about the quality of evidence in the 'Summary of finding' tables. We will define outcomes as at low risk of bias when most information comes from trials at low risk of bias, unclear risk when most information comes from trials at low or unclear risk of bias, and high risk when a sufficient proportion of information comes from trials at high risk of bias.
Measures of treatment effect
When at least two included trials are available for a comparison and a given outcome, we will try to express dichotomous data as a risk ratio (RR) or odds ratio (OR) with 95% confidence interval (CI). For continuous outcomes measured on the same scale (e.g. weight loss in kg) we will estimate the intervention effect using the mean difference with 95% CI. For continuous outcomes that measure the same underlying concept (e.g. health‐related quality of life) but use different measurement scales, we will calculate the standardised mean difference (SMD). We will express time‐to‐event data as a hazard ratio with 95% CI.
Unit of analysis issues
We will take into account the level at which randomisation occurred, such as cross‐over trials, cluster‐randomised trials and multiple observations for the same outcome. If more than one comparison from the same trial is eligible for inclusion in the same meta‐analysis, we will either combine groups to create a single pair‐wise comparison or appropriately reduce the sample size so that the same participants do not contribute multiply (splitting the 'shared' group into two or more groups). While the latter approach offers some solution to adjusting the precision of the comparison, it does not account for correlation arising from the same set of participants being in multiple comparisons (Higgins 2011d).
We will attempt to reanalyse cluster‐RCTs that have not appropriately adjusted for potential clustering of participants within clusters in their analyses. The variance of the intervention effects will be inflated by a design effect. Calculation of a design effect involves estimation of an intra‐cluster correlation (ICC). We will obtain estimates of ICCs through contact with the trial authors, or impute them using estimates from other included trials that report ICCs, or using external estimates from empirical research (e.g. Bell 2013). We plan to examine the impact of clustering using sensitivity analyses.
Dealing with missing data
If possible, we will obtain missing data from the authors of the included trials. We will carefully evaluate important numerical data such as screened, randomly assigned participants as well as intention‐to‐treat, and as‐treated and per‐protocol populations. We will investigate attrition rates (e.g. dropouts, losses to follow‐up, withdrawals), and we will critically appraise issues concerning missing data and use of imputation methods (e.g. last observation carried forward).
In trials where the standard deviation (SD) of the outcome is not available at follow‐up or cannot be recreated, we will standardise by the average of the pooled baseline SD from those trials that reported this information.
Where included trials do not report means and SDs for outcomes and we do not receive the necessary information from trial authors, we will impute these values by estimating the mean and variance from the median, range and the size of the sample (Hozo 2005).
We will investigate the impact of imputation on meta‐analyses by performing sensitivity analyses and we will report per outcome which trials were included with imputed SDs.
Assessment of heterogeneity
In the event of substantial clinical or methodological heterogeneity, we will not report trial results as the pooled effect estimate in a meta‐analysis.
We will identify heterogeneity (inconsistency) by visually inspecting the forest plots and by using a standard Chi² test with a significance level of α = 0.1. In view of the low power of this test, we will also consider the I² statistic, which quantifies inconsistency across trials to assess the impact of heterogeneity on the meta‐analysis (Higgins 2002; Higgins 2003). An I² statistic value ≥ 75% indicates a considerable level of heterogeneity (Deeks 2011).
When we find heterogeneity, we will attempt to determine the possible reasons for it by examining individual trial and subgroup characteristics.
Assessment of reporting biases
If we include 10 or more trials that investigate a particular outcome, we will use funnel plots to assess small‐trial effects. Several explanations may account for funnel plot asymmetry, including true heterogeneity of effect with respect to trial size, poor methodological design (and hence bias of small trials) and publication bias. Therefore we will interpret the results carefully (Sterne 2011).
Data synthesis
We plan to undertake (or display) a meta‐analysis only if we judge participants, interventions, comparisons and outcomes to be sufficiently similar to ensure an answer that is clinically meaningful. Unless good evidence shows homogeneous effects across trials, we will primarily summarise low risk of bias data using a random‐effects model (Wood 2008). We will interpret random‐effects meta‐analyses with due consideration to the whole distribution of effects, ideally by presenting a prediction interval (Higgins 2009). A prediction interval specifies a predicted range for the true treatment effect in an individual trial (Riley 2011). For rare events such as event rates below 1% we will use Peto's odds ratio method, provided that there is no substantial imbalance between intervention and comparator group sizes and intervention effects are not exceptionally large. In addition, we will also perform statistical analyses according to the statistical guidelines presented in the Cochrane Handbook for Systematic Reviews of Interventions (Deeks 2011).
Quality of evidence
We will present the overall quality of the evidence for each outcome specified under 'Types of outcome measures: Summary of findings' according to the GRADE approach, which takes into account issues related to internal validity (risk of bias, inconsistency, imprecision, publication bias) and also to external validity, such as directness of results. Two review authors (NN, NN) will independently rate the quality of the evidence for each outcome. We will present a summary of the evidence in a 'Summary of findings' table. This will provide key information about the best estimate of the magnitude of the effect, in relative terms and as absolute differences, for each relevant comparison of alternative management strategies, numbers of participants and trials that address each important outcome and a rating of overall confidence in effect estimates for each outcome. We will create the 'Summary of findings' table based on the methods described in the Cochrane Handbook for Systematic Reviews of Interventions (Schünemann 2011), using Review Manager 5 (RevMan 5) table editor (RevMan 2014). We will include an appendix titled 'Checklist to aid consistency and reproducibility of GRADE assessments' (Meader 2014), to help with standardisation of the 'Summary of findings' tables. Alternatively, we will use the GRADEpro Guideline Development Tool (GDT) software (GRADEproGDT 2014), and will present evidence profile tables as an appendix. We will present results for the outcomes as described in the Types of outcome measures section. If meta‐analysis is not possible, we will present the results narratively in the 'Summary of findings' table. We will justify all decisions to downgrade the quality of trials using footnotes and we will make comments to aid the reader's understanding of the Cochrane review where necessary.
Subgroup analysis and investigation of heterogeneity
We expect the following characteristics to introduce clinical heterogeneity, and we plan to carry out the following subgroup analyses including investigation of interactions (Altman 2003).
-
Partial versus total thyroidectomy.
-
Thyroidectomy for cancer versus benign thyroid disease.
-
Low vs high experience in thyroid surgery; "low experience in thyroid surgery" is defined as case‐volume of thyroidectomies less than 25 per year (Adam 2016).
-
Residents in general surgery versus surgeons.
-
Participants aged less than 75 years versus ≥ 75 years.
-
Participants with a body mass index of less than 35 kg/m² versus body mass index ≥ 35 kg/m².
-
Thyroidectomy with tie and clamp versus vascular dissection, cutting and sealing simultaneously (UltraCision Harmonic® scalpel) or a bipolar vascular sealing system (LigaSure®).
Sensitivity analysis
We plan to perform sensitivity analyses to explore the influence of the following factors (when applicable) on effect sizes by restricting analysis to the following.
-
Published trials.
-
The effect of risk of bias, as specified in the Assessment of risk of bias in included studies section.
-
Very long or large trials to establish the extent to which they dominate the results.
-
Using the following filters: diagnostic criteria, imputation, language of publication, source of funding (industry versus other), or country.
We will also test the robustness of results by repeating the analyses using different measures of effect size (RR, OR, etc) and different statistical models (fixed‐effect and random‐effects models).

Nerve integrity monitoring endotracheal tube for electromyography signals of a patient's laryngeal muscles

Monitoring endotracheal tube in position positioned at the patient's vocal folds

Basic monitoring equipment setup: ET = endotracheal tube; REC = recording electrodes; GND = ground electrodes; EMG = electromyography