Neuromonitorización intraoperatoria versus identificación nerviosa visual para la prevención de la lesión del nervio laríngeo recurrente en pacientes adultos sometidos a cirugía tiroidea
Resumen
Antecedentes
La lesión del nervio laríngeo recurrente inferior (NLRI) sigue siendo una de las complicaciones posoperatorias graves de la cirugía de la glándula tiroidea y paratiroidea. El daño a este nervio puede dar lugar a una parálisis temporal o permanente, que se asocia con paresia o parálisis de la cuerda vocal. La identificación visual del NLRI es un procedimiento común para prevenir la lesión nerviosa durante la cirugía tiroidea y paratiroidea. Recientemente, se ha introducido la neuromonitorización intraoperatoria (NMIO) para facilitar la localización de los nervios y prevenir la lesión durante la cirugía. La NMIO permite la identificación de los nervios mediante un electrodo, en que se convierte el campo eléctrico en una señal acústica para medir la respuesta nerviosa.
Objetivos
Evaluar los efectos de la NMIO versus la identificación nerviosa visual para la prevención de la lesión del NLRI en pacientes adultos sometidos a cirugía tiroidea.
Métodos de búsqueda
Se hicieron búsquedas en CENTRAL, MEDLINE, Embase, en el ICTRP Search Portal y en ClinicalTrials.gov. La fecha de la última búsqueda en todas las bases de datos fue el 21 agosto 2018. No se aplicaron restricciones de idioma.
Criterios de selección
Se incluyeron ensayos controlados aleatorios (ECA) que comparan la identificación nerviosa mediante NMIO más la identificación nerviosa visual versus la identificación nerviosa visual sola para la prevención de la lesión del NLRI en pacientes adultos sometidos a cirugía tiroidea
Obtención y análisis de los datos
Dos autores de revisión examinaron de forma independiente la relevancia de los títulos y resúmenes. Un autor de revisión realizó el cribado para la inclusión, la extracción de datos y la evaluación del "riesgo de sesgo", y un segundo autor los verificó. Para los resultados dicotómicos, se calcularon los cocientes de riesgos (CR) con intervalos de confianza (IC) del 95%. Para los resultados continuos, se calcularon las diferencias de medias (DM) con IC del 95%. La certeza de la evidencia se evaluó mediante los criterios GRADE.
Resultados principales
Cinco ECA con 1558 participantes (781 participantes se asignaron al azar a la NMIO y 777 a la identificación nerviosa visual sola) cumplieron con los criterios de inclusión; dos ensayos fueron realizados en Polonia y otros tres se realizaron en China, Corea y Turquía, respectivamente. Los criterios de inclusión y exclusión variaron entre los ensayos: la cirugía de tiroides anterior o la cirugía paratiroidea fue un criterio de exclusión en tres ensayos. En cambio, este fue un criterio específico de inclusión en otro ensayo. Los criterios de exclusión en tres ensayos fueron: la disección del compartimento central del cuello o disección lateral del cuello y la enfermedad de Graves. La media del tiempo de seguimiento varió entre seis y 12 meses. La media de edad de los participantes osciló entre 41,7 años y 51,9 años.
No hubo evidencia sólida de una ventaja o desventaja de la comparación de la NMIO con la identificación nerviosa visual sola para la parálisis del NLRI permanente (CR 0,77; IC del 95%: 0,33 a 1,77; P = 0,54; cuatro ensayos; 2895 nervios en riesgo; evidencia de certeza muy baja) ni la parálisis transitoria del NLRI (CR 0,62; IC del 95%: 0,35 a 1,08; P = 0,09; cuatro ensayos; 2895 nervios en riesgo; evidencia de muy baja certeza). Ninguno de los ensayos informó la calidad de vida relacionada con la salud. El hipoparatirodismo transitorio como evento adverso no fue significativamente diferente entre los grupos de intervención y de comparación (CR 1,25; IC del 95%: 0,45 a 3,47; P = 0,66; dos ensayos; 286 participantes; evidencia de muy baja certeza). El tiempo de cirugía fue equivalente entre la NMIO y monitorización nerviosa visual sola (DM 5,5 minutos, IC del 95%: ‐0,7 a 11,8; P = 0,08; tres ensayos; 1251 participantes; evidencia de muy baja certeza). Tres de cinco ensayos incluidos aportaron datos sobre la mortalidad por todas las causas: no se informó de muertes. Ninguno de los ensayos informó sobre efectos socioeconómicos. La certeza de la evidencia informada en esta revisión fue en su mayoría muy baja, en particular por el riesgo de sesgo, el alto grado de imprecisión por los intervalos de confianza amplios y la heterogeneidad significativa entre los estudios.
Conclusiones de los autores
Los resultados de esta revisión sistemática y metanálisis indican que no hay evidencia definitiva en la actualidad sobre la superioridad o inferioridad de la NMIO sobre la identificación nerviosa visual sola en los resultados medidos. Se necesitan ECA bien diseñados, realizados, analizados e informados con un número más grande de participantes y un seguimiento más prolongado, en que se utilice la tecnología de NMIO más actualizada y se apliquen nuevas técnicas quirúrgicas.
PICO
Resumen en términos sencillos
Identificación de nervios mediante un electrodo en comparación con la identificación nerviosa visual para pacientes adultos sometidos a cirugía tiroidea
Pregunta de la revisión
Evaluar los efectos de la neuromonitorización intraoperatoria en comparación con la identificación nerviosa visual para la prevención de la lesión del nervio laríngeo recurrente durante la cirugía tiroidea en pacientes adultos.
Antecedentes
La tiroidectomía es una intervención quirúrgica que extrae parte o toda la glándula tiroides para el tratamiento de trastornos benignos (por ejemplo bocio multinodular) o cáncer. Los nervios laríngeos recurrentes son responsables del movimiento de las cuerdas vocales y son altamente vulnerables al daño durante la cirugía tiroidea, lo que resulta en la parálisis uni o bilateral de las cuerdas vocales, con la consiguiente dificultad para hablar (disfonía), problemas respiratorios o ambos. A su vez, este hecho puede reducir la calidad de vida relacionada con la salud y llevar a la discapacidad permanente. Durante mucho tiempo, el procedimiento estándar para prevenir lesiones ha sido la identificación visual de los nervios laríngeos recurrentes durante la cirugía. Se ha introducido recientemente la neuromonitorización intraoperatoria, en que se identifican los nervios mediante un electrodo, para ayudarle al cirujano a que encuentre y proteja los nervios laríngeos recurrentes.
Características de los ensayos
Se buscaron ensayos controlados aleatorios (ensayos en que los participantes son asignados al azar a uno, dos, o más grupos de tratamiento) que comparan la neuromonitorización intraoperatoria más la identificación nerviosa visual con la identificación nerviosa visual sola. Se incluyeron sólo ensayos que informaron de los datos sobre pacientes mayores de 18 años sometidos a cirugía tiroidea. Se excluyeron los ensayos con pacientes sometidos a cirugía de cuello anterior o parálisis nerviosa laríngea repetida. Se incluyeron cinco ensayos con un total de 1558 participantes; 781 fueron asignados a la neuromonitorización intraoperatoria y 777 a la identificación nerviosa visual sola. Dos ensayos se realizaron en Polonia y un estudio en Turquía, China y Corea respectivamente. El promedio de edad de los participantes osciló entre 41,7 y 51,9 años.
Esta evidencia está actualizada hasta el 21 agosto de 2018.
Resultados clave
No hubo evidencia sólida de una ventaja o desventaja en la comparación de la neuromonitorización intraoperatoria con la identificación nerviosa visual sola para la parálisis nerviosa laríngea recurrente temporal o permanente, los efectos secundarios y la duración de la cirugía. En tres de cinco ensayos incluidos hubo datos sobre la mortalidad por todas las causas y no se informó de muertes. Ninguno de los ensayos informó de la calidad de vida relacionada con la salud ni de los efectos socioeconómicos (por ejemplo, los costes relacionados con la estancia hospitalaria). Se necesitan ensayos diseñados, realizados, analizados e informados de modo apropiado, con un número más grande de participantes y un período de observación más prolongado después de la cirugía, que utilicen la última tecnología de neuromonitorización intraoperatoria y con nuevas técnicas quirúrgicas.
Certeza de la evidencia
No hay mucha seguridad acerca de los efectos de la neuromonitorización intraoperatoria en comparación con la identificación nerviosa visual para la prevención de la lesión del nervio laríngeo recurrente durante la cirugía tiroidea. Hubo solo un reducido número de ensayos, algunos errores sistemáticos en los ensayos incluidos y los resultados fueron imprecisos.
Authors' conclusions
Summary of findings
| Intraoperative neuromonitoring compared to visual nerve identification only | ||||||
| Patients: adults undergoing thyroid surgery | ||||||
| Outcomes | Risk with visual nerve identification only | Risk with intraoperative neuromonitoring | Relative effect (95% CI) | № of participants/nerves at risk (trials) | Certainty of the evidence (GRADE) | Comments |
| Permanent RILN palsy (nerves) Definition: injury detected clinically, by laryngoscopy or both, in which the motility of the vocal cords did not recover within 6 months after surgery Follow‐up: 6‐12 months | 9 per 1000 | 7 per 1000 (3 to 16) | RR 0.77 | 2895 (4) | ⊕⊝⊝⊝ | Numbers refer to 'nerves at risk'; CI probably wider because of clustered data The 95% prediction interval ranged between 0.12 and 4.79 |
| Transient RILN palsy (nerves) Definition: injury detected clinically, by laryngoscopy or both, in which the motility of the vocal cords recovered within 6 months after surgery Follow‐up: 6‐12 months | 36 per 1000 | 22 per 1000 (13 to 39) | RR 0.62 | 2895 (4) | ⊕⊝⊝⊝ | Numbers refer to 'nerves at risk'; CI probably wider because of clustered data The 95% prediction interval ranged between 0.12 and 3.11 |
| Health‐related quality of life | Not reported | |||||
| Adverse events other than RILN palsy (participants) Definition: transient hypoparathyroidism Follow‐up: 6‐12 months | 122 per 1000 | 153 per 1000 (55 to 424) | RR 1.25 | 286 (2) | ⊕⊝⊝⊝ | ‐ |
| Operative time (min) Definition: time from the first skin incision to skin closure Follow‐up: 6‐12 months | The mean operative time ranged across control groups from 82.4 min to 274.2 min | The mean operative time in the intervention groups was 5.5 min longer (0.7 min shorter to 11.8 min longer) | ‐ | 1251 (3) | ⊕⊝⊝⊝ | The 95% prediction interval ranged between −60.6 min and 71.7 min |
| All‐cause mortality (nerves) | See comment | 1438 (3) | ⊕⊕⊕⊝ | 3 of 5 trials provided data on all‐cause mortality, no deaths were reported | ||
| Socioeconomic effects | Not reported | |||||
| *The risk in the intervention group (and its 95% confidence interval) is based on the assumed risk in the comparison group and the relative effect of the intervention (and its 95% CI). | ||||||
| GRADE Working Group grades of evidence | ||||||
| aDowngraded by one level because of performance bias, by one level because of inconsistency (no consistent direction of effects) and by one level because of imprecision (CI consistent with both benefit and harm, small number of trials, not a common event, i.e. ≤ 1/100) ‐ see Appendix 15 | ||||||
Background
Description of the condition
The visual identification of the recurrent inferior laryngeal nerve (RILN) is considered the safest method to prevent nerve injury during thyroid and parathyroid surgery (Deniwar 2015a). Generally, the rate of nerve injury is higher in cases of thyroid carcinoma, Flajani‐Graves‐Basedow disease, goitre, thyroid reoperation surgery, failure of nerve identification, and surgeons' inexperience (Calò 2014a). Intraoperative neuromonitoring (IONM) has been introduced in order to facilitate the localisation of the RILN and prevent its injury during surgery (Duclos 2011). A trial that included 686 participants demonstrated that use of IONM decreased the incidence of RILN palsy (from 7.6% to 4.7%; Duclos 2011). IONM was reported to reduce the prevalence of transient RILN injury (Barczyński 2009), and to increase surgeons' accuracy during nerve preparation, particularly during video‐assisted thyroid surgery (Dionigi 2009).
When used by experienced thyroid surgeons (RILN injury rate of less than 1%), the IONM did not show a significant improvement in the postsurgery outcomes (Barczyński 2009). However, in procedures performed by low‐volume surgeons (defined as surgeons that perform fewer than 25 thyroidectomies per year (Adam 2016)), the use of IONM was associated with a significant reduction in postsurgical permanent RILN palsy (Dralle 2004), and RILN monitoring helped to reduce the permanent RILN palsy rate for low‐volume surgeons by 0.9% (Sosa 1998). With low‐volume surgeons, the permanent RILN palsy rates were highest after visual nerve identification (1.4%) (Sosa 1998).
RILN monitoring might be a useful technique that guides the cautious handling of the recurrent nerve by low‐volume surgeons. High‐volume surgeons may benefit from RILN monitoring in difficult situations (Dralle 2004). Zheng 2013 published a meta‐analysis of 14 different trials, which included 36,487 participants, and concluded that IONM decreases the risk of transient RILN palsy without affecting the rates of permanent injuries.
Description of the intervention
The RILN is normally identified by palpation and surgical dissection. The IONM was introduced in the attempt to identify the nerve by using an electrode (Dequanter 2015). In order to measure the nerve response, the electric field is converted to an acoustic signal, the potentials of which are recorded.
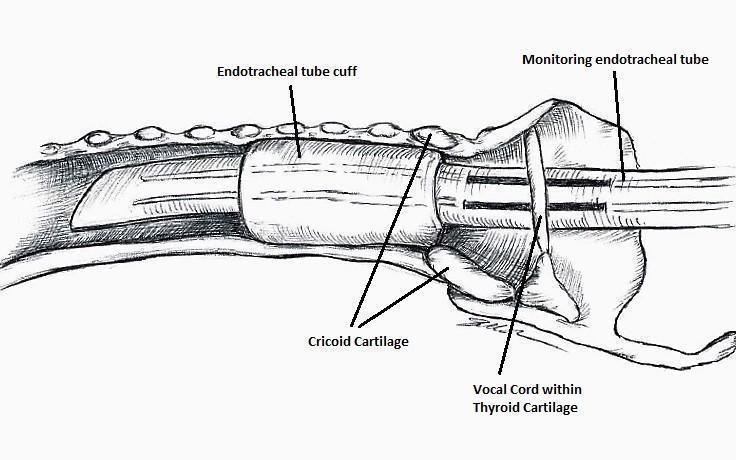
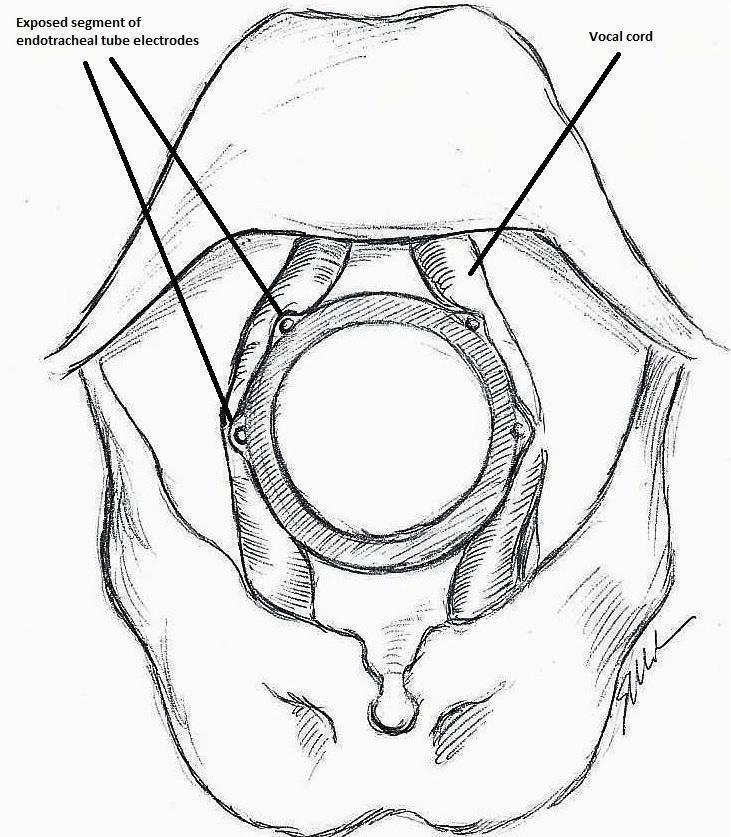
The IONM system operates with two surface electrodes positioned upon an endotracheal tube, which is 7 mm in diameter. During intubation, the anaesthetist inserts, under direct vision, the endotracheal tube between the vocal folds (Figure 1). The RILN is stimulated by a monopolar electrode, using the interrupted stimulation technique (1 mA, 100 ms impulse duration and 4 Hz frequency). In the case of a bifurcated RILN, the post‐stimulation response for each nerve branch is included. The endotracheal tube electromyography (EMG) is used to detect the adduction of the vocal folds (Figure 2). A posterior cricoarytenoid muscle contraction, revealed by direct finger palpation, is used to detect the abduction of the vocal folds (Figure 3).

Nerve integrity monitoring endotracheal tube for electromyography signals of a patient's laryngeal muscles (drawn by Silvia Marola)

Monitoring endotracheal tube in position positioned at the patient's vocal folds (drawn by Silvia Marola)
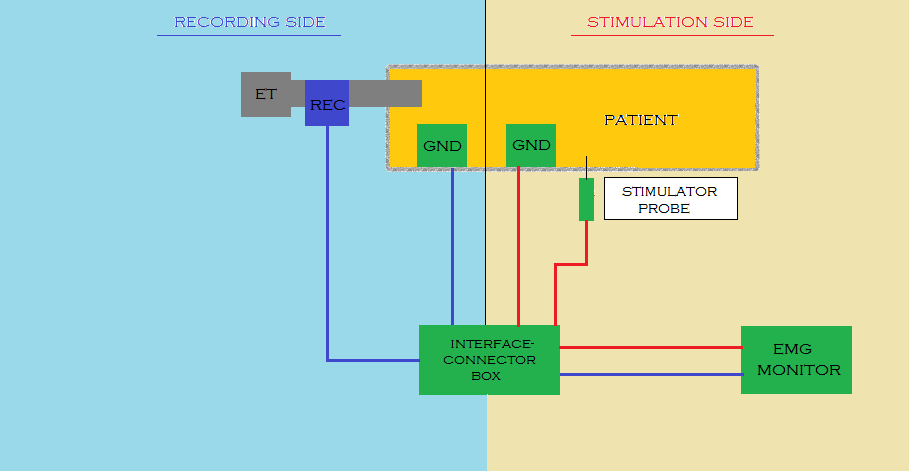
Basic monitoring equipment setup (drawn by Silvia Marola)
EMG: electromyography;ET: endotracheal tube; GND: ground electrodes; REC: recording electrodes
During the intervention, the thyroid lobe is shifted medially and the upper thyroid vessels are tied and cut. The RILN is then identified, dissected and stimulated. At the beginning of thyroidectomy, to ensure that the neuromonitoring system is working, the vagus nerve is stimulated. Proceeding with the operation, the inferior laryngeal nerve is repeatedly stimulated. At the end of the operation, both the vagus and the recurrent nerve are stimulated in an attempt to predict the postoperative outcome (Calò 2014b). In IONM, the first stimulating electrode is used to make a contact with the RILN, followed by electrical stimulation of the RILN. The second recording electrode receives the electrical signal and a monitor records the signal with a sound. If the RILN is nearby, the surgeon sees the waveform on the displayer at the same time (Zheng 2015). Both the stimulating and recording electrodes are positioned on the sternum or the shoulder, while the interface connector device is linked to the monitoring system. Sonor systems with alarms indicate signal abnormalities, while optic waveform monitors show amplitude, threshold and latency records, which can discriminate true from false signals, giving a real time feedback by monitoring (EMG) responses.
IONM can also be performed in a continuous way, for instance when the stimulating and recording systems are connected to an interface connector device, which is linked to grounding electrodes. Continuous IONM can disclose earlier changes in nerve function, which may be a warning of impending nerve injury (Deniwar 2015a). Continuous IONM seems to be superior to intermittent intraoperative neural monitoring because it enhances standardisation by permanent vagus nerve stimulation, and it provides entire and constant RILN function monitoring as the surgeon dissects and removes the thyroid gland.
Following stimulation of the ipsilateral vagus nerve, the absence of an EMG signal is defined as a loss of signal. An intraoperative algorithm is employed to differentiate between true and false loss of signal. In cases of true loss of signal, the neuromapping technique is used to determine the type of nerve damage and localise the injury site. Following thyroid lobectomy, the loss of signal after vagal stimulation is considered a positive test result. When the laryngoscopy confirms an ipsilateral vocal cord paresis, it is considered a true‐positive result. Conversely, a normal mobility of the ipsilateral vocal fold is considered a false‐positive result. Following thyroid lobectomy, the detection of a normal signal after vagal stimulation is considered a negative test result. When the postoperative laryngoscopy confirms a normal mobility of the ipsilateral vocal fold, it is considered a true‐negative result. Conversely, the detection of an ipsilateral vocal fold paresis is considered as a false‐negative result of the EMG signal.
Co‐operation between the surgeon and the anaesthesiologist is essential for successful neuromonitoring. The use of neuromuscular blocking agents should be carefully considered and avoided if possible, as they reduce response amplitudes from the vagus nerve, the RILN and the external branch of the superior laryngeal nerve, which may hinder injury detection.
Adverse effects of the intervention
Chen and colleagues analysed the adverse effects of the procedure of neuromonitoring in a cohort of 3029 patients undergoing thyroid surgery: there were preoperative complications (bucking, deep tracheal catheter placement, tracheal catheter rotation, over‐secretion and unstable signal, unstable blood flow dynamics and oral mucosa injury) and postoperative complications (throat pain, pharyngeal discomfort, hoarse voice and joint half‐dislocation, inhalation pneumonia, dry eye syndrome, ear and neck numbness and conjunctival congestion (Chen 2015)).
How the intervention might work
During surgery for thyroid carcinoma with lymph node dissection, thyroid reoperation surgery, or in the presence of anatomic variability, IONM can help surgeons to identify the RILN (Dequanter 2015), and may offer a real benefit for lowering nerve injury rates (Malik 2016). An intact monitoring signal at the end of the surgery is associated with a positive outcome for vocal cord functionality. The negative predictive value of the procedure is very high (97% to 99%; Calò 2014b). This means that if 100 patients have an intact monitoring signal at the end of the surgery, 97 to 99 patients out of these 100 patients will have normal vocal cord functionality. On the other hand, with a loss of signal at the end of the operation, the positive predictive value of the procedure is low (33% to 37%), and the occurrence of vocal cord palsy is unpredictable (Calò 2014b). This means that if 100 patients have a loss of signal at the end of the operation, 33 to 37 out of these 100 patients will have vocal cord palsy. During thyroid surgery, neuromonitoring facilitates the identification of RILN, verifying the functional integrity of the nerve (Chiang 2011; Dequanter 2015). In fact, a positive IONM can demonstrate intact nerve function intraoperatively (Chiang 2010). Because most of the injured nerves appear intact, IONM can properly prognosticate postoperative nerve function, which is difficult to detect by visual identification (Dralle 2004). Neuromonitoring can also detect anatomical variation and abnormal courses of the nerves, which are at high risk of injury if not detected (Deniwar 2015b).
Why it is important to do this review
Recent guidelines from the American Academy of Otolaryngology Head and Neck Surgery recommend IONM use in thyroid surgery to prevent nerve damage (Chandrasekhar 2013). IONM is currently used in 80% of thyroidectomies performed by neck surgeons and by more than 50% of general surgeons in the USA. It is more commonly used by higher‐volume surgeons (Al‐Qurayshi 2016). More clinical trials are needed to further clarify the effects of IONM. In the meta‐analysis by Higgins 2011a and in the recent meta‐analysis by Pisanu 2014, IONM and visual nerve identification did not demonstrate a substantial difference in rates of transient, total or persistent vocal fold palsy. Pisanu 2014 analysed 20 trials that included 23,152 participants and showed that overall RILN palsy rates for IONM versus visualisation alone were 3.5% versus 3.7%. The role of IONM during thyroid surgery is still debatable, as no consensus exists regarding the prevention of recurrent nerve injury (Deniwar 2015a). There are three primary reasons that this review improves upon the previous reviews by Higgins 2011a and Pisanu 2014. First, both Higgins 2011a and Pisanu 2014 highlighted the need for more trials on this topic that have fewer methodological flaws; both reviews called for more, and better‐controlled, randomised controlled trials (RCTs). Pisanu 2014 specifically called for further trials that include high‐quality, multicentre, prospective, randomised trials based on strict criteria of standardisation and subsequent meta‐analysis to verify the outcomes of interest. If those calls have been heeded, we would expect this Cochrane Review to include more trials with better methodological quality. Second, we included trials published since the last search in August 2013 by Pisanu 2014. Finally, we propose to investigate additional patient‐important outcomes that have not yet been investigated in previous reviews, such as health‐related quality of life, all‐cause mortality and socioeconomic effects.
Objectives
To assess the effects of IONM versus visual nerve identification for prevention of RILN injury in adults undergoing thyroid surgery.
Methods
Criteria for considering studies for this review
Types of studies
We included randomised controlled trials (RCTs).
Types of participants
Adults (older than 18 years) undergoing thyroidectomy.
A thyroidectomy is an operation that involves the surgical removal of all or part of the thyroid gland. We evaluated two techniques in this review: partial and total thyroidectomy. We defined partial thyroidectomy as the surgical removal of a portion of the thyroid gland and total thyroidectomy as the surgical removal of the entire gland.
Types of interventions
We planned to investigate the following comparison of intervention versus control/comparator.
-
Intervention: IONM with and without visual nerve identification during thyroidectomy
-
Comparator: visual nerve identification only during thyroidectomy
Concomitant interventions had to be the same in both the intervention and comparator groups to establish fair comparisons.
Minimum duration of follow‐up
Minimal duration of follow‐up was six months.
We defined extended follow‐up periods (also called 'open‐label extension studies') as follow‐up of participants once the original trial, as specified in the trial protocol, had been terminated. However, such trials are frequently of an observational nature and we only planned to evaluate them for adverse events (Buch 2011; Megan 2012).
Specific exclusion criteria
-
Clinical trials evaluating people with a previous history of neck surgery and laryngeal nerve injury.
Types of outcome measures
We did not exclude a trial only on the basis that one or more of our primary or secondary outcome measures were not reported in the publication. In the case that none of our primary or secondary outcomes were reported in the trial, we did not include the trial in the synthesis and planned to provide some basic information in an additional table.
Primary outcomes
-
Permanent RILN palsy
-
Transient RILN palsy
-
Health‐related quality of life
Secondary outcomes
-
Adverse events other than permanent or transient RILN palsy
-
Operative time
-
All‐cause mortality
-
Socioeconomic effects
Method of outcome measurement
For nerve‐related outcomes (i.e. transient and permanent nerve palsy), the nerve was the unit of analysis. For other outcomes, the participant was the unit of analysis.
-
Permanent RILN palsy: defined as an injury detected clinically, by laryngoscopy or both, evaluating the motility of the vocal cords.
-
Transient RILN palsy: defined as an injury detected clinically, by laryngoscopy or both, evaluating the motility of the vocal cords.
-
Health‐related quality of life: evaluated by a validated instrument such as the Short Form 36 (SF‐36) or Quality of Life‐Thyroid Version (QOL‐TV).
-
Adverse events: defined as procedure‐related events other than permanent or transient RILN palsy, such as hypoparathyroidism. We did not define events not related to the procedure as 'adverse events'. For example, we did not define infection and seroma as adverse events here because these are associated with the closure of skin (i.e. different types of wound closures such as staples or other sutures and comorbidities such as diabetes, corticosteroid treatment, obesity) and not the technique of RILN identification.
-
Operative time: defined as the time from the first skin incision to skin closure.
-
All‐cause mortality: defined as death from any cause.
-
Socioeconomic effects: defined as direct costs, including those related to surgical supplies and to hospital stay.
Timing of outcome measurement
The criteria for the timing of outcome measures are listed below.
-
Permanent and transient RILN palsy: within six months after surgery
-
Health‐related quality of life and socioeconomic effects: at 30 days and thereafter
-
Adverse events other than permanent or transient RILN palsy: measured at any time after participants were randomised to intervention/comparator groups
-
Operative time: at the end of the operation
-
All‐cause mortality: during the first 30 days after the operation (early mortality) or after 30 days (late mortality)
Search methods for identification of studies
Electronic searches
We searched the following sources from inception of each database to the specified date and placed no restrictions on the language of publication:
-
Cochrane Central Register of Controlled Trials (CENTRAL; 2018, Issue 8) via the Cochrane Register of Studies Online (CRSO) (searched 21 August 2018)
-
MEDLINE Ovid (Epub Ahead of Print, In‐Process & Other Non‐Indexed Citations, Ovid MEDLINE(R) Daily and Ovid MEDLINE(R); from 1946 onwards; searched 21 August 2018).
-
Embase Ovid (from 1974 onwards; searched 12 January 2017). RCTs indexed in Embase are now prospectively added to CENTRAL via a highly sensitive screening process (CENTRAL creation details).
-
ClinicalTrials.gov (www.clinicaltrials.gov; searched 21 August 2018).
-
World Health Organization International Clinical Trials Registry Platform (ICTRP; www.who.int/trialsearch/; searched 21 August 2018).
Searching other resources
We attempted to identify other potentially eligible trials or ancillary publications by searching the reference lists of included trials, systematic reviews, meta‐analyses and health technology assessment reports. In addition we contacted the authors of included trials to identify any additional information on the retrieved trials and to determine if further trials existed that we may have missed.
We did not use abstracts or conference proceedings for data extraction unless full data were available from trial authors. Our rationale for this was because this type of information source does not fulfil the CONSORT's "evidence‐based, minimum set of recommendations for reporting randomized trials" (CONSORT 2016; Scherer 2007). Rather, we planned to present information on abstracts or conference proceedings in a Characteristics of studies awaiting classification table.
Data collection and analysis
Selection of studies
Two review authors (RC and MB) independently screened the abstract or title, or both, of every record retrieved to determine which trials we should assess further. We investigated the full‐ text articles of all potentially relevant articles. We resolved discrepancies through consensus or by adjudication by a third review author (VD). If we could not resolve a disagreement, we categorised the trial as a 'study awaiting classification' and contacted the trial authors for clarification. We presented an adapted PRISMA flow diagram to show the process of trial selection (Liberati 2009). We listed all articles excluded after full‐text assessment in the Characteristics of excluded studies table and provided the reasons for exclusion.
Data extraction and management
For trials that fulfilled inclusion criteria, two review authors (RC and VD) independently extracted participant and intervention characteristics. We reported data on efficacy outcomes and adverse events using standard data extraction sheets from Cochrane Metabolic and Endocrine Disorders (CMED). We resolved any disagreements by discussion or, if required, we consulted a third review author (AA). For details see Characteristics of included studies; Table 1; Appendix 2; Appendix 3; Appendix 4; Appendix 5; Appendix 6; Appendix 7; Appendix 8; Appendix 9; Appendix 10; Appendix 11; Appendix 12; Appendix 13). GP extracted and evaluated all trial information relating to Barczynski 2009 and Barczynski 2012. The Co‐ordinating Editor of the CMED Group checked all data extractions and data analyses.
| Trial ID | Intervention(s) and comparator(s) | Description of power and sample size calculation | Screened/eligible | Randomised | Analysed | Finishing trial | Randomised finishing trial | Follow‐up |
| (parallel RCT) | I: RILN visualisation with neuromonitoring | "Our study had some limitations. First, this was a small sample study. To draw more persuasive conclusions, at least 434 RLNs in each group are needed to evaluate RLN injury reduction from 10% to 5% with a power of 80% and P = .05" | ‐ | 33 | 33 | 33 | 100 | 6 months |
| C: RILN visualisation alone | 37 | 37 | 37 | 100 | ||||
| total: | 70 | 70 | 70 | 100 | ||||
| (parallel RCT) | I: RILN visualisation with neuromonitoring | "The sample size was estimated based on the principle of detecting a difference of ‐10 units for VRP and of ‐5 for VHI between the mean of the IONM and non‐IONM groups with a 90% probability at P < .05, using power curve and sample size tools for one‐way analysis of variance" | ‐ | 25 | 25 | 25 | 100 | 12 months |
| C: RILN visualisation alone | 25 | 25 | 25 | 100 | ||||
| total: | 50 | 50 | 50 | 100 | ||||
| (parallel RCT) | I: RILN visualisation with neuromonitoring | "The sample size was estimated based on the principle of detecting a 5 % difference in the incidence of primary or secondary outcome measures with a 90 % probability at P < 0.05" | 517 | 105 | 105 | 100 | 95.2 | 6 months |
| C: RILN visualisation alone | 105 | 105 | 101 | 96.2 | ||||
| total: | 210 | 210 | 201 | 95.7 | ||||
| (parallel RCT) | I: RILN visualisation with neuromonitoring | ‐ | 254 | 123 | ‐a | ‐a | ‐a | 12 months |
| C: RILN visualisation alone | 114 | ‐a | ‐a | ‐a | ||||
| total: | 236 | ‐a | ‐a | ‐a | ||||
| (parallel RCT) | I: RILN visualisation with neuromonitoring | "The sample size was estimated based on the principle of detecting a 2 per cent difference in the incidence of transient RLN injury with a 90 per cent probability at P < 0·050" | 1488 | 500 | 500 | 500 | 100 | 12 months |
| C: RILN visualisation alone | 500 | 500 | 500 | 100 | ||||
| total: | 1000 | |||||||
| Grand total | All interventions | 781 | ||||||
| All comparators | 777 | |||||||
| All interventions and comparators | 1558 | |||||||
‐ denotes not reported.
aTrial authors did not report the number of participants but the number of nerves
C: comparator; I: intervention; RCT: randomised controlled trial; RILN: recurrent inferior laryngeal nerve
We provided information about potentially relevant ongoing trials, including trial identifiers, in the Characteristics of ongoing studies table and in Appendix 7, 'Matrix of trial endpoint (publications and trial documents)'. We tried to obtain the protocol for each included trial and reported primary, secondary and other outcomes in comparison with data in the publications listed in Appendix 7.
We emailed all authors of included trials to inquire whether they were willing to answer questions regarding their trials. We presented the results of this survey in Appendix 14. We thereafter sought relevant missing information on the trial from the primary trial author(s), if required.
Dealing with duplicate and companion publications
In the event of duplicate publications, companion documents or multiple reports of a primary trial, we maximised the information yield by collating all available data and we used the most complete dataset aggregated across all known publications. We listed duplicate publications, companion documents, multiple reports of a primary trial and trial documents of included trials (such as trial registry information), as secondary references under the study identifier (ID) of the included trial. Furthermore, we also listed duplicate publications, companion documents, multiple reports of a trial and trial documents of excluded trials (such as trial registry information), as secondary references under the study ID of the excluded trial.
Data from clinical trials registers
If data from included trials were available as trial results in clinical trials registers, such as ClinicalTrials.gov or similar sources, we made full use of this information and extracted the data. If there was also a full publication of the trial, we collated and critically appraised all available data. If an included trial was marked as a completed trial in a clinical trials register but no additional information (e.g. trial results, a publication or both) was available, we added this trial to the Characteristics of studies awaiting classification table.
Assessment of risk of bias in included studies
Two review authors (RC and VD) independently assessed the risk of bias of each included trial. We resolved any disagreements by consensus, or by consulting a third review author (AA). In cases of disagreement, we consulted the rest of the review author team and made a judgement based on consensus. If adequate information was unavailable from the trials, trial protocols or both, we contacted the trial authors to recover missing data on 'Risk of bias' items.
We used the Cochrane 'Risk of bias' assessment tool (Higgins 2011b; Higgins 2017 ), assigning assessments of low, high or unclear risk of bias to each trial (for details see Appendix 2; Appendix 15). We evaluated individual bias items as described in the Cochrane Handbook for Systematic Reviews of Interventions according to the criteria and associated categorisations contained therein (Higgins 2017).
Summary assessment of risk of bias
We presented a 'Risk of bias' graph and a 'Risk of bias' summary figure.
We distinguished between self‐reported and investigator‐assessed and adjudicated outcome measures.
We considered the following to be self‐reported outcomes.
-
Permanent RILN palsy
-
Transient RILN palsy
-
Health‐related quality of life
-
Adverse events other than permanent or transient RILN palsy
We considered the following outcomes to be investigator‐assessed.
-
Permanent RILN palsy
-
Transient RILN palsy
-
Adverse events other than permanent or transient RILN palsy
-
All‐cause mortality
-
Operative time
-
Socioeconomic effects
Risk of bias for a trial across outcomes
Some 'Risk of bias' domains, such as selection bias (sequence generation and allocation sequence concealment), affect the risk of bias across all outcome measures in a trial. In the case of high risk for selection bias, we marked all endpoints investigated in the associated trial as 'high risk'. Otherwise, we did not perform a summary assessment of the risk of bias across all outcomes for a trial.
Risk of bias for an outcome within a trial and across domains
We assessed the risk of bias for an outcome measure by including all entries relevant to that outcome (i.e. both trial‐level entries and outcome‐specific entries). We used the term 'low risk of bias' to denote a low risk of bias for all domains, 'unclear risk', to denote an unclear risk of bias for one or more domains, and 'high risk', to denote a high risk of bias for one or more domains.
Risk of bias for an outcome across trials and across domains
This type of risk of bias was the type of main summary assessments that we incorporated into our judgements about the quality of evidence in the 'Summary of finding' table. We defined outcomes as being at 'low risk of bias' when most information came from trials at low risk of bias, 'unclear risk', when most information came from trials at low or unclear risk of bias, and 'high risk', when most information came from trials at high risk of bias.
Measures of treatment effect
When at least two included trials were available for a comparison on a given outcome, we expressed dichotomous data as a risk ratio (RR) with 95% confidence intervals (CIs). For continuous outcomes measured on the same scale (e.g. surgical time), we estimated the intervention effect using the mean difference (MD) with 95% CIs. For continuous outcomes that measured the same underlying concept (e.g. health‐related quality of life), but used different measurement scales, we planned to calculate standardised mean difference (SMD). We planned to express time‐to‐event data as a hazard ratio (HR) with 95% CIs.
Unit of analysis issues
We took into consideration the level at which randomisation occurred, such as cross‐over trials, cluster‐randomised trials and multiple observations for the same outcome. If more than one comparison from the same trial was eligible for inclusion in the same meta‐analysis, we either planned to combine groups to create a single pair‐wise comparison, or appropriately reduced the sample size so that the same participants did not contribute multiply (e.g. splitting the 'shared' group into two or more groups). While the latter approach offers some solution to adjusting the precision of the comparison, it does not account for correlation arising from the same set of participants being in multiple comparisons (Higgins 2011c).
If applicable, we planned to reanalyse cluster‐RCTs that did not appropriately adjust for potential clustering of participants within clusters in their analyses. We intended to inflate the variance of the intervention effects using design effects such as an estimation of an intra‐cluster correlation (ICC). Where applicable, we planned to obtain estimates of ICCs through contact with the trial authors, or imputed them using estimates from other included trials that reported ICCs, or using external estimates from empirical research (e.g. Bell 2013). We planned to examine the impact of clustering using sensitivity analyses if necessary.
Dealing with missing data
If possible, we obtained missing data from the authors of the included trials. We carefully evaluated important quantitative data such as the number of screened, randomly assigned participants, as well as intention‐to‐treat, as‐treated and per‐protocol populations. We investigated attrition rates (e.g. dropouts, losses to follow‐up, withdrawals), and we critically appraised issues concerning missing data and use of imputation methods (e.g. last observation carried forward).
Where included trials reported median and ranges instead of means and standard deviations (SD) for outcomes, and we did not receive the necessary information from trial authors, we imputed these values by estimating the mean and variance from the median, range and the size of the sample when trial authors reported those nonparametric statistics (Hozo 2005). In trials where the SD of the outcome was not available at follow‐up but where other trials reported this information, we standardised, by the average of the pooled baseline SD, from those trials that reported this information.
We investigated the impact of imputation on meta‐analyses by performing sensitivity analyses and we reported for each outcome which trials were included with imputed SDs.
Assessment of heterogeneity
In the event of substantial clinical or methodological heterogeneity, we reported trial results in the pooled effect estimate.
We identified heterogeneity (inconsistency) by visually inspecting forest plots and by using a standard Chi² test with a significance level of α = 0.1 (Deeks 2017). In view of the low power of this test, we also considered the I² statistic (Higgins 2003), which quantifies inconsistency across trials to assess the impact of heterogeneity on the meta‐analysis (Higgins 2002). An I² statistic value greater than 75% indicates a considerable level of heterogeneity (Deeks 2017).
When we found heterogeneity, we attempted to determine the possible reasons for it by examining individual trial and subgroup characteristics.
Assessment of reporting biases
If we included 10 or more trials that investigated a particular outcome, we used funnel plots to assess small‐trial effects. Several explanations may account for funnel plot asymmetry, including true heterogeneity of effect with respect to trial size, poor methodological design (and hence bias of small trials) and publication bias. Therefore, we interpreted the results carefully (Sterne 2011).
Data synthesis
We planned to undertake (or display) a meta‐analysis only if we judged participants, interventions, comparisons, and outcomes to be sufficiently similar to ensure that the results had a clinically meaningful interpretation. Unless sufficient evidence showed homogeneous effects across trials of different methodological quality, we primarily summarised low risk of bias data using a random‐effects model (Wood 2008). We interpreted random‐effects meta‐analyses with due consideration to the whole distribution of effects and presented a prediction interval (Borenstein 2017a; Borenstein 2017b; Higgins 2009). A prediction interval needs at least three trials to be calculated and specifies a predicted range for the true treatment effect in an individual trial (Riley 2011). For rare events, such as event rates below 1%, we planned to use the Peto's odds ratio method, provided that there was no substantial imbalance between intervention and comparator group sizes and intervention effects were not exceptionally large. In addition, we performed statistical analyses according to the statistical guidelines presented in the Cochrane Handbook for Systematic Reviews of Interventions (Deeks 2017).
Subgroup analysis and investigation of heterogeneity
We expected the following characteristics to introduce clinical heterogeneity and planned to carry out the following subgroup analyses including investigation of interactions when applicable (Altman 2003).
-
Partial versus total thyroidectomy
-
Thyroidectomy for cancer versus benign thyroid disease
-
Low versus high experience in thyroid surgery; we defined 'low experience in thyroid surgery' as case‐volume of thyroidectomies less than 25 per year (Adam 2016).
-
Residents in general surgery versus surgeons
-
Participants aged less than 75 years versus 75 years or older
-
Participants with a body mass index of less than 35 kg/m² versus body mass index 35 kg/m² or higher
-
Thyroidectomy with tie and clamp versus vascular dissection, cutting and sealing simultaneously (UltraCision Harmonic® scalpel) or a bipolar vascular sealing system (LigaSure®)
Sensitivity analysis
We planned to perform sensitivity analyses to explore the influence of the following factors (when applicable) on effect sizes based on the following characteristics.
-
The publication status of the trial
-
The effect of risk of bias, as specified in the Assessment of risk of bias in included studies section
-
The extent to which very large trials dominated the results
-
And other criteria such as diagnostic criteria, imputation, language of publication, source of funding (industry versus other), or country
We also tested the robustness of results by repeating the analyses using different measures of effect size (RR, OR, etc), and different statistical models (fixed‐effect and random‐effects models).
Certainty of evidence
We presented the overall certainty of the evidence for each outcome specified in the Types of outcome measures section according to the GRADE approach, which takes into account issues related not only to internal validity (risk of bias, inconsistency, imprecision, publication bias) but also to external validity, such as the directness of results. Two review authors (IA and RC) independently rated the certainty of evidence for each outcome. We resolved differences in assessment by discussion or consultation with a third review author (NA).
We included the 'Checklist to aid consistency and reproducibility of GRADE assessments' (Appendix 15), to help with standardisation of the 'Summary of findings' tables (Meader 2014). Alternatively, we planned to use the GRADEpro Guideline Development Tool (GDT) software and would have presented evidence profile tables as an appendix (GRADEproGDT 2015). We presented the results for the outcomes as described in the Types of outcome measures section. If meta‐analysis was not possible, we presented the results in a narrative format in the 'Summary of findings' table. We justified all decisions to downgrade the certainty of the evidence using footnotes and we made comments to aid the reader's understanding of the Cochrane Review where necessary.
'Summary of findings' table
We presented a summary of the evidence in summary of findings Table for the main comparison. This information provides key information about the best estimate of the magnitude of the effect, in relative terms and as absolute differences, for each relevant comparison of alternative management strategies, numbers of participants and trials addressing each important outcome, and a rating of overall confidence in effect estimates for each outcome. We created the 'Summary of findings' table based on the methods described in the Cochrane Handbook for Systematic Reviews of Interventions (Schünemann 2017) using Review Manager 5 (RevMan 5) table editor (Review Manager 2014). We reported the following outcomes, listed according to priority.
-
Permanent RILN palsy
-
Transient RILN palsy
-
Health‐related quality of life
-
Adverse events other than permanent or transient RILN palsy (transient hypoparathyroidism)
-
Operative time
-
All‐cause mortality
-
Socioeconomic effects
Results
Description of studies
For a detailed description of trials, see Table 1, Characteristics of included studies, Characteristics of excluded studies, and Characteristics of ongoing studies.
Results of the search
In our comprehensive literature searches, we identified a total of 594 records. There were 447 records after the exclusion of duplications. From these, we identified 37 full‐text publications for further examination. We excluded the other publications on the basis of titles or abstracts because inclusion criteria had not been met or because the trials were not relevant to the review objectives (see Figure 4 for the amended PRISMA study flow diagram). After screening the full text of the selected publications, five trials (Barczynski 2009; Barczynski 2012; Hei 2016a; Lee 2015; Sari 2010), met our inclusion criteria. All trials were published in English.

Trial flow diagram
Included studies
For a detailed description of trials, see the Table 1 and the Characteristics of included studies section.
Source of data
We identified 594 publications: 56 in CENTRAL, 218 in MEDLINE, 234 in Embase, 46 in the WHO ICTRP and 40 in ClinicalTrials.gov; we did not identify any additional records through handsearching reference lists. After removal of duplicates, we evaluated 447 publications.
Comparisons
All the included trials compared IONM plus visual nerve identification with visual nerve identification alone for prevention of RILN in participants undergoing conventional thyroidectomy (Barczynski 2009; Barczynski 2012; Hei 2016a; Sari 2010), or robotic thyroidectomy (Lee 2015).
Overview of trial populations
The five trials included a total of 1558 participants undergoing thyroidectomy: 781 participants were randomised to IONM with visual nerve identification and 777 to visual nerve identification only. Trial sample size ranged from 50 (Lee 2015), to 1000 (Barczynski 2009).
Trial design
All five trials utilised a parallel‐group, superiority design. All trials were monocentric. One of the trials (Barczynski 2012), was double‐blinded (participants and the ear, nose and throat specialist who was performing videostrobolaryngoscopy and voice assessment). The trials were performed between the years 2006 and 2014. The mean duration of follow‐up ranged from 6 (Barczynski 2012; Hei 2016a), to 12 months (Barczynski 2009; Lee 2015; Sari 2010). No trial was terminated early.
Settings
Two trials were conducted in Poland (Barczynski 2009; Barczynski 2012) and one trial each was conducted in China (Hei 2016a), Korea (Lee 2015), and Turkey (Sari 2010). All trials were conducted at academic institutions and had an inpatient setting.
Participants
Participants had an indication for thyroidectomy due to a variety of diseases including toxic and nontoxic nodular goitre, Graves’ disease and thyroid carcinoma (Appendix 5). Three hundred‐seven (18.7%) participants came from low‐ and middle‐income countries such as China (Hei 2016a) and Turkey (Sari 2010). In three trials the ethnic groups were white participants (Barczynski 2009; Barczynski 2012; Sari 2010), in two trials there were Asian participants (Hei 2016a; Lee 2015). None of the trials reported any information on the duration of thyroid disease. Surgical procedures were most commonly performed with female participants (81%). In the IONM group the mean age of trial participants ranged from 44.2 years (Lee 2015), to 51.3 years (Barczynski 2009). In the visual identification only group the mean age of trial participants ranged from 41.7 years (Lee 2015), to 51.9 years (Barczynski 2009; Appendix 6). The mean BMI reported in one trial (Sari 2010), was 26.9 kg/m2 (SD 3) in the IONM group versus 27.3 kg/m2 (SD 3) in the visual identification only group. No trial reported on comorbidities. Major exclusion criteria differed amongst trials: in Barczynski 2009, Barczynski 2012 and Lee 2015, previous thyroid or parathyroid surgery was an exclusion criterion. By contrast, in Hei 2016a, this was a specific inclusion criterion. In Barczynski 2009, Barczynski 2012 and Hei 2016a participants underwent central neck compartment dissection or lateral neck dissection; their major exclusion criterion was Graves’ disease.
Diagnosis
No trial reported diagnostic procedures.
Interventions
No trial reported treatment before the start of the trial.
All five trials used IONM as their intervention. The system used for neuromonitoring of the IONM group was the NIM 2.0/3.0 system® (Medtronic Xomed Surgical Products, Jacksonville, FL), in four trials (Barczynski 2012; Hei 2016a; Lee 2015; Sari 2010), and the Neurosign® 100 system (Inomed, Teningen, Germany), in one trial (Barczynski 2009). In four trials an anaesthetist inserted endotracheal tube surface electrodes between the vocal folds under direct vision during intubation (Barczynski 2009; Barczynski 2012; Lee 2015; Hei 2016b); in the other trial, the trial authors used needle electrodes (Sari 2010). The trials located, mapped, and stimulated RILN using a probe, and confirmed the identification of a healthy RILN by acoustic evaluation of the signal and visual display of the EMG response evaluation (latency and amplitude).
All five trials used RILN visualisation only as the comparator intervention.
Outcomes
In Barczynski 2009 and Barczynski 2012 there were no differences between stated primary outcomes in the publication and ClinicalTrials.gov (NCT00661024; NCT01395134). No protocol or trials register information was available for the other three trials.
Four trials (Barczynski 2009; Barczynski 2012; Hei 2016a; Lee 2015), explicitly stated a primary endpoint in the publication. Only Barczynski 2009 and Barczynski 2012 reported secondary endpoints. The defined primary outcomes were the incidence of the RILN injury (evaluated on the second postoperative day and at 1, 2, 4, 6 and 12 months postoperatively, if paresis was noted on first examination; Barczynski 2009), the identification rate of the external branch of the superior laryngeal nerve (evaluated up to six months postoperatively; Barczynski 2012), postoperative RILN function (evaluated by laryngoscopy (Hei 2016a); or transient or permanent unilateral or bilateral laryngeal nerve lesions, voice handicap index and voice range profile (Lee 2015)).
The five trials reported a mean of seven (range 2 to 14) outcomes.
Two trials (Lee 2015; Sari 2010), reported the rate of adverse events related to IONM. One trial (Sari 2010), reported all‐cause mortality; Barczynski 2009 and Barczynski 2012 authors confirmed that there were no deaths up to 30 days after surgery in their trials. No trial assessed health‐related quality of life or socioeconomic effects.
Excluded studies
After careful evaluation of the full publication we had to exclude 32 trials. The main reasons for exclusion were that the trial design was not an RCT and there was no adequate intervention or control group (for details see Characteristics of excluded studies).
Risk of bias in included studies
For details on the risk of bias of the included trials see Characteristics of included studies, Appendix 2 and Appendix 3.
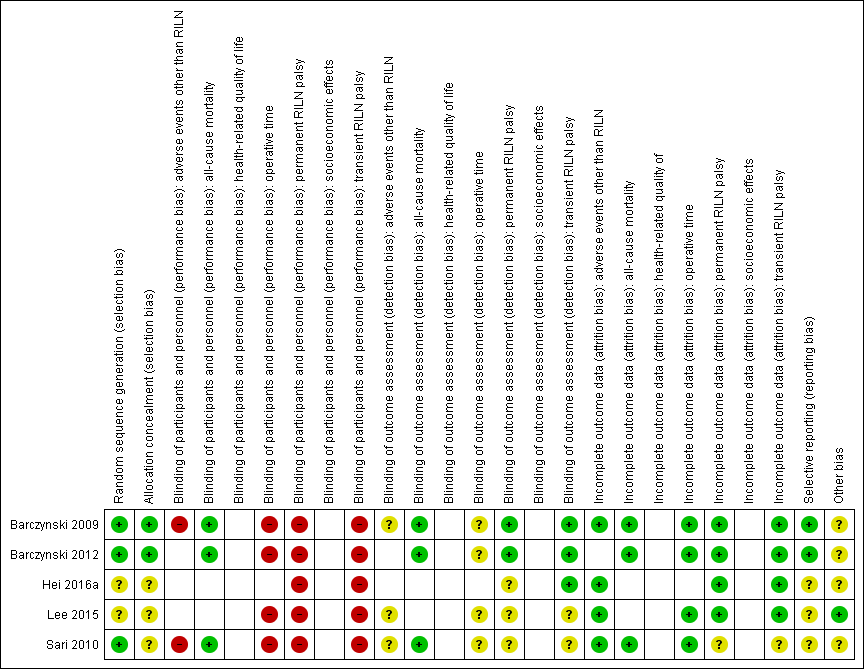
For an overview of review authors' judgements about each risk of bias item for individual trials and across all trials see Figure 5 and Figure 6.

'Risk of bias' summary: review authors' judgements about each risk of bias item for each included trial ((blank cells indicate that the particular outcome was not measured in the associated trial)
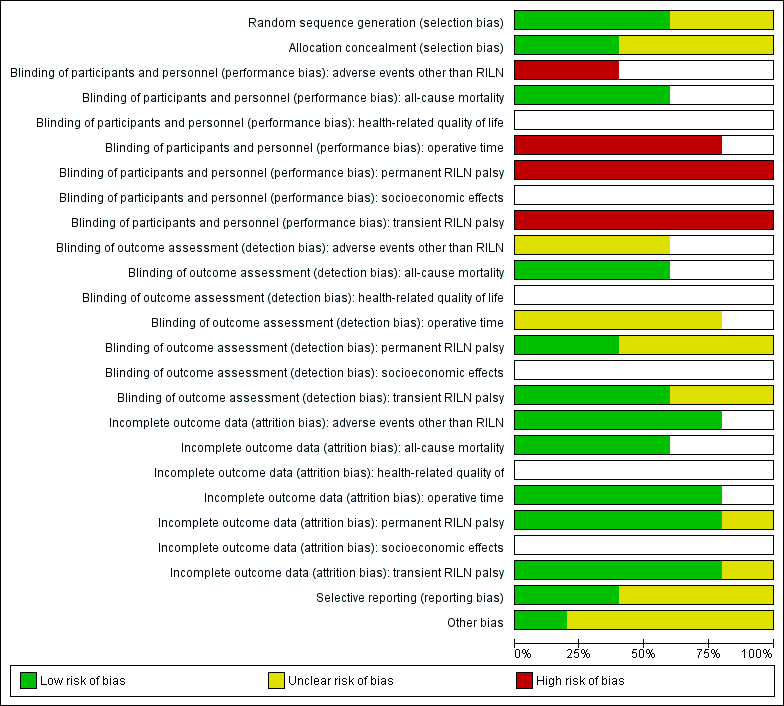
'Risk of bias' graph: review authors' judgements about each risk of bias item presented as percentages across all included trials (blank cells indicate that the particular outcome was not measured in some or all trials)
Allocation
Random sequence generation was well explained in three trials (Barczynski 2009; Barczynski 2012; Sari 2010), so we judged them at low risk of bias, with the exception of Hei 2016a and Lee 2015 with an unclear process of randomisation.
Two out of five trials reported details of allocation concealment and we considered them as low risk of bias (Barczynski 2009; Barczynski 2012). Three trials had an unclear reporting of the allocation concealment (Hei 2016a; Lee 2015; Sari 2010).
Blinding
No publication provided information about blinding of participants and personnel but we believe personnel were probably not blinded in any trial. We therefore assigned a high risk of performance bias to the trials that reported the outcomes permanent, transient RILN palsy and operative time. In Barczynski 2009, the authors stated that an ear, nose and throat (ENT) specialist who performed laryngeal examinations on postoperative day two and followed up participants in case of nerve injury was blinded to trial conditions. In Barczynski 2012 the authors reported the procedure of the blinding of outcome assessment for adverse events other than RILN ("The assessment protocol was strictly followed by the ENTspecialist (AH), who was blinded to the patient relevant group assignment").
Incomplete outcome data
All included trials specified participants' withdrawals or reasons for withdrawal. They analysed data mostly on an intention‐to‐treat basis. Sari 2010 excluded 4.3% of enrolled participants in the IONM group due to lack of signal. Barczynski 2012 lost a total of nine participants (4.3%) during follow up without providing reasons in the publication, however, the number of participants lost to follow‐up was balanced among treatment arms; therefore, it is unlikely that the low attrition rate affected outcome measures.
Selective reporting
Four trials provided a clinical trial identifier or a reference to a protocol (Barczynski 2009; Barczynski 2012; Hei 2016a; Lee 2015). We could not identify the protocol for Hei 2016a and Lee 2015. The primary outcomes in ClinicalTrials.gov (NCT00661024; NCT01395134), and in the published articles (Barczynski 2009; Barczynski 2012), were the same. The remaining trial (Sari 2010), had an unclear risk of reporting bias due to no protocol being available.
Other potential sources of bias
Four trials measured clustered data for the outcomes transient and permanent RILN palsy but did not use adequate statistical analyses for these data (Barczynski 2009; Barczynski 2012; Hei 2016a; Sari 2010). We, therefore, judged them to be at unclear risk of other bias.
Effects of interventions
Baseline characteristics
For details of baseline characteristics, see Appendix 5 and Appendix 6.
Intraoperative neuromonitoring with and without visual nerve identification versus visual nerve identification only
Primary outcomes
Permanent RILN palsy
Permanent RILN palsy was a rare event. Comparing IONM with visual nerve identification only for nerves at risk showed a risk ratio (RR) of 0.77 (95% CI 0.33 to 1.77; P = 0.54; 4 trials; 2895 nerves at risk; very low‐certainty evidence; Analysis 1.1). Ten of 1451 operated nerves (0.7%) in the IONM group compared with 13 of 1444 operated nerves (0.9%) in the visual identification only group showed permanent nerve damage. For clustered data in trials where the unit of analysis was the nerve and not the participant, we recognised that the resulting 95% CIs produced were probably narrower, and the actual variance greater, than reported here. No trial performed an adequate statistical analysis with regard to the cluster design. Therefore, results of Analysis 1.1 have to be interpreted as an effect estimate with probably even larger 95% CIs than indicated. There were no substantial differences in fixed‐ versus random‐effects RRs. The 95% prediction interval ranged between 0.12 and 4.79.
Transient RILN palsy
IONM compared with visual nerve identification only for nerves at risk, showed a RR of 0.62 (95% CI 0.35 to 1.08; P = 0.09; 4 trials; 2895 nerves at risk; very low‐certainty evidence; Analysis 1.2). Thirty of 1451 operated nerves (2.1%) in the IONM group compared with 52 of 1444 operated nerves (3.6%) in the visual identification only group showed transient nerve damage. The use of a fixed‐effect model resulted in a RR slightly more in favour of IONM (RR 0.58, 95% CI 0.37 to 0.90). For clustered data in trials where the unit of analysis was the nerve and not the participant, we recognised that the resulting 95% CIs produced were probably narrower, and the actual variance greater, than reported here. None of the included trials performed an adequate statistical analysis with regard to the cluster design. Therefore, results of Analysis 1.2 have to be interpreted as an effect estimate with probably even larger 95% CIs than indicated. The 95% prediction interval ranged between 0.12 and 3.11.
Health‐related quality of life
Health‐related quality of life was not reported in any trial
Secondary outcomes
Adverse events other than permanent or transient RILN palsy (transient hypoparathyroidism)
Adverse events other than permanent or transient RILN palsy for IONM compared with visual nerve identification only showed a RR of 1.25 (95% CI 0.45 to 3.47; P = 0.66; 2 trials; 268 participants; very low‐certainty evidence; Analysis 1.3). Twenty of 147 participants (13.6%) in the IONM group compared with 17 of 139 participants (12.2%) in the visual identification only group experienced an adverse event. Use of a fixed‐effect model did not substantially change the effect size.
Operative time
The mean difference (MD) in operative time between the IONM group and the visual identification only group was −0.8 minutes (95% CI −11.2 to 9.6; P = 0.88; 4 trials; 1488 participants; very low‐certainty evidence; Analysis 1.4). Use of a fixed‐effect model showed a MD of 4.8 minutes (95% CI 2.3 to 7.3), in favour of visual nerve identification only. In Sari 2010, the surgical approach in around 80% of the participants was a lobectomy only. When removing this trial from the meta‐analysis, the MD was 5.5 minutes (95% CI −0.7 to 11.8; P = 0.08, 3 trials; 1251 participants). The 95% prediction interval ranged between −60.6 minutes and 71.7 minutes. The fixed‐effect model showed a MD of 7 minutes (95% CI 4.3 to 9.6), in favour of visual nerve identification only.
All‐cause mortality
In the three trials with 1438 participants providing information on this outcome (Barczynski 2009; Barczynski 2012; Sari 2010), no postoperative hospital deaths or deaths within the first 30 days occurred after thyroid surgery (moderate certainty evidence; Analysis 1.5).
Socioeconomic effects
None of the included trials reported socioeconomic effects.
Subgroup analyses
We did not perform subgroup analyses because there were not enough trials to estimate effects in various subgroups.
Sensitivity analyses
With the exception of random‐effects model versus fixed‐effect model, we did not perform sensitivity analyses because there were not enough trials. Model choice affected the direction of results for transient RILN palsy and operative time, but the practical differences were minor, nonetheless.
Assessment of reporting bias
We did not draw funnel plots due to the limited number of trials (N = 5).
Ongoing trials
We did not identify any ongoing RCTs.
Discussion
Summary of main results
We did not find compelling evidence for the superiority or inferiority of IONM over visual nerve identification alone on any of the outcomes measured.
Overall completeness and applicability of evidence
While there were five trials that met our inclusion criteria, at most, we could synthesise four trials for any one outcome. Many outcomes were low‐occurence events (e.g. all‐cause mortality), and there were no data on health‐related quality of life and socioeconomic events. There was marked clinical heterogeneity indicating difficult applicability of the results across a variety of clinical or experimental settings. Finally, there was a unit‐of‐analysis issue for the trials evaluating RILN palsy outcomes, not accounting for the clustering nature of nerves at the trial level.
Quality of the evidence
This review containing five trials does not provide robust evidence regarding IONM for reducing transient or permanent RILN palsy, other adverse events and operative time compared to visual nerve identification alone. We considered the certainty of the evidence for these outcomes to be very low according to GRADE. The reasons for downgrading included risk of bias (three out of five trials had unclear allocation concealment, three out of five trials had unclear reporting bias, all trials were exposed to performance bias), imprecision of results and inconsistency. The only outcome we considered as moderate‐certainty evidence was all‐cause mortality; no events occurred but only three trials reported this outcome.
Potential biases in the review process
Although our review was comprehensive in terms of the search strategy, the possible presence of reporting bias can not be excluded. We applied no restrictions or date limitations to the search and had access to all scientific databases. We contacted the trial authors of the included trials and attempted to gather all information required in order to limit this type of bias. However, only Barczynski (Barczynski 2009; Barczynski 2012), replied to our questions. We did not detect relevant departures from trial protocols during the review process.
For all analyses, we opted for a random‐effects analysis due to substantial clinical heterogeneity. For Analysis 1.4, we detected Sari 2010 as an outlier (which would give justification to exclude this trial), however, we decided to leave this trial in our analysis. New clinical trials are needed to clarify the situation.
Marginal decisions around the inclusion or exclusion of trials or use and analysis of data could have had an impact on the findings of the review (e.g. clinical heterogeneity, variation in trial design or delivery of intervention, prioritisation of data from multiple time points, definition of subgroups, alternative definitions of outcomes, use of adjusted as opposed to unadjusted data, outcome surrogacy). Analysis of data on primary outcomes involved consideration of clustered data. RILN palsy nerves in the original trials were used by trial authors as the denominator without adjustment for the non‐independence between nerves. Also, these trials did not employ adequate statistical measures. Because no intra‐cluster correlation data were available, we did not reanalyse clustered data for RILN palsy. Furthermore, CIs were consistent with both benefit and harm and would have been even wider had case re‐analyses been possible. Regarding the exclusion of trials, we excluded trials investigating injury of the external branch of the superior laryngeal nerve due to a previous decision reported in the protocol (Cirocchi 2016).
Agreements and disagreements with other studies or reviews
Ten previous systematic reviews and meta‐analyses of comparative trials on IONM versus visual nerve identification have been published (Bai 2018; Lombardi 2016; Malik 2016; Pisanu 2014; Rulli 2014; Sanabria 2013; Sun 2017; Wong 2017; Yang 2017; Zheng 2013); see Table 2. Two other meta‐analyses (Higgins 2011; Pardal‐Refoyo 2016), performed a pooled analysis of comparative and non‐comparative trials. Two meta‐analyses were performed on a specific subgroup: patients who underwent thyroid reoperations (Sun 2017), and high‐risk patients (re‐operation, thyroidectomy for malignancy, thyrotoxicosis and retrosternal goitre; Wong 2017).
| Author and year of publication | Number of trials included | RCTs included in current review and other published meta‐analyses | Quasi‐RCTs included in other published meta‐analyses | Number of nerves at risk | Permanent RILN palsy | Transient RILN palsy |
| 34 | 58,247 | RD −0.0026 (95% CI −0.0039 to −0.0012) | RR 0.71 (95% CI 0.57 to 0.88) | |||
| 24 | 17,203 | OR 0.78 (95% CI 0.55 to 1.09) | OR 0.76 (95% CI 0.61 to 0.94) | |||
| 10a | None | None | 10,615 | OR 1.33 (95% CI 0.94 to 1.88) | OR 1.47 (95% CI 1.07 to 2.00) | |
| 9b | None | None | 2436 | RR 0.426 (95% CI 0.196 to 0.925) | RR 0.607 (95% CI 0.270 to 1.366) | |
| 4c | 1465d | RD 0.00 (95% CI 0.01 to 0.00) | NR | |||
| 10e | None | None | 38,820 | RR 0.79 (95% CI 0.61to 1.01) | NR | |
| 17 | None | 44,575 | NR | NR | ||
| 8 | 5257 | RR 0.73 (95% CI 0.44 to 1.23) | RR 0.73 (95% CI 0.54 to 0.98) | |||
| 20 | 35,513 | OR 0.884 (95% CI 0.687 to 1.136) | OR 0.946 (95% CI 0.817 to 1.096) | |||
| 6 | 3064 | RD 0 (95% CI ‐1 to 0) | RD −2 (95% CI −5.1 to 1) | |||
| 14 | None | 36,487 | OR 0.74 (95% CI 0.59 to 0.92) | OR 0.80 (95% CI 0.65 to 0.99) |
aHigh‐risk thyroidectomy (reoperation, thyroidectomy for malignancy, thyrotoxicosis or retrosternal goitre)
bThyroid re‐operations
cOnly RCTs
dParticipants
eOnly non‐RCTs
CI: confidence interval; EBSLN: external branch of superior laryngeal; N: number; NAR: nerves at risk; NR: not reported; OR: odds ratio; RCT: randomized controlled trial; RD: risk difference; RILN: recurrent inferior laryngeal nerve; RR: risk ratio
The results of the previous reviews were heterogeneous and conflicting. There was evidence for a decrease of transient and permanent RILN injury (Bai 2018; Zheng 2013), a decrease of transient RILN injury (Wong 2017; Yang 2017), a decrease of permanent RILN injury (Sun 2017), no substantial decrease of permanent RILN injury (Lombardi 2016), and no substantial decrease for transient and permanent RILN injury (Malik 2016; Pisanu 2014; Sanabria 2013).
The reasons for these differences may be explained by the continuous evolution and progress of IONM technology and the rising surgical awareness for the need of strict adherence to a standardised approach to IONM, as outlined in the published guideline statements (Barczynski 2012; Randolph 2011). In the older trials, sensitivity and specificity in RILN identification was probably lower. Moreover, the use of a non‐standardised approach to IONM procedures may have limited the potential of the method in prognostication of postoperative neural function. Only a few centres used routine postoperative laryngoscopy, whereas “no hoarseness” reported by the patient or found on clinical examination served as sufficient proof of intact vocal folds and RILN function in the majority of centres. This may have resulted in an underestimation of the incidence of RILN injury (Henry 2017). Moreover, assessment of novel technology of continuous vagal IONM, which allows for recognition of impending neural injury by EMG change and has the potential to prevent neural injury by modification of surgical manoeuvres, was outside the scope of the majority of published systematic reviews and meta‐analyses.
Nerve integrity monitoring endotracheal tube for electromyography signals of a patient's laryngeal muscles (drawn by Silvia Marola)
Monitoring endotracheal tube in position positioned at the patient's vocal folds (drawn by Silvia Marola)

Basic monitoring equipment setup (drawn by Silvia Marola)
EMG: electromyography;ET: endotracheal tube; GND: ground electrodes; REC: recording electrodes

Trial flow diagram
'Risk of bias' summary: review authors' judgements about each risk of bias item for each included trial ((blank cells indicate that the particular outcome was not measured in the associated trial)

'Risk of bias' graph: review authors' judgements about each risk of bias item presented as percentages across all included trials (blank cells indicate that the particular outcome was not measured in some or all trials)

Comparison 1 Intraoperative neuromonitoring versus visual nerve identification only, Outcome 1 Permanent RILN palsy.

Comparison 1 Intraoperative neuromonitoring versus visual nerve identification only, Outcome 2 Transient RILN palsy.

Comparison 1 Intraoperative neuromonitoring versus visual nerve identification only, Outcome 3 Adverse events other than RILN palsy.

Comparison 1 Intraoperative neuromonitoring versus visual nerve identification only, Outcome 4 Operative time.

Comparison 1 Intraoperative neuromonitoring versus visual nerve identification only, Outcome 5 All‐cause mortality.
| Intraoperative neuromonitoring compared to visual nerve identification only | ||||||
| Patients: adults undergoing thyroid surgery | ||||||
| Outcomes | Risk with visual nerve identification only | Risk with intraoperative neuromonitoring | Relative effect (95% CI) | № of participants/nerves at risk (trials) | Certainty of the evidence (GRADE) | Comments |
| Permanent RILN palsy (nerves) Definition: injury detected clinically, by laryngoscopy or both, in which the motility of the vocal cords did not recover within 6 months after surgery Follow‐up: 6‐12 months | 9 per 1000 | 7 per 1000 (3 to 16) | RR 0.77 | 2895 (4) | ⊕⊝⊝⊝ | Numbers refer to 'nerves at risk'; CI probably wider because of clustered data The 95% prediction interval ranged between 0.12 and 4.79 |
| Transient RILN palsy (nerves) Definition: injury detected clinically, by laryngoscopy or both, in which the motility of the vocal cords recovered within 6 months after surgery Follow‐up: 6‐12 months | 36 per 1000 | 22 per 1000 (13 to 39) | RR 0.62 | 2895 (4) | ⊕⊝⊝⊝ | Numbers refer to 'nerves at risk'; CI probably wider because of clustered data The 95% prediction interval ranged between 0.12 and 3.11 |
| Health‐related quality of life | Not reported | |||||
| Adverse events other than RILN palsy (participants) Definition: transient hypoparathyroidism Follow‐up: 6‐12 months | 122 per 1000 | 153 per 1000 (55 to 424) | RR 1.25 | 286 (2) | ⊕⊝⊝⊝ | ‐ |
| Operative time (min) Definition: time from the first skin incision to skin closure Follow‐up: 6‐12 months | The mean operative time ranged across control groups from 82.4 min to 274.2 min | The mean operative time in the intervention groups was 5.5 min longer (0.7 min shorter to 11.8 min longer) | ‐ | 1251 (3) | ⊕⊝⊝⊝ | The 95% prediction interval ranged between −60.6 min and 71.7 min |
| All‐cause mortality (nerves) | See comment | 1438 (3) | ⊕⊕⊕⊝ | 3 of 5 trials provided data on all‐cause mortality, no deaths were reported | ||
| Socioeconomic effects | Not reported | |||||
| *The risk in the intervention group (and its 95% confidence interval) is based on the assumed risk in the comparison group and the relative effect of the intervention (and its 95% CI). | ||||||
| GRADE Working Group grades of evidence | ||||||
| aDowngraded by one level because of performance bias, by one level because of inconsistency (no consistent direction of effects) and by one level because of imprecision (CI consistent with both benefit and harm, small number of trials, not a common event, i.e. ≤ 1/100) ‐ see Appendix 15 | ||||||
| Trial ID | Intervention(s) and comparator(s) | Description of power and sample size calculation | Screened/eligible | Randomised | Analysed | Finishing trial | Randomised finishing trial | Follow‐up |
| (parallel RCT) | I: RILN visualisation with neuromonitoring | "Our study had some limitations. First, this was a small sample study. To draw more persuasive conclusions, at least 434 RLNs in each group are needed to evaluate RLN injury reduction from 10% to 5% with a power of 80% and P = .05" | ‐ | 33 | 33 | 33 | 100 | 6 months |
| C: RILN visualisation alone | 37 | 37 | 37 | 100 | ||||
| total: | 70 | 70 | 70 | 100 | ||||
| (parallel RCT) | I: RILN visualisation with neuromonitoring | "The sample size was estimated based on the principle of detecting a difference of ‐10 units for VRP and of ‐5 for VHI between the mean of the IONM and non‐IONM groups with a 90% probability at P < .05, using power curve and sample size tools for one‐way analysis of variance" | ‐ | 25 | 25 | 25 | 100 | 12 months |
| C: RILN visualisation alone | 25 | 25 | 25 | 100 | ||||
| total: | 50 | 50 | 50 | 100 | ||||
| (parallel RCT) | I: RILN visualisation with neuromonitoring | "The sample size was estimated based on the principle of detecting a 5 % difference in the incidence of primary or secondary outcome measures with a 90 % probability at P < 0.05" | 517 | 105 | 105 | 100 | 95.2 | 6 months |
| C: RILN visualisation alone | 105 | 105 | 101 | 96.2 | ||||
| total: | 210 | 210 | 201 | 95.7 | ||||
| (parallel RCT) | I: RILN visualisation with neuromonitoring | ‐ | 254 | 123 | ‐a | ‐a | ‐a | 12 months |
| C: RILN visualisation alone | 114 | ‐a | ‐a | ‐a | ||||
| total: | 236 | ‐a | ‐a | ‐a | ||||
| (parallel RCT) | I: RILN visualisation with neuromonitoring | "The sample size was estimated based on the principle of detecting a 2 per cent difference in the incidence of transient RLN injury with a 90 per cent probability at P < 0·050" | 1488 | 500 | 500 | 500 | 100 | 12 months |
| C: RILN visualisation alone | 500 | 500 | 500 | 100 | ||||
| total: | 1000 | |||||||
| Grand total | All interventions | 781 | ||||||
| All comparators | 777 | |||||||
| All interventions and comparators | 1558 | |||||||
| ‐ denotes not reported. aTrial authors did not report the number of participants but the number of nerves C: comparator; I: intervention; RCT: randomised controlled trial; RILN: recurrent inferior laryngeal nerve | ||||||||
| Author and year of publication | Number of trials included | RCTs included in current review and other published meta‐analyses | Quasi‐RCTs included in other published meta‐analyses | Number of nerves at risk | Permanent RILN palsy | Transient RILN palsy |
| 34 | 58,247 | RD −0.0026 (95% CI −0.0039 to −0.0012) | RR 0.71 (95% CI 0.57 to 0.88) | |||
| 24 | 17,203 | OR 0.78 (95% CI 0.55 to 1.09) | OR 0.76 (95% CI 0.61 to 0.94) | |||
| 10a | None | None | 10,615 | OR 1.33 (95% CI 0.94 to 1.88) | OR 1.47 (95% CI 1.07 to 2.00) | |
| 9b | None | None | 2436 | RR 0.426 (95% CI 0.196 to 0.925) | RR 0.607 (95% CI 0.270 to 1.366) | |
| 4c | 1465d | RD 0.00 (95% CI 0.01 to 0.00) | NR | |||
| 10e | None | None | 38,820 | RR 0.79 (95% CI 0.61to 1.01) | NR | |
| 17 | None | 44,575 | NR | NR | ||
| 8 | 5257 | RR 0.73 (95% CI 0.44 to 1.23) | RR 0.73 (95% CI 0.54 to 0.98) | |||
| 20 | 35,513 | OR 0.884 (95% CI 0.687 to 1.136) | OR 0.946 (95% CI 0.817 to 1.096) | |||
| 6 | 3064 | RD 0 (95% CI ‐1 to 0) | RD −2 (95% CI −5.1 to 1) | |||
| 14 | None | 36,487 | OR 0.74 (95% CI 0.59 to 0.92) | OR 0.80 (95% CI 0.65 to 0.99) | ||
| aHigh‐risk thyroidectomy (reoperation, thyroidectomy for malignancy, thyrotoxicosis or retrosternal goitre) CI: confidence interval; EBSLN: external branch of superior laryngeal; N: number; NAR: nerves at risk; NR: not reported; OR: odds ratio; RCT: randomized controlled trial; RD: risk difference; RILN: recurrent inferior laryngeal nerve; RR: risk ratio | ||||||
| Outcome or subgroup title | No. of studies | No. of participants | Statistical method | Effect size |
| 1 Permanent RILN palsy Show forest plot | 4 | 2895 | Risk Ratio (M‐H, Random, 95% CI) | 0.77 [0.33, 1.77] |
| 2 Transient RILN palsy Show forest plot | 4 | 2895 | Risk Ratio (M‐H, Random, 95% CI) | 0.62 [0.35, 1.08] |
| 3 Adverse events other than RILN palsy Show forest plot | 2 | 286 | Risk Ratio (M‐H, Random, 95% CI) | 1.25 [0.45, 3.47] |
| 4 Operative time Show forest plot | 4 | 1488 | Mean Difference (IV, Random, 95% CI) | ‐0.80 [‐11.22, 9.62] |
| 5 All‐cause mortality Show forest plot | 3 | 1438 | Risk Ratio (M‐H, Random, 95% CI) | 0.0 [0.0, 0.0] |