Rehabilitación después de la cirugía por lesiones del tendón flexor de la mano
Información
- DOI:
- https://doi.org/10.1002/14651858.CD012479.pub2Copiar DOI

- Base de datos:
-
- Cochrane Database of Systematic Reviews
- Versión publicada:
-
- 13 enero 2021see what's new
- Tipo:
-
- Intervention
- Etapa:
-
- Review
- Grupo Editorial Cochrane:
-
Grupo Cochrane de Lesiones óseas, articulares y musculares
- Copyright:
-
- Copyright © 2021 The Cochrane Collaboration. Published by John Wiley & Sons, Ltd.
Cifras del artículo
Altmetric:
Citado por:
Autores
Contributions of authors
SP and BJ wrote the protocol. SP and BJ completed the searches, eligibility, risk of bias assessments and data extraction. SP completed the data analysis, and the GRADE tables. All authors contributed to, and approved, the final version of the review.
Contributions of the editorial base
Helen Handoll (Co‐ordinating Editor): edited the review; advised on methodology and review content; and approved the final version for publication.
Joanne Elliott (Managing Editor and Information Specialist): developed search strategies, coordinated the editorial process; advised on content; and edited the review.
Maria Clarke (Information Specialist): ran the search and edited the search methods section.
Sources of support
Internal sources
-
Harvard T.H. Chan School of Public Health, Center for Work, Health, and Well‐being, USA
Host institution for Dr. Susan E Peters
-
Brisbane Hand and Upper Limb Research Institute, Australia
Host institution for Professor Mark Ross
-
Sunshine Coast University Hospital, Queensland Health & Advanced Hand Clinic, Maroochydore, Queensland, Australia
Host institutions for Bhavana Jha
External sources
-
None, Other
Declarations of interest
SP: none known.
BJ: none known.
MR: none known.
Acknowledgements
We thank Helen Handoll and Joanne Elliott for their editorial feedback and support on this review. We also thank Maria Clarke for her help in running and reporting the searches. We are grateful to the external referees, Megan Blakeway, Christina Jerosch‐Herold and Jason Wong, for their helpful comments on the penultimate draft of the review. We thank Nicole Pitcher for her help with the plain language summary.
We thank the trial authors who took the time to respond to requests for further information about their trials, including Ali Kitis, K. Geetha, and Lars Adolfsson.
We are grateful to Hebatullah M. Abdulazeem and Martina Löwe for translation of articles.
This project was supported by the National Institute for Health Research via Cochrane Infrastructure funding to the Cochrane Bone, Joint and Muscle Trauma Group. The views and opinions expressed therein are those of the authors and do not necessarily reflect those of the Systematic Reviews Programme, NIHR, NHS or the Department of Health.
Version history
| Published | Title | Stage | Authors | Version |
| 2021 Jan 13 | Rehabilitation following surgery for flexor tendon injuries of the hand | Review | Susan E Peters, Bhavana Jha, Mark Ross | |
| 2017 Jan 07 | Rehabilitation following surgery for flexor tendon injuries of the hand | Protocol | Susan E Peters, Bhavana Jha, Mark Ross | |
Differences between protocol and review
Types of interventions
We included the comparison of different doses for interventions, other than orthosis‐wearing regimen; e.g. ultrasound dose, frequency or amount of interventions in types of intervention.
Types of outcome measures
For our second primary outcome (active finger ROM using goniometric measurement), we allowed classification of ROM using a categorical outcome.
We modified our definitions for timing of outcome measurement by inserting a medium term period (3 to 6 months) before the long term period, which now starts at over six months instead of over three months.
Assessment of risk of bias in the included studies
Linked with our revised definitions of timing of follow‐up assessment, we limited the second group to up to six months, and added in a third group for outcomes measured for greater than six months.
Keywords
MeSH
Medical Subject Headings (MeSH) Keywords
- Bias;
- Exercise Therapy [adverse effects, methods];
- Exoskeleton Device;
- Hand Injuries [*rehabilitation, surgery];
- Immobilization;
- Laser Therapy;
- Muscle Contraction [physiology];
- Postoperative Care [methods];
- Randomized Controlled Trials as Topic [statistics & numerical data];
- Range of Motion, Articular;
- Rupture [rehabilitation, surgery];
- Tendon Injuries [*rehabilitation, surgery];
- Ultrasonic Therapy;
Medical Subject Headings Check Words
Adolescent; Adult; Aged; Child; Female; Humans; Male; Middle Aged; Young Adult;
PICO
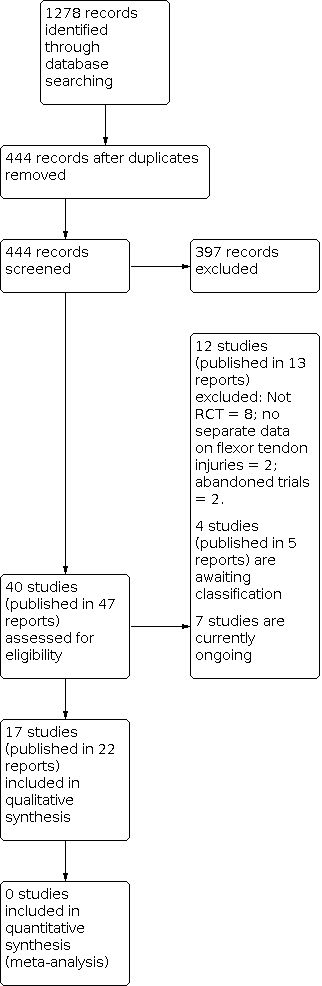
Diagram showing the flow of studies through the study selection process

Risk of bias graph: review authors' judgements about each risk of bias item presented as percentages across all included studies.

Risk of bias summary: review authors' judgements about each risk of bias item for each included study.
| Self‐reported function for ADL using a VAS (0 to 10; higher = better) | ||||||
| Study | Follow‐up | Active Median (IQR) | Active N (digits) | Control Median; IQR | Control N (digits) | Reported P value |
|---|---|---|---|---|---|---|
| Rigo 2017 | At 2 months | 7.2 (3.0) | 36 | 6.5 (3.1) | 32 | P = 0.204 |
| At 3 months | 7.3 (3.6) | 36 | 7.7 (3.0) | 31 | P = 0.850 | |
| At 6 months | 8.8 (1.5) | 32 | 8.5 (3.5) | 30 | P = 0.942 | |
| At 12 months | 9.3 (1.2) | 34 | 8.8 (2.0) | 29 | P = 0.113 | |
Comparison 1: Early active flexion plus controlled passive exercise regimen versus early controlled passive exercise regimen (modified Kleinert protocol), Outcome 1: Self‐reported function for ADL using a VAS (0 to 10; higher = better)

Comparison 1: Early active flexion plus controlled passive exercise regimen versus early controlled passive exercise regimen (modified Kleinert protocol), Outcome 2: Self‐reported function using VAS for ADLs (0 to 10; higher scores = better); secondary analyses

Comparison 1: Early active flexion plus controlled passive exercise regimen versus early controlled passive exercise regimen (modified Kleinert protocol), Outcome 3: Active finger range of motion (degrees)

Comparison 1: Early active flexion plus controlled passive exercise regimen versus early controlled passive exercise regimen (modified Kleinert protocol), Outcome 4: Finger range of movement ‐ Poor outcome

Comparison 1: Early active flexion plus controlled passive exercise regimen versus early controlled passive exercise regimen (modified Kleinert protocol), Outcome 5: Adverse events

Comparison 1: Early active flexion plus controlled passive exercise regimen versus early controlled passive exercise regimen (modified Kleinert protocol), Outcome 6: Strength (% of the contralateral hand or digit)

Comparison 2: Early active flexion + active extension exercise regimen (+ modified Kessler suture surgical technique) versus passive flexion + active extension exercise regimen (+ grasping suture and external pull‐out knot surgical technique), Outcome 1: Adverse events

Comparison 3: Active exercise regimen versus immobilisation regimen, Outcome 1: Range of movement at 12+ months: poor outcome

Comparison 3: Active exercise regimen versus immobilisation regimen, Outcome 2: Adverse events

Comparison 4: Early place and hold progressed to tendon gliding exercise regimen versus early passive progressed to active exercise regimen, Outcome 1: Grip strength at 12 weeks (% difference between normal and affected hands)

Comparison 5: Place and hold exercise regimen versus Controlled passive exercise regimen, Outcome 1: Function (self‐reported): DASH scores (0 to 100; higher score = more disability)

Comparison 5: Place and hold exercise regimen versus Controlled passive exercise regimen, Outcome 2: Range of movement (Total Active Movement) (degrees)

Comparison 5: Place and hold exercise regimen versus Controlled passive exercise regimen, Outcome 3: Range of movement (Strickland Criteria) at 8 weeks: Poor outcome

Comparison 5: Place and hold exercise regimen versus Controlled passive exercise regimen, Outcome 4: Adverse events

Comparison 5: Place and hold exercise regimen versus Controlled passive exercise regimen, Outcome 5: Function (observed): Jebsen Taylor at 52 weeks (seconds)

Comparison 5: Place and hold exercise regimen versus Controlled passive exercise regimen, Outcome 6: Function (observed): Purdue pegboard at 52 weeks (pegs)

Comparison 5: Place and hold exercise regimen versus Controlled passive exercise regimen, Outcome 7: Satisfaction with hand function (0 to 10: complete satisfaction) at 6 months

Comparison 6: Unrestricted activity at 8 weeks post‐surgery versus unrestricted activity at 10 weeks, Outcome 1: Adverse event (tendon rupture)

Comparison 7: Exoskeleton versus physiotherapy, Outcome 1: Function (self‐reported): DASH scores (0 to 100; higher score = more disability)

Comparison 7: Exoskeleton versus physiotherapy, Outcome 2: Active finger range of motion of PIP joint (degrees)

Comparison 7: Exoskeleton versus physiotherapy, Outcome 3: Active finger range of motion of DIP joint (degrees)

Comparison 7: Exoskeleton versus physiotherapy, Outcome 4: Active finger range of motion (Total Active Movement) (degrees)

Comparison 7: Exoskeleton versus physiotherapy, Outcome 5: Adverse events

Comparison 7: Exoskeleton versus physiotherapy, Outcome 6: Strength at 18 weeks

Comparison 8: Continuous passive motion device versus controlled passive progressed to active exercise regimen (Modified Kleinert), Outcome 1: Active finger range of motion (degrees)

Comparison 8: Continuous passive motion device versus controlled passive progressed to active exercise regimen (Modified Kleinert), Outcome 2: Range of movement at > 6 months (Strickland criteria) ‐ poor outcome

Comparison 8: Continuous passive motion device versus controlled passive progressed to active exercise regimen (Modified Kleinert), Outcome 3: Adverse event

Comparison 9: Ultrasound versus control, Outcome 1: Improvement in active range of movement (Difference between 3 and 12 weeks; Total Active Motion measured in degrees)

Comparison 9: Ultrasound versus control, Outcome 2: Active finger range of motion (Strickland classification) at 3 months ‐ Poor outcome

Comparison 9: Ultrasound versus control, Outcome 3: Adverse events

Comparison 10: Low‐level laser therapy versus placebo control, Outcome 1: Active finger range of motion (Total active motion (degrees)) at 12 weeks

Comparison 10: Low‐level laser therapy versus placebo control, Outcome 2: Range of movement at 12 weeks: poor outcome

Comparison 10: Low‐level laser therapy versus placebo control, Outcome 3: Adverse events

Comparison 10: Low‐level laser therapy versus placebo control, Outcome 4: Grip strength at 12 weeks (% lost using uninjured hand as comparison)

Comparison 11: Motor imagery versus control, Outcome 1: Strength (kg)
| Addition of active flexion exercises to controlled passive exercise regimen for rehabilitation following surgery for flexor tendon injuries of the hand | ||||||
| Patient or population: participants undergoing rehabilitation following surgery for flexor tendon injuries of the handa | ||||||
| Outcomes | Anticipated absolute effects* (95% CI) | Relative effect | № of participants | Certainty of the evidence | Comments | |
|---|---|---|---|---|---|---|
| Early controlled passive exercise regimen (modified Kleinert protocol) | Early active flexion plus early controlled passive exercise regimen | |||||
| Functional assessment using a patient reported outcome measure: Follow‐up: 6 months | Study population | ‐ | 62 fingers (1 RCT) | ⊕⊝⊝⊝ | The study reporting this outcome reported median and interquartile ranges. It found no evidence of a difference between the two groups (reported P = 0.942). It is very unlikely that a difference of 0.3 on an 11 point scale is clinically important. | |
| See comment. Median 8.5, IQR 3.5 | See comment. | |||||
| Functional assessment using a patient reported outcome measure: Follow‐up: 12 months | Study population | ‐ | 63 fingers | ⊕⊝⊝⊝ | The study reporting this outcome reported median and interquartile ranges. It found no evidence of a difference between the two groups (reported P = 0.113). It is very unlikely that a difference of 0.5 on an 11 point scale is clinically important | |
| See comment. Median 8.8, IQR 2.9 | See comment. | |||||
| Active finger range of motion | Study population | ‐ | 63 fingers | ⊕⊝⊝⊝ | This difference is not meaningful and could have been due to error in measurement: for goniometric measurement, the minimal detectable difference is between 12 and 30 degrees with a standard error of measurement ranging from 4 to 11 degrees per joint (Reissner 2019). | |
| Mean AROM in the control group was 134 degrees | MD 3 degrees higher | |||||
| Active finger range of motion | Study population | ‐ | 63 fingers | ⊕⊝⊝⊝ | This difference is not meaningful and could have been due to error in measurement: for goniometric measurement, the minimal detectable difference is between 12 and 30 degrees with a standard error of measurement ranging from 4 to 11 degrees per joint (Reissner 2019). | |
| Mean AROM in the control group was 140 degrees | MD 9 degrees higher | |||||
| Adverse events: participants incurring one or more adverse events Follow‐up: 12 months | Study population | RR 0.58 (0.23 to 1.44) | 69 fingers (1 RCT) | ⊕⊝⊝⊝ | The 15 adverse events comprised 3 tendon ruptures, 6 wound dehiscence, 1 complex regional pain syndrome and 5 transitory swelling and tenderness of the tendon sheaf. | |
| 282 per 1000 | 164 per 1000 (65 lower to 406 higher) | |||||
| Adverse event (tendon rupture) | Study population | RR 1.73 | 69 fingers | ⊕⊝⊝⊝ | All three tendon ruptures (4.3%) underwent secondary surgery. | |
| 31 per 1000 | 54 per 1000 | |||||
| *The risk in the intervention group (and its 95% confidence interval) is based on the assumed risk in the comparison group and the relative effect of the intervention (and its 95% CI). | ||||||
| GRADE Working Group grades of evidence | ||||||
| aThe majority (68%) were zone II flexor tendon repairs; the rest being zone I and III. dDowngraded one level due to serious indirectness reflecting the reflecting the uncertain nature of the outcome. eDowngraded two levels due to very serious imprecision reflecting the small number of events. | ||||||
| Active exercise regimen compared with an immobilisation regimen following surgery for flexor tendon injuries of the hand | ||||||
| Patient or population: participants undergoing rehabilitation following surgery for flexor tendon injuries of the handa | ||||||
| Outcomes | Anticipated absolute effects* (95% CI) | Relative effect | № of participants | Certainty of the evidence | Comments | |
|---|---|---|---|---|---|---|
| Immobilisation regimen for three weeks | Active exercise regimen commenced within one day post‐surgery | |||||
| Functional assessment using a patient reported outcome measure | See comment. | See comment. | Not estimable | ‐ | See comment. | Outcome was not reported |
| Functional assessment using a patient reported outcome measure | See comment. | See comment. | Not estimable | ‐ | See comment. | Outcome was not reported |
| Range of movement | See comment. | See comment. | Not estimable | ‐ | See comment. | Outcome was not reported |
| Range of movement | Study population | RR 0.08 | 84 | ⊕⊝⊝⊝ | Poor outcome is < 25% of normal. The 7 (15%) cases of poor range of finger movement were all in the immobilisation group | |
| 149 per 1000 | 12 per 1000 | |||||
| Adverse events: participants incurring one or more adverse events | See comment. | See comment. | Not estimable | 84 | See comment | Outcome was not reported. Only tendon rupture and indication for tenolysis data provided; see below. |
| Adverse events requiring (or indicated for) surgery | Study population | RR 0.64 | 84 | ⊕⊝⊝⊝ | All five cases of tendon rupture (13.5% of 37) needing surgical repair occurred after 2 weeks in the active mobilisation group and all 10 cases of range of motion deficiency (21.3% of 47) indicating scar adhesion and need for tenolysis occurred in the immobilisation group. | |
| 213 per 1000 | 137 per 1000 | |||||
| *The risk in the intervention group (and its 95% confidence interval) is based on the assumed risk in the comparison group (in this table, this is directly based on the study population) and the relative effect of the intervention (and its 95% CI). | ||||||
| GRADE Working Group grades of evidence | ||||||
| aAll were zone II flexor tendon repairs. bDowngraded two levels for very serious risk of bias reflecting detection bias (no blinding of outcome assessors), potential selection bias and attrition bias. cDowngraded one level for serious indirectness reflecting the unsatisfactory nature of the outcome. dDowngraded one level because of low number of events and wide confidence intervals for this outcome. eThese complications reflect the anticipated complications of early active mobilisation (early re‐rupture) and immobilisation (scar adhesions and contractures). It is uncertain whether tenolysis was actually done for those participants with range of motion deficit in the immobilisation group. | ||||||
| Place and hold exercise versus controlled passive exercise following surgery for flexor tendon injuries of the hand | ||||||
| Patient or population: participants undergoing rehabilitation following surgery for flexor tendon injuries of the handa | ||||||
| Outcomes | Anticipated absolute effects* (95% CI) | Relative effect | № of participants | Certainty of the evidence | Comments | |
|---|---|---|---|---|---|---|
| Controlled passive exercise regimen | Place and hold exercise regimen | |||||
| Functional assessment using a patient reported outcome measure: assessed with DASH questionnaire (0 to 100; higher scores = worse disability) | Study population | Not estimable | 26 | ⊕⊝⊝⊝ | The study reporting this outcome reported median and interquartile ranges, finding no evidence of a difference between the two groups (reported P = 0.62). | |
| See comment. Median 15, IQR 10 to 30 | See comment. Median 23, IQR 2 to 26 | |||||
| Functional assessment using a patient reported outcome measure: | Study population | ‐ | 89 | ⊕⊝⊝⊝ | These differences are not clinically important. The recommended minimal clinically important difference for DASH is 15 (DASH/QuickDASH). | |
| Mean DASH score was 3.1 | Mean DASH score was 1.1 lower (2.77 lower to 0.57 higher) | |||||
| Range of movement | See comment. | See comment. | Not estimable | ‐ | See comment. | Outcome was not reported |
| Range of movement | Study population | ‐ | 89 (102 digits) | ⊕⊝⊝⊝ | ||
| Mean ROM was 128 degrees | Mean ROM was 28 degrees higher | |||||
| Adverse events: participants incurring one or more adverse events | See comment. | See comment. | Not estimable | 84 | See comment. | This outcome was not reported by the three trials testing this comparison. Only tendon rupture (see next) was commonly reported. One trial (26 participants), reporting by tendon or digit (36 digits), also reported on scar adherence (reported only in the controlled passive group), flexion contracture at the DIP and PIP joints and tendon lag; very low certainty evidence for all individual complications. |
| Adverse events requiring (or indicated for) surgery | Study populationsh | RR 0.81 | 196 tendons | ⊕⊝⊝⊝ | These data were limited to tendon rupture. We considered that all 7 tendon ruptures (3.6% of 196 tendons) would have required surgery.j | |
| 40 per 1000 | 33 per 1000 (8 to 140) | |||||
| *The risk in the intervention group (and its 95% confidence interval) is based on the assumed risk in the comparison group (in this table, this is directly based on the study population) and the relative effect of the intervention (and its 95% CI). | ||||||
| GRADE Working Group grades of evidence | ||||||
| aThe majority were zone II flexor tendon repairs; one of the three studies making this comparison also included 7 zone I injuries and 7 zone III injuries. bAll exercises started at 3 days from surgery. The place and hold exercise regimens varied among the three studies. In two studies, the exercises were carried out with a dorsal orthosis and in one study, the dorsal orthosis was removal when doing the exercises cAll exercises started at 3 days from surgery. The controlled passive exercise regimens varied among the three studies. However, rubber band traction was common to all three. dDowngraded two levels for very serious risk of bias reflecting lack of blinding (performance and detection bias) eDowngraded one level for serious imprecision. fDowngraded one level for serious imprecision, also reflecting the potential 'ceiling' effect as the mean values were very low and thus cannot discriminate between the two groups. gDowngraded one level for serious imprecision as the data are presented for tendons not participants. hControl group risk was devised from the summed data from the three studies. These results were not available for participants rather than tendons. iDowngraded two levels for very serious imprecision reflecting a very low number of events and wide confidence interval for this outcome. jWe did not include the 14 cases of scar adherence (70% of 20 tendons) reported in the controlled passive group of one trial because the outcome was not defined and no details of the extent or consequences were provided. | ||||||
| Database | Period Searched | Date Searched | Number of hits |
|---|---|---|---|
| Cochrane Bone, Joint and Musculoskeletal Trials (BJMT) Specialised Register | 18 June 2019 | 18 June 2019 | 26 |
| CENTRAL | August 2020, Issue 8 | 11 August 2020 | 208 |
| MEDLINE | January 1946 to August 2020 | 10 August 2020 | 462 |
| Embase | January 1980 to June 2019 | 18 June 2019 | 227 |
| CINAHL PLUS | January 1937 to June 2019 | 18 June 2019 | 63 |
| AMED | January 1985 to August 2020 | 10 January 2017 | 75 |
| ClinicalTrials.gov | 11 August 2020 | 79 | |
| WHO International Clinical Trials Registry Platform (ICTRP) | 18 June 2019 | 138 |
| Study | Country | Setting | Recruited Participants; Digits; Tendons | Final follow‐up Participants; Digits; Tendons | Zones | Age (years) Mean (Range) | Male | Female |
|---|---|---|---|---|---|---|---|---|
| Egypt | Rehabilitation Department | 33; NR; 45 | 26; NR; 36 | I‐III | 26.8 (15‐60)a | 21a | 5a | |
| Sweden | NR | 96; 106; NR | 82; 91; 118 | II | 37a | 54a | 28a | |
| Iran | Hand therapy clinic | 54; 64; 108 | 54; 64; 108 | II | 28.5 (13‐50) | 37 | 17 | |
| India | Hospital | 106; 139; NR | 100; 131; NR | II | G1: NR (10‐45)a G2: 35 (22‐50)a | 89a | 11a | |
| USA | Multi‐centre hospital | 51; 60; 102b | 51; 60; 102 | II | 29.4a | NR | NR | |
| Germany | Physiotherapy clinic | 62; NR;NR | 59; NR; NR | II | 29.5 (18‐60) | 44 | 18 | |
| Sweden | NR | 100; 108; NR | NR; NR; NR | II | NR | NR | NR | |
| UK | Plastic surgery centre | 112; NR; NR | 80; NR; NR | I‐III | NR | NR | NR | |
| Turkey | Hand surgery centre | 25; 41; NR | 23; 39; NR | I‐V | 24 (7‐43) | 15 | 10 | |
| Iran | Plastic surgery centre | 97; 114; 114 | 77; 92; 92 | I‐III | 27a | 60a | 17a | |
| Norway | Orthopaedic surgery centre | 53; 73; 73 | 45; 63; 63 | I‐III | 38.7 (18‐72)c | 36c | 14c | |
| Denmark | Hand surgery centre | 39; 39; 39 | 33; 33; 33 | I‐II | NR | NR | NR | |
| Brazil | Hand surgery centre | 84; NR; 152 | NR; NR; NR | II | 34 (18‐66) | NR | NR | |
| Netherlands | Plastic surgery centre | 28; NR; NR | 25; NR; NR | All | 33.5a | 18a | 7a | |
| USA | Multi‐centre hand surgery centre | 103; 119; 238 | 89; 102; 204 | II | 29 (15‐51)a | 63a | 30a | |
| India | Plastic surgery centre | 30; NR; NR | 30; NR; NR | V | NR | NR | NR | |
| France | NR | 35; NR; NR | NR; NR NR | II | 35 | NR | NR | |
| NR: Not reported; G1: Group 1; G2: Group 2 aOnly reported at follow‐up (not at baseline) bParticipants were only eligible if they were available for the 6 month follow‐up. Thus, this number is likely to have been much higher than reported here. cExcludes 3 participants who experienced tendon ruptures after randomisation. | ||||||||
| Study ID | Function: patient‐reported | Active ROM | Adverse event | Passive ROM | Strength | Return to work | Function: objective measure | Quality of life | Satisfaction |
|---|---|---|---|---|---|---|---|---|---|
| X | X | X | X | ||||||
| X | X | X | X | X | |||||
| X | X | ||||||||
| X | X | X | |||||||
| X | X | ||||||||
| X | X | X | X | X | |||||
| X | X | ||||||||
| X | X | ||||||||
| X | X | X | |||||||
| X | X | X | |||||||
| X | X | X | X | ||||||
| X | X | X | |||||||
| X | X | ||||||||
| X | X | X | |||||||
| X | X | X | X | X | X | ||||
| X | X | X | |||||||
| X | X | X |
| Classification system | Outcome (% motion achieved) | Excellent | Good | Fair or satisfactory | Poor | Failure |
| Strickland‐Glogovac | % active PIP + DIP ROM (active flexion ‐ extension deficit) compared to contralateral side or 175 degrees* | 85% to 100% | 70% to 84% | 50% to 69% | 0% to 49% | Not applicable |
| ROM (in degrees) | > 150 | 125 to 149 | 90 to 124 | < 90 | Not applicable | |
| Strickland or Modified Strickland | % active PIP + DIP ROM (active flexion ‐ extension deficit) compared to contralateral side or 175 degrees* | 75% to 100% | 50% to 74% | 24% to 49% | 0% to 24% | Not applicable |
| ROM (in degrees) | > 132 | 88 to 131 | 45 to 87 | < 44 | Not applicable | |
| Tang*** | % active PIP + DIP ROM compared to contralateral side or 175 degrees* | 90% to 100% | 70% to 89% | 50% to 69% | 30% to 49% | < 30% |
| IFSSH | % Total active motion compared to total passive motion** | 75% to 100% | 50% to 74% | 24% to 49% | 0% to 24% | Not applicable |
| Total Active Motion | % active MCP + PIP + DIP ROM (active flexion ‐ extension deficit) compared to contralateral side | Normal | > 75% | 50% to 75% | < 50% | < pre‐surgery |
| DIP: distal interphalangeal; IFFSH: International Federation of Societies for Surgery of the Hand; MCP: metacarpophalangeal; ROM: range of movement; PIP: proximal interphalangeal *The sum of active ROM of the PIP and DIP joints is calculated in degrees. This is done by adding the flexion achieved at the PIP and DIP joints and subtracting any extension deficits from the total. Motion is reported as a % of the contralateral side. It is assumed that 175 degrees is the sum of motion of the normal PIP and DIP joints of the unaffected side. % motion achieved = ((PIP + DIP flexion) ‐ (PIP + DIP extension deficit)) X 100 divided by 175. ** % motion achieved = (Total active motion X 100) divided by Total passive motion. ***According to Tang, the excellent and good scores are further divided into plus and minus sub‐grades based on their grip strength and quality of motion (investigator’s subjective judgement of the coordination, visual arc and speed of motion). | ||||||
| Outcome or subgroup title | No. of studies | No. of participants | Statistical method | Effect size |
| 1.1 Self‐reported function for ADL using a VAS (0 to 10; higher = better) Show forest plot | 1 | Other data | No numeric data | |
| 1.2 Self‐reported function using VAS for ADLs (0 to 10; higher scores = better); secondary analyses Show forest plot | 1 | Mean Difference (IV, Fixed, 95% CI) | Totals not selected | |
| 1.2.1 ADL VAS at 2 months (0=worst; 10=best) | 1 | Mean Difference (IV, Fixed, 95% CI) | Totals not selected | |
| 1.2.2 ADL VAS at 3 months (0=worst; 10=best) | 1 | Mean Difference (IV, Fixed, 95% CI) | Totals not selected | |
| 1.2.3 ADL VAS at 6 months (0=worst; 10=best) | 1 | Mean Difference (IV, Fixed, 95% CI) | Totals not selected | |
| 1.2.4 ADL VAS at 12 months (0=worst; 10=best) | 1 | Mean Difference (IV, Fixed, 95% CI) | Totals not selected | |
| 1.3 Active finger range of motion (degrees) Show forest plot | 1 | Mean Difference (IV, Fixed, 95% CI) | Totals not selected | |
| 1.3.1 Total Active Movement at 1 month (degrees) | 1 | Mean Difference (IV, Fixed, 95% CI) | Totals not selected | |
| 1.3.2 Total Active Movement at 2 months (degrees) | 1 | Mean Difference (IV, Fixed, 95% CI) | Totals not selected | |
| 1.3.3 Total Active Movement at 3 months (degrees) | 1 | Mean Difference (IV, Fixed, 95% CI) | Totals not selected | |
| 1.3.4 Total Active Movement at 6 months (degrees) | 1 | Mean Difference (IV, Fixed, 95% CI) | Totals not selected | |
| 1.3.5 Total Active Movement at 12 months (degrees) | 1 | Mean Difference (IV, Fixed, 95% CI) | Totals not selected | |
| 1.4 Finger range of movement ‐ Poor outcome Show forest plot | 1 | Risk Ratio (M‐H, Fixed, 95% CI) | Totals not selected | |
| 1.4.1 Strickland classification at 1 month | 1 | Risk Ratio (M‐H, Fixed, 95% CI) | Totals not selected | |
| 1.4.2 Strickland classification at 2 months | 1 | Risk Ratio (M‐H, Fixed, 95% CI) | Totals not selected | |
| 1.4.3 Strickland classification at 3 months | 1 | Risk Ratio (M‐H, Fixed, 95% CI) | Totals not selected | |
| 1.4.4 Strickland classification at 6 months | 1 | Risk Ratio (M‐H, Fixed, 95% CI) | Totals not selected | |
| 1.4.5 Strickland classification at 12 months | 1 | Risk Ratio (M‐H, Fixed, 95% CI) | Totals not selected | |
| 1.4.6 Tang classification at 1 month | 1 | Risk Ratio (M‐H, Fixed, 95% CI) | Totals not selected | |
| 1.4.7 Tang classification at 2 months | 1 | Risk Ratio (M‐H, Fixed, 95% CI) | Totals not selected | |
| 1.4.8 Tang classification at 3 months | 1 | Risk Ratio (M‐H, Fixed, 95% CI) | Totals not selected | |
| 1.4.9 Tang classification at 6 months | 1 | Risk Ratio (M‐H, Fixed, 95% CI) | Totals not selected | |
| 1.4.10 Tang classification at 12 months | 1 | Risk Ratio (M‐H, Fixed, 95% CI) | Totals not selected | |
| 1.5 Adverse events Show forest plot | 1 | Risk Ratio (M‐H, Fixed, 95% CI) | Totals not selected | |
| 1.5.1 Tendon rupture | 1 | Risk Ratio (M‐H, Fixed, 95% CI) | Totals not selected | |
| 1.5.2 Complex Regional Pain Syndrome | 1 | Risk Ratio (M‐H, Fixed, 95% CI) | Totals not selected | |
| 1.5.3 Wound dehiscence | 1 | Risk Ratio (M‐H, Fixed, 95% CI) | Totals not selected | |
| 1.5.4 Transitory swelling + tenderness | 1 | Risk Ratio (M‐H, Fixed, 95% CI) | Totals not selected | |
| 1.5.5 Any adverse event | 1 | Risk Ratio (M‐H, Fixed, 95% CI) | Totals not selected | |
| 1.6 Strength (% of the contralateral hand or digit) Show forest plot | 1 | Mean Difference (IV, Fixed, 95% CI) | Totals not selected | |
| 1.6.1 Grip Strength at 3 months (% of the contralateral hand) | 1 | Mean Difference (IV, Fixed, 95% CI) | Totals not selected | |
| 1.6.2 Grip Strength at 6 months (% of the contralateral hand) | 1 | Mean Difference (IV, Fixed, 95% CI) | Totals not selected | |
| 1.6.3 Grip Strength at 12 months (% of the contralateral hand) | 1 | Mean Difference (IV, Fixed, 95% CI) | Totals not selected | |
| 1.6.4 Pinch Strength at 3 months (% of the contralateral digit) | 1 | Mean Difference (IV, Fixed, 95% CI) | Totals not selected | |
| 1.6.5 Pinch Strength at 6 months (% of the contralateral digit) | 1 | Mean Difference (IV, Fixed, 95% CI) | Totals not selected | |
| 1.6.6 Pinch Strength at 12 months (% of the contralateral digit) | 1 | Mean Difference (IV, Fixed, 95% CI) | Totals not selected | |
| Outcome or subgroup title | No. of studies | No. of participants | Statistical method | Effect size |
| 2.1 Adverse events Show forest plot | 1 | Risk Ratio (M‐H, Fixed, 95% CI) | Totals not selected | |
| 2.1.1 Tendon ruptures | 1 | Risk Ratio (M‐H, Fixed, 95% CI) | Totals not selected | |
| 2.1.2 Scar adhesions requiring surgery (Tenolysis) | 1 | Risk Ratio (M‐H, Fixed, 95% CI) | Totals not selected | |
| Outcome or subgroup title | No. of studies | No. of participants | Statistical method | Effect size |
| 3.1 Range of movement at 12+ months: poor outcome Show forest plot | 1 | Risk Ratio (M‐H, Fixed, 95% CI) | Totals not selected | |
| 3.1.1 IFSSH criteria | 1 | Risk Ratio (M‐H, Fixed, 95% CI) | Totals not selected | |
| 3.1.2 Strickland criteria | 1 | Risk Ratio (M‐H, Fixed, 95% CI) | Totals not selected | |
| 3.2 Adverse events Show forest plot | 1 | Risk Ratio (M‐H, Fixed, 95% CI) | Totals not selected | |
| 3.2.1 Tendon ruptures | 1 | Risk Ratio (M‐H, Fixed, 95% CI) | Totals not selected | |
| 3.2.2 Movement restrictions indicating need for tenolysis | 1 | Risk Ratio (M‐H, Fixed, 95% CI) | Totals not selected | |
| 3.2.3 Secondary surgery (actual or indicated) | 1 | Risk Ratio (M‐H, Fixed, 95% CI) | Totals not selected | |
| Outcome or subgroup title | No. of studies | No. of participants | Statistical method | Effect size |
| 4.1 Grip strength at 12 weeks (% difference between normal and affected hands) Show forest plot | 1 | Mean Difference (IV, Fixed, 95% CI) | Totals not selected | |
| Outcome or subgroup title | No. of studies | No. of participants | Statistical method | Effect size |
| 5.1 Function (self‐reported): DASH scores (0 to 100; higher score = more disability) Show forest plot | 2 | Mean Difference (IV, Fixed, 95% CI) | Totals not selected | |
| 5.1.1 DASH at 6 months | 1 | Mean Difference (IV, Fixed, 95% CI) | Totals not selected | |
| 5.1.2 DASH at 52 weeks | 1 | Mean Difference (IV, Fixed, 95% CI) | Totals not selected | |
| 5.2 Range of movement (Total Active Movement) (degrees) Show forest plot | 2 | Mean Difference (IV, Fixed, 95% CI) | Totals not selected | |
| 5.2.1 At 8 weeks | 1 | Mean Difference (IV, Fixed, 95% CI) | Totals not selected | |
| 5.2.2 At 52 weeks | 1 | Mean Difference (IV, Fixed, 95% CI) | Totals not selected | |
| 5.3 Range of movement (Strickland Criteria) at 8 weeks: Poor outcome Show forest plot | 1 | Risk Ratio (M‐H, Fixed, 95% CI) | Totals not selected | |
| 5.4 Adverse events Show forest plot | 3 | Risk Ratio (M‐H, Fixed, 95% CI) | Subtotals only | |
| 5.4.1 Tendon rupture | 3 | 196 | Risk Ratio (M‐H, Fixed, 95% CI) | 0.81 [0.19, 3.50] |
| 5.4.2 Scar adherence | 1 | 36 | Risk Ratio (M‐H, Fixed, 95% CI) | 0.04 [0.00, 0.66] |
| 5.4.3 Flexion contracture of the DIP joint | 1 | 36 | Risk Ratio (M‐H, Fixed, 95% CI) | 0.12 [0.02, 0.88] |
| 5.4.4 Flexion contracture of the PIP joint | 1 | 36 | Risk Ratio (M‐H, Fixed, 95% CI) | 0.47 [0.15, 1.48] |
| 5.4.5 FDS tendon lag | 1 | 36 | Risk Ratio (M‐H, Fixed, 95% CI) | 0.25 [0.06, 0.98] |
| 5.4.6 FDP tendon lag | 1 | 36 | Risk Ratio (M‐H, Fixed, 95% CI) | 0.17 [0.04, 0.62] |
| 5.5 Function (observed): Jebsen Taylor at 52 weeks (seconds) Show forest plot | 1 | Mean Difference (IV, Fixed, 95% CI) | Totals not selected | |
| 5.6 Function (observed): Purdue pegboard at 52 weeks (pegs) Show forest plot | 1 | Mean Difference (IV, Fixed, 95% CI) | Totals not selected | |
| 5.7 Satisfaction with hand function (0 to 10: complete satisfaction) at 6 months Show forest plot | 1 | Mean Difference (IV, Fixed, 95% CI) | Totals not selected | |
| Outcome or subgroup title | No. of studies | No. of participants | Statistical method | Effect size |
| 6.1 Adverse event (tendon rupture) Show forest plot | 1 | Risk Ratio (M‐H, Fixed, 95% CI) | Totals not selected | |
| Outcome or subgroup title | No. of studies | No. of participants | Statistical method | Effect size |
| 7.1 Function (self‐reported): DASH scores (0 to 100; higher score = more disability) Show forest plot | 1 | Mean Difference (IV, Fixed, 95% CI) | Totals not selected | |
| 7.1.1 DASH at 12 weeks | 1 | Mean Difference (IV, Fixed, 95% CI) | Totals not selected | |
| 7.1.2 DASH at 18 weeks | 1 | Mean Difference (IV, Fixed, 95% CI) | Totals not selected | |
| 7.2 Active finger range of motion of PIP joint (degrees) Show forest plot | 1 | Mean Difference (IV, Fixed, 95% CI) | Totals not selected | |
| 7.2.1 PIP joint range of motion at 6 weeks | 1 | Mean Difference (IV, Fixed, 95% CI) | Totals not selected | |
| 7.2.2 PIP joint range of motion at 12 weeks | 1 | Mean Difference (IV, Fixed, 95% CI) | Totals not selected | |
| 7.2.3 PIP joint range of motion at 18 weeks | 1 | Mean Difference (IV, Fixed, 95% CI) | Totals not selected | |
| 7.3 Active finger range of motion of DIP joint (degrees) Show forest plot | 1 | Mean Difference (IV, Fixed, 95% CI) | Totals not selected | |
| 7.3.1 DIP joint range of motion at 6 weeks | 1 | Mean Difference (IV, Fixed, 95% CI) | Totals not selected | |
| 7.3.2 DIP joint range of motion at 12 weeks | 1 | Mean Difference (IV, Fixed, 95% CI) | Totals not selected | |
| 7.3.3 DIP joint range of motion at 18 weeks | 1 | Mean Difference (IV, Fixed, 95% CI) | Totals not selected | |
| 7.4 Active finger range of motion (Total Active Movement) (degrees) Show forest plot | 1 | Mean Difference (IV, Fixed, 95% CI) | Totals not selected | |
| 7.4.1 TAM at 6 weeks | 1 | Mean Difference (IV, Fixed, 95% CI) | Totals not selected | |
| 7.4.2 TAM at 12 weeks | 1 | Mean Difference (IV, Fixed, 95% CI) | Totals not selected | |
| 7.4.3 TAM at 18 weeks | 1 | Mean Difference (IV, Fixed, 95% CI) | Totals not selected | |
| 7.5 Adverse events Show forest plot | 1 | Risk Ratio (M‐H, Fixed, 95% CI) | Totals not selected | |
| 7.5.1 Tendon rupture | 1 | Risk Ratio (M‐H, Fixed, 95% CI) | Totals not selected | |
| 7.5.2 CRPS (complex regional pain syndrome) | 1 | Risk Ratio (M‐H, Fixed, 95% CI) | Totals not selected | |
| 7.6 Strength at 18 weeks Show forest plot | 1 | Mean Difference (IV, Random, 95% CI) | Totals not selected | |
| 7.6.1 Grip strength (kg) | 1 | Mean Difference (IV, Random, 95% CI) | Totals not selected | |
| 7.6.2 Pinch strength (kg) | 1 | Mean Difference (IV, Random, 95% CI) | Totals not selected | |
| Outcome or subgroup title | No. of studies | No. of participants | Statistical method | Effect size |
| 8.1 Active finger range of motion (degrees) Show forest plot | 1 | Mean Difference (IV, Fixed, 95% CI) | Totals not selected | |
| 8.1.1 TAM at > 6 months | 1 | Mean Difference (IV, Fixed, 95% CI) | Totals not selected | |
| 8.2 Range of movement at > 6 months (Strickland criteria) ‐ poor outcome Show forest plot | 1 | Risk Ratio (M‐H, Fixed, 95% CI) | Totals not selected | |
| 8.3 Adverse event Show forest plot | 1 | Risk Ratio (M‐H, Fixed, 95% CI) | Totals not selected | |
| 8.3.1 Tendon rupture at >6 months | 1 | Risk Ratio (M‐H, Fixed, 95% CI) | Totals not selected | |
| 8.3.2 Infection at >6 months | 1 | Risk Ratio (M‐H, Fixed, 95% CI) | Totals not selected | |
| Outcome or subgroup title | No. of studies | No. of participants | Statistical method | Effect size |
| 9.1 Improvement in active range of movement (Difference between 3 and 12 weeks; Total Active Motion measured in degrees) Show forest plot | 1 | 131 | Mean Difference (IV, Fixed, 95% CI) | 26.47 [19.70, 33.24] |
| 9.1.1 1MHz; 0.7W/cm2 increased to 1w/cm2 | 1 | 50 | Mean Difference (IV, Fixed, 95% CI) | 31.50 [19.94, 43.06] |
| 9.1.2 1 MHz; 0.3w/cm2 increased to 1.0w/cm2 | 1 | 40 | Mean Difference (IV, Fixed, 95% CI) | 23.80 [11.89, 35.71] |
| 9.1.3 3Mhz; 0.5w/cm2 increased to 0.7w/cm2 | 1 | 41 | Mean Difference (IV, Fixed, 95% CI) | 23.90 [12.20, 35.60] |
| 9.2 Active finger range of motion (Strickland classification) at 3 months ‐ Poor outcome Show forest plot | 1 | Risk Ratio (M‐H, Fixed, 95% CI) | Totals not selected | |
| 9.3 Adverse events Show forest plot | 1 | Risk Ratio (M‐H, Fixed, 95% CI) | Totals not selected | |
| 9.3.1 Tendon rupture at 3 months | 1 | Risk Ratio (M‐H, Fixed, 95% CI) | Totals not selected | |
| 9.3.2 Wound dehiscence <3 months | 1 | Risk Ratio (M‐H, Fixed, 95% CI) | Totals not selected | |
| Outcome or subgroup title | No. of studies | No. of participants | Statistical method | Effect size |
| 10.1 Active finger range of motion (Total active motion (degrees)) at 12 weeks Show forest plot | 1 | Mean Difference (IV, Fixed, 95% CI) | Totals not selected | |
| 10.2 Range of movement at 12 weeks: poor outcome Show forest plot | 1 | Risk Ratio (M‐H, Fixed, 95% CI) | Totals not selected | |
| 10.2.1 Strickland scoring system at 12 months | 1 | Risk Ratio (M‐H, Fixed, 95% CI) | Totals not selected | |
| 10.3 Adverse events Show forest plot | 2 | Risk Ratio (M‐H, Fixed, 95% CI) | Totals not selected | |
| 10.3.1 Tendon rupture | 2 | Risk Ratio (M‐H, Fixed, 95% CI) | Totals not selected | |
| 10.3.2 Wound infection | 1 | Risk Ratio (M‐H, Fixed, 95% CI) | Totals not selected | |
| 10.4 Grip strength at 12 weeks (% lost using uninjured hand as comparison) Show forest plot | 1 | Mean Difference (IV, Fixed, 95% CI) | Totals not selected | |
| Outcome or subgroup title | No. of studies | No. of participants | Statistical method | Effect size |
| 11.1 Strength (kg) Show forest plot | 1 | Mean Difference (IV, Fixed, 95% CI) | Totals not selected | |
| 11.1.1 Grip strength (kg) at 12 weeks | 1 | Mean Difference (IV, Fixed, 95% CI) | Totals not selected | |
| 11.1.2 Pinch strength (kg) at 12 weeks | 1 | Mean Difference (IV, Fixed, 95% CI) | Totals not selected | |