Propofol w poprawie jakości snu u dorosłych na oddziałach intensywnej terapii
Abstract
Background
People in the intensive care unit (ICU) experience sleep deprivation caused by environmental disruption, such as high noise levels and 24‐hour lighting, as well as increased patient care activities and invasive monitoring as part of their care. Sleep deprivation affects physical and psychological health, and people perceive the quality of their sleep to be poor whilst in the ICU. Propofol is an anaesthetic agent which can be used in the ICU to maintain patient sedation and some studies suggest it may be a suitable agent to replicate normal sleep.
Objectives
To assess whether the quantity and quality of sleep may be improved by administration of propofol to adults in the ICU and to assess whether propofol given for sleep promotion improves both physical and psychological patient outcomes.
Search methods
We searched the Cochrane Central Register of Controlled Trials (CENTRAL; 2017, Issue 10), MEDLINE (1946 to October 2017), Embase (1974 to October 2017), the Cumulative Index to Nursing and Allied Health Literature (CINAHL) (1937 to October 2017) and PsycINFO (1806 to October 2017). We searched clinical trials registers for ongoing studies, and conducted backward and forward citation searching of relevant articles.
Selection criteria
We included randomized and quasi‐randomized controlled trials with adults, over the age of 16 years, admitted to the ICU with any diagnoses, given propofol versus a comparator to promote overnight sleep. We included participants who were and were not mechanically ventilated. We included studies that compared the use of propofol, given at an appropriate clinical dose with the intention of promoting night‐time sleep, against: no agent; propofol at a different rate or dose; or another agent, administered specifically to promote sleep. We included only studies in which propofol was given during 'normal' sleeping hours (i.e. between 10 pm and 7 am) to promote a sleep‐like state with a diurnal rhythm.
Data collection and analysis
Two review authors independently assessed studies for inclusion, extracted data, assessed risk of bias and synthesized findings.
Main results
We included four studies with 149 randomized participants. We identified two studies awaiting classification for which we were unable to assess eligibility and one ongoing study.
Participants differed in severity of illness as assessed by APACHE II scores in three studies and further differences existed between comparisons and methods. One study compared propofol versus no agent, one study compared different doses of propofol and two studies compared propofol versus a benzodiazepine (flunitrazepam, one study; midazolam, one study). All studies reported randomization and allocation concealment inadequately. We judged all studies to have high risk of performance bias from personnel who were unblinded. We noted that some study authors had blinded study outcome assessors and participants for relevant outcomes.
It was not appropriate to combine data owing to high levels of methodological heterogeneity.
One study comparing propofol with no agent (13 participants) measured quantity and quality of sleep using polysomnography; study authors reported no evidence of a difference in duration of sleep or sleep efficiency, and reported disruption to usual REM (rapid eye movement sleep) with propofol.
One study comparing different doses of propofol (30 participants) measured quantity and quality of sleep by personnel using the Ramsay Sedation Scale; study authors reported that more participants who were given a higher dose of propofol had a successful diurnal rhythm, and achieved a greater sedation rhythmicity.
Two studies comparing propofol with a different agent (106 participants) measured quantity and quality of sleep using the Pittsburgh Sleep Diary and the Hospital Anxiety and Depression Scale; one study reported fewer awakenings of reduced duration with propofol, and similar total sleep time between groups, and one study reported no evidence of a difference in sleep quality. One study comparing propofol with another agent (66 participants) measured quantity and quality of sleep with the Bispectral Index and reported longer time in deep sleep, with fewer arousals. One study comparing propofol with another agent (40 participants) reported higher levels of anxiety and depression in both groups, and no evidence of a difference when participants were given propofol.
No studies reported adverse events.
We used the GRADE approach to downgrade the certainty of the evidence for each outcome to very low. We identified sparse data with few participants, and methodological differences in study designs and comparative agents introduced inconsistency, and we noted that measurement tools were imprecise or not valid for purpose.
Authors' conclusions
We found insufficient evidence to determine whether administration of propofol would improve the quality and quantity of sleep in adults in the ICU. We noted differences in study designs, methodology, comparative agents and illness severity amongst study participants. We did not pool data and we used the GRADE approach to downgrade the certainty of our evidence to very low.
PICO
Streszczenie prostym językiem
Zastosowanie propofolu w poprawie jakości snu u pacjentów na oddziałach intensywnej terapii
Wprowadzenie
Niedobór snu wpływa na zdrowie psychiczne i fizyczne pacjentów. Uważa się też, że u ciężko chorych sen poprawia powrót do zdrowia i przeżywalność. Pacjenci leczeni w oddziałach intensywnej terapii doświadczają braku snu. Za słabą jakość snu mogą odpowiadać różne czynniki ‐ wysoki poziom hałasu, 24‐godzinne oświetlenie oraz inwazyjne zabiegi w zakresie opieki na pacjentem. Propofol jest anestetykiem podawanym we wlewie dożylnym używanym okazjonalnie do uspokojenia pacjentów na oddziale intensywnej terapii. W tym przeglądzie szukaliśmy badań, w których dorosłym pacjentom w okresie nocnym podawano propofol w celu poprawy jakości i ilości snu u pacjentów.
Charakterystyka badań
Dane naukowe są aktualne do października 2017 roku. Do przeglądu włączyliśmy cztery badania z randomizacją (badania kliniczne, w których pacjenci są losowo przydzielani do jednej z dwóch lub większej liczby grup badawczych) obejmujących 149 uczestników. Dwa z nich czekają na klasyfikację (ponieważ nie mogliśmy ocenić, czy kwalifikują się do przeglądu) a jedno z badań nadal trwa. Wszyscy uczestnicy badania byli w stanie krytycznym i przebywali w oddziale intensywnej terapii.
Kluczowe wyniki
Nie byliśmy w stanie porównać wyników tych badań ze względu na różnice w interwencji kontrolnej (w grupie porównawczej) i różnice w sposobie zaprojektowania badań. Jedno z badań porównywało propofol z brakiem leku. W tym badaniu do oceny jakość i ilość snu użyto polisomnografię (rejestruje fale mózgowe, poziom tlenu we krwi, puls, oddychanie, ruchy gałek ocznych oraz kończyn dolnych). Wykazano, że propofol nie wydłuża snu, jednak pacjenci budzili się rzadziej i na krótszy czas i ocenili, że jakość ich snu uległa poprawie. Jedno badanie porównywało podanie większej dawki propofolu w nocy (jako dodatkowe uspokojenie) ze stałą dawką propofolu podawaną w dzień i w nocy. W tym badaniu użyto Skali Sedacji Ramsaya (która normalnie używana jest przez anestezjologów, aby ocenić głębokość sedacji czyli uspokojenia) i wykazano, że rytm snu uległ poprawie. Dwa z badań porównywały zastosowanie propofolu i pochodnych benzodiazepiny (leki uspokajające; w jednym flunitrazepam, a w drugim midazolam). Te badania wykorzystywały Pittsburski Dziennik Jakości Snu oraz Szpitalną Skalę Lęku i Depresji w celu określenia jakości i ilości snu. Badanie porównujące propofol z flunitrazepamem wykazało zmniejszoną liczbę przebudzeń i skrócenie czasu ich trwania, ale podobny czas całkowitego snu w obu grupach, natomiast w porównaniu z midazolamem nie zaobserwowano różnic w jakości snu. W badaniu z flunitrazepamem do oceny użyto również Indeksu Bispektralnego (używanego przez anestezjologów w celu określenia głębokości znieczulenia) i wykazano dłuższy czas trwania głębokiego snu, z mniejszą liczbą przebudzeń. W badaniu z midazolamem zaobserwowano wyższe poziomy lęku i depresji w obu grupach, przy braku różnic u pacjentów otrzymujących propofol. W żadnym z badań nie zgłaszano działań niepożądanych.
Jakość danych naukowych
Oceniliśmy jakość dowodów naukowych jako bardzo niską. Znaleźliśmy jedynie cztery małe badania z randomizacją, których wyniki nie były zgodne. Odnotowaliśmy różnice w odniesieniu do ciężkości przebiegu choroby u uczestników i lekach porównywanych z propofolem we włączonych badaniach. Pomiar jakości snu oparty na dziennikach, kwestionariuszach i systemach punktowych opiera się na osobistych uczuciach lub opiniach lub jest pod ich wpływem. Obawialiśmy się, że personel jak i uczestnicy badania wiedzieli, jakie lekarstwa zostały im podane, co mogło mieć wpływ na wyniki. Tylko w jednym z badań użyto polisomnografii, która jest najbardziej właściwą i nieobarczoną błędem metodą pomiaru snu.
Wnioski
Nie byliśmy w stanie zebrać wystarczających dowodów, aby określić czy propofol podawany w nocy pacjentom przebywającym w oddziałach intensywnej terapii wpływa na poprawę jakości i ilości snu oraz stanu zdrowia.
Authors' conclusions
Summary of findings
| Propofol for the promotion of sleep in the intensive care unit versus no agent | ||||
| Patient or population: critically ill adults in the intensive care unit Settings: intensive care unit, Greece Intervention: propofol given to promote overnight sleep Comparison: no agent | ||||
| Outcomes | Impacts | No of Participants | Quality of the evidence | Comments |
| Quantity and quality of sleep as measured through reports of participants or family members or by personnel assessments Data collected at end of study follow‐up | Not reported. | ‐ | ‐ | ‐ |
| Quantity and quality of sleep as measured by PSG, actigraphy, BIS or EEG Data collected at end of study follow‐up | Outcome measured by PSG. Study authors reported no evidence of a difference in duration of sleep or sleep efficiency, and reported disruption to usual REM sleep with propofol. | 13 (1 study) | ⊕⊝⊝⊝ | We identified only 1 study and could not conduct a meta‐analysis. |
| Anxiety or depression, or both, as measured using validated tools Data collected at end of study follow‐up | Not reported. | ‐ | ‐ | ‐ |
| Adverse events (such as cardiovascular events, respiratory events or illness resulting from immune deficiency) | Not reported. | ‐ | ‐ | ‐ |
| BIS: Bispectral Index; EEG: electroencephalogram; PSG: polysomnography; REM: rapid eye movement. | ||||
| GRADE Working Group grades of evidence | ||||
| 1High level of performance bias; downgraded by one level. Data from single study with few participants; downgraded two levels for imprecision. | ||||
| Propofol for the promotion of sleep in the intensive care unit versus propofol at a different rate or dose | ||||
| Patient or population: critically ill adults in the intensive care unit Settings: intensive care unit, UK Intervention: propofol given to promote overnight sleep Comparison: propofol at a different rate or dose | ||||
| Outcomes | Impacts | No of Participants | Quality of the evidence | Comments |
| Quantity and quality of sleep as measured through reports of participants or family members or by personnel assessments Data collected at end of study follow‐up | Outcome measured using Ramsay Sedation Scale. Study authors reported that more participants who were given a higher dose of propofol had a successful diurnal rhythm, and achieved a greater sedation rhythmicity. | 30 (1 study) | ⊕⊝⊝⊝ | We identified only 1 study and could not conduct meta‐analysis. |
| Quantity and quality of sleep as measured by PSG, actigraphy, BIS or EEG Data collected at end of study follow‐up | Not reported. | ‐ | ‐ | ‐ |
| Anxiety or depression, or both, as measured using validated tools Data collected at end of study follow‐up | Not reported. | ‐ | ‐ | ‐ |
| Adverse events (such as cardiovascular events, respiratory events or illness resulting from immune deficiency) | Not reported. | ‐ | ‐ | |
| BIS: Bispectral Index; EEG: electroencephalogram; PSG: polysomnography. | ||||
| GRADE Working Group grades of evidence | ||||
| 1High level of performance bias; downgraded by one level. Concern about use of a sedation scale rather than a sleep scale; downgraded by one level for indirectness. One study, with few participants; downgraded one level for imprecision. | ||||
| Propofol for the promotion of sleep in the intensive care unit versus another agent specifically administered to promote sleep in the intensive care unit | ||||
| Patient or population: critically ill adults in the intensive care unit Settings: intensive care units in Germany and Switzerland Intervention: propofol given to promote overnight sleep Comparison: another agent specifically administered to promote overnight sleep | ||||
| Outcomes | Impacts | No of Participants | Quality of the evidence | Comments |
| Quantity and quality of sleep as measured through reports of participants or family members or by personnel assessments Data collected at end of study follow‐up | Outcome measured by different methods in each study (Pittsburgh Sleep Diary; Hospital Anxiety and Depression Scale). 1 study reported that participants given propofol had fewer awakenings, reduced duration of awakenings and similar total sleep duration. 1 study reported no evidence of a difference in sleep quality. | 106 (2 studies) | ⊕⊝⊝⊝ | We did not conduct a meta‐analysis because studies differed in types of measurement tools. |
| Quantity and quality of sleep as measured by PSG, actigraphy, BIS or EEG Data collected at end of study follow‐up | Outcome measured by BIS. 1 study reported that participants given propofol had longer time in deep sleep, with fewer arousals from sleep. | 66 (1 study) | ⊕⊝⊝⊝ | We identified only 1 study and could not conduct a meta‐analysis. |
| Anxiety or depression, or both, as measured using validated tools Data collected at end of study follow‐up | Study authors reported high levels of anxiety and depression in both participant groups, and no evidence of a difference with those given propofol. | 40 | ⊕⊝⊝⊝ | We identified only 1 study and could not conduct a meta‐analysis. |
| Adverse events (such as cardiovascular events, respiratory events or illness resulting from immune deficiency) | Not reported. | ‐ | ‐ | ‐ |
| BIS: Bispectral Index; EEG: electroencephalogram; PSG: polysomnography. | ||||
| GRADE Working Group grades of evidence | ||||
| 1High level of performance bias in studies; downgraded by one level. Outcome data were not consistent between studies; downgraded one level for inconsistency. Concern about validity of measurement tool in Treggiari‐Venzi 1996; downgraded by one level for indirectness. Limited number of studies, with few participants; downgraded one level for imprecision. 2High level of performance bias; downgraded by one level. Data from single study with few participants; downgraded by two levels for imprecision. Use of BIS to measure quality and quantity may not be appropriate, and may not provide a direct measurement, for this outcome; downgraded by one level for indirectness. 3High level of performance bias in studies; downgraded by one level. Data from single study with few participants; downgraded two levels for imprecision. | ||||
Background
Description of the condition
It is accepted that sleep is an essential requirement for good health. Sleep has a restorative function and for critically ill people is thought to improve healing and survival (Tembo 2009).
Sleep naturally follows a circadian rhythm of approximately 24 hours, in a pattern of once a day. Each period of sleep consists of phases lasting 90 minutes, with typical sleep 'architecture' involving a period of rapid eye movement (REM) and non‐rapid eye movement (NREM). The NREM stage is subdivided into three phases, now labelled as N1, N2 and N3 (also described as 'slow wave patterns'). The REM stage accounts for 15% to 20% of sleep time, and N2 of NREM for approximately 50% (Matthews 2011; Schupp 2003; Silber 2007).
It is likely that people in hospital will be subject to sleep disturbances; this is particularly likely for people in the intensive care unit (ICU). These people are critically ill with diagnoses such as respiratory insufficiency or failure, need for postoperative management, ischaemic heart disorder, sepsis and heart failure (Society of Critical Care Medicine). People may require specialist support after elective surgery or may be emergency admissions following medical events or trauma (e.g. with multiple injuries after a road traffic accident) (Intensive Care Foundation).
In the ICU, the ratio of staff to patients is higher than in general wards, and the environment typically includes 24‐hour lighting, a constant level of noise and more frequent patient care activities (measuring blood pressure, pulse and temperature; taking blood samples; administering medications, etc.) than in general wards. Many people (up to 40%; Esteban 2000) are mechanically ventilated and are subject to invasive procedures such as tracheal intubation and use of nasogastric tubes (Esteban 2000). In addition, people in the ICU have critical conditions that involve pain, anxiety and stress (Kamdar 2012a).
Patients are often prescribed drugs that further contribute to sleep loss. For example, drugs such as benzodiazepines are given for essential sedation (particularly to people who are mechanically ventilated) to relieve discomfort and stress. These agents alter sleep architecture, such that N2 of NREM is longer than normal, which may increase sleep time. However, they also reduce essential REM and N3 phases of sleep (Bourne 2004). Similarly, opioids are commonly used for analgesia in the ICU, and studies report that these, even when given in low doses and to healthy volunteers, reduce the amount of deep sleep by up to 50% (Dimsdale 2007; Grounds 2014).
People perceive that the quality of their sleep in the ICU is disrupted by frequent awakenings and increased daytime sleep (Freedman 1999). This perception is supported by trials that assessed sleep by using objective measures. Polysomnography (PSG) readings, which use a variety of channels to measure electrical activity of the heart, as well as muscle tension, airflow and eye movement, can be used to assess sleep. People in the ICU have alterations to their circadian rhythm, with up to 50% of sleep occurring during the day and with sleep arousals occurring as often as 39 times per hour in people who are mechanically ventilated (Parthasarathy 2004). Changes to sleep 'architecture' are significant, with reductions in both REM and N3 sleep (Cooper 2000; Drouot 2008).
Empirical evidence on immediate and long‐term physical consequences of sleep deprivation for people in the ICU is limited, but data suggest that sleep loss in healthy study participants can result in physical alterations to the immune system, as well as changes in metabolism, nitrogen balance, and the ventilatory and cardiovascular systems (Kamdar 2012a; Matthews 2011; Pisani 2015; Weinhouse 2006). For example, after loss of only one night's sleep, biomarkers are released that are present in people with coronary artery disease (Sauvet 2010), although no longitudinal studies have demonstrated that sleep disturbance in the ICU results in increased cardiovascular mortality (Kamdar 2012a). Psychological consequences associated with sleep loss, such as cognitive dysfunction, depression and poor quality of life measures, affect hospital length of stay, morbidity and mortality in critically ill people (e.g. Ely 2004). Psychological symptoms, such as post‐traumatic stress, may persist for several months after ICU discharge (Eddleston 2000; Figueroa‐Ramos 2009; Kamdar 2012a; Matthews 2011).
Description of the intervention
Non‐pharmacological interventions, such as noise and light reduction strategies (e.g. earplugs, eye masks; Richardson 2007), have been studied specifically in the ICU, and some have been shown to improve the quality of sleep. One Cochrane systematic review has explored the effectiveness of these various strategies (Hu 2015).
The present review aimed to look at the anaesthetic agent propofol as administered to adults in the ICU to promote sleep. This agent has the benefit of a rapid onset and offset, with a duration of action of 10 to 15 minutes (Brown 2001). It is given as a continuous intravenous infusion to induce and then maintain a state of general anaesthesia. Given at different doses, it can initiate different levels of consciousness on a continuum. It is currently among agents used in the ICU to maintain sedation (Grounds 2014).
How the intervention might work
Murphy 2011 used a high‐density electroencephalogram (EEG) on healthy participants anaesthetized with propofol and noted similarities to readings from PSG assessments of normal sleep. In particular, the slow waves produced after administration of propofol were similar (although not identical) in appearance to those seen during NREM of normal sleep. Results of animal studies suggested that recovery from sleep deprivation after propofol use is similar to naturally occurring sleep patterns (Tung 2004).
These study results suggest that propofol may be a suitable agent for replicating normal sleep. Given its rapid onset and offset, propofol can be administered at time points to maintain a person's usual diurnal rhythm and is a familiar drug in the ICU setting.
Why it is important to do this review
In 2014, the James Lind Alliance, a priority setting organization that works with patients, carers and clinicians to establish research priorities for health care, published its top 10 priorities for research in the intensive care setting (www.jla.nihr.ac.uk/priority‐setting‐partnerships/intensive‐care/top‐10‐priorities/). Among these are research topics relevant to enhancing patient comfort in the ICU (including minimizing pain, discomfort, agitation and anxiety), preventing physical consequences of critical illness and providing psychological support for patients.
Although sleep disruption may affect many people in hospital, those in the ICU are particularly vulnerable to disturbances that may subsequently lead to physical and psychological consequences, such as those identified above. Uncertainties remain about the benefits of pharmacological agents given to promote patient sleep in the ICU. It is unknown whether effectively promoting sleep will improve patient outcomes and provide immediate and long‐term clinical benefits. This review addressed the James Lind Alliance priority targets by assessing the effectiveness of propofol for sleep promotion in the ICU setting.
Objectives
To assess whether the quantity and quality of sleep may be improved by administration of propofol to adults in the ICU and to assess whether propofol given for sleep promotion improves both physical and psychological patient outcomes.
Methods
Criteria for considering studies for this review
Types of studies
We included randomized controlled trials (RCTs) and quasi‐randomized controlled trials (e.g. studies in which participants were assigned by alternation, date of birth or medical record number).
Types of participants
We included adults, over 16 years of age, who were admitted to any ICU as an elective or emergency patient, with medical, trauma or surgical primary diagnosis. We did not limit types of participants by severity of the condition. We included participants who were and were not mechanically ventilated.
Types of interventions
We included studies that compared the use of propofol, given at an appropriate clinical dose with the intention of promoting night‐time sleep, against:
-
no agent;
-
propofol at a different rate or dose; or
-
another agent, administered specifically to promote sleep.
We anticipated difficulties with terms used by study authors in this review, in particular, the terms 'sleep' and 'sedation.' Participants may be given propofol during the day with the aim of reducing consciousness as part of routine treatment in the ICU; this reduction in consciousness may be referred to as 'sedation.' We included only studies in which propofol was given during 'normal' sleeping hours (i.e. between 10 pm and 7 am) to promote a sleep‐like state with a diurnal rhythm.
Participants given propofol for daytime sedation may also be given propofol as an intervention agent to promote sleep. We included only studies in which study authors specified that propofol was given at night‐time at a higher dose and with a different stated aim, for example, to promote a diurnal rhythm. We did not specify the dose or rate of administration; a 'lower' daytime dose of propofol given to achieve sedation may differ between participant groups, depending on the severity of the condition of participants and whether participants were mechanically ventilated.
We anticipated that study authors may have used scales to determine levels of participant consciousness, and we planned to report study authors' interpretations of these scales. For example, participants may be sedated at level 3 on the Ramsay Sedation Scale ("Patient responds to commands only") and may be in a sleep‐like state at level 4 or 5 on this scale ("Patient exhibits brisk response to light glabellar tap or loud auditory stimulus" or "Patient exhibits a sluggish response to light glabellar tap or loud auditory stimulus") (Ramsay Sedation Scale).
It is reasonable that study participants may routinely be given other agents that have a sedative effect, for example, benzodiazepines or dexmedetomidine. We planned to record this information at the data collection stage and assess whether it was balanced between study arms. We planned to include these agents in the comparison 'propofol versus another agent, administered specifically to promote sleep' only if they had been given to all participants randomized to receive the comparative agent as part of the study protocol, rather than routinely to all participants. We planned to include multi‐arm studies, for example, those that compared different doses of propofol versus a different agent, only if each agent was used as a comparative agent by randomized participants as part of the study protocol.
Types of outcome measures
We were interested in quantity and quality of sleep. The experience of sleep may not always be representative of objectively measured sleep, and given that people perceive that they have disrupted sleep while in the ICU (Freedman 1999), we included this outcome, regardless of whether validated scales had been used for measurement. An added issue for this outcome is that critically ill people may have limited or no ability to communicate. Therefore, we were equally interested in the perceptions of carers and family members, who may have had an impression of sleep from the bedside, and in subjective measures used by personnel to assess sleep. We included assessments of sleep that had been performed at the end of follow‐up, as defined by study authors, for example, in the morning or during the daytime that followed administration of the intervention. We included assessments that were completed using scales, whether validated or not and modified for each user, such as the Richards‐Campbell Sleep Questionnaire (Richards 2000), or through compilation of sleep diaries, such as the Pittsburgh Sleep Diary (Monk 1994).
We planned also to report the quantity and quality of sleep as measured by objective equipment. In particular, PSG is considered the most accurate and objective tool that can be used to measure sleep and identify sleep disorders (Beecroft 2008). PSG measurements can be analysed to detect sleep onset, sleep efficiency and length of sleep stages, as well as irregularities, such as apnoea and interrupted sleep. However, we planned also to accept measurements obtained when other tools had been used to record sleep activity (Beecroft 2008; Benini 2005; Elliott 2013); 'actigraphy' is a wristband‐style tool that measures gross motor activity and is analysed to score total sleep time, sleep efficiency and awakenings; Bispectral Index (BIS) is typically used to calculate depth of anaesthesia through interpretation of an EEG reading; and measures of EEG alone can be used to interpret electrical brain activity as sleep time. We acknowledge that collection and interpretation of data using objective equipment may be problematic in critically ill people because manual methods having poor inter‐rater reliability (Ambrogio 2008). We planned to use interpretations of these measurements as reported by each study author to define the quantity and quality of sleep.
Our aim was to establish not only whether propofol improves sleep but whether improvement in sleep leads to better patient outcomes. This is reflected in our secondary outcome measure, which considered potential physical and psychological consequences of sleep loss, although we acknowledge that it may not be possible to ascertain whether a reduction in such events is directly attributable to improved sleep. We planned to assess physical consequences of sleep loss by collecting data from studies that reported the number of participants who had experienced an adverse event during follow‐up, as defined by study authors. We planned to include all adverse events as defined by study authors and diagnosed by clinicians at study level, such as cardiovascular or respiratory events and illness resulting from immune deficiency. We assessed psychological consequences of sleep loss by collecting data from studies that reported the number of participants who had been given a diagnosis of anxiety or depression, or both, by using validated assessment tools during follow‐up, as defined by study authors.
Primary outcomes
-
Quantity and quality of sleep as measured through reports of participants or family members or by personnel assessments.
-
Quantity and quality of sleep as measured by PSG, actigraphy, BIS or EEG.
Secondary outcomes
-
Anxiety or depression, or both, as measured using validated tools, such as the Hospital Anxiety and Depression Scale (HADS) (Zigmond 1983).
-
Adverse events (such as cardiovascular events, respiratory events or illness resulting from immune deficiency).
Search methods for identification of studies
Electronic searches
We identified RCTs through literature searching with systematic and sensitive search strategies as outlined in Chapter 6.4 of the Cochrane Handbook of Systematic Reviews of Interventions (Higgins 2011). We applied no restrictions to language or publication status.
We searched the following databases for relevant trials:
-
Cochrane Central Register of Controlled Trials (CENTRAL; 2017, Issue 10);
-
MEDLINE (OvidSP, 1946 to 3 October 2017);
-
Embase (OvidSP, 1974 to 3 October 2017);
-
Cumulative Index to Nursing and Allied Health Literature (CINAHL) (EBSCO, 1937 to 3 October 2017);
-
PsycINFO (EBSCO, 1887 to 3 October 2017).
We developed a subject‐specific search strategy in MEDLINE and used that as the basis for the search strategies in the other listed databases. The search strategy was developed in consultation with the Information Specialist. Search strategies can be found in Appendix 1; Appendix 2; Appendix 3; Appendix 4; and Appendix 5.
We scanned the following trial registries for ongoing and unpublished trials (2 June 2017):
-
World Health Organization International Clinical Trials Registry Platform (WHO ICTRP; www.who.int/ictrp/en/);
-
International Standard Randomised Controlled Trial Number (ISRCTN; www.isrctn.com/);
-
ClinicalTrials.gov (clinicaltrials.gov/).
Searching other resources
We carried out citation searching of identified included studies in Web of Science (apps.webofknowledge.com) on 13 June 2017 and conducted a search of grey literature through 'Opengrey' (www.opengrey.eu./) on 2 June 2017. We carried out backward citation searching of key reviews identified from the searches. We did not need to contact study authors or organizations.
Data collection and analysis
Two review authors (SL and OSR) independently carried out all data collection and analyses before comparing results and reaching consensus. We did not require use of a third review author to resolve conflicts.
Selection of studies
We used reference management software to collate search results and to remove duplicates (Endnote).
We used Covidence software to screen results of the search from titles and abstracts (Covidence), and identified potentially relevant studies by using this information alone. We sourced the full texts of all potentially relevant studies and considered whether they met the inclusion criteria (see Criteria for considering studies for this review). We planned to include abstracts at this stage only if they provided sufficient information and relevant results that included denominator figures for each intervention or comparison group.
We recorded the number of papers retrieved at each stage and reported this information using a PRISMA flow chart (Liberati 2009). We reported brief details of closely related papers excluded from the review.
Data extraction and management
We used a Cochrane template data extraction form to extract the following data from individual studies (Appendix 6).
-
Methods: type of study design; setting; dates of study and funding sources.
-
Participants: number of participants randomized to each group; baseline characteristics (to include Acute Physiology and Chronic Health Evaluation (APACHE) II scores, mechanical ventilation status and mode of ventilation, length of time in ICU before study commencement, and concomitant medications).
-
Interventions: details of intervention and comparison agents (to include dose and timing).
-
Outcomes: study outcomes as measured and reported by study authors (to include types of assessment tools, methods of data synthesis, units of measure and length of follow‐up).
-
Outcome data: results of outcome measures.
We considered the applicability of information obtained from individual studies and the generalizability of data to our intended study population (i.e. the potential for indirectness in our review).
If we identified associated publications from the same study, we planned to create a composite dataset from all eligible publications.
Assessment of risk of bias in included studies
We assessed study quality, study limitations and extent of potential bias by using the Cochrane 'Risk of bias' tool (Higgins 2011). We considered the following domains.
-
Random sequence generation (selection bias).
-
Allocation concealment (selection bias).
-
Blinding of participants and personnel (performance bias).
-
Blinding of outcome assessment (detection bias).
-
Incomplete outcome data (attrition bias).
-
Selective outcome reporting (reporting bias).
-
Other sources of bias (e.g. use of concomitant drugs).
Blinding to intervention and control agents may be feasible if agents are prepared in coded containers, for example, by an independent pharmacist; lack of blinding of personnel may introduce risk of bias. Successful blinding of participants to group allocation would be possible and would reduce performance and detection blinding. It is also feasible that outcome assessors could be blinded to group allocation to reduce bias. As participants are critically ill, rates of mortality and withdrawal of consent may be higher in the studies included in this review. Therefore, we paid particular attention to reasons given for losses, whether losses were related to the intervention or to chance alone and whether losses were comparable between groups. If participants received concomitant medication (e.g. morphine), we considered whether that medication could affect sleep and whether the concomitant medication was comparable between study groups. We addressed other potential biases in the included studies on an individual basis.
For each domain, two review authors (SL and OSR) independently used one of three measures (low, high or unclear) to judge whether study authors made sufficient attempts to reduce bias. We recorded this information in the 'Risk of bias' tables and presented a summary 'Risk of bias' figure.
Measures of treatment effect
We planned to collect information on adverse events as dichotomous data (number of participant events per group). We reported the psychological consequences of sleep deprivation as dichotomous or continuous data (e.g. number of participant events per group, mean scores per group on a scale measuring anxiety). We anticipated that measures of participant‐reported outcomes may differ for each study, depending on the scales used, as may objective measures of quantity and quality of sleep.
Unit of analysis issues
If multi‐arm studies compared more than one relevant intervention versus a control (e.g. no agent), we planned to include both intervention groups but split the data for the comparison or control group (using a 'halving' method), as recommended by Cochrane Handbook of Systematic Reviews of Interventions (Higgins 2011).
Dealing with missing data
We planned to assess whether all measured outcomes had been reported by study authors by comparing, wherever possible, published reports with protocols or clinical trial registration documents that had been prospectively published.
We assessed whether all randomized participants were included in outcome data. We planned to contact authors to request any missing outcome data that were not explained. If we were unable to obtain these data, we planned to report the data only as they were presented in the published report, to include intention‐to‐treat data. We planned not to combine unexplained incomplete data in meta‐analysis but to report these data narratively.
We planned to discuss the potential impact of missing data on the finding of our review in the 'Discussion' section.
Assessment of heterogeneity
We assessed whether our results showed evidence of inconsistency by considering heterogeneity. We planned to include all adult ICU participants with variation in severity of illness, as well as the potential for three different comparisons to propofol. Therefore, we anticipated likely heterogeneity between studies and assessed clinical and methodological heterogeneity by comparing similarities between participants, interventions and outcomes in our included studies, using information collected during the data extraction phase. We planned to complete meta‐analyses only for studies that were clinically and methodologically similar.
We planned to assess statistical heterogeneity by calculating the Chi2 or the I2 statistics. We planned to judge an I2 statistic above 60% and a Chi2 P value of 0.05 or less to indicate moderate to substantial statistical heterogeneity (Higgins 2011).
As well as looking at statistical results, we planned to consider point estimates and overlap of confidence intervals (CIs). If CIs overlap, then results are more consistent. However, combined studies may show a large consistent effect with significant heterogeneity. Therefore, we planned to interpret heterogeneity with caution (Guyatt 2011a).
Assessment of reporting biases
We attempted to source published protocols for each of our included studies by using clinical trials registers. We compared the published protocol of one study with published study results to assess the risk of selective reporting bias (Kondili 2012).
If we identified sufficient studies (i.e. more than 10 studies) (Higgins 2011), we planned to generate a funnel plot to assess risk of publication bias in the review; an asymmetrical funnel plot may indicate potential publication of only positive results (Egger 1997).
Data synthesis
We planned to complete meta‐analyses of outcomes when comparable effect measures were available from more than one study, and only when measures of clinical and statistical heterogeneity indicated that pooling of results was appropriate. We planned to use the statistical calculator in Review Manager 5 (RevMan 2014).
We anticipated that our primary outcome of subjective sleep measures would collect data from different sources (participants, carers and personnel). As some evidence suggests that nurses' assessment of sleep may differ from that of patients (Kamdar 2012b), we planned not to combine participant‐, family‐ and personnel‐reported assessments of sleep quality but to report these separately. In addition, we anticipated that subjective sleep assessment tools may not be comparable between studies. If sleep assessment tools included categories of sleep assessment, such as no sleep, minimal sleep, moderate sleep and majority sleep, we planned to split the data into dichotomous results by comparing the number of people reporting moderate and majority sleep versus the number reporting minimal and no sleep. We planned to combine data across assessment tools if data could be split into equivalent categories; otherwise, we presented a descriptive summary of the results of each study.
Similarly, we anticipated that our primary outcome of objective sleep assessment may be measured using different tools that were not comparable. Unless data were reported with the same tools and with the same measurements, such as mean score for BIS or mean length of each sleep stage for PSG, we presented a descriptive summary of the results of each study.
For dichotomous outcomes, we planned to calculate the odds ratio by using summary data presented for each trial. We planned to use the Mantel‐Haenszel effects model, unless events were extremely rare (one per 1000), in which case we planned to use Peto (Higgins 2011). For continuous outcomes, for example, PSG readings, we planned to use mean differences. We planned to use a random‐effects statistical model, which allows for the assumption that included studies may estimate different, but related, intervention effects.
We planned to conduct separate analyses for each comparison type (i.e. propofol versus no agent, propofol versus a different dose of the same agent and propofol versus a different agent).
We planned to calculate 95% CIs and to use a P value of 0.05 or below to judge whether a result was statistically significant.
We planned to consider whether results of analyses were imprecise by assessing the CI around an effect measure; a wide CI would suggest a higher level of imprecision in the results. Inclusion of a small number of studies may also reduce precision (Guyatt 2011b).
Subgroup analysis and investigation of heterogeneity
We planned to assess possible reasons for heterogeneity by performing subgroup analyses. We planned to consider the severity of the condition of participants in each study; participants with a more severe condition may already be subject to increased sleep disruption. Similarly, we planned to consider whether participants had a different outcome according to mechanical ventilation status during the study period. We planned to consider the age of participants; older people (aged over 65 years) have an altered sleep pattern, which includes increased difficulty falling asleep with more awakenings and shorter total sleep time (Ancoli‐Israel 2009); therefore, data on sleep outcomes may be different for members of this age group than for younger people. In summary, planned subgroups were:
-
severity of the health condition based on APACHE II scores (Knaus 1985) (or comparable severity measures): APACHE II scores less than 25, 25 to 35, greater than 35;
-
mechanically ventilated participants versus participants not mechanically ventilated;
-
participants aged 65 years or older versus participants younger than 65 years; and
-
participants in a surgical ICU versus participants in a medical ICU.
Sensitivity analysis
We planned to explore potential effects of decisions made as part of the review process as follows.
-
Exclusion of studies that we judged to be at high or unclear risk of selection bias.
-
Use of the alternate meta‐analytical effects (fixed‐effect or random‐effects) model.
We planned to compare effect estimates from the above results versus effect estimates from the main analysis. We planned to report differences that altered interpretation of effects.
We planned to perform sensitivity analyses on all outcomes.
'Summary of findings' table and GRADE
The GRADE approach incorporates assessment of indirectness, study limitations, inconsistency, publication bias and imprecision. We used assessments made during our analysis to inform the GRADE process (see Data extraction and management, Assessment of risk of bias in included studies, Assessment of heterogeneity, Assessment of reporting biases and Data synthesis). This approach provides an overall measure of how confident we can be that our estimate of effect is correct (Guyatt 2008).
We used the principles of the GRADE system to provide an overall assessment of evidence related to each of the following outcomes.
-
Quantity and quality of sleep as measured through reports of participants or family members or by personnel assessments.
-
Quantity and quality of sleep as measured by PSG, actigraphy, BIS or EEG.
-
Anxiety or depression, or both.
-
Adverse events (such as cardiovascular events, respiratory events or illness resulting from immune deficiency).
Two review authors (SL and AS) independently used GRADEpro software (available at www.guidelinedevelopment.org/) to create a 'Summary of findings' table for each comparison. We planned to reach consensus and resolve disagreements by consulting with a third review author (PA) if required.
Results
Description of studies
Results of the search
We screened 17,003 titles and abstracts from database searches, results from clinical trials register searches, grey literature searches, and forward and backward citation searches. We carried out full‐text review of 17 articles. We excluded 10 studies, and reported details of two of these excluded studies. We identified four eligible studies, and two studies are awaiting classification. We identified one ongoing study. See Figure 1.

Study flow diagram.
Included studies
We included four studies with 149 participants (Engelmann 2014; Kondili 2012; McLeod 1997; Treggiari‐Venzi 1996).
Three of the four studies used a parallel design (Engelmann 2014; McLeod 1997; Treggiari‐Venzi 1996). The fourth study used a cross‐over design (Kondili 2012).
Study population and setting
The four included studies enrolled adults admitted to the ICU.
One study specified inclusion of only participants that were mechanically ventilated (Kondili 2012), one study included only participants that were not mechanically ventilated (Engelmann 2014), and the remaining two studies did not clearly specify whether participants were mechanically ventilated. Three studies used the APACHE II scoring system to classify the severity of participants; Kondili 2012 reported a median (range) APACHE II of 23 (16 to 34), McLeod 1997 reported a median (range) APACHE II in the intervention group of 18 (6 to 35) and in the comparison group of 17 (6 to 37), Treggiari‐Venzi 1996 reported a mean (standard deviation; range) APACHE II in the intervention group of 13.5 (± 4.5; 8 to 20) and in the comparison group of 14.5 (± 4.1; 9 to 21). Engelmann 2014 reported no scoring system to classify the severity of participant conditions. We noted differences in these scores which could reflect severity of participant conditions between studies.
Participant admission diagnoses included trauma, and postsurgical patients (McLeod 1997; Treggiari‐Venzi 1996), and only surgical patients Engelmann 2014). One study did not report admission diagnoses (Kondili 2012). We noted differences in study exclusion criteria; two studies excluded people with renal impairment (Engelmann 2014; McLeod 1997), two studies excluded people with neurological disorders (Kondili 2012; Treggiari‐Venzi 1996), one study excluded people with head trauma (Treggiari‐Venzi 1996), and one study excluded people with sepsis (Kondili 2012).
Two studies reported use of morphine, if required, during the study period (McLeod 1997; Treggiari‐Venzi 1996); we noted that morphine use was balanced between participants in each group. One study reported no opioid use during the study period, with use of non‐steroidal anti‐inflammatory drugs (NSAIDs) if required (Kondili 2012). One study reported prior use of benzodiazepines and propofol as part of general anaesthesia management in surgical patients, and reported no use of antidepressants or neuroleptics (Engelmann 2014); opioid use was not reported in this study.
Interventions
All studies reported administration of propofol in the evening to promote sleep. Times of administration were: 11 pm to 6 am (Engelmann 2014); 10 pm to 7 am Kondili 2012); and 10 pm to 6 am (McLeod 1997; Treggiari‐Venzi 1996).
Study authors reported administration of a starting bolus of 0.01 mg/kg to 0.05 mg/kg over two minutes (Kondili 2012), and 0.2 mg/kg to 0.3 mg/kg over two minutes (Treggiari‐Venzi 1996). Engelmann 2014 provided a specific dose for the infusion (2 mg/kg/hour) and other reports stated that propofol was given at a rate to maintain a given level of sedation (0.3 mg/kg/hour to 3 mg/kg/hour in Treggiari‐Venzi 1996 but dose was not reported in Kondili 2012 or McLeod 1997).
One study used a cross‐over design over two consecutive nights with participants given propofol or no agent on each night (Kondili 2012). Other studies were for a duration of one night (Engelmann 2014), two nights (McLeod 1997), and five nights (Treggiari‐Venzi 1996).
Comparisons
One study compared propofol with no agent (Kondili 2012). One study compared a higher dose of propofol at night (described as "additional night sedation") versus a lower dose given throughout the day and maintained overnight (described as "constant light sedation") (McLeod 1997). Two studies compared propofol versus a benzodiazepine; flunitrazepam (Engelmann 2014), and midazolam (Treggiari‐Venzi 1996).
Measured outcomes
Sleep quality was assessed using standardized patient sleep diaries (Engelmann 2014) and questionnaires (Treggiari‐Venzi 1996). McLeod 1997 reported on quantity and quality of sleep by comparison of Ramsay sedation scores by personnel. Two studies reported on the quantity and quality of sleep as measured using BIS and PSG (Engelmann 2014; Kondili 2012). Treggiari‐Venzi 1996 assessed psychological consequences of sleep deprivation by considering participant anxiety and depression.
Excluded studies
We assessed the full‐texts of 10 studies that did not meet the review criteria. We reported two articles (of the 10 studies) in the review (Seymour 2012; Wu 2016). One study was a cohort study of mechanically ventilated patients in the ICU that studied whether doses of benzodiazepine and propofol were increased at night‐time and the effect of daytime and night‐time use of delirium, coma and duration of mechanical ventilation (Seymour 2012). One study was an RCT of non‐mechanically ventilated elderly (aged 65 years or older) patients in the ICU that studied the effect of dexmedetomidine versus a placebo on sleep architecture (Wu 2016). See Characteristics of excluded studies table.
Studies awaiting classification
Two studies are awaiting classification (Guo 2012; NCT00826553).
We identified one study in database searches which requires translation; we await translation of the full report before assessing eligibility (Guo 2012). We identified one study in searches of clinical trials registers which had been terminated early due to low accrual rates; we await publication of the results of this study before assessing eligibility (NCT00826553).
See Characteristics of studies awaiting classification table.
Ongoing studies
We identified one ongoing study (Hollinger 2017). This study aims to compare propofol with dexmedetomidine administered at night‐time to promote a circadian rhythm. Participants are in the ICU with a diagnosis of delirium, and the study hypothesis is that reinstituting a normal day‐night cycle will decrease the duration of delirium. See Characteristics of ongoing studies table.
Risk of bias in included studies
See Characteristics of included studies table. See 'Risk of bias' graph and 'Risk of bias' summary (Figure 2; Figure 3).

Risk of bias graph: review authors' judgements about each risk of bias item presented as percentages across all included studies.

Risk of bias summary: review authors' judgements about each risk of bias item for each included study. Note: blank spaces indicate outcome measures that are not reported by study authors
Allocation
All studies reported that participants were randomly assigned to groups. No studies provided sufficient details of randomization or methods to conceal allocation from personnel, and we judged all studies to have unclear risk of selection bias.
Blinding
It was not possible to blind personnel in Engelmann 2014 (agents given by a different method), or in Kondili 2012 (no agent as comparator). Blinding of personnel was possible but problematic in Treggiari‐Venzi 1996 and McLeod 1997; the drugs were given by the same method (i.e. intravenous infusion over the same time length), but doses and sedative aims differed between the intervention and comparison group. Attempts to blind personnel would require deliberate manipulation of study methodology which was not reported in either study; we assumed that study investigators made no attempts to blind personnel. We judged all studies to have high risk of performance bias amongst personnel.
Two studies included participant‐reported outcomes (Engelmann 2014; Treggiari‐Venzi 1996), and blinding of participants to the intervention group was particularly relevant. Treggiari‐Venzi 1996 described an "open" study and therefore participants were not blinded to their treatment group. We judged this study to have high risk of performance bias amongst participants. Engelmann 2014 reported that participants were unaware of which agents they were given, and we judged this to have low risk of performance bias amongst participants.
Two studies reported participant‐reported outcomes using subjective measures (Engelmann 2014; Treggiari‐Venzi 1996). Participants in Treggiari‐Venzi 1996 were aware of group allocation and we judged this study to have high risk of detection bias for these subjective measures. Participants in Engelmann 2014 were blinded to the intervention and we judged this study to have low risk of detection bias for the participant‐reported outcome.
Three studies reported measures of sleep using validated measurement tools, which rely on objective measures (Engelmann 2014; Kondili 2012; McLeod 1997). We judged Kondili 2012 to have low risk of detection bias because outcome assessments were not physicians who had administered propofol. We judged McLeod 1997, in which assessors made judgements of participants' diurnal sleep pattern against the Ramsay Sedation Scale, to have low risk of detection bias because study authors reported that all investigators were blinded to group allocation. Study authors provided no detail in Engelmann 2014 and it was not possible to detection bias for objective measures and we judged this to have an unclear risk of bias.
We did not assess performance bias for participants in Kondili 2012 and McLeod 1997 because participant‐reported outcomes were not assessed in these studies and we did not believe that blinding would influence sleep as measured with objective measures. Similarly, we did not assess risk of detection bias for objective measures in Treggiari‐Venzi 1996, as this study did not report such outcomes.
Incomplete outcome data
We noted a large number of losses in Engelmann 2014, and technical difficulties during the study also reduced available data; we judged this study to have high risk of attrition bias. Study authors reported a large number of losses in Treggiari‐Venzi 1996 and included explanations; we were concerned that reasons for losses could be described as 'not missing at random' (i.e. some participants lost due to reactions against midazolam) and lack of data for these participants could have influenced results. We judged Treggiari‐Venzi 1996 to have high risk of attrition bias.
We noted no risk of bias in the loss of one participant in McLeod 1997, and in Kondili 2012; we judged both studies to have low risk of attrition bias.
Selective reporting
We identified prospective clinical trials registration for one study (Kondili 2012); outcomes in the study report reflected outcomes listed in the registration documents and we judged this study to have low risk of reporting bias. We identified no clinical trials registration documents for the remaining studies and it was not feasible to judge risk of reporting bias.
Other potential sources of bias
Two studies reported additional administration of morphine to participants if required (McLeod 1997; Treggiari‐Venzi 1996). Use of morphine between intervention groups was comparable and we believed it introduced no risk of bias. One study reported that additional opioids were administered to no participants (Kondili 2012) and we judged this to have low risk of bias. We noted no details in use of concomitant drugs in Engelmann 2014 and were unable to assess if additional bias had been introduced through concomitant drug use.
We noted no differences in baseline characteristics between groups in parallel design studies (Engelmann 2014; McLeod 1997; Treggiari‐Venzi 1996).
Effects of interventions
See: Summary of findings for the main comparison Propofol for the promotion of sleep in the intensive care unit versus no agent; Summary of findings 2 Propofol for the promotion of sleep in the intensive care unit versus propofol at a different rate or dose; Summary of findings 3 Propofol for the promotion of sleep in the intensive care unit versus another agent specifically administered to promote sleep in the intensive care unit
We noted differences between study designs in methods and types of comparative agents. We did not combine data in meta‐analysis.
Comparison 1: propofol versus no agent
One study compared propofol with no agent (Kondili 2012).
Primary outcomes
1. Quantity and quality of sleep as measured through reports of participants or family members or by personnel assessments
Kondili 2012 did not report this outcome.
2. Quantity and quality of sleep as measured by PSG, actigraphy, BIS or EEG
Kondili 2012 (13 randomized participants) used PSG to assess this outcome. Study authors reported no statistically significant differences in the total sleep time between groups given propofol versus no propofol, or in the percentage of sleep efficiency. Although all participants had an abnormal sleep architecture, study authors reported no statistically significant differences in total sleep time at Stage 1, Stage 2, and slow wave sleep depending on whether propofol had been administered. However, study authors noted that propofol significantly disrupted REM sleep (P = 0.04), with only one participant in the propofol group experiencing REM sleep. Study authors concluded that propofol did not improve sleep quality in the ICU and promoted further disruption by obstructing the usual REM in sleep architecture. See Table 1.
| Outcome: quantity and quality of sleep as measured by PSG, actigraphy, BIS or EEG | ||||
| Study ID | Interventions | Measurement tool | Narrative results as reported by study authors | Data; median (IQR) |
| Cross‐over design over 2 nights. Propofol vs no propofol | PSG | No statistically significant difference in sleep time. | Total sleep time (minutes) Propofol: 260 (113‐417) No propofol: 214 (40‐285) | |
| No statistically significant difference in sleep efficiency (note: study authors do not give a definition of sleep efficiency). | Total sleep time. Sleep efficiency (%) Propofol: 76.3 (28.4‐96.9) No propofol: 62.6 (13.1‐85.9) P = 0.37 | |||
| No statistically significant difference in Stage 1 sleep. | Total sleep time (%) Propofol: 20.8 (5.6‐80.6) No propofol: 30.7 (4.6‐66.7) P = 1.00 | |||
| No statistically significant difference in Stage 2 sleep. | Total sleep time (%) Propofol: 48.9 (4.8‐84.0) No propofol: 46.1 (3.0‐80.4) P = 0.66 | |||
| No statistically significant difference in SWS. | Total sleep time (%) Propofol: 0 (0 – 5.8) No propofol: 0 (0 – 0) P = 0.75 | |||
| Statistically less REM sleep in propofol group. | Total sleep time (%) Propofol: 0 (0‐0) No propofol: 1.4 (0‐13.0) P = 0.04 | |||
BIS: Bispectral Index; EEG: electroencephalogram; HADS: Hospital Anxiety and Depression Scale; IQR: interquartile range; PSG: polysomnography; REM: rapid eye movement; SWS: slow wave sleep.
We used the GRADE approach and assessed the quality of evidence for this outcome to be very low. We noted a high level of performance bias and downgraded by one level. We identified sparse data for this outcome, which reduced the precision of the result and we downgraded an additional two levels. See summary of findings Table for the main comparison.
Secondary outcomes
1. Anxiety or depression, or both, as measured using validated tools
Kondili 2012 did not report data for anxiety or depression.
2. Adverse events (such as cardiovascular events, respiratory events or illness resulting from immune deficiency)
Kondili 2012 did not report data for adverse events.
Subgroup analysis
We did not perform a subgroup analysis because there were too few studies to conduct meta‐analysis.
Sensitivity analysis
We did not perform a sensitivity analysis because there were too few studies to conduct meta‐analysis.
Comparison 2: propofol versus propofol at a different rate or dose
One study compared a higher dose of propofol at night versus a lower dose given throughout the day and maintained overnight (McLeod 1997).
Primary outcomes
1. Quantity and quality of sleep as measured through reports of participants or family members or by personnel assessments
McLeod 1997 (30 randomized participants) reported an assessment of sleep conducted by personnel. Study authors used the Ramsay Sedation Scale to assess the effectiveness of an increased dose of propofol on diurnal rhythm over two nights. All participants were given propofol during daytime hours at a level of two to three on the Ramsay scale (constant light sedation) as standard treatment for their condition. However, the intervention group was given additional propofol in the evening with the aim of achieving a depth of four or five on the Ramsay scale (with a patient sleeping but still rousable) whilst the control group continued to receive constant light sedation. Study authors reported that some sleep rhythms for participants at either end of the spectrum of severity of condition appeared to be unaffected by the different propofol administration aims. However, the study authors reported that they were able to achieve a successful diurnal rhythm in nine of the participants in the intervention group compared to three participants in the control group. Study authors reported that an increased dose of propofol led to greater sedation rhythmicity. We noted that this study did not conclude whether the 'sedation rhythmicity,' which follows a typical night and day structure, was directly equivalent to 'sleep'. See Table 2.
| Outcome: quantity and quality of sleep as measured through reports of participants or family members or by personnel assessments | ||||
| Study ID | Interventions | Measurement tool | Narrative results as reported by study authors | Data |
| Propofol ANS vs propofol CLS | Ramsay Sedation Scale | Greater rhythmicity of sedation in the intervention group. | Median (range) r% ANS: 27 (6‐35) CLS: 8 (0‐56) | |
| Achievement of diurnal rhythm. | ANS: 9/15 CLS: 3/14 | |||
ANS: additional night sedation; CLS: constant light sedation; r%: percentage fit to a normal 24‐hour sleep rhythm (≥ 40% is indicative of normal 24‐hour rhythm); SD: standard deviation.
We used the GRADE approach and assessed the quality of the evidence for this outcome to be very low. We noted a high level of performance bias and downgraded by one level. We were concerned about the use of a sedation scale, typically used to assess anaesthesia, rather than a sleep scale and downgraded by one level for indirectness. We identified sparse data for this outcome which reduced the precision of this result and we downgraded by one level for imprecision. See summary of findings Table 2.
2. Quantity and quality of sleep as measured by PSG, actigraphy, BIS or EEG
McLeod 1997 did not report data for this outcome.
Secondary outcomes
1. Anxiety or depression, or both, as measured using validated tools
McLeod 1997 did not report data for this outcome.
2. Adverse events (such as cardiovascular events, respiratory events or illness resulting from immune deficiency)
McLeod 1997 did not report data for adverse events.
Subgroup analysis
We did not perform a subgroup analysis because there were too few studies to conduct meta‐analysis.
Sensitivity analysis
We did not perform a sensitivity analysis because there were too few studies to conduct meta‐analysis.
Comparison 3: propofol versus another agent, administered specifically to promote sleep
Two studies compared propofol versus a benzodiazepine; flunitrazepam (Engelmann 2014), and midazolam (Treggiari‐Venzi 1996).
Primary outcomes
1. Quantity and quality of sleep as measured through reports of participants or family members or by personnel assessments
Engelmann 2014 (66 randomized participants) assessed sleep quality with an amended version of the Pittsburgh Sleep Diary, asking participants to judge aspects of sleep quality on a numerical scale. Study authors reported fewer awakenings and reduced duration of awakenings in the propofol group. Study authors reported that total sleep duration was similar. We noted that participants were blinded to group allocation in this study; participants assessed an improvement in sleep quality, and an improvement in regeneration and refreshment after sleep when given propofol.
Treggiari‐Venzi 1996 (40 randomized participants) used HADS to assess the quality of sleep experienced by participants. Study authors collected scores on days one, three and five of the study period. Study authors reported an improvement in sleep quality over time which was not significant; they concluded that there was no significant difference in sleep quality. We noted that study authors stated that "the first five items of the HADS evaluate the quality of sleep, the degree of restlessness, dreams or nightmares and memories about the night‐time." The study authors reported no additional details and we were unable to ascertain how 'quality of sleep' could be measured using the standard published HADS, which is typically only a measure of anxiety and depression; therefore, we were concerned about the validity and reliability of the tool that was used for this outcome.
See Table 3.
| Outcome: quantity and quality of sleep as measured through reports of participants or family members or by personnel assessments | ||||
| Study ID | Interventions | Measurement tool | Narrative results as reported by study authors | Data |
| Propofol vs flunitrazepam | Pittsburgh Sleep Diary | Fewer awakenings in the propofol group. | Maximum number of awakenings per participant Propofol: 6 Flunitrazepam: 30 | |
| Shorter duration of awakenings in the propofol group. | Maximum duration of awakenings Propofol: 45 minutes Flunitrazepam: 390 minutes | |||
| Total sleep duration similar between groups. | Total sleep duration Propofol: 6 hours Flunitrazepam: 5 hours P = 0.623 | |||
| Sleep quality significantly better in propofol group. | Median score for sleep quality Propofol: 2.0 Flunitrazepam: 3.0 P < 0.0001 | |||
| Regeneration and refreshment significantly better in propofol group. | Results not reported by authors | |||
| Quality of falling asleep did not differ between groups. | Median score for falling asleep Propofol: 2.0 Flunitrazepam: 2.0 P = 0.341 | |||
| Propofol vs midazolam | HADS | Sleep quality improved during 5‐day study. No significant differences in sleep quality between 2 groups* (*unclear how HADS measured this outcome) | Mean (± SD) HADS Propofol: day 1: 6.5 (± 3.3) day 3: 6.6 (± 2.9) day 5: 7.2 (± 2.3) Midazolam: day 1: 6.3 (± 3.4) day 3: 6.3 (± 3.2) day 5: 7.2 (± 2.9) | |
| Outcome: quantity and quality of sleep as measured by PSG, actigraphy, BIS or EEG | ||||
| Study ID | Interventions | Measurement tool | Narrative results as reported by study authors | Data as median (IQR) |
| Propofol vs flunitrazepam | BIS | Significantly lower median BIS values in propofol group. | Propofol: 74.05 Flunitrazepam: 78.70 P = 0.016 | |
| Flunitrazepam reduced sedative effect over time. | Flunitrazepam at 1st hour: 72.05 Flunitrazepam at 5th hour: 81.00 | |||
| Longer time in deep sleep in propofol group. | Time in deep sleep (hours:minutes:seconds) Propofol: 2:23:30 Flunitrazepam: 1:23:30 | |||
| Longer time in light and REM sleep in flunitrazepam group. | Time in light and REM sleep (hours:minutes:seconds) Propofol: 1:44:00 Flunitrazepam: 2:34:00 | |||
| Outcome: anxiety or depression, or both, as measured using validated tools | ||||
| Study ID | Interventions | Measurement tool | Narrative results as reported by study authors | Data as mean (± SD) HAD score |
| Propofol vs midazolam | HADS | High levels of anxiety in both groups. No significant differences in mean scores between groups. | Propofol: day 1: 6.7 (± 3.9) day 3: 6.8 (± 3.1) day 5: 5.7 (± 4.1) Midazolam: day 1: 6.7 (± 4.7) day 3: 6.5 (± 4.5) day 5: 7.5 (± 5.2) | |
| High levels of depression in both groups. No significant differences in mean scores between groups. | Propofol: day 1: 5.9 (± 4.0) day 3: 6.0 (± 3.0) day 5: 5.5 (± 3.9) Midazolam: day 1: 7.5 (± 5.5) day 3: 6.8 (± 4.8) day 5: 7.2 (± 5.1) | |||
ANS: additional night sedation; BIS: Bispectral Index; CLS: constant light sedation; EEG: electroencephalogram; HADS: Hospital Anxiety and Depression Scale; IQR: interquartile range; min: minute; PSG: polysomnography; REM: rapid eye movement; SD: standard deviation.
We used the GRADE approach and assessed the quality of the evidence for this outcome to be very low. We noted a high level of performance bias in the studies and downgraded by one level. Outcome data were not consistent between studies and we downgraded one level for inconsistency. We were concerned about the validity of the measurement tool in Treggiari‐Venzi 1996 when used as a measure of sleep quality and we downgraded by one level for indirectness. We identified sparse data for this outcome and we downgraded one level for imprecision. See summary of findings Table 3.
2. Quantity and quality of sleep as measured by PSG, actigraphy, BIS or EEG
Engelmann 2014 (66 randomized participants) used BIS monitoring to assess sleep quality and quantity. In this study, the median BIS values differed with significantly lower values reported in those participants given propofol compared to those given flunitrazepam (overall median BIS 74.05 with propofol and median BIS 78.7 with flunitrazepam, P = 0.016). However, the BIS values were also reported over time for the first five hours after the start of the intervention. This demonstrated that the effect of a single bolus dose of flunitrazepam had a reduced sedative effect over time, with BIS values starting at 72.05 in the first hour and increasing at each hour to 81.00 in the fifth hour. Of note, BIS values were significantly lower in the flunitrazepam group in the first hour (P = 0.01) but at all other time points values were significantly lower in the propofol group. Engelmann 2014 looked at fluctuations in BIS values for individual participants. Basing interpretation of BIS values on those given by Sleigh 1999, who linked ranges of BIS values to light sleep, slow wave sleep and REM sleep, Engelmann 2014 reported that participants spent significantly longer time in deep sleep when they were given propofol and participants in the flunitrazepam group had more light and REM sleep. Participants in the flunitrazepam group also had significantly more arousals from sleep (defined as awakenings of less than three minutes). The study authors interpreted this collection of data as demonstrating that propofol improved the overall quality of sleep in the ICU. See Table 3.
We used the GRADE approach and assessed the quality of the evidence for this outcome to be very low. We noted a high level of performance bias and downgraded by one level. We identified sparse data and downgraded by two levels for imprecision. The use of BIS to measure quality and quantity of sleep may not be an appropriate and direct measurement tool for this outcome; we downgraded by one level for indirectness. See summary of findings Table 3.
Secondary outcomes
1. Anxiety or depression, or both, as measured using validated tools
Treggiari‐Venzi 1996 (40 randomized participants) aimed to analyse levels of anxiety and depression in patients in the ICU and used the HADS. This questionnaire requires participants to score 14 statements from zero to three with a maximum score of 21. Study authors reported that participants were asked to score the questionnaire at noon after the first, third and fifth night. Results showed high levels of anxiety in many participants in both groups (scoring greater than 10 on the HADS, which signifies severe levels of anxiety). However, study authors noted that mean scores did not differ significantly between groups on each of the three days of measurement.
Study authors in Treggiari‐Venzi 1996 also reported abnormal levels of depression in both groups (scoring greater than 10). No participant experienced a new onset of depressive state in either group and study authors noted no significant differences between groups on each of the three days of measurement.
These results show that patients in the ICU have abnormally high levels of anxiety and depression. However, study authors provided no evidence that propofol given to promote sleep improved levels of anxiety and depression whilst in the ICU.
See Table 3.
We used the GRADE approach and assessed the quality of evidence for this outcome to be very low. We were concerned about the study limitations, in particular the high risk of performance and detection bias from unblinded participants, which could influence the results. The magnitude and direction of this effect may depend on what participants may know or have been told about propofol and midazolam and, although the study authors reported no difference between results, it was unclear whether this result was influenced by bias. We downgraded this by one level. We identified only one study for this outcome and we downgraded the evidence by two levels for imprecision. See summary of findings Table 3.
2. Adverse events (such as cardiovascular events, respiratory events or illness resulting from immune deficiency)
Engelmann 2014 and Treggiari‐Venzi 1996 did not report adverse events.
Subgroup analysis
We did not perform a subgroup analysis because there were too few studies to conduct meta‐analysis.
Sensitivity analysis
We did not perform a sensitivity analysis because there were too few studies to conduct meta‐analysis.
Discussion
Summary of main results
We identified four RCTs with 149 participants. We identified two studies awaiting classification (one requires translation to English and one is listed as completed in a clinical trial register but not yet published) and one ongoing study.
One study compared propofol versus no agent. Study authors measured quantity and quality of sleep using PSG and reported no evidence of a difference in duration of sleep or sleep efficiency, and reported disruption to usual REM with propofol.
One study compared different doses of propofol. Study authors measured quantity and quality of sleep using the Ramsay Sedation Scale and reported that more participants who were given a higher dose of propofol had a successful diurnal rhythm, and achieved a greater sedation rhythmicity.
Two studies compared propofol versus a benzodiazepine (flunitrazepam, one study; midazolam, one study). Study authors measured quantity and quality of sleep using the Pittsburgh Sleep Diary and HADS. One study reported fewer awakenings of reduced duration with propofol, and similar total sleep time between groups, and one study reported no evidence of a difference in sleep quality. One study comparing propofol with flunitrazepam measured quantity and quality of sleep with BIS and reported longer time in deep sleep, with fewer arousals. One study comparing propofol with midazolam reported higher levels of anxiety and depression in both groups, and no evidence of a difference when participants were given propofol.
Overall completeness and applicability of evidence
Included studies recruited critically ill participants in the ICU and administered propofol in appropriate doses to promote sleep. However, we noted differences between participants such as the severity of participant condition measured with APACHE II, and whether participants were mechanically ventilated. We noted differences in exclusion criteria, for example, one study excluded people with sepsis and one study excluded people with head injury. Also, study designs differed and participants in some studies were not sedated during the day; this would suggest participants were less ill than within studies in which participants were given constant sedation. We believe that this heterogeneity compromises the generalizability and applicability of these results to the general ICU population.
Quality of the evidence
No study authors had provided adequate description of the randomization process and all were at high risk of performance bias. There had been some attempts to reduce detection bias within studies but there were a high number of losses in two of the studies. These biases provided limitations to the review outcomes. We were also concerned about precision in the data, and heterogeneity between studies in terms of design, comparative agents and participant groups. Two studies reported a large number of losses and we judged these to have high attrition bias that could influence their results.
Despite evidence about sleep disturbance in the ICU, we identified only a small number of RCTs with few participants. No studies reported a power calculation and we expected that they were not sufficiently powered to produce a meaningful result; as quantity and quality of sleep may vary widely in the healthy population, we anticipate that a large number of critically ill participants would be required to account for normal variation.
We noted that included studies were conducted over a short time. Length of stay in the ICU differs depending on illness severity; however, it is reasonable to assume that the use of propofol for only one night would be insufficient to reduce the long‐term impact of sleep deprivation such as on levels of anxiety and depression. Study authors measured participant self‐reports of sleep quality and quantity immediately after administration of the intervention. It would be most appropriate to ask a healthy person to reflect on quality of sleep during the following morning; however, critically ill people may have limited communication to discuss perception of quality of sleep. Participant‐reported outcomes for sleep studies in critically‐ill people may benefit from a longer follow‐up period.
Patients in the ICU may be constantly sedated, and propofol is a popular anaesthetic agent for long‐term sedation. We included one study that attempted to use different doses of propofol for daytime and night‐time sedation. This study measured sleep using the Ramsay Sedation Scale, which is designed to measure depth of anaesthesia rather than to assess depth of sleep. Also, we included a study that used BIS monitoring to quantify sleep, which involves equipment designed to measure depth of anaesthesia. We are uncertain whether these are appropriate to measure the review outcomes, and we believed that these measurement tools may also impact on the quality of the evidence.
Potential biases in the review process
We conducted this review using Cochrane methodology, using two authors at each of the review process to minimize bias according to our published protocol (Lewis 2016). We conducted a thorough search that included clinical trials registers, forward and backward citation tracking, and grey literature. Two studies are awaiting classification (Guo 2012; NCT00826553); not incorporating these studies may affect the review findings.
Agreements and disagreements with other studies or reviews
Data on measurement of sleep in the ICU were limited and we are aware of no other reviews on the use of propofol in the ICU. The findings in Engelmann 2014 were comparable to those in the study by Murphy 2011 which reported an increase of slow wave sleep with propofol. However, these findings contradicted Kondili 2012, which reported no increase in slow wave sleep with propofol. Murphy 2011 did not measure REM sleep, and we are unaware of any other studies that measure this.

Study flow diagram.

Risk of bias graph: review authors' judgements about each risk of bias item presented as percentages across all included studies.
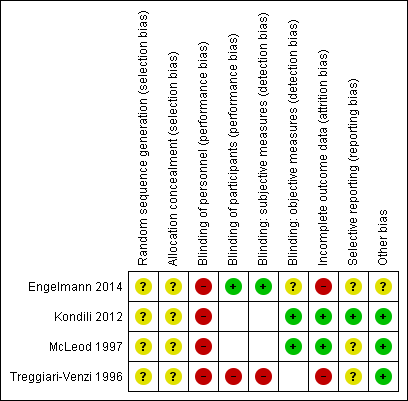
Risk of bias summary: review authors' judgements about each risk of bias item for each included study. Note: blank spaces indicate outcome measures that are not reported by study authors
| Propofol for the promotion of sleep in the intensive care unit versus no agent | ||||
| Patient or population: critically ill adults in the intensive care unit Settings: intensive care unit, Greece Intervention: propofol given to promote overnight sleep Comparison: no agent | ||||
| Outcomes | Impacts | No of Participants | Quality of the evidence | Comments |
| Quantity and quality of sleep as measured through reports of participants or family members or by personnel assessments Data collected at end of study follow‐up | Not reported. | ‐ | ‐ | ‐ |
| Quantity and quality of sleep as measured by PSG, actigraphy, BIS or EEG Data collected at end of study follow‐up | Outcome measured by PSG. Study authors reported no evidence of a difference in duration of sleep or sleep efficiency, and reported disruption to usual REM sleep with propofol. | 13 (1 study) | ⊕⊝⊝⊝ | We identified only 1 study and could not conduct a meta‐analysis. |
| Anxiety or depression, or both, as measured using validated tools Data collected at end of study follow‐up | Not reported. | ‐ | ‐ | ‐ |
| Adverse events (such as cardiovascular events, respiratory events or illness resulting from immune deficiency) | Not reported. | ‐ | ‐ | ‐ |
| BIS: Bispectral Index; EEG: electroencephalogram; PSG: polysomnography; REM: rapid eye movement. | ||||
| GRADE Working Group grades of evidence | ||||
| 1High level of performance bias; downgraded by one level. Data from single study with few participants; downgraded two levels for imprecision. | ||||
| Propofol for the promotion of sleep in the intensive care unit versus propofol at a different rate or dose | ||||
| Patient or population: critically ill adults in the intensive care unit Settings: intensive care unit, UK Intervention: propofol given to promote overnight sleep Comparison: propofol at a different rate or dose | ||||
| Outcomes | Impacts | No of Participants | Quality of the evidence | Comments |
| Quantity and quality of sleep as measured through reports of participants or family members or by personnel assessments Data collected at end of study follow‐up | Outcome measured using Ramsay Sedation Scale. Study authors reported that more participants who were given a higher dose of propofol had a successful diurnal rhythm, and achieved a greater sedation rhythmicity. | 30 (1 study) | ⊕⊝⊝⊝ | We identified only 1 study and could not conduct meta‐analysis. |
| Quantity and quality of sleep as measured by PSG, actigraphy, BIS or EEG Data collected at end of study follow‐up | Not reported. | ‐ | ‐ | ‐ |
| Anxiety or depression, or both, as measured using validated tools Data collected at end of study follow‐up | Not reported. | ‐ | ‐ | ‐ |
| Adverse events (such as cardiovascular events, respiratory events or illness resulting from immune deficiency) | Not reported. | ‐ | ‐ | |
| BIS: Bispectral Index; EEG: electroencephalogram; PSG: polysomnography. | ||||
| GRADE Working Group grades of evidence | ||||
| 1High level of performance bias; downgraded by one level. Concern about use of a sedation scale rather than a sleep scale; downgraded by one level for indirectness. One study, with few participants; downgraded one level for imprecision. | ||||
| Propofol for the promotion of sleep in the intensive care unit versus another agent specifically administered to promote sleep in the intensive care unit | ||||
| Patient or population: critically ill adults in the intensive care unit Settings: intensive care units in Germany and Switzerland Intervention: propofol given to promote overnight sleep Comparison: another agent specifically administered to promote overnight sleep | ||||
| Outcomes | Impacts | No of Participants | Quality of the evidence | Comments |
| Quantity and quality of sleep as measured through reports of participants or family members or by personnel assessments Data collected at end of study follow‐up | Outcome measured by different methods in each study (Pittsburgh Sleep Diary; Hospital Anxiety and Depression Scale). 1 study reported that participants given propofol had fewer awakenings, reduced duration of awakenings and similar total sleep duration. 1 study reported no evidence of a difference in sleep quality. | 106 (2 studies) | ⊕⊝⊝⊝ | We did not conduct a meta‐analysis because studies differed in types of measurement tools. |
| Quantity and quality of sleep as measured by PSG, actigraphy, BIS or EEG Data collected at end of study follow‐up | Outcome measured by BIS. 1 study reported that participants given propofol had longer time in deep sleep, with fewer arousals from sleep. | 66 (1 study) | ⊕⊝⊝⊝ | We identified only 1 study and could not conduct a meta‐analysis. |
| Anxiety or depression, or both, as measured using validated tools Data collected at end of study follow‐up | Study authors reported high levels of anxiety and depression in both participant groups, and no evidence of a difference with those given propofol. | 40 | ⊕⊝⊝⊝ | We identified only 1 study and could not conduct a meta‐analysis. |
| Adverse events (such as cardiovascular events, respiratory events or illness resulting from immune deficiency) | Not reported. | ‐ | ‐ | ‐ |
| BIS: Bispectral Index; EEG: electroencephalogram; PSG: polysomnography. | ||||
| GRADE Working Group grades of evidence | ||||
| 1High level of performance bias in studies; downgraded by one level. Outcome data were not consistent between studies; downgraded one level for inconsistency. Concern about validity of measurement tool in Treggiari‐Venzi 1996; downgraded by one level for indirectness. Limited number of studies, with few participants; downgraded one level for imprecision. 2High level of performance bias; downgraded by one level. Data from single study with few participants; downgraded by two levels for imprecision. Use of BIS to measure quality and quantity may not be appropriate, and may not provide a direct measurement, for this outcome; downgraded by one level for indirectness. 3High level of performance bias in studies; downgraded by one level. Data from single study with few participants; downgraded two levels for imprecision. | ||||
| Outcome: quantity and quality of sleep as measured by PSG, actigraphy, BIS or EEG | ||||
| Study ID | Interventions | Measurement tool | Narrative results as reported by study authors | Data; median (IQR) |
| Cross‐over design over 2 nights. Propofol vs no propofol | PSG | No statistically significant difference in sleep time. | Total sleep time (minutes) Propofol: 260 (113‐417) No propofol: 214 (40‐285) | |
| No statistically significant difference in sleep efficiency (note: study authors do not give a definition of sleep efficiency). | Total sleep time. Sleep efficiency (%) Propofol: 76.3 (28.4‐96.9) No propofol: 62.6 (13.1‐85.9) P = 0.37 | |||
| No statistically significant difference in Stage 1 sleep. | Total sleep time (%) Propofol: 20.8 (5.6‐80.6) No propofol: 30.7 (4.6‐66.7) P = 1.00 | |||
| No statistically significant difference in Stage 2 sleep. | Total sleep time (%) Propofol: 48.9 (4.8‐84.0) No propofol: 46.1 (3.0‐80.4) P = 0.66 | |||
| No statistically significant difference in SWS. | Total sleep time (%) Propofol: 0 (0 – 5.8) No propofol: 0 (0 – 0) P = 0.75 | |||
| Statistically less REM sleep in propofol group. | Total sleep time (%) Propofol: 0 (0‐0) No propofol: 1.4 (0‐13.0) P = 0.04 | |||
| BIS: Bispectral Index; EEG: electroencephalogram; HADS: Hospital Anxiety and Depression Scale; IQR: interquartile range; PSG: polysomnography; REM: rapid eye movement; SWS: slow wave sleep. | ||||
| Outcome: quantity and quality of sleep as measured through reports of participants or family members or by personnel assessments | ||||
| Study ID | Interventions | Measurement tool | Narrative results as reported by study authors | Data |
| Propofol ANS vs propofol CLS | Ramsay Sedation Scale | Greater rhythmicity of sedation in the intervention group. | Median (range) r% ANS: 27 (6‐35) CLS: 8 (0‐56) | |
| Achievement of diurnal rhythm. | ANS: 9/15 CLS: 3/14 | |||
| ANS: additional night sedation; CLS: constant light sedation; r%: percentage fit to a normal 24‐hour sleep rhythm (≥ 40% is indicative of normal 24‐hour rhythm); SD: standard deviation. | ||||
| Outcome: quantity and quality of sleep as measured through reports of participants or family members or by personnel assessments | ||||
| Study ID | Interventions | Measurement tool | Narrative results as reported by study authors | Data |
| Propofol vs flunitrazepam | Pittsburgh Sleep Diary | Fewer awakenings in the propofol group. | Maximum number of awakenings per participant Propofol: 6 Flunitrazepam: 30 | |
| Shorter duration of awakenings in the propofol group. | Maximum duration of awakenings Propofol: 45 minutes Flunitrazepam: 390 minutes | |||
| Total sleep duration similar between groups. | Total sleep duration Propofol: 6 hours Flunitrazepam: 5 hours P = 0.623 | |||
| Sleep quality significantly better in propofol group. | Median score for sleep quality Propofol: 2.0 Flunitrazepam: 3.0 P < 0.0001 | |||
| Regeneration and refreshment significantly better in propofol group. | Results not reported by authors | |||
| Quality of falling asleep did not differ between groups. | Median score for falling asleep Propofol: 2.0 Flunitrazepam: 2.0 P = 0.341 | |||
| Propofol vs midazolam | HADS | Sleep quality improved during 5‐day study. No significant differences in sleep quality between 2 groups* (*unclear how HADS measured this outcome) | Mean (± SD) HADS Propofol: day 1: 6.5 (± 3.3) day 3: 6.6 (± 2.9) day 5: 7.2 (± 2.3) Midazolam: day 1: 6.3 (± 3.4) day 3: 6.3 (± 3.2) day 5: 7.2 (± 2.9) | |
| Outcome: quantity and quality of sleep as measured by PSG, actigraphy, BIS or EEG | ||||
| Study ID | Interventions | Measurement tool | Narrative results as reported by study authors | Data as median (IQR) |
| Propofol vs flunitrazepam | BIS | Significantly lower median BIS values in propofol group. | Propofol: 74.05 Flunitrazepam: 78.70 P = 0.016 | |
| Flunitrazepam reduced sedative effect over time. | Flunitrazepam at 1st hour: 72.05 Flunitrazepam at 5th hour: 81.00 | |||
| Longer time in deep sleep in propofol group. | Time in deep sleep (hours:minutes:seconds) Propofol: 2:23:30 Flunitrazepam: 1:23:30 | |||
| Longer time in light and REM sleep in flunitrazepam group. | Time in light and REM sleep (hours:minutes:seconds) Propofol: 1:44:00 Flunitrazepam: 2:34:00 | |||
| Outcome: anxiety or depression, or both, as measured using validated tools | ||||
| Study ID | Interventions | Measurement tool | Narrative results as reported by study authors | Data as mean (± SD) HAD score |
| Propofol vs midazolam | HADS | High levels of anxiety in both groups. No significant differences in mean scores between groups. | Propofol: day 1: 6.7 (± 3.9) day 3: 6.8 (± 3.1) day 5: 5.7 (± 4.1) Midazolam: day 1: 6.7 (± 4.7) day 3: 6.5 (± 4.5) day 5: 7.5 (± 5.2) | |
| High levels of depression in both groups. No significant differences in mean scores between groups. | Propofol: day 1: 5.9 (± 4.0) day 3: 6.0 (± 3.0) day 5: 5.5 (± 3.9) Midazolam: day 1: 7.5 (± 5.5) day 3: 6.8 (± 4.8) day 5: 7.2 (± 5.1) | |||
| ANS: additional night sedation; BIS: Bispectral Index; CLS: constant light sedation; EEG: electroencephalogram; HADS: Hospital Anxiety and Depression Scale; IQR: interquartile range; min: minute; PSG: polysomnography; REM: rapid eye movement; SD: standard deviation. | ||||