Intervenciones farmacológicas para el tratamiento de la obesidad en niños y adolescentes
Información
- DOI:
- https://doi.org/10.1002/14651858.CD012436Copiar DOI

- Base de datos:
-
- Cochrane Database of Systematic Reviews
- Versión publicada:
-
- 29 noviembre 2016see what's new
- Tipo:
-
- Intervention
- Etapa:
-
- Review
- Grupo Editorial Cochrane:
-
Grupo Cochrane de Trastornos metabólicos y endocrinos
- Copyright:
-
- Copyright © 2020 The Cochrane Collaboration. Published by John Wiley & Sons, Ltd.
Cifras del artículo
Altmetric:
Citado por:
Autores
Contributions of authors
EM: search strategy development, acquiring trial reports, trial selection, data extraction, data analysis, data interpretation, review draft and future review updates.
GA: data extraction, data analysis, data interpretation, review draft and future review updates.
BR: data analysis, data interpretation and review draft.
MIM: search strategy development and review draft.
LB: data extraction, data interpretation, review draft and future review updates.
NF: data extraction, data interpretation, review draft and future review updates.
EC: data extraction, data interpretation, review draft and future review updates.
CO: acquiring trial reports, trial selection, data extraction, data interpretation, review draft and future review updates.
LE: search strategy development, acquiring trial reports, trial selection, data extraction, data analysis, data interpretation, review draft and future review updates.
Sources of support
Internal sources
-
University Medical Center, Groningen, Netherlands.
-
The Children's Hospital at Westmead, Sydney, Australia.
-
Centre for Food Physical Activity and Obesity Research, University of Teesside, UK.
-
The Wolfson Research Institute, University of Durham, UK.
-
Australian National Health & Medical Research Council, Australia.
Postgraduate Research Scholarship for Ms Shrewsbury
External sources
-
No sources of support supplied
Declarations of interest
EM: none known.
GA: none known.
BR: none known.
MIM: none known.
LB: none known.
NF: has provided medical consultancy to several pharmaceutical companies developing and marketing (outside of the UK at present) treatments for obesity. Since March 2016 he is employed by Novo Nordisk, Denmark in Global Medical Affairs. The review was submitted for publication in November 2015, pre‐dating an offer of employment by Novo Nordisk A/S made in December 2015. NF made no further contributions to the review after this date. NF’s employment by NovoNordisk during review production violated Cochrane’s Commercial Sponsorship Policy, the review group assured NF did not contribute to the review after this employment started, and the Funding Arbiters reviewed and approved an exception for this case.
EC: none known.
CO: none known.
LE: none known.
Acknowledgements
We would like to thank Liane Azevedo (Teesside University), Leanne Mohan (Teesside University), Sarah Smith (Durham University), Katherine Roberts (Public Health England) and Giulia Mainardi (University of Sao Paulo) for their assistance with the data extractions. Also, we would like to thank all of the study authors who provided additional information about their trials, and we also acknowledge the editorial contributions by Gudrun Paletta (Cochrane Metabolic and Endocrine Disorders Group).
Version history
| Published | Title | Stage | Authors | Version |
| 2016 Nov 29 | Drug interventions for the treatment of obesity in children and adolescents | Review | Emma Axon, Greg Atkinson, Bernd Richter, Maria‐Inti Metzendorf, Louise Baur, Nicholas Finer, Eva Corpeleijn, Claire O'Malley, Louisa J Ells | |
Differences between protocol and review
Given the rapid growth in the treatment of child and adolescent obesity, the original review has now been split into six separate reviews, with a specific intervention and age focus. Whilst the other reviews in this series utilised an updated version of the original search strategy, we developed a new search strategy (see Appendix 1) to reflect advances in pharmacological therapies that may not have been adequately captured in the original search strategy. We decided to exclude trials which included growth hormone therapies to avoid including trials which treated conditions such as Cushing's syndrome. In addition, some subgroup analyses were not possible due to a limited number of trials.
We included only randomised controlled trials that were specifically designed to treat obesity in children and observed participants for a minimum of six months. The rationale for introducing this criterion arose from the belief that many interventions appear to be effective in the short term (up to three months), but not in the long term (Glenny 1997). It seemed to be more important to evaluate the longer‐term effects of treatments, as this would provide a more valuable indication of effectiveness, given the chronic nature of obesity.
Notes
Portions of the methods sections, the appendices, additional tables and figures 1 to 3 of this review are based on a standard template established by the Cochrane Metabolic and Endocrine Disorders Group.
Keywords
MeSH
Medical Subject Headings (MeSH) Keywords
Medical Subject Headings Check Words
Adolescent; Child; Humans;
PICO

Trial flow diagram.

Risk of bias graph: review authors' judgements about each risk of bias item presented as percentages across all included trials.

Risk of bias summary: review authors' judgements about each risk of bias item for each included trial.

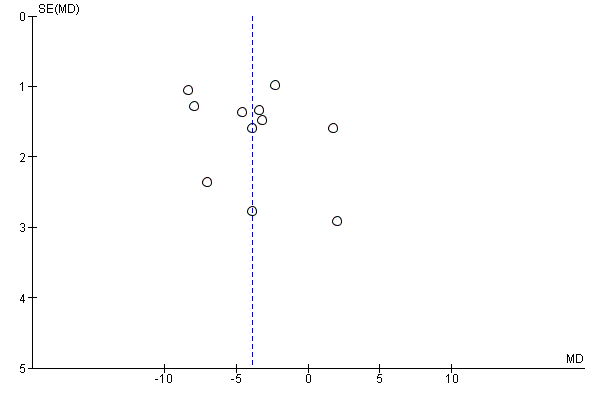
Funnel plot of comparison: 1 Body mass index (BMI): pharmacological interventions versus comparators, outcome: 1.1 Change in BMI (all trials) (kg/m2).
Funnel plot of comparison: 2 Weight: pharmacological interventions versus comparators, outcome: 2.1 Change in weight (all trials) (kg).

Comparison 1 Body mass index (BMI): pharmacological interventions versus comparators, Outcome 1 Change in BMI (all trials).

Comparison 1 Body mass index (BMI): pharmacological interventions versus comparators, Outcome 2 Change in BMI (drug type).

Comparison 1 Body mass index (BMI): pharmacological interventions versus comparators, Outcome 3 Change in BMI (dropout rate).

Comparison 1 Body mass index (BMI): pharmacological interventions versus comparators, Outcome 4 Change in BMI (intention‐to‐treat (ITT) analysis).

Comparison 1 Body mass index (BMI): pharmacological interventions versus comparators, Outcome 5 Change in BMI (funding).

Comparison 1 Body mass index (BMI): pharmacological interventions versus comparators, Outcome 6 Change in BMI (publication date).
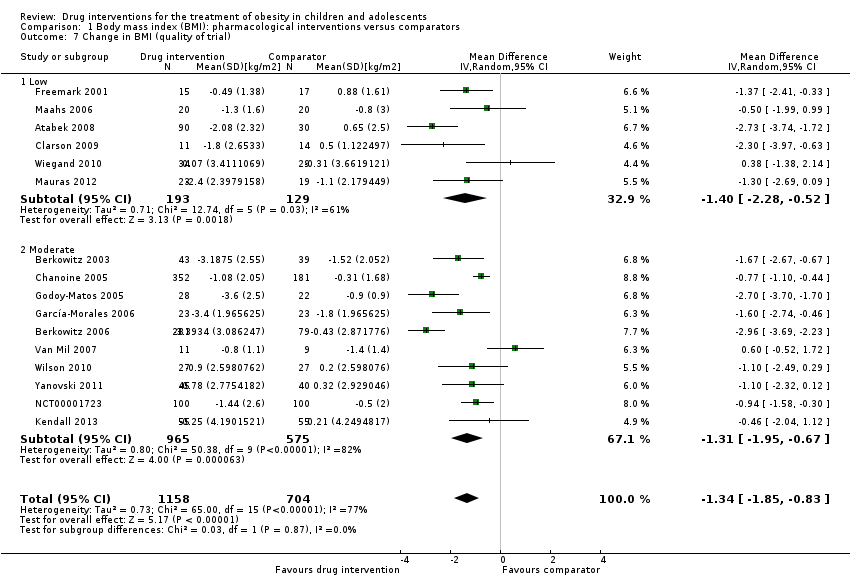
Comparison 1 Body mass index (BMI): pharmacological interventions versus comparators, Outcome 7 Change in BMI (quality of trial).
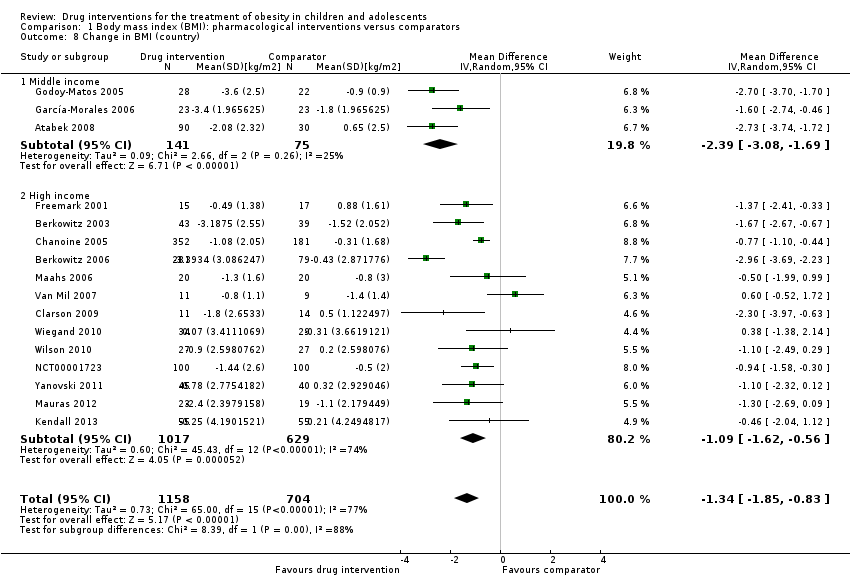
Comparison 1 Body mass index (BMI): pharmacological interventions versus comparators, Outcome 8 Change in BMI (country).

Comparison 1 Body mass index (BMI): pharmacological interventions versus comparators, Outcome 9 Change in BMI (mean age).
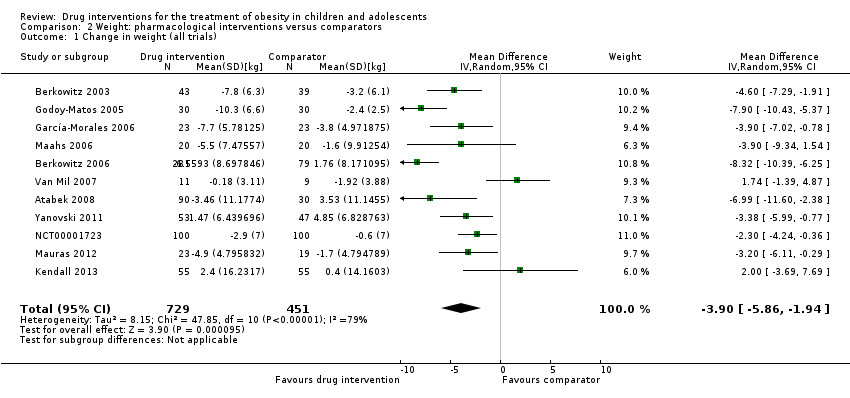
Comparison 2 Weight: pharmacological interventions versus comparators, Outcome 1 Change in weight (all trials).
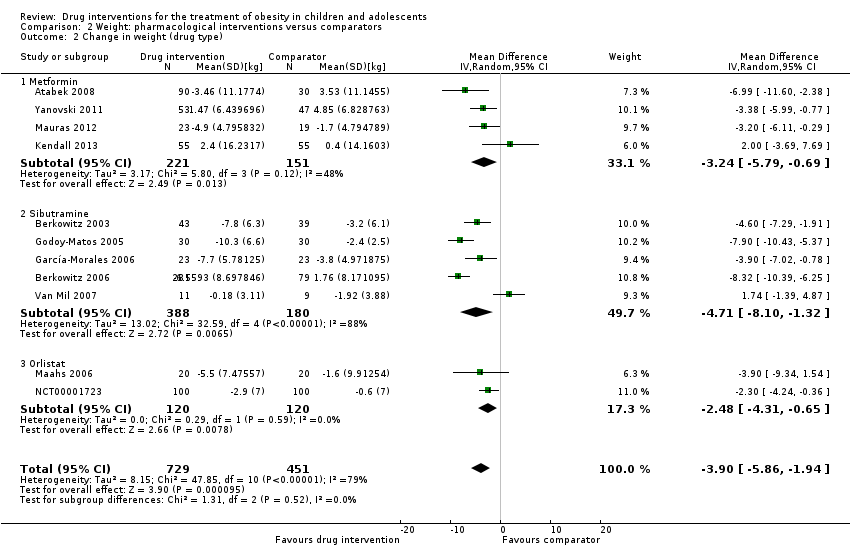
Comparison 2 Weight: pharmacological interventions versus comparators, Outcome 2 Change in weight (drug type).

Comparison 3 Adverse effects: pharmacological interventions versus comparator, Outcome 1 Serious adverse events.
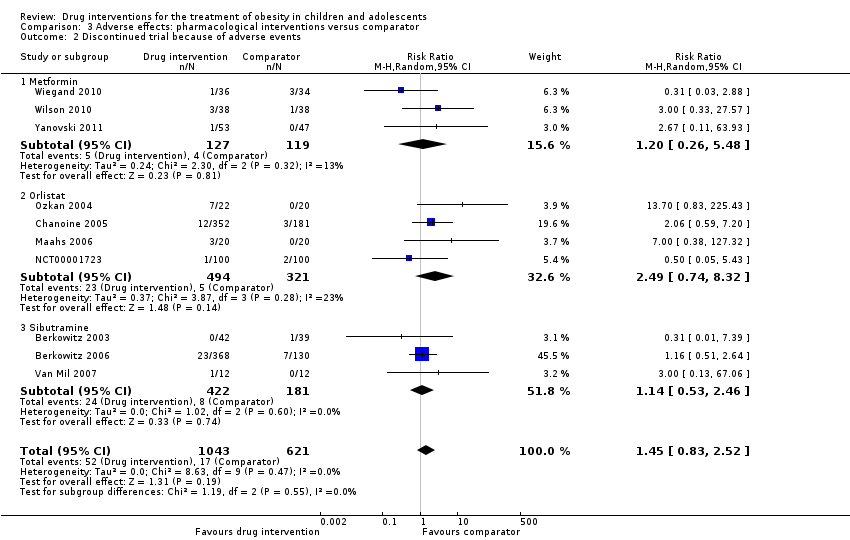
Comparison 3 Adverse effects: pharmacological interventions versus comparator, Outcome 2 Discontinued trial because of adverse events.
| Drug interventions for the treatment of obesity in children and adolescents | ||||||
| Population: obese children and adolescents Settings: mainly outpatient settings Intervention: metformin, orlistat, sibutramine usually combined with behaviour changing interventions Comparison: placebo or no placebo usually with behaviour changing interventions | ||||||
| Outcomes | Illustrative comparative risks* (95% CI) | Relative effect | No of participants | Quality of the evidence | Comments | |
| Assumed risk | Corresponding risk | |||||
| Comparator | Pharmacological intervention | |||||
| a. BMI (kg/m2) b. Body weight (kg) Follow‐up: 6 months (10 trials) ‐ 12 months (1 trial) | a. The mean reduction in BMI ranged across control groups from ‐1.8 to +0.9 b. The mean reduction in weight ranged across control groups from ‐3.8 kg to +4.9 kg | a. The mean reduction in BMI in the intervention groups was ‐1.3 higher (‐1.9 to ‐0.8 higher) b. The mean reduction in weight in the intervention groups was ‐3.9 kg higher (‐5.9 kg to ‐1.9 kg higher) | ‐ | a. 1884 (16) b. 1180 (11) | a. ⊕⊕⊝⊝ b. ⊕⊕⊝⊝ | ‐ |
| Adverse events a. Serious adverse events b. Discontinuation of trial because of adverse events Follow‐up: mostly 6 months, maximum 100 weeks (1 trial) | a. 17 per 1000 b. 27 per 1000 | a. 24 per 1000 (11 to 55) b. 40 per 1000 (23 to 69) | a.RR 1.43 (0.63 to 3.25) b.RR 1.45 (0.83 to 2.52) | a. 1347 (5) b. 1664 (10) | a. ⊕⊕⊕⊝ L owb b. ⊕⊕⊕⊝ Lowb | All trials reported if adverse events occurred; however, only 7/20 trials reported the number of participants who experienced at least 1 adverse event |
| Health‐related quality of life 3 questionnaires (1 trial) and SF‐36 (1 trial) Follow‐up: 6 months | See comment | See comment | See comment | 86 (2) | ⊕⊝⊝⊝ V ery lowc | Results were only reported for SF‐36 (1 trial on sibutramine, 46 children), there were no marked differences between intervention and comparator groups |
| All‐cause mortality Follow‐up: mostly 6 months, maximum 100 weeks (1 trial) | See comment | See comment | See comment | 2176 (20) | ⊕⊕⊕⊝ L owd | 1 suicide in the orlistat intervention group |
| Morbidity | See comment | See comment | See comment | 533 (1) | ⊕⊝⊝⊝ V ery lowe | Only 1 trial investigated morbidity defined as illness or harm associated with the intervention (Chanoine 2005). In the orlistat group 6/352 (1.7%) participants developed new gallstones compared with 1/181 (0.6%) in the placebo group |
| Socioeconomic effects | See comment | See comment | See comment | See comment | See comment | Not reported |
| *The basis for the assumed risk (e.g. the median control group risk across trials) is provided in footnotes. The corresponding risk (and its 95% confidence interval) is based on the assumed risk in the comparison group and the relative effect of the intervention (and its 95% CI). | ||||||
| GRADE Working Group grades of evidence | ||||||
| *Assumed risk was derived from the event rates in the comparator groups. aDowngraded by two levels because of potential other risk of bias, inconsistency and imprecision (see Appendix 13). | ||||||
| Trial | Intervention(s) and comparator(s) | Description of power and sample size calculation | Screened/eligible | Randomised | Safety | ITT | Finishing trial | Randomised finishing trial | Follow‐up timea |
| Atabek 2008b | I: metformin + diet and physical activity advice | ‐ | ‐ | 90 | 90 | ‐ | 90 | 100 | 6 months |
| C: placebo + diet and physical activity advice | 30 | 30 | ‐ | 30 | 100 | ||||
| total: | 120 | 120 | ‐ | 120 | 100 | ||||
| Berkowitz 2003 | I: behavioural programme + sibutramine | Powered to detect a 4% difference in % change in BMI between the 2 treatment groups with an SD of 5% (α = 0.05, β = 93%)c | 146 | 43 | 43 | 43 | 40 | 93.0 | 6 months (not including the 6‐month open‐label period where all participants received sibutramine) |
| C: behavioural programme + placebo | 39 | 39 | 39 | 34 | 87.2 | ||||
| total: | 82 | 82 | 82 | 62 | 75.6 | ||||
| Berkowitz 2006 | I: behavioural programme + sibutramine | "Planned sample size was approximately 400 participants with a 3:1 randomization ratio of sibutramine to placebo. On the basis of previous 12‐month adult trials, we determined that 300 participants in the sibutramine group would be adequate to assess safety and exposure, allowing an overall dropout rate of approximately 50% and a probability that approximately 50% of participants receiving 10 mg of sibutramine would lose 10% or more of initial BMI at 6 months" "Although the protocol did not document a formal sample size calculation for efficacy, approximately 132 adolescents (99 in the sibutramine group and 33 in the placebo group) would allow a between‐group difference in BMI of 2 kg/m2, with 90% power (2‐sided level of 0.05) to be statistically significant, assuming a common SD of 3 kg/m2)"d | ‐ | 368 | 368 | ‐ | 281 | 76.4 | 12 months |
| C: behavioural programme + placebo | 130 | 130 | ‐ | 80 | 61.5 | ||||
| total: | 498 | 498 | ‐ | 361 | 72.5 | ||||
| Chanoine 2005 | I: orlistat + diet + exercise + behaviour therapy | "We planned to enroll at least 450 individuals to provide more than 80% power to detect a difference of 1 BMI unit, assuming a 30% dropout rate" | 588 | 357 | 352 | 348 | 232 | 65.0 | 54 weeks |
| C: placebo + diet + exercise + behaviour therapy | 182 | 181 | 180 | 117 | 64.3 | ||||
| total: | 539 | 533 | 528 | 349 | 64.7 | ||||
| Clarson 2009 | I: metformin + lifestyle intervention | ‐ | 65 | 14 | ‐ | ‐ | 11 | 78.6 | 6 months |
| C: lifestyle intervention only | 17 | ‐ | ‐ | 14 | 82.4 | ||||
| total: | 31 | ‐ | ‐ | 25 | 80.6 | ||||
| Franco 2014 (cross‐over trial) | I: sibutramine + dietary guidance | ‐ | 73 | ‐ | ‐ | ‐ | ‐ | ‐ | 13 months |
| C: placebo + dietary guidance | ‐ | ‐ | ‐ | ‐ | ‐ | ||||
| total: | 63 | 63 | ‐ | 23 | 36.5 | ||||
| Freemark 2001 | I: metformin | ‐ | ‐ | 15 | ‐ | ‐ | 14 | 93.3 | 6 months |
| C: placebo | 17 | ‐ | ‐ | 15 | 88.2 | ||||
| total: | 32 | ‐ | ‐ | 29 | 90.6 | ||||
| Garcia‐Morales 2006 | I: sibutramine + diet + exercise | 13 participants per group (expectations: mean loss of 7.5 kg (SD 5.3) in the sibutramine group vs 3.6 kg (SD 4.5) in the placebo group)e | 70 | 26 | 26 | 23 | 21 | 80.8 | 6 months |
| C: placebo + diet + exercise | 25 | 25 | 23 | 19 | 76.0 | ||||
| total: | 51 | 51 | 46 | 40 | 78.4 | ||||
| Godoy‐Matos 2005 | I: sibutramine + hypocaloric diet + exercise | ‐ | ‐ | 30 | 30 | 30 | 28 | 93.3 | 24 weeks |
| C: placebo + hypocaloric diet + exercise | 30 | 30 | 30 | 22 | 73.3 | ||||
| total: | 60 | 60 | 60 | 50 | 83.3 | ||||
| Kendall 2013 | I: metformin + healthy lifestyle advice | "The target recruitment was 140 patients, based on a power calculation using the results of a previous study. A standard power calculation was used to detect a reduction in BMI of 0.15 kg/m2 (SD 0.3). Sixty‐four participants in each group give a statistical power of 80% for a t test at the 5% significance level. This was rounded up to allow for some loss to follow‐up but recognizing that adjustment using multifactorial analysis would likely enhance the trial power by an unpredictable amount"f | 234 | ‐ | 74 | 74 | 55 | ‐ | 6 months |
| C: placebo + healthy lifestyle advice | ‐ | 77 | 77 | 55 | ‐ | ||||
| total: | 155 | 151 | 151 | 110 | 71.0 | ||||
| Maahs 2006 | I: orlistat + diet and exercise therapy | "We determined that a clinically important mean difference in decrease in BMI between the orlistat and placebo groups would be 2.0 kg/m2 at 6 months and used an SD of 1.8. On the basis of this approach, a sample size of 15 subjects per group would be adequate to detect a 2.0 kg/m2 difference in Student’s t test with 80% power and alpha = 0.05. In order to allow for a 25% dropout rate, 20 subjects were randomized to each group"g | 43 | 20 | ‐ | 20 | 18 | 90.0 | 6 months |
| C: placebo + diet and exercise therapy | 20 | ‐ | 20 | 16 | 80.0 | ||||
| total: | 40 | ‐ | 40 | 34 | 85.0 | ||||
| Mauras 2012 | I: metformin + diet/exercise intervention | "Differences in hsCRP and fibrinogen concentrations at 6 months were the primary outcomes. An n = 42 completed subjects provided > 90 % power to detect significant changes" | ‐ | 35 | 35 | ‐ | 23 | 65.7 | 6 months |
| C: diet/exercise intervention | 31 | 31 | ‐ | 19 | 61.3 | ||||
| total: | 66 | 66 | ‐ | 42 | 63.6 | ||||
| NCT00001723 | I: orlistat + behavioural weight loss programme | ‐ | ‐ | 100 | 100 | 100 | 87 | 87.0 | 6 months |
| C: placebo + behavioural weight loss programme | 100 | 100 | 100 | 84 | 84.0 | ||||
| 200 | 100 | 100 | 171 | 85.5 | |||||
| Ozkan 2004 | I: conventional treatment (nutritional and lifestyle modification programmes) + orlistat | ‐ | ‐ | 22 | ‐ | ‐ | 15 | 68.2 | 5 to 15 months |
| C: conventional treatment: nutritional and lifestyle modification programmes | 20 | ‐ | ‐ | 15 | 75.0 | ||||
| total: | 42 | ‐ | ‐ | 30 | 71.4 | ||||
| Prado 2012 | I: metformin + nutritional guide and exercise programme | 8 participants were required per intervention group (SD 0.4; difference of 0.6, P < 0.05, power = 90%) | 41/26 | ‐ | 9 | ‐ | 7 | ‐ | 6 months |
| C: placebo + nutritional guide and exercise programme | ‐ | 10 | ‐ | 6 | ‐ | ||||
| total: | 26 | 19 | ‐ | 13 | 50 | ||||
| Rezvanian 2010 | I1: metformin + diet and physical activity advice | "By considering alpha = 0.05 and a power level of 0.8, the sample size was calculated as 160, and by considering the attrition during the follow‐up, we increased it to 180" | 180 | 45 | ‐ | ‐ | 41 | 91.1 | 24 weeks |
| I2: fluoxetine + diet and physical activity advice | 45 | ‐ | ‐ | 40 | 88.9 | ||||
| I3: metformin and fluoxetine + diet and physical activity advice | 45 | ‐ | ‐ | 41 | 91.1 | ||||
| C: placebo + diet and physical activity advice | 45 | ‐ | ‐ | 42 | 93.3 | ||||
| total: | 180 | ‐ | ‐ | 164 | 91.1 | ||||
| Srinivasan 2006 (cross‐over trial) | I: metformin + "standardised information on healthy eating and exercise" | ‐ | 34 | ‐ | ‐ | ‐ | ‐ | ‐ | 12 months |
| C: placebo + "standardised information on healthy eating and exercise" | ‐ | ‐ | ‐ | ‐ | ‐ | ||||
| total: | 28 | ‐ | ‐ | 22 | 78.6 | ||||
| Van Mil 2007 | I: sibutramine + energy‐restricted diet and exercise plan | "The number of patients required per treatment group to detect a difference between treatment groups in mean change in BMI at endpoint intervention of 1.0 kg/m2, based on an estimate of variance (sd) of 0.65, an overall significance level of 5%, and a power of 90%, was nine. Allowing a drop‐out rate of 25%, the number of patients needed in each group was 12"h | ‐ | 12 | 12 | 12 | 11 | 91.7 | 24 weeks |
| C: placebo + energy‐restricted diet and exercise plan | 12 | 12 | 12 | 9 | 75.0 | ||||
| total: | 24 | 24 | 24 | 20 | 83.3 | ||||
| Wiegand 2010 | I: metformin + lifestyle intervention | "Since a clinically significant effect was defined as a decrease in HOMA‐IR by ‐1, two groups of 37 patients had to be included in the study to achieve a power of 0.9 with a α value of 0.05" | 278 | 36 | ‐ | ‐ | 34 | 94.4 | 6 months |
| C: placebo + lifestyle intervention | 34 | ‐ | ‐ | 29 | 85.3 | ||||
| total: | 70 | ‐ | ‐ | 63 | 90 | ||||
| Wilson 2010 | I: metformin + lifestyle intervention | "Assuming an SD of 1.9 for BMI change, an enrolled sample of 72 provided 80% power to detect a differential of 1.46 between treatment arms or between sexes and 1.75 between white subjects and others"i | 92 | 39 | 39 | 39 | 19 | 48.7 | 100 weeks |
| C: placebo + lifestyle intervention | 38 | 38 | 38 | 19 | 50.0 | ||||
| total: | 77 | 76 | 76 | 38 | 49.4 | ||||
| Yanovski 2011 | I: metformin + dietitian‐administered weight‐reduction programme | "A total sample size of 60 participants would detect a between‐group difference of 0.09 BMI SD score units (approximately equivalent to a 2 kg/m2 difference) with 80% power. Participant accrual was set at 100 participants to allow as much as 40% loss to follow‐up"j | 278 | 53 | ‐ | 53 | 45 | 84.9 | 6 months (not including the 6‐month open‐label phase) |
| C: placebo + dietitian‐administered weight‐reduction programme | 47 | ‐ | 47 | 40 | 85.1 | ||||
| total: | 100 | ‐ | 100 | 85 | 85.0 | ||||
| Grand total | All interventionsk | 1395 | 1153 | ||||||
| All comparatorsk | 817 | 665 | |||||||
| All interventions and comparatorsk | 2484 | 1851 | |||||||
| aDuration of intervention and follow‐up under randomised conditions until end of trial. "‐" denotes not reported. BMI: body mass index; C: comparator; hsCRP: high sensitivity C‐reactive protein; HOMA‐IR: homeostasis model assessment for insulin resistance index; I: intervention; ITT: intention‐to‐treat; n: number of participants; SD: standard deviation. | |||||||||
| Trials with data on mean change only | |
| Number of trials | 14 |
| Point estimate (95% CI) (kg/m2) | ‐ 1.5 (‐2.0 to ‐0.9) favouring drug intervention |
| Trials with concealment of allocation | |
| Number of trials | 12 |
| Point estimate (95% CI) (kg/m2) | ‐1.3 (‐1.8 to ‐0.7) favouring drug interventions |
| Trials with blinding of participants/personnel | |
| Number of trials | 10 |
| Point estimate (95% CI) (kg/m2) | ‐1.3 (‐1.9 to ‐0.7) favouring drug interventions |
| Trials with blinding of outcome assessors | |
| Number of trials | 10 |
| Point estimate (95% CI) (kg/m2) | ‐1.3 (‐1.9 to ‐0.7) favouring drug interventions |
| Trials without large sample size trials | |
| Number of trials | 14 |
| Point estimate (95% CI) (kg/m2) | ‐1.3 (‐1.8 to ‐0.7) favouring drug interventions |
| Trials with trials with 6 months' follow‐up only | |
| Number of trials | 14 |
| Point estimate (95% CI) (kg/m2) | ‐1.2 (‐1.7 to ‐0.7) favouring drug interventions |
| Trials without trials with higher drug dose | |
| Number of trials | 14 |
| Point estimate (95% CI) (kg/m2) | ‐1.2 (‐1.7 to ‐0.7) favouring drug interventions |
| Trials with trials with a high dose/active lifestyle intervention | |
| Number of trials | 10 |
| Point estimate (95% CI) (kg/m2) | ‐1.3 (‐1.9 to ‐0.7) favouring drug interventions |
| Trials without trials with high attrition | |
| Number of trials | 13 |
| Point estimate (95% CI) (kg/m2) | ‐1.4 (‐2.0 to ‐0.8) favouring drug interventions |
| BMI: body mass index; CI: confidence interval. | |
| Trials with data on mean change only | |
| Number of trials | 8 |
| Point estimate (95% CI) (kg) | ‐ 4.1 (‐6.3 to ‐1.8) favouring drug intervention |
| Trials with concealment of allocation | |
| Number of trials | 9 |
| Point estimate (95% CI) (kg) | ‐3.5 (‐5.8 to ‐1.2) favouring drug interventions |
| Trials with blinding of participants/personnel | |
| Number of trials | 7 |
| Point estimate (95% CI) (kg) | ‐4.2 (‐6.8 to ‐1.5) favouring drug interventions |
| Trials with blinding of outcome assessors | |
| Number of trials | 7 |
| Point estimate (95% CI) (kg) | ‐4.2 (‐6.8 to ‐1.5) favouring drug interventions |
| Trials without large sample size trials | |
| Number of trials | 10 |
| Point estimate (95% CI) (kg) | ‐3.4 (‐5.2 to ‐1.6) favouring drug interventions |
| Trials with 6 months' follow‐up only | |
| Number of trials | 9 |
| Point estimate (95% CI) (kg) | ‐3.5 (‐5.6 to ‐1.4) favouring drug interventions |
| Trials without trials with higher drug dose | |
| Number of trials | 10 |
| Point estimate (95% CI) (kg) | ‐3.4 (‐5.2 to ‐1.6) favouring drug interventions |
| Trials with trials with a high dose/active lifestyle intervention | |
| Number of trials | 6 |
| Point estimate (95% CI) (kg) | ‐4.3 (‐6.5 to ‐2.2) favouring drug interventions |
| Trials without trials with high attrition | |
| Number of trials | 9 |
| Point estimate (95% CI) (kg) | ‐4.4 (‐6.6 to ‐2.2) favouring drug interventions |
| CI: confidence interval. | |
| Outcome or subgroup title | No. of studies | No. of participants | Statistical method | Effect size |
| 1 Change in BMI (all trials) Show forest plot | 16 | 1884 | Mean Difference (IV, Random, 95% CI) | ‐1.34 [‐1.85, ‐0.83] |
| 2 Change in BMI (drug type) Show forest plot | 16 | 1884 | Mean Difference (IV, Random, 95% CI) | ‐1.34 [‐1.85, ‐0.83] |
| 2.1 Metformin | 8 | 543 | Mean Difference (IV, Random, 95% CI) | ‐1.35 [0.00, ‐0.69] |
| 2.2 Orlistat | 3 | 773 | Mean Difference (IV, Random, 95% CI) | ‐0.79 [‐1.08, ‐0.51] |
| 2.3 Sibutramine | 5 | 568 | Mean Difference (IV, Random, 95% CI) | ‐1.70 [‐2.89, ‐0.51] |
| 3 Change in BMI (dropout rate) Show forest plot | 16 | 1862 | Mean Difference (IV, Random, 95% CI) | ‐1.34 [‐1.85, ‐0.83] |
| 3.1 Dropouts < 20% | 9 | 597 | Mean Difference (IV, Random, 95% CI) | ‐1.11 [‐1.78, ‐0.44] |
| 3.2 Dropouts ≥ 20% | 6 | 1145 | Mean Difference (IV, Random, 95% CI) | ‐1.42 [‐2.34, ‐0.50] |
| 3.3 Unclear dropout rate | 1 | 120 | Mean Difference (IV, Random, 95% CI) | ‐2.73 [‐3.74, ‐1.72] |
| 4 Change in BMI (intention‐to‐treat (ITT) analysis) Show forest plot | 16 | 1862 | Mean Difference (IV, Random, 95% CI) | ‐1.34 [‐1.85, ‐0.83] |
| 4.1 No ITT | 5 | 282 | Mean Difference (IV, Random, 95% CI) | ‐1.56 [‐2.52, ‐0.60] |
| 4.2 ITT used | 11 | 1580 | Mean Difference (IV, Random, 95% CI) | ‐1.25 [‐1.86, ‐0.65] |
| 5 Change in BMI (funding) Show forest plot | 16 | 1862 | Mean Difference (IV, Random, 95% CI) | ‐1.34 [‐1.85, ‐0.83] |
| 5.1 Commercial | 5 | 1009 | Mean Difference (IV, Random, 95% CI) | ‐1.50 [‐2.69, ‐0.31] |
| 5.2 Noncommercial | 5 | 271 | Mean Difference (IV, Random, 95% CI) | ‐1.10 [‐1.77, ‐0.44] |
| 5.3 Commercial + noncommercial | 4 | 262 | Mean Difference (IV, Random, 95% CI) | ‐1.17 [‐1.86, ‐0.47] |
| 5.4 Unclear | 2 | 320 | Mean Difference (IV, Random, 95% CI) | ‐1.79 [‐3.54, ‐0.04] |
| 6 Change in BMI (publication date) Show forest plot | 16 | 1862 | Mean Difference (IV, Random, 95% CI) | ‐1.34 [‐1.85, ‐0.83] |
| 6.1 2007 or before | 8 | 1163 | Mean Difference (IV, Random, 95% CI) | ‐1.41 [‐2.21, ‐0.60] |
| 6.2 After 2007 | 8 | 699 | Mean Difference (IV, Random, 95% CI) | ‐1.26 [‐1.90, ‐0.62] |
| 7 Change in BMI (quality of trial) Show forest plot | 16 | 1862 | Mean Difference (IV, Random, 95% CI) | ‐1.34 [‐1.85, ‐0.83] |
| 7.1 Low | 6 | 322 | Mean Difference (IV, Random, 95% CI) | ‐1.40 [‐2.28, ‐0.52] |
| 7.2 Moderate | 10 | 1540 | Mean Difference (IV, Random, 95% CI) | ‐1.31 [‐1.95, ‐0.67] |
| 8 Change in BMI (country) Show forest plot | 16 | 1862 | Mean Difference (IV, Random, 95% CI) | ‐1.34 [‐1.85, ‐0.83] |
| 8.1 Middle income | 3 | 216 | Mean Difference (IV, Random, 95% CI) | ‐2.39 [‐3.08, ‐1.69] |
| 8.2 High income | 13 | 1646 | Mean Difference (IV, Random, 95% CI) | ‐1.09 [‐1.62, ‐0.56] |
| 9 Change in BMI (mean age) Show forest plot | 16 | 1884 | Mean Difference (IV, Random, 95% CI) | ‐1.34 [‐1.85, ‐0.83] |
| 9.1 Mean age < 12 years | 2 | 220 | Mean Difference (IV, Random, 95% CI) | ‐1.93 [‐3.53, ‐0.34] |
| 9.2 Mean age ≥ 12 years | 14 | 1664 | Mean Difference (IV, Random, 95% CI) | ‐1.25 [‐1.79, ‐0.71] |
| Outcome or subgroup title | No. of studies | No. of participants | Statistical method | Effect size |
| 1 Change in weight (all trials) Show forest plot | 11 | 1180 | Mean Difference (IV, Random, 95% CI) | ‐3.90 [‐5.86, ‐1.94] |
| 2 Change in weight (drug type) Show forest plot | 11 | 1180 | Mean Difference (IV, Random, 95% CI) | ‐3.90 [‐5.86, ‐1.94] |
| 2.1 Metformin | 4 | 372 | Mean Difference (IV, Random, 95% CI) | ‐3.24 [‐5.79, ‐0.69] |
| 2.2 Sibutramine | 5 | 568 | Mean Difference (IV, Random, 95% CI) | ‐4.71 [‐8.10, ‐1.32] |
| 2.3 Orlistat | 2 | 240 | Mean Difference (IV, Random, 95% CI) | ‐2.48 [‐4.31, ‐0.65] |
| Outcome or subgroup title | No. of studies | No. of participants | Statistical method | Effect size |
| 1 Serious adverse events Show forest plot | 5 | 1347 | Risk Ratio (M‐H, Random, 95% CI) | 1.43 [0.63, 3.25] |
| 1.1 Metformin | 1 | 76 | Risk Ratio (M‐H, Random, 95% CI) | 5.0 [0.25, 100.80] |
| 1.2 Orlistat | 3 | 773 | Risk Ratio (M‐H, Random, 95% CI) | 1.04 [0.41, 2.67] |
| 1.3 Sibutramine | 1 | 498 | Risk Ratio (M‐H, Random, 95% CI) | 3.53 [0.46, 27.33] |
| 2 Discontinued trial because of adverse events Show forest plot | 10 | 1664 | Risk Ratio (M‐H, Random, 95% CI) | 1.45 [0.83, 2.52] |
| 2.1 Metformin | 3 | 246 | Risk Ratio (M‐H, Random, 95% CI) | 1.20 [0.26, 5.48] |
| 2.2 Orlistat | 4 | 815 | Risk Ratio (M‐H, Random, 95% CI) | 2.49 [0.74, 8.32] |
| 2.3 Sibutramine | 3 | 603 | Risk Ratio (M‐H, Random, 95% CI) | 1.14 [0.53, 2.46] |