Intervenciones farmacológicas para el tratamiento de la obesidad en niños y adolescentes
Resumen
Antecedentes
La obesidad en niños y adolescentes ha aumentado a nivel global y se puede asociar con consecuencias significativas para la salud a corto y largo plazo.
Objetivos
Evaluar la eficacia de las intervenciones farmacológicas para el tratamiento de la obesidad en niños y adolescentes.
Métodos de búsqueda
Se hicieron búsquedas en CENTRAL, MEDLINE, Embase, PubMed (subgrupos no disponibles en Ovid), LILACS así como en registros de ensayos ICTRP (WHO) y en ClinicalTrials.gov. Las búsquedas se realizaron desde su inicio hasta marzo 2016. Se revisaron las referencias y no se aplicaron restricciones de idioma.
Criterios de selección
Se seleccionaron los ensayos controlados aleatorios (ECA) de intervenciones farmacológicas para el tratamiento de la obesidad (autorizadas y no autorizadas para esta indicación) en niños y adolescentes (media de la edad menor de 18 años) con o sin apoyo de los miembros de la familia, con un mínimo de tres meses de la intervención farmacológica y un seguimiento de seis meses desde el inicio del estudio. Se excluyeron las intervenciones dirigidas específicamente al tratamiento de los trastornos alimentarios o la diabetes tipo 2, o que incluyeron participantes con una causa secundaria de la obesidad o con un síndrome relacionado con esta afección. Además, se excluyeron los ensayos que incluyeron tratamientos con hormona del crecimiento y las participantes embarazadas.
Obtención y análisis de los datos
Dos autores de la revisión evaluaron de forma independiente la calidad de los ensayos y extrajeron los datos siguiendo la metodología Cochrane estándar. Cuando fue necesario, se estableció contacto con los autores para obtener información adicional.
Resultados principales
Se incluyeron 21 ensayos y se identificaron ocho ensayos en curso. Los ensayos incluidos evaluaron metformina (11 ensayos), sibutramina (seis ensayos), orlistat (cuatro ensayos), y un brazo del ensayo investigó la combinación de metformina y fluoxetina. Los ensayos en curso evalúan metformina (cuatro ensayos), topiramato (dos ensayos) y exenatide (dos ensayos). En los ensayos incluidos participaron 2484 pacientes, 1478 participantes se asignaron al azar a intervención farmacológica y 904 al grupo de comparación (91 participantes participaron en dos ensayos cruzados [crossover]; 11 participantes no especificados). Dieciocho ensayos utilizaron placebo en el grupo de comparación. Dos ensayos tuvieron un diseño cruzado, mientras que los 19 restantes fueron ECA paralelos. La duración del período de intervención varió de 12 a 48 semanas, y la duración del seguimiento desde el inicio del estudio varió de seis meses a 100 semanas.
En general, el riesgo de sesgo de los ensayos fue bajo en la generación de la secuencia aleatoria, la ocultación de la asignación y el cegamiento (participantes, personal y evaluadores) para los resultados subjetivos y objetivos. Se consideró que aproximadamente la mitad de los ensayos tuvieron alto riesgo de sesgo en uno o más dominios, como el informe selectivo.
Los resultados primarios de esta revisión fueron el cambio en el índice de masa corporal (IMC), el cambio en el peso y los eventos adversos. Los 21 ensayos midieron estos resultados. Los resultados secundarios fueron la calidad de vida relacionada con la salud (sólo un ensayo informó este resultado y no mostró diferencias importantes; pruebas de muy baja confiabilidad), la distribución de la grasa corporal (medida en 18 ensayos), el cambio conductual (medido en seis ensayos), los criterios de los participantes acerca de la intervención (no informados), la morbilidad asociada con la intervención (medida en un ensayo de orlistat que sólo informó más cálculos biliares nuevos después de la intervención; pruebas de muy baja confiabilidad), la mortalidad por todas las causas (un suicidio en el grupo de intervención de orlistat; pruebas de baja confiabilidad) y los efectos socioeconómicos (no informados).
La diferencia de medias (DM) de la intervención versus el comparador para el cambio en el IMC fue ‐1,3 kg/m2 (intervalo de confianza [IC] del 95%: ‐1,9 a ‐0,8; P < 0,00001; 16 ensayos; 1884 participantes; pruebas de baja confiabilidad). Cuando se dividió por el tipo de fármaco, sibutramina, metformina y orlistat mostraron reducciones en el IMC a favor de la intervención.
La DM de la intervención versus el comparador para el cambio en el peso fue ‐3,9 kg (IC del 95%: ‐5,9 a ‐1,9; P < 0,00001; 11 ensayos; 1180 participantes; pruebas de baja confiabilidad). Al igual que para el IMC, cuando los ensayos se dividieron por tipo de fármaco, sibutramina, metformina y orlistat mostraron reducciones en el peso a favor de la intervención.
Cinco ensayos informaron eventos adversos graves: 24/878 (2,7%) participantes de los grupos de intervención versus 8/469 (1,7%) participantes de los grupos de comparación (cociente de riesgos [CR] 1,43; IC del 95%: 0,63 a 3,25; 1347 participantes; pruebas de baja confiabilidad). Un total de 52/1043 (5,0%) participantes de los grupos de intervención versus 17/621 (2,7%) de los grupos de comparación interrumpieron el ensayo debido a los eventos adversos (CR 1,45; IC del 95%: 0,83 a 2,52; 10 ensayos; 1664 participantes; pruebas de baja confiabilidad). Los eventos adversos más frecuentes en los ensayos de orlistat y metformina fueron gastrointestinales (como diarrea, dolor o molestias abdominales leves, heces grasas). Los eventos adversos más frecuentes en los ensayos de sibutramina incluyeron taquicardia, estreñimiento e hipertensión. El único ensayo de fluoxetina informó sensación de sequedad bucal y heces blandas. Ningún ensayo investigó el tratamiento farmacológico en niños con sobrepeso.
Conclusiones de los autores
Esta revisión sistemática forma parte de una serie de revisiones Cochrane asociadas con las intervenciones para niños y adolescentes con obesidad y ha indicado que las intervenciones farmacológicas (metformina, sibutramina, orlistat y fluoxetina) pueden tener efectos pequeños en la reducción del IMC y el peso corporal en los niños y adolescentes con obesidad. Sin embargo, muchos de estos fármacos no están autorizados para el tratamiento de la obesidad en niños y adolescentes, o se han retirado. En general los ensayos fueron de baja calidad; muchos tuvieron un período de seguimiento corto después de la intervención o no ningún seguimiento, y tasas de abandono altas (abandono general del 25%). Los estudios de investigación futuros se deben centrar en la realización de ensayos con poder estadístico suficiente y un seguimiento a largo plazo para asegurar que se evalúen de manera integral los efectos a largo plazo de cualquier intervención farmacológica. Los eventos adversos se deben informar de una manera más estandarizada y especificar entre otras cosas el número de participantes que presentan al menos un evento adverso. Las exigencias de las autoridades reguladoras (la Food and Drug Administration de los EE.UU y la European Medicines Agency) para los ensayos de todos los fármacos nuevos que se van a utilizar en niños y adolescentes deben dar lugar a un aumento en el número de ensayos de alta calidad.
PICOs
Resumen en términos sencillos
Intervenciones farmacológicas para el tratamiento de la obesidad en niños y adolescentes
Pregunta de la revisión
¿Las intervenciones farmacológicas (medicinas) reducen el peso en los niños y adolescentes con obesidad y son seguras?
Antecedentes
A nivel mundial cada vez más niños y adolescentes presentan sobrepeso y obesidad. Estos niños y adolescentes tienen mayores probabilidades de presentar problemas de salud durante la infancia y la adolescencia y en etapas posteriores de la vida. Se necesita más información acerca de lo que funciona mejor para tratar este problema y reconocer que los denominados cambios en el estilo de vida (dieta, ejercicio y orientación) tienen una eficacia limitada.
Características de los estudios
Se encontraron 21 estudios controlados aleatorios (estudios clínicos en los que a los pacientes se les asigna al azar a uno de dos o más grupos de tratamiento) que compararon diversos fármacos más una intervención de cambio conductual como dieta, ejercicio o ambos (igual en los grupos de intervención) generalmente con placebo (un fármaco simulado) más una intervención de cambio conductual (igual en los grupos control). También se identificaron ocho estudios en curso (estudios que actualmente están en marcha y aún no se han completado). Un total de 2484 niños y adolescentes participaron en los estudios incluidos. La duración del período de intervención varió de 12 a 48 semanas, y la duración del seguimiento varió de seis meses a 100 semanas.
Key results
Los estudios incluidos investigaron metformina (diez estudios), sibutramina (seis estudios), orlistat (cuatro estudios), y un grupo de estudio evaluó la combinación de metformina y fluoxetina. Los estudios en curso investigan metformina (cuatro estudios), topiramato (dos estudios) y exenatide (dos estudios).
La mayoría de los estudios informaron el índice de masa corporal (IMC) y el peso corporal: el IMC es una medida de la grasa corporal y se calcula a partir del peso y las mediciones de la talla (kg/m2). En los niños, el IMC a menudo se mide de manera que se toma en cuenta el sexo, el peso y la talla a medida que el niño crece (puntuación z del IMC). El cambio promedio en el IMC en los grupos control estuvo entre una reducción de 1,8 kg/m2 y un aumento de 0,9 kg/m2, mientras que en todos los grupos de intervención la reducción promedio fue más pronunciada (reducción de 1,3 kg/m2). El mismo efecto se observó en el cambio en el peso: en promedio, los niños y los adolescentes de los grupos de intervención perdieron 3,9 kg más de peso que los niños y adolescentes de los grupos control. Los autores de los estudios informaron como promedio efectos secundarios graves en 24 por 1000 participantes de los grupos de intervención, en comparación con un promedio de 17 por 1000 participantes de los grupos control. Los números de participantes que abandonaron el estudio debido a los efectos secundarios fueron 40 por 1000 en los grupos de intervención y 27 por 1000 en los grupos control. Los efectos secundarios más frecuentes en los estudios de orlistat y metformina fueron intestinales (como diarrea y dolor de barriga leve). Los efectos secundarios habituales en los ensayos de sibutramina incluyeron aumento de la frecuencia cardíaca (taquicardia), estreñimiento e hipertensión. El estudio de fluoxetina informó sensación de sequedad en la boca y heces blandas. Un estudio informó la calidad de vida relacionada con la salud (una medida de funcionamiento físico, mental, emocional y social) y no encontró diferencias pronunciadas entre la intervención y el control. Ningún estudio informó los criterios de los participantes acerca de la intervención o los efectos socioeconómicos. Sólo un estudio informó la morbilidad (con qué frecuencia una enfermedad se presenta en un área específica) asociada con la intervención, y encontró más cálculos biliares después del tratamiento con orlistat. Los autores del estudio informaron un suicidio en el grupo de intervención de orlistat. Sin embargo, los estudios no fueron suficientemente grandes para investigar de manera confiable la muerte por cualquier causa. Ningún estudio investigó el tratamiento farmacológico en niños que sólo tenían sobrepeso (los niños con obesidad tienen un peso, un IMC o una puntuación z del IMC mucho mayor que los niños con sobrepeso).
Estas pruebas están actualizadas hasta marzo 2016.
Calidad de la evidencia
La confiabilidad general de las pruebas fue baja o muy baja, principalmente porque sólo hubo unos pocos estudios por medición de resultado, el número de niños o adolescentes incluidos fue pequeño y hubo variación en los resultados de los estudios. Además, muchos niños o adolescentes abandonaron los estudios antes de que hubieran terminado.
Conclusiones de los autores
Summary of findings
| Drug interventions for the treatment of obesity in children and adolescents | ||||||
| Population: obese children and adolescents Settings: mainly outpatient settings Intervention: metformin, orlistat, sibutramine usually combined with behaviour changing interventions Comparison: placebo or no placebo usually with behaviour changing interventions | ||||||
| Outcomes | Illustrative comparative risks* (95% CI) | Relative effect | No of participants | Quality of the evidence | Comments | |
| Assumed risk | Corresponding risk | |||||
| Comparator | Pharmacological intervention | |||||
| a. BMI (kg/m2) b. Body weight (kg) Follow‐up: 6 months (10 trials) ‐ 12 months (1 trial) | a. The mean reduction in BMI ranged across control groups from ‐1.8 to +0.9 b. The mean reduction in weight ranged across control groups from ‐3.8 kg to +4.9 kg | a. The mean reduction in BMI in the intervention groups was ‐1.3 higher (‐1.9 to ‐0.8 higher) b. The mean reduction in weight in the intervention groups was ‐3.9 kg higher (‐5.9 kg to ‐1.9 kg higher) | ‐ | a. 1884 (16) b. 1180 (11) | a. ⊕⊕⊝⊝ b. ⊕⊕⊝⊝ | ‐ |
| Adverse events a. Serious adverse events b. Discontinuation of trial because of adverse events Follow‐up: mostly 6 months, maximum 100 weeks (1 trial) | a. 17 per 1000 b. 27 per 1000 | a. 24 per 1000 (11 to 55) b. 40 per 1000 (23 to 69) | a.RR 1.43 (0.63 to 3.25) b.RR 1.45 (0.83 to 2.52) | a. 1347 (5) b. 1664 (10) | a. ⊕⊕⊕⊝ L owb b. ⊕⊕⊕⊝ Lowb | All trials reported if adverse events occurred; however, only 7/20 trials reported the number of participants who experienced at least 1 adverse event |
| Health‐related quality of life 3 questionnaires (1 trial) and SF‐36 (1 trial) Follow‐up: 6 months | See comment | See comment | See comment | 86 (2) | ⊕⊝⊝⊝ V ery lowc | Results were only reported for SF‐36 (1 trial on sibutramine, 46 children), there were no marked differences between intervention and comparator groups |
| All‐cause mortality Follow‐up: mostly 6 months, maximum 100 weeks (1 trial) | See comment | See comment | See comment | 2176 (20) | ⊕⊕⊕⊝ L owd | 1 suicide in the orlistat intervention group |
| Morbidity | See comment | See comment | See comment | 533 (1) | ⊕⊝⊝⊝ V ery lowe | Only 1 trial investigated morbidity defined as illness or harm associated with the intervention (Chanoine 2005). In the orlistat group 6/352 (1.7%) participants developed new gallstones compared with 1/181 (0.6%) in the placebo group |
| Socioeconomic effects | See comment | See comment | See comment | See comment | See comment | Not reported |
| *The basis for the assumed risk (e.g. the median control group risk across trials) is provided in footnotes. The corresponding risk (and its 95% confidence interval) is based on the assumed risk in the comparison group and the relative effect of the intervention (and its 95% CI). | ||||||
| GRADE Working Group grades of evidence | ||||||
| *Assumed risk was derived from the event rates in the comparator groups. aDowngraded by two levels because of potential other risk of bias, inconsistency and imprecision (see Appendix 13). | ||||||
Antecedentes
La prevalencia de niños y adolescentes con sobrepeso y obesidad ha aumentado en todo el mundo, y representa una crisis global de salud pública (Ng 2014; WHO 2015). Este no es sólo un problema en los países de ingresos altos, sino que también se ha encontrado una alta prevalencia en los países de ingresos bajos y medios (Wang 2012). Las pruebas indican que las tasas han disminuido o que se mantienen estables en los países de ingresos altos; sin embargo, aún aumentan en los países de ingresos bajos o medios y la prevalencia aún es alta en ambos (Olds 2011; Rokholm 2010). El Global Burden of Disease Study 2013 informó una media del 24% de los niños y del 23% de las niñas de los países de ingresos altos con sobrepeso u obesidad, aunque los porcentajes calculados de niños y niñas en los países de ingresos bajos o medios con sobrepeso u obesidad son del 13% en cada uno de estos grupos (Ng 2014). Este informe utilizó los valores de corte para la edad y el sexo de la International Obesity Task Force (IOTF) (Cole 2000). Además, los niños pequeños también tienen una alta prevalencia de sobrepeso u obesidad, con 42 000 000 de niños menores de cinco años con sobrepeso u obesidad en 2010 (cerca de 35 000 000 residen en países de ingresos bajos o medios ‐ De Onis 2010); estas estadísticas se basaron en la norma de crecimiento de la Organización Mundial de la Salud (OMS) (WHO 2006).
Una inquietud adicional en algunos países de altos ingresos, como los EE.UU. (Kelly 2013; Skinner 2014) e Inglaterra (CMO 2014; Ells 2015a), es el ascenso en la obesidad pediátrica grave. En Inglaterra, durante 2012/2013, el 2,9% de las niñas y el 3,9% de los niños de diez a 11 años de edad se clasificaron como con obesidad grave (índice de masa corporal [IMC] en el percentilo UK 90 99,6 o mayor ‐ Ells 2015a). En los EE.UU., de 2011 a 2012, el 2,1% de los jóvenes (edad de dos a 19 años) se categorizaron con obesidad clase 3 (gráficos de crecimiento de los Centers for Disease Control and Prevention: IMC 140% mayor del 95o percentilo o IMC 40 kg/m2 o mayor ‐ Skinner 2014).
Aunque la IOTF publicó una definición internacional para la obesidad pediátrica grave (mórbida) en 2012 (Cole 2012), con frecuencia la prevalencia de la obesidad grave se informa con puntos de corte específicos para el país, lo que dificulta hacer comparaciones internacionales. Sin embargo, datos de los EE.UU. (Skinner 2014) e Inglaterra (Ells 2015a) han indicado que la prevalencia de la obesidad pediátrica grave varía según el nivel socioeconómico y el grupo étnico y puede dar lugar a un aumento del riesgo de eventos adversos cardiometabólicos y de obesidad grave en la adultez (Kelly 2013).
La prevalencia del sobrepeso y la obesidad en los niños está influenciada por la desigualdad; las tasas son mayores en los niños de zonas muy desfavorecidas de los países de ingresos altos (Knai 2012; Shrewsbury 2008), y de las áreas más prósperas en los países de ingresos bajos o medios (Lobstein 2004; Wang 2012). Es probable que otras variables también influyan en la prevalencia de la obesidad, e incluyen la edad, el sexo y el grupo étnico, y se han encontrado variaciones en las tasas encontradas en diferentes grupos en los EE.UU. (Freedman 2006; Skinner 2014), Inglaterra (HSCIC 2014), y Nueva Zelanda (Rajput 2014).
Descripción de la afección
El sobrepeso o la obesidad durante la niñez se asocian con muchas enfermedades que pueden afectar la salud física y psicosocial. Estas enfermedades incluyen hipertensión, resistencia a la insulina e hiperlipidemia en los niños y los adolescentes con obesidad, lo que también incluye a los niños muy pequeños (Bocca 2013; Freedman 1999; Reilly 2003; Weiss 2004). La prevalencia de diabetes tipo 2 ha seguido en aumento en los niños y adolescentes; proyecciones recientes en los EE.UU. indican que posiblemente se cuadruplique de 2010 a 2050 el número de jóvenes (edad menor de 20 años) con diabetes tipo 2 (Imperatore 2012; Pinhas‐Hamiel 2005). El sobrepeso o la obesidad en la primera infancia también se ha vinculado a un aumento de los factores de riesgo cardiovasculares como la presión arterial sistólica alta (Falaschetti 2010), y estos factores de riesgos también están presentes en los pacientes con diabetes tipo 2 (Maahs 2014). Además, los trastornos médicos como la apnea del sueño, el síndrome de ovarios poliquísticos (SOPQ) y la función pulmonar deficiente también se han vinculado a la obesidad de la niñez (Dietz 1998; Ebbeling 2002; Lobstein 2004; Reilly 2003). Además, se ha mostrado que la obesidad de la niñez se asocia firmemente con la enfermedad del hígado graso no alcohólico (EHGNA), que es la causa más frecuente de enfermedad hepática crónica en niños y adolescentes (Aggarwal 2014; Berardis 2014).
La enfermedad también puede afectar la salud mental del niño y dar lugar a discriminación temprana, autoestima baja y depresión (Dietz 1998; Puhl 2007; Tang‐Peronard 2008). También existen pruebas de que la obesidad de la niñez se mantiene hasta la edad adulta (Parsons 1999; Singh 2008; Whitaker 1997), y por lo tanto se asocia con un mayor riesgo de problemas de salud en etapas posteriores de la vida (Reilly 2011).
Descripción de la intervención
Como la obesidad de la niñez puede tener consecuencias potencialmente graves sobre la salud y el bienestar del niño, es muy importante identificar las intervenciones que pueden controlar la obesidad a corto y largo plazo. La finalidad de dichas intervenciones son similares al tratamiento en adultos, y sus objetivos primarios son: reducir la ingesta calórica, aumentar el gasto de energía y reducir la conducta sedentaria. Sin embargo, se deben considerar la edad del niño y el grado inicial de obesidad antes de decidir el tipo, la duración y la intensidad de la intervención. Lo anterior permitirá adaptar mejor la intervención a la población objetivo y aumentar potencialmente las probabilidades de éxito y reducir la probabilidad de eventos adversos.
En años recientes sólo tres fármacos se han autorizado para el tratamiento de la obesidad en adultos: rimonabant, sibutramina y orlistat. Sin embargo, ninguno está autorizado para su uso en niños (Petkar 2013). Rimonabant se retiró del mercado debido a los eventos psiquiátricos adversos y la sibutramina fue suspendida por la European Medicine Agency (EMA) y fue retirada por la Food and Drug Administration (FDA) de los EE.UU. en 2010 debido a sus efectos adversos cardiovasculares; sin embargo, la sibutramina todavía está autorizada para el tratamiento de la obesidad en Brasil. Orlistat ha sido aprobado por la FDA pero sólo para los pacientes mayores de 12 años (Sherafat‐Kazemzadeh 2013). En Inglaterra, las guías del National Institute for Health and Care Excellence (NICE) recomiendan que el orlistat sólo se debe utilizar en los niños menores de 12 años de edad en circunstancias excepcionales en las que existen comorbilidades graves. Además, en los niños con 12 años de edad o más, el tratamiento sólo se recomienda si existen comorbilidades físicas como apnea del sueño o comorbilidades psicológicas graves (NICE 2014).
La metformina ha sido aprobada por la FDA para tratar la diabetes mellitus tipo 2 en adultos y niños mayores de diez años, pero no se ha autorizado para tratar la obesidad en niños o adultos (McDonagh 2014). Sin embargo, un análisis de los datos de prescripción en el Reino Unido en 2011 mostró que la metformina se ha prescrito de manera regular para tratar la obesidad de la niñez, y su indicación principal es el SOPQ (Hsia 2011). Otros fármacos que también se han utilizado previamente sin indicación para tratar la obesidad en niños y adolescentes incluyen los antidepresivos como la fluoxetina y el bupropión (Petkar 2013).
Aunque la pérdida de peso sola puede tener efectos clínicos y psicológicos beneficiosos, se han obtenido efectos beneficiosos adicionales en la salud al mejorar los trastornos relacionados con la obesidad, como la hiperglucemia en la diabetes tipo 2 (Pandey 2015), el dolor y la movilidad en la osteoartritis (Widhalm 2016) y la mejoría en la apnea obstructiva del sueño (Nespoli 2013). La pérdida de peso también puede reducir los factores de riesgo de enfermedad cardiovascular y metabólica (Halpern 2010), o incluso prevenir el desarrollo de enfermedades como la diabetes tipo 2 (Power 2014). Aunque el registro de los fármacos generalmente no requiere de dichos criterios de valoración clínicos, las consideraciones económicas personales y sanitarias exigen cada vez más pruebas más allá de la reducción del peso o el IMC, datos que serían más difíciles de establecer en los niños y los adolescentes y que se han estudiado de manera deficiente, si es que se han estudiado.
Efectos adversos de la intervención
Una revisión sistemática de las opciones farmacológicas para controlar la obesidad pediátrica señaló que los eventos adversos más frecuentes al tomar orlistat fueron los problemas gastrointestinales relacionados con el aumento de la excreción de las grasas (p.ej. heces grasas o aceitosas, aumento de la frecuencia de defecación, heces blandas, flatos, pérdidas fecales). Otros eventos adversos incluyeron deficiencias en componentes solubles en grasas a largo plazo, disminución de las concentraciones de vitamina D y cálculos biliares asintomáticos (Boland 2015). Los eventos adversos más frecuentes asociados con la metformina son gastrointestinales, algunos de los cuales pueden ser intolerables (McCreight 2016). Un cambio en la dosis o la duración puede resolver estos efectos adversos (McDonagh 2014). Los efectos adversos habituales de la sibutramina incluyen sensación de sequedad bucal, cefalea, estreñimiento e insomnio (Cheung 2013). Sin embargo, el fármaco también se han vinculado a un mayor riesgo de accidente cerebrovascular no mortal o infarto de miocardio, como se mostró en el ensayo Sibutramine Cardiovascular Outcomes (SCOUT) (James 2010). En consecuencia, el fármaco se retiró del mercado en numerosos países, incluidos el Reino Unido, EE.UU. y Australia.
De qué manera podría funcionar la intervención
La sibutramina es un inhibidor de la recaptación de serotonina y norepinefrina. Funciona mediante la reducción del hambre y mejora la saciedad, lo que da lugar a la reducción del consumo de alimentos (Catoira 2010). El orlistat provoca la excreción de aproximadamente el 30% de la grasa ingerida; funciona al actuar como un inhibidor de la lipasa gastrointestinal (Yanovski 2014). La metformina es un derivado de la biguanida que activa la proteína quinasa activada por la adenosina monofosfato, lo que da lugar a la reducción de la producción y la absorción de glucosa en el intestino y al aumento de la sensibilidad a la insulina. Se considera que reduce el peso corporal al inhibir la lipogénesis en las células grasas y potencialmente puede reducir el consumo de alimentos al aumentar el péptido similar al glucagón (Matson 2012). La fluoxetina es un antidepresivo que actúa al inhibir la recaptación de serotonina. Puede dar lugar a la pérdida de peso al reducir el apetito y, por lo tanto, inhibir la ingesta calórica (Ye 2011). Por lo tanto, es importante reconocer que cualquier fármaco que produzca un sabor desagradable o efectos adversos gastrointestinales podría producir pérdida de peso debido a dichos efectos adversos (Halford 2010).
Por qué es importante realizar esta revisión
En 2003, se publicó una revisión sistemática Cochrane titulada "Intervenciones para el tratamiento de la obesidad en los niños" que evaluó los efectos de las intervenciones sobre el estilo de vida (dieta, actividad física, conductuales, o una combinación de estas) e incluyó el análisis de los ensayos de tratamiento de la obesidad en la niñez publicados hasta julio de 2001 (Summerbell 2003). La segunda versión de esta revisión Cochrane se publicó en 2009, proporcionó una actualización de la revisión de 2003 y evaluó los efectos de intervenciones farmacológicas y quirúrgicas (Oude Luttikhuis 2009).
Para reflejar el crecimiento rápido en esta área, la tercera actualización de esta revisión se ha dividido en seis revisiones que se centran en los siguientes enfoques terapéuticos: "Cirugía para el tratamiento de la obesidad en niños y adolescentes" (Ells 2015b); "Intervenciones farmacológicas para el tratamiento de la obesidad en niños y adolescentes"; "Intervenciones sólo en padres para el sobrepeso y la obesidad en niños de 5 a 11 años de edad" (Loveman 2015); "Dieta, actividad física e intervenciones conductuales para el tratamiento del sobrepeso o la obesidad en niños de edad preescolar hasta los seis años" (Colquitt 2016); "Dieta, actividad física e intervenciones conductuales para el tratamiento del sobrepeso o la obesidad en niños de seis a 11 años"; y "Dieta, actividad física e intervenciones conductuales para el tratamiento del sobrepeso o la obesidad en los adolescentes de 12 a 17 años de edad". Esta revisión en esta serie se centra en la eficacia de las intervenciones farmacológicas en niños y adolescentes con obesidad. La revisión complementa la revisión Cochrane "Tratamiento farmacológico a largo plazo para la obesidad y el sobrepeso" (Padwal 2003), que no proporciona datos de ensayos controlados aleatorios (ECA) de intervenciones farmacológicas en niños y adolescentes.
Los resultados de la presente revisión y otras revisiones sistemáticas de esta serie aportarán información que puede respaldar las guías clínicas y las políticas sanitarias sobre el tratamiento del sobrepeso o la obesidad en niños y adolescentes.
Objetivos
Evaluar los efectos de las intervenciones farmacológicas para el tratamiento de la obesidad en niños y adolescentes.
Métodos
Criterios de inclusión de estudios para esta revisión
Tipos de estudios
Se incluyeron los ECA con una duración de la intervención de al menos tres meses y la duración del seguimiento desde el inicio del estudio tenía que ser como mínimo de seis meses.
Tipos de participantes
Se incluyeron los ensayos que evaluaron niños y adolescentes con obesidad con una media de edad de menos de 18 años al comienzo de la intervención. Se excluyeron los ensayos con participantes embarazadas o en estado grave. Se excluyeron las intervenciones dirigidas específicamente al tratamiento de los trastornos alimentarios o la diabetes tipo 2, o que incluyeron participantes con una causa secundaria de la obesidad o con un síndrome relacionado con esta afección.
Tipos de intervenciones
Se investigó cualquier intervención farmacológica que intentó tratar la obesidad pediátrica y utilizó cualquiera de las siguientes intervenciones versus secuencias control, en las que las mismas letras indican comparaciones directas.
Intervención
-
(a) Intervención farmacológica.
-
(b) Intervención farmacológica más otro tratamiento.
Comparador
-
(a1) Placebo.
-
(a2) Atención habitual.
-
(b1) Placebo más otro tratamiento.
-
(b2) Atención habitual más otro tratamiento.
Se exigió que los tratamientos concomitantes fueran los mismos en los grupos de intervención y de comparación.
Resumen de criterios de exclusión específicos
-
Ensayos que incluyeron el tratamiento con hormona del crecimiento como tratamiento para la obesidad.
-
Ensayos que incluyeron a participantes embarazadas.
-
Ensayos que incluyeron a participantes en estado grave.
-
Ensayos en los que los participantes tuvieron una causa secundaria o sindrómica de obesidad.
-
Intervenciones que trataron específicamente el tratamiento de los trastornos en los hábitos alimentarios o la diabetes tipo 2.
-
Ensayos en los que el objetivo no fue tratar la obesidad en niños o adolescentes.
-
Duración de la intervención menor de tres meses.
-
Duración del seguimiento inferior a seis meses.
Tipos de medida de resultado
Resultados primarios
-
Índice de masa corporal (IMC) y peso corporal.
-
Eventos adversos.
Resultados secundarios
-
Calidad de vida relacionada con la salud y autoestima.
-
Distribución de la grasa corporal.
-
Cambio conductual.
-
Criterios de los participantes acerca de la intervención.
-
Morbilidad.
-
Mortalidad por todas las causas.
-
Efectos socioeconómicos.
Momento de la medición de los resultados
-
IMC: definido como el peso (kg) dividido por la talla al cuadrado (m) y el peso corporal (kg): medido al inicio, a los seis, 12, 24 y más de 24 meses.
-
Eventos adversos: definidos como un resultado adverso producido durante o después de la intervención pero no necesariamente causado por ella y medidos en cualquier momento durante el ensayo.
-
Calidad de vida relacionada con la salud y autoestima: evaluadas con un instrumento validado como el Paediatric Quality of Life Inventory y medidas al inicio, seis, 12, 24 y más de 24 meses.
-
Distribución de la grasa corporal: definida con herramientas validadas como la absorciometría de rayos X de energía dual (DEXA), la circunferencia de la cintura, el espesor del pliegue cutáneo, el cociente cintura‐cadera o el análisis de impedancia bioeléctrica y medida al inicio, a los seis, 12, 24 y más de 24 meses.
-
Cambio conductual: evaluado con un instrumento validado y medido al inicio, a los seis, 12, 24 y más de 24 meses.
-
Criterios de los participantes acerca de la intervención: definidos como registros documentados de la información brindada por el participante y medidos al inicio, seis, 12, 24 y más de 24 meses.
-
Morbilidad: definida como enfermedad o efecto perjudicial asociados con la intervención y medida al inicio, a los seis, 12, 24 y más de 24 meses.
-
Mortalidad por todas las causas: definida como cualquier muerte producida durante o después de la intervención y medida en cualquier momento durante el ensayo.
-
Efectos socioeconómicos: definidos como una medida validada del nivel socioeconómico como los ingresos de los padres o el nivel educativo y medidos al inicio, a los seis, 12, 24 y más de 24 meses.
Tabla "Resumen de los hallazgos"
Se presenta una tabla de "Resumen de los hallazgos" que informa los siguientes resultados, enumerados según la prioridad.
-
IMC y peso corporal.
-
Eventos adversos.
-
Calidad de vida relacionada con la salud.
-
Mortalidad por todas las causas.
-
Morbilidad.
-
Efectos socioeconómicos.
Results
Description of studies
For a detailed description of trials, see the Characteristics of included studies, Characteristics of excluded studies and Characteristics of ongoing studies tables.
Results of the search
Our comprehensive literature searches identified 4995 records; from these, 199 full‐text papers or clinical trial records were identified for further examination. We excluded trials based on their titles or abstracts because they did not meet the inclusion criteria or were not relevant to the question under trial (see Figure 1 for the amended PRISMA flow diagram). After screening the full text of the selected publications, 21 completed trials (33 publications) met the inclusion criteria and were included in the qualitative synthesis of this review. All trials were published in English apart from Franco 2014 (Portuguese) and Prado 2012 (Spanish). We contacted all trial authors of the included trials and received a reply from all but four authors (Atabek 2008; Berkowitz 2003; Berkowitz 2006; Ozkan 2004). We sought additional information from the authors of all 21 trials, 12 authors responded to these requests and provided further data (Chanoine 2005; Clarson 2009; Franco 2014; Freemark 2001; Godoy‐Matos 2005; Maahs 2006; Mauras 2012; NCT00001723; Prado 2012; Rezvanian 2010; Srinivasan 2006; Van Mil 2007). We also identified eight ongoing trials, and an additional seven trials were placed in the 'awaiting classification' section because we could not source the full publication, the trial was completed but there was not yet enough information to include it in this review or the publication was identified when a final draft of the review had been completed (NCT01487993).
Included studies
A detailed description of the characteristics of included trials is presented elsewhere (see Characteristics of included studies; Appendix 2; Appendix 3; Appendix 4). The following is a succinct overview.
Source of data
The literature search identified all 21 included trials in the review and all but one (NCT00001723) were published trials. Ten out of 21 trials were included in the previous review (Oude Luttikhuis 2009), and information relating to these 10 trials was extracted from the 2009 review ‐ two review authors extracted any missing information from the publication. All ongoing trials were found from searching online clinical trial registers.
Comparisons
Of the 21 included trials, 11 used metformin in their intervention arm; four of these trials gave metformin plus a behaviour changing programme to the intervention group and used a placebo plus a behaviour changing programme in the comparator group (Prado 2012; Wiegand 2010; Wilson 2010; Yanovski 2011). Two trials compared metformin plus a behaviour changing programme against a behaviour changing programme alone without using a placebo (Clarson 2009; Mauras 2012). Four trials compared metformin plus a behaviour changing intervention against placebo plus a behaviour changing intervention (Atabek 2008; Kendall 2013; Rezvanian 2010; Srinivasan 2006). Rezvanian 2010 also had two additional intervention arms: metformin plus fluoxetine plus healthy eating plus physical activity advice; and fluoxetine plus healthy eating plus physical activity advice. The remaining trial compared metformin with placebo; hence, there was no lifestyle component included in either arm (Freemark 2001).
Six trials used sibutramine as the pharmacological intervention; three trials compared sibutramine plus a behaviour changing programme with placebo plus a behaviour changing programme (Berkowitz 2003; Berkowitz 2006; Van Mil 2007). The other three trials compared sibutramine plus dietary/exercise advice with placebo plus dietary/exercise advice (Franco 2014; García‐Morales 2006; Godoy‐Matos 2005).
Four trials investigated orlistat. Chanoine 2005, Maahs 2006, and NCT00001723 examined orlistat plus a behaviour changing intervention versus placebo plus a behaviour changing intervention. Ozkan 2004 did not include a placebo in their comparator group; hence, they compared orlistat plus a behaviour changing intervention with a behaviour changing intervention only.
Overview of trial populations
A total of 2484 children and adolescents participated in the 21 included trials. A total of 1851 participants finished the trial (74.5%) and hence we measured at the study's endpoint. In 10 studies, the dropout rates were higher in the placebo group than the intervention group, potentially showing some dissatisfaction with the control condition. The individual trial sample size ranged from 24 to 539 participants.
The 11 metformin trials included 885 participants. The individual trial sample size ranged from 26 to 155 participants. One metformin trial also included two additional intervention arms of fluoxetine and fluoxetine plus metformin (45 randomised participants in each intervention arm).
The six sibutramine trials included 778 participants. The individual trial sample size ranged from 24 to 498 participants.
The four orlistat trials included 821 participants. The individual trial sample size ranged from 40 to 539 participants.
Trial design
Trials were RCTs. Nineteen trials adopted a parallel group superiority design and two were cross‐over trials (Franco 2014; Srinivasan 2006). All but three trials used a placebo comparator (Clarson 2009; Mauras 2012; Ozkan 2004). Five trials were multicentred (Berkowitz 2006; Chanoine 2005; Kendall 2013; Wiegand 2010; Wilson 2010), with the number of centres ranging from two (Wiegand 2010) to 33 (Berkowitz 2006). In terms of blinding, 14 trials were double‐blinded for participants and personnel (Berkowitz 2003; Berkowitz 2006; Chanoine 2005; Franco 2014; Freemark 2001; Godoy‐Matos 2005; Maahs 2006; NCT00001723; Prado 2012; Rezvanian 2010; Srinivasan 2006; Van Mil 2007; Wilson 2010; Yanovski 2011), no trials were single‐blinded for participants, and four trials did not define blinding (Atabek 2008; García‐Morales 2006; Kendall 2013; Ozkan 2004). Thirteen trials blinded outcome assessors (Berkowitz 2003; Berkowitz 2006; Chanoine 2005; Franco 2014; Freemark 2001; Godoy‐Matos 2005; Maahs 2006; NCT00001723; Rezvanian 2010; Srinivasan 2006; Van Mil 2007; Wiegand 2010; Wilson 2010; Yanovski 2011). Trials were published between the 2001 and 2014; all but one sibutramine trial were published before the drug was withdrawn by the FDA ‐ Franco 2014 was conducted in Brazil where the drug is still licensed. All metformin trials were published between 2006 and 2012 apart from Freemark 2001. Orlistat trials were published between 2004 and 2006, but one trial did not have any publications available and only posted results on a clinical trial website and in a conference abstract (NCT00001723).
The duration of interventions ranged from 12 weeks to 17 months, with a mean duration of 28 weeks. The duration of follow‐up (from end of intervention) ranged from 0 to 52 weeks, with a mean follow‐up period of 12 weeks. Participants in nine trials received the intervention/comparator for six months with no additional follow‐up; in three trials, participants received the intervention/comparator for six months, which was then followed by an open‐label period for six months (Berkowitz 2003; NCT00001723; Yanovski 2011); two trials received the intervention for 12 months with no additional follow‐up (Berkowitz 2006; Chanoine 2005); two cross‐over trials included a six‐month intervention or control condition followed by a washout period, then each participant crossed over into the alternative condition for an additional six months (Franco 2014; Srinivasan 2006); three trials included an intervention/comparator period for three months (or 12 weeks) then a follow‐up period for an additional three months (or 12 weeks) (Prado 2012Rezvanian 2010; Van Mil 2007); one trial gave the intervention or comparator condition for 48 weeks, then included an additional follow‐up period for another 48 weeks (Wilson 2010); and finally in one trial the length of the intervention and follow‐up varied across participants (Ozkan 2004).
Five trials had a run‐in period, of which three included a placebo run‐in phase (Chanoine 2005; Godoy‐Matos 2005; Wilson 2010), with a duration varying from two to four weeks; Freemark 2001 included 48‐hour inpatient tests as their run‐in period; two trial gave dietetic advice/counselling (García‐Morales 2006; Godoy‐Matos 2005); Wilson 2010 also included a lifestyle modification programme in their run‐in period. Outcomes were not assessed in these run‐in periods. Furthermore, three trials included an open‐label phase six months after randomisation where both groups received the drug intervention (Berkowitz 2003; NCT00001723; Yanovski 2011); these open‐label phases were not included in our analyses. Participants in one of these trials were also followed up for two years after the open‐label phase (NCT00001723). None of the included trials were terminated before regular end; however, two trials that we identified from ClinicalTrials.gov were terminated before enrolment and have been placed in the excluded trials section (see Characteristics of excluded studies table).
Settings
Nine of the 21 trials were conducted in the USA (Berkowitz 2003; Berkowitz 2006; Chanoine 2005; Freemark 2001; Maahs 2006; Mauras 2012; NCT00001723; Wilson 2010; Yanovski 2011). The other trials were completed in Turkey (Atabek 2008; Ozkan 2004), Canada (Chanoine 2005; Clarson 2009), Brazil (Franco 2014; Godoy‐Matos 2005), Mexico (García‐Morales 2006), the UK (Kendall 2013), Australia (Srinivasan 2006), Chile (Prado 2012), Iran (Rezvanian 2010), the Netherlands (Van Mil 2007), Germany (Wiegand 2010), and Switzerland (Wiegand 2010). All trials were performed in an outpatient setting apart from three trials which had both an inpatient and outpatient setting (Freemark 2001; Maahs 2006; Yanovski 2011).
Participants
The participating population consisted of the following: mainly obese children or adolescents (Maahs 2006 also included overweight participants). The mean age of the participants in the trials ranged from 10.1 to 16.3 years with only two trials having a mean age less than 12 years old (Atabek 2008; Yanovski 2011). Two studies required all participants to be postmenarchal (Berkowitz 2003; Prado 2012), while Yanovski 2011 only included children who were prepubertal or early pubertal. Fifteen trials included participants from high‐income countries, and six recruited participants from middle‐income countries (Atabek 2008; Franco 2014; García‐Morales 2006; Godoy‐Matos 2005; Ozkan 2004; Rezvanian 2010) ‐ based on the World Bank list of economies July 2015 (World Bank 2015). Ethnic groups were distributed as follows: six trials did not report on ethnic groups (Atabek 2008; Franco 2014; Ozkan 2004; Prado 2012; Rezvanian 2010; Van Mil 2007); one trial reported all their participants were white (Clarson 2009), three trials reported approximately 75% of their population were white (Chanoine 2005; Kendall 2013; Wiegand 2010); five trials reported approximately half of their population were white (Berkowitz 2003; Berkowitz 2006; Freemark 2001; Mauras 2012; Wilson 2010); one trial reported that approximately 60% of their population were Hispanic (Maahs 2006); one trial reported approximately 50% of their population were non‐Hispanic (Yanovski 2011); 63% of participants in one trial were non‐Hispanic black people while the remaining were non‐Hispanic white people (NCT00001723); and one trial reported that 64% of their participants came from ethnic backgrounds with a high prevalence of insulin resistance and metabolic syndrome (Srinivasan 2006). Participants' sex was not distributed evenly in 11 trials (Berkowitz 2003; Berkowitz 2006; Chanoine 2005; Freemark 2001; Godoy‐Matos 2005; Kendall 2013; Maahs 2006; NCT00001723; Prado 2012; Wiegand 2010; Wilson 2010). Three trials reported glycosylated haemoglobin A1c (HbA1c) at baseline and the mean HbA1c ranged from 5.3% to 5.6% (Freemark 2001; Maahs 2006; Wilson 2010). The mean BMI at baseline for the interventions groups ranged from 26.5 kg/m2 to 41.5 kg/m2. The BMI at baseline for the comparator groups ranged from 26.2 kg/m2 to 41.7 kg/m2. Thirteen trials reported comorbidities of participants at baseline (Atabek 2008; Berkowitz 2006; Chanoine 2005; Clarson 2009; Freemark 2001; García‐Morales 2006; Kendall 2013; Mauras 2012; NCT00001723; Prado 2012; Srinivasan 2006; Wiegand 2010; Yanovski 2011), all but one trial (Freemark 2001) reported cointerventions in participants, and four trials had comedications used by participants (NCT00001723; Ozkan 2004; Wilson 2010; Yanovski 2011). Criteria for entry into the individual trials are outlined in the Characteristics of included studies table. Major trial exclusion criteria were major illnesses such as type 1 or 2 diabetes mellitus or cardiovascular disease; pregnancy; major psychiatric disorders; taking or previously taken medication known to influence body composition or contradiction to the drug therapy; cigarette smoking or alcohol use; obesity associated with genetic disorders; and eating disorders such as bulimia. Adherence/compliance with the intervention was reported in most trials as good (70% or more) and was usually assessed by pill counts.
Diagnosis
All trials included participants who were defined as obese at baseline according to the growth reference they used, apart from one trial (Maahs 2006), which also included overweight children in their inclusion criteria. Seven trials define obesity using the 95th percentile or greater cut‐off on the Centers for Disease Control and Prevention (CDC; Kuczmarski 2000) charts (Atabek 2008; Clarson 2009; García‐Morales 2006; Mauras 2012; Rezvanian 2010; Wilson 2010; Yanovski 2011), but Wilson 2010 also required their participants to weigh less than 136 kg. One trial used greater than 85th percentile (to include also overweight participants) (Maahs 2006), while Van Mil 2007 used the 97th percentile or greater but also further selected for triceps skinfold thickness 97th percentile or greater for age and sex. NCT00001723 defined obesity by BMI for age and triceps skinfold above the 95th percentile (determined by National Health and Nutrition Examination Survey (NHANES) I age‐, sex‐ and race‐specific data) and all participants were required to be over 60 kg in bodyweight. Alternatively two trials used the definition of obesity given by Rosner 1998 of two units more than the US weighted mean of the 95th percentile but no greater than 44 kg/m2 (Berkowitz 2006; Chanoine 2005). One trial used the IOTF (Cole 2000) definitions for obesity (Srinivasan 2006), while another used the WHO (WHO 1995) growth standards cut‐off (Franco 2014). Kendall 2013 used the UK BMI growth charts (Cole 1995), and used the 98th centile as the cut‐off for obesity. One trial used German references (Kromeyer‐Hausschild 2001) to define obesity using greater than 97th percentile (Wiegand 2010). Three trials used raw BMI to define obesity: BMI greater than 30 kg/m2 (Freemark 2001); BMI 32 kg/m2 to 44 kg/m2 (Berkowitz 2003); and BMI 30 kg/m2 to 45 kg/m² (Godoy‐Matos 2005). In two trials, it was unclear which growth reference charts they were referring to (Ozkan 2004; Prado 2012). Participants were diagnosed with type 1 or 2 diabetes mellitus in none of our included trials. However, some trials included additional inclusion criteria other than age and obesity: Atabek 2008 required all participants to have hyperinsulinaemia; Clarson 2009 only included participants who were insulin resistant (defined by homeostasis model assessment (HOMA) for insulin resistance values greater than 3); Godoy‐Matos 2005 required all participants to have an adult bone age determined by left hand radiography (Greulich‐Pyle method); Kendall 2013 only included participants who had impaired glucose tolerance or hyperinsulinaemia; NCT00001723 only recruited participants who had comorbidities at baseline and these included hypertension, hyperinsulinaemia and hepatic steatosis; Srinivasan 2006 only included participants where there was a suspicion of insulin resistance (fasting insulin to glucose ratio greater than 4.5 or presence of acanthosis nigricans); Prado 2012 required all participants to present with at least one risk factor for type 2 diabetes (e.g. first‐ or second‐degree relative with history of type 2 diabetes); Mauras 2012 only included participants who had normal glucose tolerance but also had elevated highly sensitive C‐reactive protein (hsCRP), fibrinogen concentrations or both; Freemark 2001 inclusion criteria included a fasting insulin concentration exceeding 15 IU/mL and at least one first‐ or second‐degree relative with type 2 diabetes; and Yanovski 2011 required all participants to have hyperinsulinaemia (defined as fasting insulin 15 IU/mL or greater). All participants in Wiegand 2010 presented with comorbidities at baseline (features of the metabolic syndrome); however, this did not appear to be an inclusion criterion.
Interventions
Eleven trials used metformin as their pharmacological intervention (Atabek 2008; Clarson 2009; Freemark 2001; Kendall 2013; Mauras 2012; Prado 2012; Rezvanian 2010; Srinivasan 2006; Wiegand 2010; Wilson 2010; Yanovski 2011). The intervention was administered orally and varied between one and four times per day. Between trials, the daily dosage of metformin varied between 500 mg and 2000 mg, with a mean daily dosage of 1364 mg. Four metformin trials reported treatment before the start of the trial (Kendall 2013; Rezvanian 2010; Wiegand 2010; Wilson 2010); this included a healthy 'lifestyle' advice sheet, lifestyle modification treatment and a six‐month multiprofessional lifestyle intervention. Seven trials had a titration period, consisting of increasing the number of tablets taken over a period of weeks until the maximum dosage was tolerated (Clarson 2009; Kendall 2013; Mauras 2012; Rezvanian 2010; Srinivasan 2006; Wilson 2010; Yanovski 2011). Two trials did not have a matching placebo in the comparator group ‐ participants received a lifestyle intervention only (Clarson 2009; Mauras 2012). The duration of treatment ranged from 12 weeks/three months to six months with a mean treatment duration of 5.5 months.
Six trials used sibutramine as their intervention (Berkowitz 2003; Berkowitz 2006; Franco 2014; García‐Morales 2006; Godoy‐Matos 2005; Van Mil 2007). In all six trials, the drug was administered orally once daily. The daily dosage of sibutramine varied between 5 mg and 15 mg, with a mean daily dose of 11 mg. Three trials reported that participants received treatment before the start of the trial (Franco 2014; García‐Morales 2006; Godoy‐Matos 2005); this included dietetic advice/counselling and a six‐month lifestyle intervention. Two trials had a titration period (Berkowitz 2003; Van Mil 2007). All trials had a matching placebo as the comparator intervention. The duration of treatment ranged from 12 weeks to 12 months, with a mean treatment duration of 6.5 months.
Four trials gave orlistat to their intervention group (Chanoine 2005; Maahs 2006; NCT00001723; Ozkan 2004). The drug was administered orally three times per day and the daily dosage of orlistat was 360 mg in all four trials. No trials gave participants any treatment before the trial. One trial did not give a matching placebo to the comparator group ‐ participants received a lifestyle intervention only (Ozkan 2004). The duration of treatment ranged from six months to 12 months, with a mean treatment duration of 8.9 months.
One trial also included two additional intervention arms: metformin plus fluoxetine and fluoxetine only (Rezvanian 2010). The drugs were given by the oral route once daily. The daily dose of fluoxetine was 20 mg. Participants were also given lifestyle modification treatment before the start of the trial. They also had a titration period. The comparator group received a matching placebo. The duration of treatment was 12 weeks.
Outcomes
Fourteen trials explicitly stated a primary endpoint in the publication (Berkowitz 2003; Berkowitz 2006; Chanoine 2005; Clarson 2009; García‐Morales 2006; Godoy‐Matos 2005; Kendall 2013; Maahs 2006; Mauras 2012; Prado 2012; Van Mil 2007; Wiegand 2010; Wilson 2010; Yanovski 2011), 10 trials reported 'secondary' endpoints (Berkowitz 2003; Berkowitz 2006; Chanoine 2005; García‐Morales 2006; Godoy‐Matos 2005; Kendall 2013; Maahs 2006; Wiegand 2010; Wilson 2010; Yanovski 2011). NCT00001723 had no publication attached; however, the trial authors reported both a primary and secondary endpoint on the clinical trials website. The most commonly defined primary outcomes in publications were change in absolute BMI, change in BMI z score/standard deviation score (SDS) and change in bodyweight. The most commonly defined primary outcomes in trial protocols were change in BMI from baseline and per cent change in BMI.
Reporting of endpoints
Twenty‐one trials collected a mean of 14 (range four to 25) outcomes. All 21 trials measured raw BMI. Ten trials reported change in BMI z score/SDS (Berkowitz 2003; Clarson 2009; Freemark 2001; Kendall 2013; NCT00001723; Srinivasan 2006; Van Mil 2007; Wiegand 2010; Wilson 2010; Yanovski 2011). All 21 trials reported on whether adverse events occurred. Of those trials which reported adverse events, some reported the total number of adverse events whilst others reported the total number of participants who experienced at least one adverse event. We asked all authors to provide further details on adverse events, such as how many participants experienced severe adverse events and if so, whether they were hospitalised. Two trials measured health‐related quality of life with validated questionnaires (García‐Morales 2006; Maahs 2006). Seventeen trials reported that they measured body fat distribution. Fifteen trials measured waist circumference, hip circumference, or both (Berkowitz 2003; Berkowitz 2006; Chanoine 2005; Clarson 2009; Franco 2014; García‐Morales 2006; Godoy‐Matos 2005; Kendall 2013; Mauras 2012; Prado 2012; Rezvanian 2010; Srinivasan 2006; Wiegand 2010; Wilson 2010; Yanovski 2011). Seven trials measured body fat mass by DEXA (Chanoine 2005; Mauras 2012; NCT00001723; Srinivasan 2006; Van Mil 2007; Wilson 2010; Yanovski 2011). Two trials also measured body fat mass by bioelectrical impedance (Maahs 2006; Wiegand 2010). Six trials measured behaviour change (Atabek 2008; Berkowitz 2003; García‐Morales 2006; Kendall 2013; Maahs 2006; Van Mil 2007). Five trials measured food consumption through dietary records or questionnaires (Atabek 2008; García‐Morales 2006; Kendall 2013; Maahs 2006; Van Mil 2007), and one trial measured the feeling of hunger (Berkowitz 2003). Two trials measure changes in physical activity: Kendall 2013 used a physical activity questionnaire and Van Mil 2007 measured total energy expenditure which accounts for level of physical activity. Only one trial investigated morbidity defined as illness or harm associated with the intervention (Chanoine 2005). One trial reported a death from suicide (Maahs 2006). Berkowitz 2006 reported two suicide attempts which did not result in death.
No trials assessed participants' views or socioeconomic effects as outcomes. For a summary of all outcomes assessed in each trial, see Appendix 5.
Excluded studies
We excluded 135 trials or trial records after careful evaluation of the full publication. The main reasons for exclusion were the participants were adults or had a mean age of more than 18 years, the trial design was not an RCT, the duration of treatment was less than three months or the duration of follow‐up was less than six months. For further details, see Characteristics of excluded studies table.
Risk of bias in included studies
For details on risk of bias of included trials see Characteristics of included studies table. For an overview of review authors' judgements about each risk of bias item for individual trials and across all trials, see Figure 2 and Figure 3. We investigated performance bias, detection bias and attrition bias separately for objective and subjective outcome measures.

Risk of bias graph: review authors' judgements about each risk of bias item presented as percentages across all included trials.

Risk of bias summary: review authors' judgements about each risk of bias item for each included trial.
Allocation
Fifteen trials reported allocation was concealed (Berkowitz 2006; Chanoine 2005; Franco 2014;Freemark 2001; García‐Morales 2006; Godoy‐Matos 2005; Kendall 2013; Mauras 2012; NCT00001723; Prado 2012; Rezvanian 2010; Srinivasan 2006; Wiegand 2010; Wilson 2010; Yanovski 2011); two trials did not conceal allocation (Clarson 2009; Ozkan 2004). It was unclear whether four trials concealed allocation (Atabek 2008; Berkowitz 2003; Rezvanian 2010;Wiegand 2010) ). Fourteen trials reported an adequate random sequence generation (Berkowitz 2006; Chanoine 2005; Clarson 2009; Franco 2014; Freemark 2001; García‐Morales 2006; Kendall 2013; Mauras 2012; NCT00001723; Prado 2012; Rezvanian 2010; Srinivasan 2006; Wilson 2010; Yanovski 2011). Two trials reported random sequence generation was inadequate; hence, would have likely of introduced bias (Maahs 2006; Ozkan 2004).Five trials did not describe the randomisation process (Atabek 2008; Berkowitz 2003; Godoy‐Matos 2005; Van Mil 2007; Wiegand 2010).
Blinding
All 21 trials reported both objective and subjective outcomes. The main objectives outcomes were BMI, weight, waist or hip circumference, blood pressure, cholesterol insulin, glucose and triglycerides, whilst the main subjective outcomes were adverse events, food consumption and health‐related quality of life. Subjective outcomes tended to be self‐reported (e.g. quality of life and dietary questionnaires), while objective measures usually were investigator‐assessed (e.g. BMI, waist circumference). Adverse events could be either self‐reported or investigator assessed.
Ten trials explicitly stated that blinding of the participants, personnel and outcome assessors was undertaken (Berkowitz 2003; Berkowitz 2006; Franco 2014; Maahs 2006; NCT00001723; Rezvanian 2010; Srinivasan 2006; Van Mil 2007; Wilson 2010; Yanovski 2011). Seven trials reported that double blinding took place (Atabek 2008; Chanoine 2005; Freemark 2001; García‐Morales 2006; Godoy‐Matos 2005; Kendall 2013; Wiegand 2010), but only three of the trials' authors confirmed this meant blinding was undertaken of participants, personnel and outcomes assessors (Chanoine 2005; Freemark 2001; Godoy‐Matos 2005). No trials reported that single blinding was undertaken. Six trials did not provide sufficient information about blinding procedures (Atabek 2008; García‐Morales 2006; Kendall 2013; Ozkan 2004; Prado 2012; Wiegand 2010).
Incomplete outcome data
Twenty trials that had losses to follow‐up described the number of trial withdrawals (Berkowitz 2003; Berkowitz 2006; Chanoine 2005; Clarson 2009; Franco 2014; Freemark 2001; García‐Morales 2006; Godoy‐Matos 2005; Kendall 2013; Maahs 2006; Mauras 2012; NCT00001723; Ozkan 2004; Prado 2012; Rezvanian 2010; Srinivasan 2006; Van Mil 2007; Wiegand 2010; Wilson 2010; Yanovski 2011). Twelve trials used ITT analyses (Berkowitz 2003; Berkowitz 2006; Chanoine 2005; García‐Morales 2006; Godoy‐Matos 2005; Kendall 2013; Maahs 2006; NCT00001723; Rezvanian 2010; Van Mil 2007; Wilson 2010; Yanovski 2011). One trial did not report whether there were any losses to follow‐up (Atabek 2008). Five trials did not provide detailed descriptions of participants' withdrawals and reasons underpinning them (Atabek 2008; Franco 2014; Freemark 2001; García‐Morales 2006; Mauras 2012). Four trials had attrition rates greater than 30% with possible impact on the outcomes(Chanoine 2005; Franco 2014; Mauras 2012; Prado 2012;Wilson 2010).
Selective reporting
Only nine trials provided a clinical trial identifier or reference to a protocol (Berkowitz 2003; Berkowitz 2006; Kendall 2013; Mauras 2012; NCT00001723; Srinivasan 2006; Wiegand 2010; Wilson 2010; Yanovski 2011); however, we were unable to source the clinical trial entry of one trial (Wiegand 2010). Three trials had a high risk of reporting bias after failure to report results for one or more outcomes they described as having measured (Atabek 2008; García‐Morales 2006; Maahs 2006), and a further trial had a high risk due to differences in results reported on the clinical trial website and in a conference abstract (NCT00001723). The remaining trials had unclear risk of reporting bias due to no protocol being available.
Other potential sources of bias
Seven trials were at high risk of other biases. These biases included: the trial not including a power calculation (Atabek 2008; Clarson 2009; Franco 2014; Freemark 2001; Godoy‐Matos 2005; Ozkan 2004), the trial lacking methodological detail (Atabek 2008; Franco 2014) and the trial not adjusting for baseline differences (Freemark 2001; Ozkan 2004), The remaining 14 trials were at unclear risk of other potential sources of bias. It is important to note that the trials which do not include a power calculation may not be powered to detect differences in their primary outcome. BMI or weight was the primary outcome in all but two trials (Mauras 2012; Wiegand 2010) that included a power calculation. Mauras 2012 and Wiegand 2010 may not have been adequately powered to detect differences in BMI or weight. With regards to adverse events and the review's secondary outcomes (e.g. morbidity), it is likely that most trials would not have been powered to detect differences in these outcomes. Hence, these results should be interpreted with caution.
Effects of interventions
Baseline characteristics
For details of baseline characteristics, see Appendix 3 and Appendix 4.
Pharmacological intervention versus comparators
We performed the meta‐analyses with CMA software version 3 and aligned with the data in the Review Manager 5 (RevMan 2014) meta‐analyses. Because the cross‐over design did not appear suitable for our research question due to inadequate washout periods and noncomparable baseline measures in the two cross‐over periods, we excluded Franco 2014 and Srinivasan 2006 from all meta‐analyses. We also excluded Rezvanian 2010 from the meta‐analyses because the reported SDs were unreliably small in comparison to all other published SDs of included trials and probably denoted standard errors. We excluded two further trials because of substantial methodological concerns (Ozkan 2004; Prado 2012). In addition, Prado 2012 did not report change in BMI from baseline to follow‐up and Ozkan 2004 did not have a consistent follow‐up time frame across all participants.
Primary outcomes
Body mass index and bodyweight
We included 16 trials in the meta‐analysis of BMI. Most of the BMI data were from the publications, except for Chanoine 2005 and Freemark 2001, where raw BMI, SDs or both were not available; hence, we obtained additional data from the trial authors. We extracted data for NCT00001723 from the ClinicalTrials.gov website. In the meta‐analysis, we included trials which had either a six‐month or 12‐month follow‐up from baseline (Berkowitz 2006; Wilson 2010), which was the endpoint in most of the trials. However, even though Chanoine 2005 had a 12‐month follow‐up, we only had data available at six months from baseline. Wilson 2010 provided data at 100 weeks' follow‐up but we did not include these in the meta‐analysis.
The summary estimate across all pharmacological interventions versus all comparators (metformin, orlistat or sibutramine mostly versus placebo ‐ usually combined with behaviour changing interventions) showed a MD in BMI change of ‐1.3 kg/m2 (95% CI ‐1.9 to ‐0.8; P < 0.00001; 16 trials; 1884 participants; low certainty evidence ‐ Analysis 1.1) in favour of the drug interventions. Heterogeneity was considerable (I2 = 77%).
In Wilson 2010, which reported a BMI change at 100 weeks from baseline (48 weeks of metformin or placebo treatment, then a 48‐week drug‐free period), the metformin group increased their BMI during the drug‐free period (+0.5) while the placebo group decreased their BMI (‐0.8), measured as the difference between 52 and 100 weeks from baseline. In the metformin plus fluoxetine trial, the fluoxetine only group had a decrease in BMI of ‐0.6 (SD 0.1) and the metformin plus fluoxetine group had a decrease in BMI of ‐0.9 (SD 0.02), compared to an increase of 0.2 (SD 0.04) in the placebo group at 24 weeks from baseline.
Only 11 trials reported weight data at baseline or follow‐up (or change from baseline) in their publications; hence, we only included these trials in the meta‐analysis. Data were reported at six months from baseline apart from one trial (Berkowitz 2006), which reported the change in weight at 12 months from baseline. The summary estimate across all pharmacological interventions versus comparators (metformin, orlistat or sibutramine mostly versus placebo ‐ usually combined with behaviour changing interventions) showed an MD in change in weight of ‐3.9 kg (95% CI ‐5.9 to ‐1.9; P < 0.00001; 11 trials; 1180 participants; low certainty evidence ‐ Analysis 2.1) in favour of the drug interventions. Heterogeneity was considerable (I2 = 79%).
Adverse events
Only three trials had sufficiently long exposure times to evaluate adverse events possibly associated with drug interventions for obesity in children and adolescents: one trial with 39 participants randomised to metformin treatment for 100 weeks (Wilson 2010), one trial with 368 participants randomised to sibutramine treatment for 12 months (Berkowitz 2006), and one trial with 357 participants randomised to orlistat treatment for 54 weeks (Chanoine 2005).
Adverse events were reported to have occurred in all 11 metformin trials except from Clarson 2009, which reported that metformin was well tolerated, and the author clarified no adverse events occurred. Gastrointestinal adverse events were most commonly reported with one metformin trial reporting that gastrointestinal adverse events were statistically more prevalent in the intervention group compared to the control group (Yanovski 2011). However, Wiegand 2010 reported such events occurred more frequently in the placebo group. Kendall 2013 reported adverse events were more common in the metformin group and were mainly gastrointestinal. Atabek 2008 reported that two metformin‐treated participants experienced diarrhoea, mild abdominal pain/discomfort, or both. Freemark 2001 also reported three participants experienced transient abdominal discomfort or diarrhoea, however so did one placebo participant. Wilson 2010 reported that the most common adverse events included headache, nausea, vomiting, upper respiratory tract infection and musculoskeletal complaints; however, none were statistically different between the metformin and placebo groups. One trial showed the fatigue was more common in the metformin‐treated children (Yanovski 2011). Furthermore, Freemark 2001 reported one case of an exacerbation of migraine and one case of transient nausea in the metformin arm. Nausea was reported in the Srinivasan 2006 trial where two participants were unable to tolerate a higher dose of metformin (1 g); however, they tolerated a lower dose and continued in the trial. Yanovski 2011 also reported that levels of serum vitamin B12 were reduced in the metformin group compared with an increase in the placebo group ‐ this difference was statistically significant. Rezvanian 2010 reported two cases of headache, two cases of abdominal pain and three cases of loose stools in the metformin arm but they were all minor and tolerable. Mauras 2012 reported metformin was well tolerated and safe, and the author added that the adverse effects between groups were comparable. Prado 2012 reported metformin was well tolerated by participants and both groups showed a significant increase in alanine transaminase (ALT) and aspartate transaminase (AST), and a reduction in haemoglobin levels, but these were within the normal ranges.
Three of six trials on sibutramine therapy reported on adverse events: one large trial showed tachycardia, dry mouth, constipation, dizziness, insomnia and hypertension were all reported more frequently by sibutramine participants than by placebo participants (Berkowitz 2006). Sibutramine‐treated participants also had a higher blood pressure and pulse rate at 12 months' follow‐up compared to the placebo‐treated participants (Berkowitz 2006). However, another trial reported that there was no statistically significant difference between changes in heart rate or blood pressure between the sibutramine and placebo groups, although abdominal cramps were significantly higher in the sibutramine group (Van Mil 2007). Godoy‐Matos 2005 showed constipation was significantly higher in the sibutramine group compared to the placebo group.
All four orlistat trials reported on adverse events: gastrointestinal problems such as fatty stools, oily spotting and fecal urgency, along with headaches and upper respiratory tract infections, were the most common adverse effects. In the NCT00001723 trial, the prevalence of some gastrointestinal problems was higher in the orlistat group compared to the placebo group and this included: fatty‐appearing stools, bloating/gas, frequent urge for bowel movement and uncontrolled passage of stool or oil. Chanoine 2005 reported that gastrointestinal tract‐related adverse events were more common in the orlistat group compared to the placebo group; however, most were classed as mild to moderate intensity. Maahs 2006 also reported that the orlistat group had significantly increased gastrointestinal adverse events (e.g. soft stools, oily spotting) compared to the placebo group. Mild gastrointestinal complaints (frequent stools) were experienced by all orlistat‐receiving participants in the Ozkan 2004 trial. Chanoine 2005 also reported that 10 orlistat and one placebo participant showed abnormalities detected on electrocardiograms; however, an independent cardiologist concluded that none were connected to the treatment; in addition, levels of oestradiol in girls decreased in the orlistat group versus a slight increase in the placebo group (P = 0.05). Symptomatic gallstones were also seen in six orlistat participants which were not seen at baseline (five of these participants had lost large amounts of weight).
In the trial which included a fluoxetine arm, there were five adverse events with regards to the drug which included three cases of dry mouth and two cases of loose stool; these were all considered as minor and tolerable, and reported as transient (Rezvanian 2010).
Serious/severe adverse events were also investigated: most trials did not report how they defined a serious/severe adverse event. It was also unclear in four trials whether a serious/severe adverse event actually occurred (Berkowitz 2003; Ozkan 2004; Van Mil 2007; Wiegand 2010). Only five trials reported that a serious or severe adverse event occurred (Berkowitz 2006; Chanoine 2005; Maahs 2006; NCT00001723; Wilson 2010); the remaining 12 trials reported that there were no serious or severe adverse events.
Across all trials the RR for serious adverse events comparing drug interventions with comparators was 1.43 (95% CI 0.63 to 3.25; P = 0.39; 5 trials; 1347 participants; low certainty evidence ‐ Analysis 3.1). Absolute numbers experiencing a serious adverse event were 24/878 (2.7%) participants in the drug intervention groups versus 8/469 (1.7%) participants in the comparator groups.
In the metformin trials, only one trial reported that there were serious adverse events and these included one case of appendectomy and one case of leg vein thrombosis in the metformin group, but these were both seen as unrelated to the drug (Wilson 2010). One sibutramine trial reported that 2.7% of sibutramine‐treated participants experienced serious adverse events which included one case of excessive nausea and vomiting, one suicide attempt and five depression cases (Berkowitz 2006). The placebo group had one case of suicide attempt and one case of depression. Chanoine 2005 reported 3% of participants experienced at least one serious adverse event: the five events in the placebo group included acute demyelinating encephalomyelitis, facial palsy, pneumonia, worsening of asthma and pain in the right side; and the 11 events in the orlistat group included pilonidal abscess, depression, asthma attack, seizure, admission for repair of deviated nasal septum, appendicitis, cholelithiasis, gallbladder disorder followed by cholecystectomy, adenoidal hypertrophy and aseptic meningitis. It was only the case of cholelithiasis in the orlistat participant which was seen to be possibly related to the trial medication potentially due to rapid weight loss. Another orlistat trial reported two serious adverse events in the placebo group and these were one case of hypoglycaemia and one case of left lower quadrant pain and vomiting (NCT00001723).
In the sibutramine trials, 32 participants (24 in the intervention groups and eight in the control groups) left the trial because of adverse events. Berkowitz 2006 reported that withdrawals due to tachycardia were similar in both groups but hypertension led to the withdrawal of five participants in the sibutramine group versus none in the placebo group. Two cases of attempted suicide (one intervention and one placebo) also led to discontinuation but were considered unlikely to be related to the trial drug; one case of excessive nausea and vomiting in the sibutramine group also led to withdrawal and may have been related to the drug. Van Mil 2007 had one withdrawal from the sibutramine group due to symptoms of clinical depression and Berkowitz 2003 had one withdrawal from the placebo group.
In the metformin trials, nine participants withdrew due to adverse events (five in intervention group and four in placebo group). Wilson 2010 reported one participant from the metformin group withdrew due to nausea which was probably related to the drug, and a further two metformin and one placebo participants dropped out of the trial due to elevated levels of ALT. Gastrointestinal symptoms caused 6% of participants (one in metformin group and three in placebo group) to drop out of the Wiegand 2010 trial. In addition, Yanovski 2011 reported one participant dropped out of the metformin group due to medication intolerance.
Across all trials the RR for discontinuing the trial because of adverse events comparing drug interventions with comparators was 1.45 (95% CI 0.83 to 2.52; P = 0.19; 10 trials; 1664 participants; low certainty evidence ‐ Analysis 3.2). Absolute numbers discontinuing the trial because of an adverse event were 52/1043 (5.0%) participants in the drug intervention groups versus 17/621 (2.7%) participants in the comparator groups.
All four orlistat trials had dropouts due to adverse events; 28 participants (23 in the intervention group and five in the placebo group). Chanoine 2005 reported 12 dropouts (3%) in the orlistat group and three dropouts (2%) in the placebo group, mainly due to gastrointestinal adverse events. Ozkan 2004 reported seven participants (32%) dropped out of the orlistat group due to gastrointestinal complaints. Maahs 2006 reported two participants in the orlistat group discontinued due to adverse events (assumed to be gastrointestinal) and one participant in the orlistat group committed suicide. NCT00001723 reported one participant in the orlistat group and two participants in the placebo group dropped out of the trial due to medication intolerance.
For further details, see Appendix 9, Appendix 10, and Appendix 11.
Secondary outcomes
Health‐related quality of life
Two trials measured health‐related quality of life; the certainty of the evidence was very low. García‐Morales 2006 used the 36‐Item Short‐Form Health Survey (SF‐36) questionnaire and found changes in the total score were slightly higher in the sibutramine group compared to the placebo group, but this difference was not statistically significant. Maahs 2006 used three questionnaires to assess health‐related quality of life, but found no statistically significant differences between the orlistat and placebo group from baseline to six months. For further details on the health‐related quality of life measurements, see Appendix 14.
Body fat distribution
Eighteen trials reported outcomes which measured body fat distribution. Fifteen of these trials measured waist, hip, or both circumferences at baseline and follow‐up. In the metformin trials, Mauras 2012 found greater decreases in waist circumference in the metformin plus diet plus exercise group compared with the diet plus exercise group at six months' follow‐up. However, this trial was not placebo controlled. In addition, Srinivasan 2006, a cross‐over trial, reported a beneficial treatment effect on waist circumference in participants taking metformin for six months, when compared to six months of placebo. However, there was no statistically significant difference in waist circumference between the drug and control groups in Clarson 2009 and Prado 2012 trials at six months' follow‐up. Wilson 2010 measured waist circumference but did not report results. Two metformin trials also measured waist‐to‐hip ratio and found no statistically significant difference between groups at six months' follow‐up (Kendall 2013; Wiegand 2010). Yanovski 2011 also measured abdominal and hip circumference at six months' follow‐up, and found a statistically significant difference between metformin and placebo, in favour of the intervention. In the metformin plus fluoxetine trial, only the metformin plus fluoxetine arm had a statistically significant between‐group difference in waist circumference at 24 weeks from baseline (Rezvanian 2010). In the sibutramine trials, there was a statistically significant difference in waist circumference in favour of the intervention in five trials (Berkowitz 2003; Berkowitz 2006; Franco 2014; García‐Morales 2006; Godoy‐Matos 2005). Godoy‐Matos 2005 also reported a statistically significant reduction in hip circumference in the sibutramine group compared to the placebo group; however, there was no statistically significant difference for waist‐to‐hip ratio at six months. Only one orlistat trial measured waist circumference and found it increased in the placebo group but decreased in the orlistat group at one year' follow‐up (difference statistically significant); this was also seen for hip circumference (Chanoine 2005).
Seven trials measured body composition by DEXA. Four metformin trials and two orlistat trials measured body fat using DEXA. Three metformin trials found no statistically significant difference between groups in the percentage of body fat lost (Mauras 2012; Srinivasan 2006; Wilson 2010). However, one trial observed a statistically significant difference of 1.4 kg between the metformin and placebo groups, in favour of the intervention group at six months' follow‐up (Yanovski 2011). One sibutramine trial assessed body composition using underwater weighing and DEXA; however, there was no statistically significant difference in percentage of fat mass between groups. Chanoine 2005 reported they measured fat mass by DEXA in a subgroup of participants as a safety measure and the orlistat group lost more fat mass compared to the placebo group (P = 0.03). NCT00001723 found a slightly greater decrease in body fat (kg) in the orlistat group compared to the placebo group. Two trials estimated fat mass from bioimpedence analysis: one orlistat trial (Maahs 2006) and one metformin trial (Wiegand 2010), but they reported no statistically significant difference between intervention and placebo groups. Yanovski 2011 measured fat mass by air displacement plethysmography and found metformin participants had statistically significant decreases in their fat mass compared to placebo participants; they also measured intra‐abdominal fat by magnetic resonance imaging but found no statistically significant difference between groups. Srinivasan 2006 also used magnetic resonance imaging and found a beneficial treatment effect of metformin over placebo for subcutaneous abdominal adipose tissue but not visceral abdominal adipose tissue; Mauras 2012 also used this technique and found that intrahepatic fat only decreased in the nonplacebo control group. Wiegand 2010 used abdominal computer tomography (CT) scans to evaluate abdominal fat content but also found no statistically significant difference between metformin and placebo participants in the results.
Behaviour change
Six trials measured behaviour change; however, only two trials reported the results. Participants in three trials all completed a food frequency questionnaire at the beginning and end of the trial; however, no results were presented (Atabek 2008; García‐Morales 2006; Maahs 2006). Kendall 2013 assessed dietary habits and exercise levels through three previously validated questionnaires but were unable to analyse the data due to insufficient resources. Van Mil 2007 measured total energy expenditure, using the Maastricht protocol and included data from a seven‐day dietary record; however, the difference between the sibutramine and control groups after 12 weeks of intervention was not statistically significant. Physical activity level was also measured using an activity questionnaire, but there was no statistically significant difference between groups at 12 weeks. Changes in total energy expenditure and physical activity levels were not measured at 24‐week follow‐up due to unavailability of equipment.
Participants' views of the intervention
No trials investigated participants' views of the intervention.
Morbidity
Only one trial investigated morbidity defined as illness or harm associated with the intervention (Chanoine 2005). In the orlistat group, 6/352 (1.7%) participants developed new gallstones compared with 1/181 (0.6%) in the placebo group. The certainty of the evidence was very low.
Some trials investigated various risk indicators, mainly insulin resistance or insulin sensitivity and hyperinsulinaemia (Atabek 2008; Clarson 2009; Freemark 2001; Kendall 2013; Srinivasan 2006; Wiegand 2010; Yanovski 2011). García‐Morales 2006 investigated changes in blood pressure, glucose and triglycerides. Prado 2012 investigated glycaemia, insulin resistance and lipid profiles. Mauras 2012 investigated changes in hsCRP and fibrogen concentrations.
All‐cause mortality
One trial reported a death from suicide (Maahs 2006); the certainty of evidence was low. The authors reported that quality of life factors were screened extensively and the participant gave negative responses to quality of life questions specific to suicide and was also under the care of a psychiatrist for depression at the time of the trial. Berkowitz 2006 reported two suicide attempts (one in the intervention group and one in the placebo group).
Socioeconomic effects
No trials investigated socioeconomic effects.
For a summary of all outcomes assessed in each trial, see Appendix 5. For further explanation on how trial outcomes were defined, see Appendix 7 and Appendix 8.
Subgroup analyses
We performed subgroup analyses on our primary outcomes of BMI and weight. In our protocol, we specified we would analyse length of follow‐up; however, only two trials provided data at a time point greater than six months. There was too much heterogeneity to analyse the maintenance periods and most trials ended on completion of the intervention. In addition, there were only two trials which did not use a placebo; hence, we did not perform subgroup analyses based on type of control given. However, we performed subgroup analyses on BMI for the following factors: drug type (Analysis 1.2), dropout rates (Analysis 1.3), ITT analysis (Analysis 1.4), funding source (Analysis 1.5), publication date (Analysis 1.6), quality of trial (Analysis 1.7), country income (Analysis 1.8), and mean age of participants (Analysis 1.9).
Only two interaction tests for subgroup differences indicated statistically significant differences.
Comparing dropout rates less than 20% showed an MD in BMI change of ‐1.1 kg/m2 (95% CI ‐1.8 to ‐0.4; 9 trials), with dropout rates 20% or greater showed an MD in BMI change of ‐1.4 kg/m2 (95% CI ‐2.3 to ‐0.5; 6 trials), and with unclear dropout rates showed an MD in BMI change of ‐2.7 kg/m2 (95% CI ‐3.7 to ‐1.7; 1 trial). The P value for interaction was 0.03 and heterogeneity was substantial (I2 = 71%).
Comparing middle‐income countries with high‐income countries showed an MD in BMI change of ‐2.4 kg/m2 (95% CI ‐3.1 to ‐1.7; 3 trials) versus ‐1.1 kg/m2 (95% CI ‐1.6 to ‐0.6; 13 trials). The P value for interaction was 0.004 and heterogeneity was considerable (I2 = 88%).
For the outcome measure change in weight, only drug type could be used for a subgroup analysis and the interaction test for subgroup differences was not statistically significant (P = 0.52, I2 = 0%).
We also explored the effects of participant sex on the BMI point estimate, using a meta‐regression model in CMA. The proportion of boys at follow‐up (or baseline if not reported) in each study was selected as a covariate. We found that the coefficient of determination (r2) from this model was zero. The 95% CI for the meta‐regression slope was extremely wide either side of zero (‐6.3 to 4.1). We noted that some study authors only reported the percentage of boys and girls in the total sample at baseline and not at follow‐up.
Sensitivity analyses
Table 2 shows the sensitivity analyses on BMI change. Our first analysis removed the trials which only reported pre‐ and post‐BMI (not change scores) (Kendall 2013; Wiegand 2010), and hence required the use of a correlation coefficient of 0.78 (Bayer 2011) to predict the point estimates. This made very little difference in the point estimate. Only two trials had larger sample sizes (Berkowitz 2006; Chanoine 2005); however, when we removed these trials from the meta‐analysis the point estimate did not change. Furthermore, all trials in the meta‐analysis were published and were in English; hence, we could not perform a sensitivity analysis on these criteria. However, we performed a sensitivity analysis with allocation bias, blinding bias (participant and trial personnel, and assessor) and attrition bias by removing the high risk or unclear risk trials, and did not find substantial differences. This was also the case when we removed trials with higher drug dose and 12 months' follow‐up, as well as when we removed the trials with an active lifestyle intervention.
| Trials with data on mean change only | |
| Number of trials | 14 |
| Point estimate (95% CI) (kg/m2) | ‐ 1.5 (‐2.0 to ‐0.9) favouring drug intervention |
| Trials with concealment of allocation | |
| Number of trials | 12 |
| Point estimate (95% CI) (kg/m2) | ‐1.3 (‐1.8 to ‐0.7) favouring drug interventions |
| Trials with blinding of participants/personnel | |
| Number of trials | 10 |
| Point estimate (95% CI) (kg/m2) | ‐1.3 (‐1.9 to ‐0.7) favouring drug interventions |
| Trials with blinding of outcome assessors | |
| Number of trials | 10 |
| Point estimate (95% CI) (kg/m2) | ‐1.3 (‐1.9 to ‐0.7) favouring drug interventions |
| Trials without large sample size trials | |
| Number of trials | 14 |
| Point estimate (95% CI) (kg/m2) | ‐1.3 (‐1.8 to ‐0.7) favouring drug interventions |
| Trials with trials with 6 months' follow‐up only | |
| Number of trials | 14 |
| Point estimate (95% CI) (kg/m2) | ‐1.2 (‐1.7 to ‐0.7) favouring drug interventions |
| Trials without trials with higher drug dose | |
| Number of trials | 14 |
| Point estimate (95% CI) (kg/m2) | ‐1.2 (‐1.7 to ‐0.7) favouring drug interventions |
| Trials with trials with a high dose/active lifestyle intervention | |
| Number of trials | 10 |
| Point estimate (95% CI) (kg/m2) | ‐1.3 (‐1.9 to ‐0.7) favouring drug interventions |
| Trials without trials with high attrition | |
| Number of trials | 13 |
| Point estimate (95% CI) (kg/m2) | ‐1.4 (‐2.0 to ‐0.8) favouring drug interventions |
BMI: body mass index; CI: confidence interval.
We performed similar analyses for weight change (Table 3). We removed trials which did not report change in weight (Atabek 2008; Kendall 2013; Maahs 2006), and this resulted in a slightly greater reduction in the point estimate. We used the same correlation coefficient to calculate the mean change in weight (in the intervention and comparator groups) as we did for the BMI outcome (r = 0.78), although we were able to calculate an exact correlation coefficient in one trial (Maahs 2006) by using their reported BMI at baseline, follow‐up and change score (r = 0.975). Reductions in point estimates increased slightly when we removed trials with blinding (participant and trial personnel, and assessor) and attrition bias. This also occurred when we restricted the analysis to trials which also included a high‐dose behaviour change intervention. In the sensitivity analyses where we removed trials with high allocation concealment bias, high drug dose, large sample size or follow‐up greater than six months, point estimate reductions were slightly less than in the original analysis.
| Trials with data on mean change only | |
| Number of trials | 8 |
| Point estimate (95% CI) (kg) | ‐ 4.1 (‐6.3 to ‐1.8) favouring drug intervention |
| Trials with concealment of allocation | |
| Number of trials | 9 |
| Point estimate (95% CI) (kg) | ‐3.5 (‐5.8 to ‐1.2) favouring drug interventions |
| Trials with blinding of participants/personnel | |
| Number of trials | 7 |
| Point estimate (95% CI) (kg) | ‐4.2 (‐6.8 to ‐1.5) favouring drug interventions |
| Trials with blinding of outcome assessors | |
| Number of trials | 7 |
| Point estimate (95% CI) (kg) | ‐4.2 (‐6.8 to ‐1.5) favouring drug interventions |
| Trials without large sample size trials | |
| Number of trials | 10 |
| Point estimate (95% CI) (kg) | ‐3.4 (‐5.2 to ‐1.6) favouring drug interventions |
| Trials with 6 months' follow‐up only | |
| Number of trials | 9 |
| Point estimate (95% CI) (kg) | ‐3.5 (‐5.6 to ‐1.4) favouring drug interventions |
| Trials without trials with higher drug dose | |
| Number of trials | 10 |
| Point estimate (95% CI) (kg) | ‐3.4 (‐5.2 to ‐1.6) favouring drug interventions |
| Trials with trials with a high dose/active lifestyle intervention | |
| Number of trials | 6 |
| Point estimate (95% CI) (kg) | ‐4.3 (‐6.5 to ‐2.2) favouring drug interventions |
| Trials without trials with high attrition | |
| Number of trials | 9 |
| Point estimate (95% CI) (kg) | ‐4.4 (‐6.6 to ‐2.2) favouring drug interventions |
CI: confidence interval.
Assessment of reporting bias
We drew a funnel plot in CMA version 3 and Review Manager 5 for change in BMI as there was a sufficient number of trials (16) (Figure 4). The Egger's regression intercept was ‐0.75 (95% CI ‐3.2 to 1.7; P = 0.52); this suggests there was no evidence of reporting bias.

Funnel plot of comparison: 1 Body mass index (BMI): pharmacological interventions versus comparators, outcome: 1.1 Change in BMI (all trials) (kg/m2).
There was a similar finding when we drew a funnel plot for change in weight (11 trials) (Egger's regression intercept 1.7, 95% CI ‐3.5 to 6.8; P = 0.48) (Figure 5).

Funnel plot of comparison: 2 Weight: pharmacological interventions versus comparators, outcome: 2.1 Change in weight (all trials) (kg).
Ongoing trials
We found eight ongoing RCTs with four receiving metformin in the intervention group (EUCTR2010‐023061‐21; NCT00889876; NCT01677923; NCT02274948), two receiving topiramate (NCT01859013; NCT02273804), and two receiving exenatide (EUCTR2015‐001628‐45‐SE; NCT02496611). Three trials, originally identified as ongoing, have been moved into the 'awaiting classification' section because the trial has been completed but no results are available on the clinical trial website or through a publication (ISRCTN08063839; NCT00934570; NCT00940628). In addition, one trial which was originally classified as ongoing was moved to the 'awaiting classification' section because during the final stages of conducting the review we identified a new publication (via the MEDLINE email alert service), which included results from 18‐month follow‐up (van der Aa 2016, see NCT01487993 for a summary of the results). Results from this trial will be incorporated in the next update of the review. For two trials, we were unable to locate the source (Golebiowska 1981; Linquette 1971). In addition, we identified one conference abstract (Pastor 2014a, see EUCTR2010‐023061‐21) and one conference poster (Smetanina 2015). We attempted to contact both authors but only received a reply from Smetanina 2015, who confirmed the trial had been completed but these data were still being analysed.
Discusión
Resumen de los resultados principales
Se incluyeron 21 ECA publicados y ocho ECA en curso en esta revisión. Los ensayos incluidos evaluaron la metformina (11 ensayos), la sibutramina (seis ensayos), el orlistat (cuatro ensayos) y un brazo del ensayo investigó la combinación de metformina más fluoxetina. Los ensayos en curso incluyen cuatro de metformina, dos de topiramato y dos de exenatide. En los ensayos incluidos hubo 2484 participantes, 1478 participantes se asignaron al azar a los grupos de intervención farmacológica y 904 a los grupos de comparación. Todos los ensayos excepto tres utilizaron placebo en el grupo de comparación. Dos ensayos tuvieron un diseño cruzado, mientras que los 19 restantes fueron ECA paralelos. La duración del período de intervención varió de 12 a 48 semanas, y la duración del seguimiento desde el inicio del estudio varió de seis meses a 100 semanas. En total hubo reducciones pequeñas en el IMC (DM ‐1,3; IC del 95%: ‐1,9 a ‐0,8) y en el cambio en el peso corporal (DM ‐3,9 kg; IC del 95%: ‐5,9 a ‐1,9) a favor de las intervenciones farmacológicas. Cinco ensayos informaron eventos adversos graves (24/878 [2,7%] participantes de los grupos de intervención versus 8/469 [1,7%] participantes en los grupos de comparación; CR 1,43; IC del 95%: 0,63 a 3,25; 1347 participantes; pruebas de baja confiabilidad). Un total de 52/1043 participantes (5,0%) en los grupos de intervención versus 17/621 (2,7%) en los grupos de comparación interrumpieron el ensayo debido a los eventos adversos (CR 1,45; IC del 95%: 0,83 a 2,52; 10 ensayos; 1664 participantes; pruebas de baja confiabilidad). Los eventos adversos más frecuentes en los ensayos de orlistat y metformina fueron los gastrointestinales. Los efectos adversos habituales en los ensayos de sibutramina incluyeron taquicardia, estreñimiento e hipertensión. El ensayo de fluoxetina informó sensación de sequedad bucal y heces blandas. Un ensayo informó la calidad de vida relacionada con la salud y no mostró diferencias pronunciadas entre la intervención y el comparador. Ningún ensayo informó los criterios de los participantes acerca de la intervención ni los efectos socioeconómicos. Sólo un ensayo informó la morbilidad asociada con la intervención y hubo más cálculos biliares después del tratamiento con orlistat. Los autores del ensayo informaron un suicidio en uno de los grupos de intervención de orlistat. Sin embargo, los ensayos no fueron suficientemente prolongados para investigar de forma confiable la mortalidad por todas las causas. Ningún ensayo investigó el tratamiento farmacológico en niños con sobrepeso.
Compleción y aplicabilidad general de las pruebas
Se afrontaron problemas al realizar el metanálisis del IMC ya que algunos ensayos no informaron los datos brutos requeridos; por lo tanto, se intentó obtenerlos de los autores de los ensayos. Además, cuando se mide el estado del peso de un niño generalmente se tienen en cuenta la edad y el sexo porque está en crecimiento. Sin embargo, en esta revisión solamente se evaluaron los cambios en el IMC bruto porque los estudios de investigación anteriores han indicado que los cambios a corto plazo en la adiposidad están mejor representados por los cambios en las unidades brutas del IMC en comparación con las puntuaciones z del IMC o los percentilos del IMC (Cole 2005; Kakinami 2014). Además, sólo diez ensayos informaron los cambios en las puntuaciones z del IMC; por lo tanto, se pensó que era más apropiado realizar sólo el metanálisis del IMC bruto, y que luego este cambio se podría convertir al cambio en la puntuación z del IMC (mediante la referencia de crecimiento deseada), lo que se realizó en la sección "Conclusiones" de esta revisión.
Sólo 21 ensayos midieron los eventos adversos; sin embargo, algunos ensayos informaron el número total de participantes que presentaron al menos un evento adverso, aunque otros sólo informaron el número de eventos adversos específicos. En consecuencia, también se intentó obtener esta información de los autores de los ensayos. De los seis ensayos que midieron el cambio conductual, sólo dos ensayos informaron resultados al seguimiento. Solamente dos ensayos informaron la calidad de vida relacionada con la salud y utilizaron métodos diferentes. Debido a lo anterior se necesitan más ensayos para investigar cómo los fármacos utilizados para tratar la obesidad afectan la calidad de vida relacionada con la salud de los participantes. Ningún ensayo informó diferencias en los criterios de los participantes ni en los efectos socioeconómicos.
Calidad de la evidencia
Según los criterios GRADE, los resultados del IMC, el peso corporal, la mortalidad por todas las causas y los eventos adversos se consideraron de calidad baja. Los niveles de las pruebas se disminuyeron debido a la posibilidad de otros riesgos de sesgos o de sesgo de informe, inconsistencia e imprecisión. Las pruebas de la calidad de vida relacionada con la salud y de la morbilidad se consideraron de muy baja confiabilidad, principalmente debido al número pequeño de participantes, un ensayo solamente, y la imprecisión.
Sesgos potenciales en el proceso de revisión
Se decidió realizar análisis de subgrupos no planificados relacionados con el financiamiento y el país, ya que hubo suficientes ensayos para dividirlos en grupos. No fue posible analizar la duración del seguimiento, la repercusión de los períodos de mantenimiento y el tipo de grupo control en los análisis de subgrupos ya que hubo muy pocos ensayos o demasiada heterogeneidad. Los metanálisis del IMC y el peso incluyeron ensayos que difirieron en la duración del seguimiento, las intervenciones conductuales y la dosis del fármaco. Sin embargo, cuando se realizaron análisis de sensibilidad los cambios en las estimaciones puntuales fueron pequeños.
La estrategia de búsqueda no se limitó a ninguna fecha, por lo que se revisaron ensayos realizados desde los años sesenta. Sin embargo, no se realizaron búsquedas en la literatura gris. Se mantuvo cierta correspondencia con la mayoría de los autores de los ensayos y algunos proporcionaron información adicional que incluyó los datos brutos de los IMC. Solamente siete ensayos proporcionaron los identificadores del ensayo clínico o los protocolos disponibles, por lo que fue difícil evaluar si hubo sesgo de informe. Sin embargo, a partir de los ensayos donde el registro del protocolo / ensayo clínico estuvo disponible, hubo pruebas pequeñas que indicaron una fuente de sesgo de informe. Se excluyó un gran número de ensayos debido a períodos de seguimiento menores de seis meses, especialmente en los ensayos más antiguos, lo que puede haber repercutido en los resultados generales de esta revisión. Además, hubo dificultades para calcular el número de eventos adversos en cada ensayo debido a que las medidas de informe fueron diferentes; por ejemplo, algunos ensayos informaron el número total de eventos adversos en cada grupo, mientras que otros informaron el número total de participantes que presentaron al menos un evento adverso. A pesar de los intentos por establecer contacto con los autores para obtener información adicional no fue posible realizar el metanálisis de la mayoría de estos resultados.
Acuerdos y desacuerdos con otros estudios o revisiones
Desde la revisión anterior (Oude Luttikhuis 2009) se identificó un ensayo nuevo de orlistat; sin embargo, la reducción en el IMC fue similar a lo encontrado previamente. La reducción en el IMC en los ensayos de sibutramina encontrados en esta revisión fue más pequeña que el cambio informado en la revisión anterior; sin embargo, estos datos todavía favorecen la intervención. Es probable que esta diferencia se deba a la inclusión de tres ensayos adicionales de sibutramina en el metanálisis. La revisión anterior no incluyó un metanálisis de los ensayos de metformina.
Otra revisión y metanálisis del efecto del orlistat y la sibutramina sobre la pérdida de peso en adolescentes obtuvo una diferencia en el IMC de ‐2,3 kg/m2 para la sibutramina (IC del 95%: ‐2,9 a ‐1,8; cinco ensayos; 770 participantes) y ‐1,7 kg/m2 para el orlistat (IC del 95%: ‐3,5 a 0,2; tres ensayos; 621 participantes) (Czernichow 2010). Estas reducciones en las estimaciones puntuales son mayores que las obtenidas en la presente revisión. Sin embargo, la estimación puntual del orlistat en la revisión Czernichow 2010 incluye el ensayo Ozkan 2004 con una gran reducción en el peso y el IMC que se excluyó del metanálisis de la presente revisión por no contar con un período de seguimiento común entre los participantes. Además, el análisis de la sibutramina incluyó los datos de un análisis secundario de participantes blancos y afroestadounidenses de Berkowitz 2003, lo que puede explicar por qué la estimación puntual fue diferente. En una revisión anterior hubo una DM de ‐0,7 kg/m2 (IC del 95%: ‐1,2 a ‐0,3) en los participantes del grupo de orlistat en comparación con placebo, que es consistente con los resultados de esta revisión (McGovern 2008). Hubo una reducción de ‐2,4 kg/m2 (IC del 95%: ‐3,1 a ‐1,8) en los ensayos de sibutramina, que es mayor que la reducción encontrada en la presente revisión (McGovern 2008). También se encontraron resultados similares en otro metanálisis dónde la DM de la reducción para la sibutramina fue ‐2,2 kg/m2 (IC del 95%: ‐2,8 a ‐1,6; cuatro ensayos; 686 participantes) y la DM de la reducción para el orlistat fue ‐0,8 (IC del 95%: ‐1,2 a ‐0,5; dos ensayos; 573 participantes) (Viner 2010).
En los ensayos de metformina, McDonagh 2014 determinó un tamaño del efecto de una DM de ‐1,2 kg/m2 (IC del 95%: ‐1,6 a ‐0,7; 13 ensayos), que es similar a la estimación puntual encontrada en esta revisión. Además, Bouza 2012 encontró una DM para la reducción de ‐1,2 kg/m2 (IC del 95%: ‐1,8 a ‐0,5; siete ensayos) a favor de la metformina. Una revisión anterior encontró una reducción de ‐1,4 kg/m2 (IC del 95%: ‐2 a ‐0,8; cinco ensayos; 320 participantes) en los ensayos de metformina (Park 2009); sin embargo, la revisión sólo incluyó cinco ensayos y en esta revisión se excluyó uno de los ensayos (Love‐Osborne 2008).
Los resultados generales de los metanálisis de los ensayos de metformina, sibutramina y orlistat son similares a los presentados en esta revisión, y las razones de alguna diferencia es probable que se deriven de los diferentes criterios de inclusión y de la inclusión en esta revisión de ensayos más recientes.

Risk of bias graph: review authors' judgements about each risk of bias item presented as percentages across all included trials.
Risk of bias summary: review authors' judgements about each risk of bias item for each included trial.
Funnel plot of comparison: 1 Body mass index (BMI): pharmacological interventions versus comparators, outcome: 1.1 Change in BMI (all trials) (kg/m2).
Funnel plot of comparison: 2 Weight: pharmacological interventions versus comparators, outcome: 2.1 Change in weight (all trials) (kg).

Comparison 1 Body mass index (BMI): pharmacological interventions versus comparators, Outcome 1 Change in BMI (all trials).

Comparison 1 Body mass index (BMI): pharmacological interventions versus comparators, Outcome 2 Change in BMI (drug type).

Comparison 1 Body mass index (BMI): pharmacological interventions versus comparators, Outcome 3 Change in BMI (dropout rate).
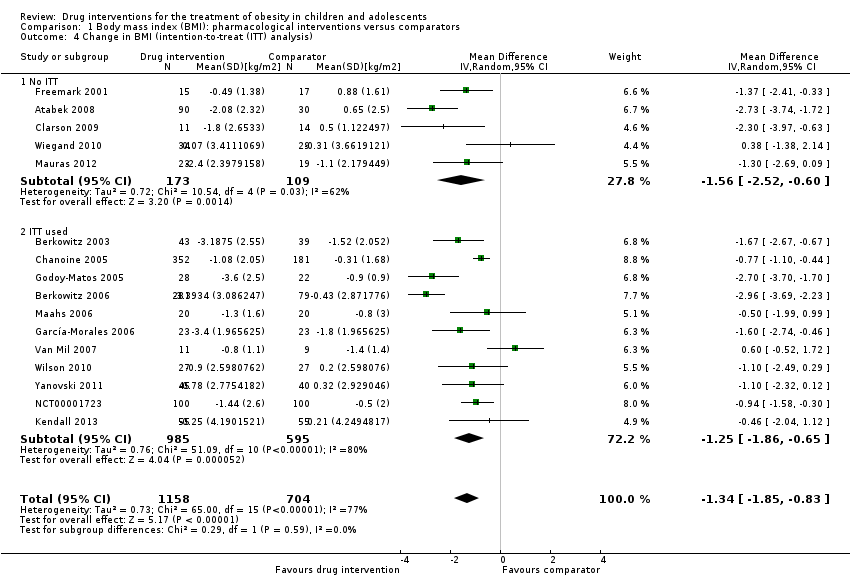
Comparison 1 Body mass index (BMI): pharmacological interventions versus comparators, Outcome 4 Change in BMI (intention‐to‐treat (ITT) analysis).
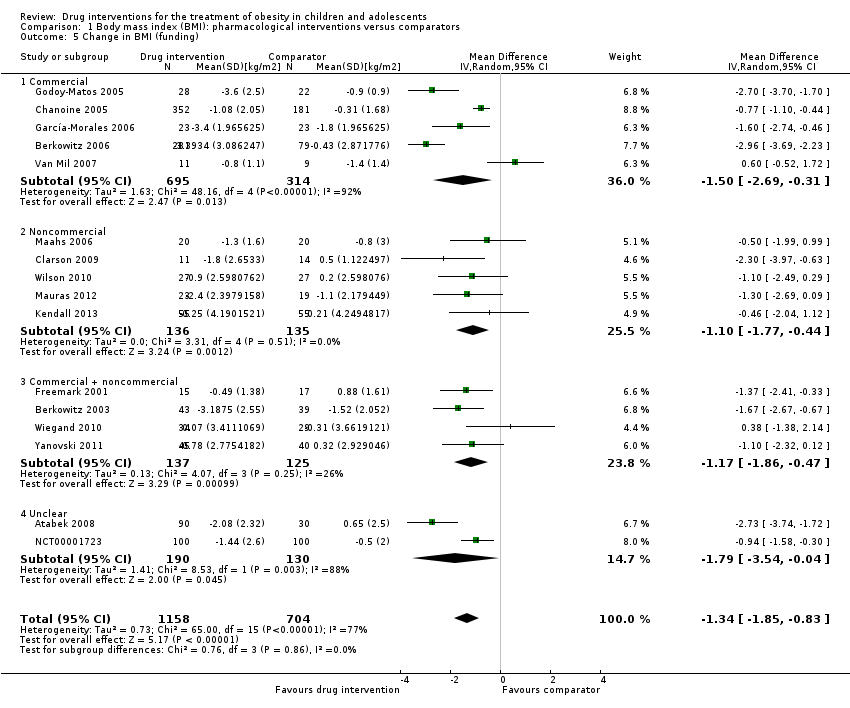
Comparison 1 Body mass index (BMI): pharmacological interventions versus comparators, Outcome 5 Change in BMI (funding).

Comparison 1 Body mass index (BMI): pharmacological interventions versus comparators, Outcome 6 Change in BMI (publication date).

Comparison 1 Body mass index (BMI): pharmacological interventions versus comparators, Outcome 7 Change in BMI (quality of trial).

Comparison 1 Body mass index (BMI): pharmacological interventions versus comparators, Outcome 8 Change in BMI (country).

Comparison 1 Body mass index (BMI): pharmacological interventions versus comparators, Outcome 9 Change in BMI (mean age).

Comparison 2 Weight: pharmacological interventions versus comparators, Outcome 1 Change in weight (all trials).
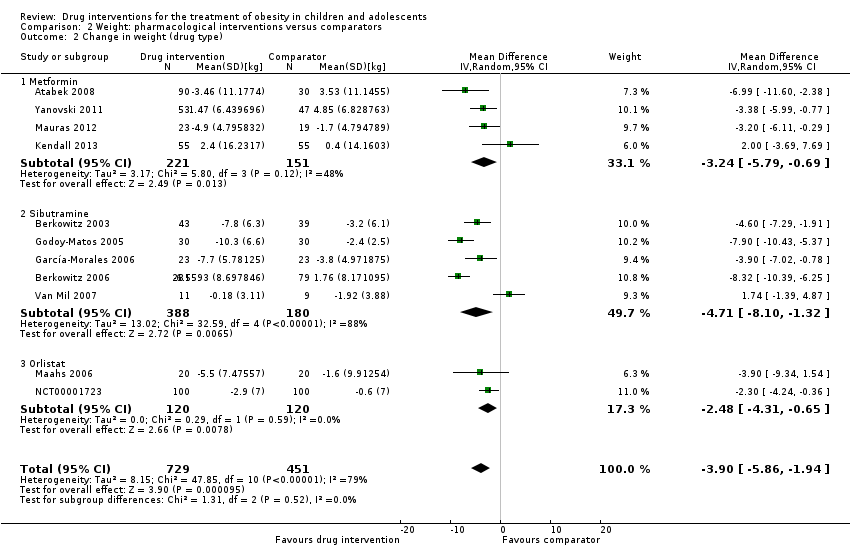
Comparison 2 Weight: pharmacological interventions versus comparators, Outcome 2 Change in weight (drug type).

Comparison 3 Adverse effects: pharmacological interventions versus comparator, Outcome 1 Serious adverse events.
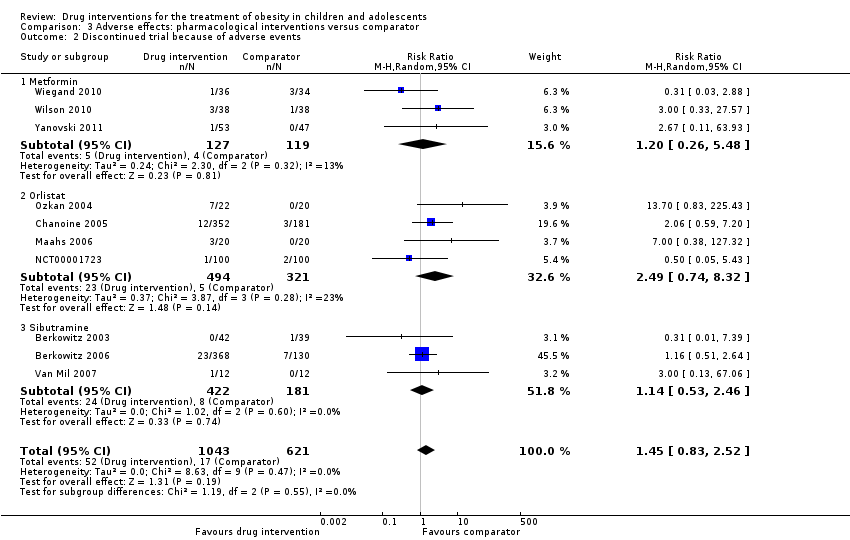
Comparison 3 Adverse effects: pharmacological interventions versus comparator, Outcome 2 Discontinued trial because of adverse events.
| Drug interventions for the treatment of obesity in children and adolescents | ||||||
| Population: obese children and adolescents Settings: mainly outpatient settings Intervention: metformin, orlistat, sibutramine usually combined with behaviour changing interventions Comparison: placebo or no placebo usually with behaviour changing interventions | ||||||
| Outcomes | Illustrative comparative risks* (95% CI) | Relative effect | No of participants | Quality of the evidence | Comments | |
| Assumed risk | Corresponding risk | |||||
| Comparator | Pharmacological intervention | |||||
| a. BMI (kg/m2) b. Body weight (kg) Follow‐up: 6 months (10 trials) ‐ 12 months (1 trial) | a. The mean reduction in BMI ranged across control groups from ‐1.8 to +0.9 b. The mean reduction in weight ranged across control groups from ‐3.8 kg to +4.9 kg | a. The mean reduction in BMI in the intervention groups was ‐1.3 higher (‐1.9 to ‐0.8 higher) b. The mean reduction in weight in the intervention groups was ‐3.9 kg higher (‐5.9 kg to ‐1.9 kg higher) | ‐ | a. 1884 (16) b. 1180 (11) | a. ⊕⊕⊝⊝ b. ⊕⊕⊝⊝ | ‐ |
| Adverse events a. Serious adverse events b. Discontinuation of trial because of adverse events Follow‐up: mostly 6 months, maximum 100 weeks (1 trial) | a. 17 per 1000 b. 27 per 1000 | a. 24 per 1000 (11 to 55) b. 40 per 1000 (23 to 69) | a.RR 1.43 (0.63 to 3.25) b.RR 1.45 (0.83 to 2.52) | a. 1347 (5) b. 1664 (10) | a. ⊕⊕⊕⊝ L owb b. ⊕⊕⊕⊝ Lowb | All trials reported if adverse events occurred; however, only 7/20 trials reported the number of participants who experienced at least 1 adverse event |
| Health‐related quality of life 3 questionnaires (1 trial) and SF‐36 (1 trial) Follow‐up: 6 months | See comment | See comment | See comment | 86 (2) | ⊕⊝⊝⊝ V ery lowc | Results were only reported for SF‐36 (1 trial on sibutramine, 46 children), there were no marked differences between intervention and comparator groups |
| All‐cause mortality Follow‐up: mostly 6 months, maximum 100 weeks (1 trial) | See comment | See comment | See comment | 2176 (20) | ⊕⊕⊕⊝ L owd | 1 suicide in the orlistat intervention group |
| Morbidity | See comment | See comment | See comment | 533 (1) | ⊕⊝⊝⊝ V ery lowe | Only 1 trial investigated morbidity defined as illness or harm associated with the intervention (Chanoine 2005). In the orlistat group 6/352 (1.7%) participants developed new gallstones compared with 1/181 (0.6%) in the placebo group |
| Socioeconomic effects | See comment | See comment | See comment | See comment | See comment | Not reported |
| *The basis for the assumed risk (e.g. the median control group risk across trials) is provided in footnotes. The corresponding risk (and its 95% confidence interval) is based on the assumed risk in the comparison group and the relative effect of the intervention (and its 95% CI). | ||||||
| GRADE Working Group grades of evidence | ||||||
| *Assumed risk was derived from the event rates in the comparator groups. aDowngraded by two levels because of potential other risk of bias, inconsistency and imprecision (see Appendix 13). | ||||||
| Trial | Intervention(s) and comparator(s) | Description of power and sample size calculation | Screened/eligible | Randomised | Safety | ITT | Finishing trial | Randomised finishing trial | Follow‐up timea |
| Atabek 2008b | I: metformin + diet and physical activity advice | ‐ | ‐ | 90 | 90 | ‐ | 90 | 100 | 6 months |
| C: placebo + diet and physical activity advice | 30 | 30 | ‐ | 30 | 100 | ||||
| total: | 120 | 120 | ‐ | 120 | 100 | ||||
| Berkowitz 2003 | I: behavioural programme + sibutramine | Powered to detect a 4% difference in % change in BMI between the 2 treatment groups with an SD of 5% (α = 0.05, β = 93%)c | 146 | 43 | 43 | 43 | 40 | 93.0 | 6 months (not including the 6‐month open‐label period where all participants received sibutramine) |
| C: behavioural programme + placebo | 39 | 39 | 39 | 34 | 87.2 | ||||
| total: | 82 | 82 | 82 | 62 | 75.6 | ||||
| Berkowitz 2006 | I: behavioural programme + sibutramine | "Planned sample size was approximately 400 participants with a 3:1 randomization ratio of sibutramine to placebo. On the basis of previous 12‐month adult trials, we determined that 300 participants in the sibutramine group would be adequate to assess safety and exposure, allowing an overall dropout rate of approximately 50% and a probability that approximately 50% of participants receiving 10 mg of sibutramine would lose 10% or more of initial BMI at 6 months" "Although the protocol did not document a formal sample size calculation for efficacy, approximately 132 adolescents (99 in the sibutramine group and 33 in the placebo group) would allow a between‐group difference in BMI of 2 kg/m2, with 90% power (2‐sided level of 0.05) to be statistically significant, assuming a common SD of 3 kg/m2)"d | ‐ | 368 | 368 | ‐ | 281 | 76.4 | 12 months |
| C: behavioural programme + placebo | 130 | 130 | ‐ | 80 | 61.5 | ||||
| total: | 498 | 498 | ‐ | 361 | 72.5 | ||||
| Chanoine 2005 | I: orlistat + diet + exercise + behaviour therapy | "We planned to enroll at least 450 individuals to provide more than 80% power to detect a difference of 1 BMI unit, assuming a 30% dropout rate" | 588 | 357 | 352 | 348 | 232 | 65.0 | 54 weeks |
| C: placebo + diet + exercise + behaviour therapy | 182 | 181 | 180 | 117 | 64.3 | ||||
| total: | 539 | 533 | 528 | 349 | 64.7 | ||||
| Clarson 2009 | I: metformin + lifestyle intervention | ‐ | 65 | 14 | ‐ | ‐ | 11 | 78.6 | 6 months |
| C: lifestyle intervention only | 17 | ‐ | ‐ | 14 | 82.4 | ||||
| total: | 31 | ‐ | ‐ | 25 | 80.6 | ||||
| Franco 2014 (cross‐over trial) | I: sibutramine + dietary guidance | ‐ | 73 | ‐ | ‐ | ‐ | ‐ | ‐ | 13 months |
| C: placebo + dietary guidance | ‐ | ‐ | ‐ | ‐ | ‐ | ||||
| total: | 63 | 63 | ‐ | 23 | 36.5 | ||||
| Freemark 2001 | I: metformin | ‐ | ‐ | 15 | ‐ | ‐ | 14 | 93.3 | 6 months |
| C: placebo | 17 | ‐ | ‐ | 15 | 88.2 | ||||
| total: | 32 | ‐ | ‐ | 29 | 90.6 | ||||
| Garcia‐Morales 2006 | I: sibutramine + diet + exercise | 13 participants per group (expectations: mean loss of 7.5 kg (SD 5.3) in the sibutramine group vs 3.6 kg (SD 4.5) in the placebo group)e | 70 | 26 | 26 | 23 | 21 | 80.8 | 6 months |
| C: placebo + diet + exercise | 25 | 25 | 23 | 19 | 76.0 | ||||
| total: | 51 | 51 | 46 | 40 | 78.4 | ||||
| Godoy‐Matos 2005 | I: sibutramine + hypocaloric diet + exercise | ‐ | ‐ | 30 | 30 | 30 | 28 | 93.3 | 24 weeks |
| C: placebo + hypocaloric diet + exercise | 30 | 30 | 30 | 22 | 73.3 | ||||
| total: | 60 | 60 | 60 | 50 | 83.3 | ||||
| Kendall 2013 | I: metformin + healthy lifestyle advice | "The target recruitment was 140 patients, based on a power calculation using the results of a previous study. A standard power calculation was used to detect a reduction in BMI of 0.15 kg/m2 (SD 0.3). Sixty‐four participants in each group give a statistical power of 80% for a t test at the 5% significance level. This was rounded up to allow for some loss to follow‐up but recognizing that adjustment using multifactorial analysis would likely enhance the trial power by an unpredictable amount"f | 234 | ‐ | 74 | 74 | 55 | ‐ | 6 months |
| C: placebo + healthy lifestyle advice | ‐ | 77 | 77 | 55 | ‐ | ||||
| total: | 155 | 151 | 151 | 110 | 71.0 | ||||
| Maahs 2006 | I: orlistat + diet and exercise therapy | "We determined that a clinically important mean difference in decrease in BMI between the orlistat and placebo groups would be 2.0 kg/m2 at 6 months and used an SD of 1.8. On the basis of this approach, a sample size of 15 subjects per group would be adequate to detect a 2.0 kg/m2 difference in Student’s t test with 80% power and alpha = 0.05. In order to allow for a 25% dropout rate, 20 subjects were randomized to each group"g | 43 | 20 | ‐ | 20 | 18 | 90.0 | 6 months |
| C: placebo + diet and exercise therapy | 20 | ‐ | 20 | 16 | 80.0 | ||||
| total: | 40 | ‐ | 40 | 34 | 85.0 | ||||
| Mauras 2012 | I: metformin + diet/exercise intervention | "Differences in hsCRP and fibrinogen concentrations at 6 months were the primary outcomes. An n = 42 completed subjects provided > 90 % power to detect significant changes" | ‐ | 35 | 35 | ‐ | 23 | 65.7 | 6 months |
| C: diet/exercise intervention | 31 | 31 | ‐ | 19 | 61.3 | ||||
| total: | 66 | 66 | ‐ | 42 | 63.6 | ||||
| NCT00001723 | I: orlistat + behavioural weight loss programme | ‐ | ‐ | 100 | 100 | 100 | 87 | 87.0 | 6 months |
| C: placebo + behavioural weight loss programme | 100 | 100 | 100 | 84 | 84.0 | ||||
| 200 | 100 | 100 | 171 | 85.5 | |||||
| Ozkan 2004 | I: conventional treatment (nutritional and lifestyle modification programmes) + orlistat | ‐ | ‐ | 22 | ‐ | ‐ | 15 | 68.2 | 5 to 15 months |
| C: conventional treatment: nutritional and lifestyle modification programmes | 20 | ‐ | ‐ | 15 | 75.0 | ||||
| total: | 42 | ‐ | ‐ | 30 | 71.4 | ||||
| Prado 2012 | I: metformin + nutritional guide and exercise programme | 8 participants were required per intervention group (SD 0.4; difference of 0.6, P < 0.05, power = 90%) | 41/26 | ‐ | 9 | ‐ | 7 | ‐ | 6 months |
| C: placebo + nutritional guide and exercise programme | ‐ | 10 | ‐ | 6 | ‐ | ||||
| total: | 26 | 19 | ‐ | 13 | 50 | ||||
| Rezvanian 2010 | I1: metformin + diet and physical activity advice | "By considering alpha = 0.05 and a power level of 0.8, the sample size was calculated as 160, and by considering the attrition during the follow‐up, we increased it to 180" | 180 | 45 | ‐ | ‐ | 41 | 91.1 | 24 weeks |
| I2: fluoxetine + diet and physical activity advice | 45 | ‐ | ‐ | 40 | 88.9 | ||||
| I3: metformin and fluoxetine + diet and physical activity advice | 45 | ‐ | ‐ | 41 | 91.1 | ||||
| C: placebo + diet and physical activity advice | 45 | ‐ | ‐ | 42 | 93.3 | ||||
| total: | 180 | ‐ | ‐ | 164 | 91.1 | ||||
| Srinivasan 2006 (cross‐over trial) | I: metformin + "standardised information on healthy eating and exercise" | ‐ | 34 | ‐ | ‐ | ‐ | ‐ | ‐ | 12 months |
| C: placebo + "standardised information on healthy eating and exercise" | ‐ | ‐ | ‐ | ‐ | ‐ | ||||
| total: | 28 | ‐ | ‐ | 22 | 78.6 | ||||
| Van Mil 2007 | I: sibutramine + energy‐restricted diet and exercise plan | "The number of patients required per treatment group to detect a difference between treatment groups in mean change in BMI at endpoint intervention of 1.0 kg/m2, based on an estimate of variance (sd) of 0.65, an overall significance level of 5%, and a power of 90%, was nine. Allowing a drop‐out rate of 25%, the number of patients needed in each group was 12"h | ‐ | 12 | 12 | 12 | 11 | 91.7 | 24 weeks |
| C: placebo + energy‐restricted diet and exercise plan | 12 | 12 | 12 | 9 | 75.0 | ||||
| total: | 24 | 24 | 24 | 20 | 83.3 | ||||
| Wiegand 2010 | I: metformin + lifestyle intervention | "Since a clinically significant effect was defined as a decrease in HOMA‐IR by ‐1, two groups of 37 patients had to be included in the study to achieve a power of 0.9 with a α value of 0.05" | 278 | 36 | ‐ | ‐ | 34 | 94.4 | 6 months |
| C: placebo + lifestyle intervention | 34 | ‐ | ‐ | 29 | 85.3 | ||||
| total: | 70 | ‐ | ‐ | 63 | 90 | ||||
| Wilson 2010 | I: metformin + lifestyle intervention | "Assuming an SD of 1.9 for BMI change, an enrolled sample of 72 provided 80% power to detect a differential of 1.46 between treatment arms or between sexes and 1.75 between white subjects and others"i | 92 | 39 | 39 | 39 | 19 | 48.7 | 100 weeks |
| C: placebo + lifestyle intervention | 38 | 38 | 38 | 19 | 50.0 | ||||
| total: | 77 | 76 | 76 | 38 | 49.4 | ||||
| Yanovski 2011 | I: metformin + dietitian‐administered weight‐reduction programme | "A total sample size of 60 participants would detect a between‐group difference of 0.09 BMI SD score units (approximately equivalent to a 2 kg/m2 difference) with 80% power. Participant accrual was set at 100 participants to allow as much as 40% loss to follow‐up"j | 278 | 53 | ‐ | 53 | 45 | 84.9 | 6 months (not including the 6‐month open‐label phase) |
| C: placebo + dietitian‐administered weight‐reduction programme | 47 | ‐ | 47 | 40 | 85.1 | ||||
| total: | 100 | ‐ | 100 | 85 | 85.0 | ||||
| Grand total | All interventionsk | 1395 | 1153 | ||||||
| All comparatorsk | 817 | 665 | |||||||
| All interventions and comparatorsk | 2484 | 1851 | |||||||
| aDuration of intervention and follow‐up under randomised conditions until end of trial. "‐" denotes not reported. BMI: body mass index; C: comparator; hsCRP: high sensitivity C‐reactive protein; HOMA‐IR: homeostasis model assessment for insulin resistance index; I: intervention; ITT: intention‐to‐treat; n: number of participants; SD: standard deviation. | |||||||||
| Trials with data on mean change only | |
| Number of trials | 14 |
| Point estimate (95% CI) (kg/m2) | ‐ 1.5 (‐2.0 to ‐0.9) favouring drug intervention |
| Trials with concealment of allocation | |
| Number of trials | 12 |
| Point estimate (95% CI) (kg/m2) | ‐1.3 (‐1.8 to ‐0.7) favouring drug interventions |
| Trials with blinding of participants/personnel | |
| Number of trials | 10 |
| Point estimate (95% CI) (kg/m2) | ‐1.3 (‐1.9 to ‐0.7) favouring drug interventions |
| Trials with blinding of outcome assessors | |
| Number of trials | 10 |
| Point estimate (95% CI) (kg/m2) | ‐1.3 (‐1.9 to ‐0.7) favouring drug interventions |
| Trials without large sample size trials | |
| Number of trials | 14 |
| Point estimate (95% CI) (kg/m2) | ‐1.3 (‐1.8 to ‐0.7) favouring drug interventions |
| Trials with trials with 6 months' follow‐up only | |
| Number of trials | 14 |
| Point estimate (95% CI) (kg/m2) | ‐1.2 (‐1.7 to ‐0.7) favouring drug interventions |
| Trials without trials with higher drug dose | |
| Number of trials | 14 |
| Point estimate (95% CI) (kg/m2) | ‐1.2 (‐1.7 to ‐0.7) favouring drug interventions |
| Trials with trials with a high dose/active lifestyle intervention | |
| Number of trials | 10 |
| Point estimate (95% CI) (kg/m2) | ‐1.3 (‐1.9 to ‐0.7) favouring drug interventions |
| Trials without trials with high attrition | |
| Number of trials | 13 |
| Point estimate (95% CI) (kg/m2) | ‐1.4 (‐2.0 to ‐0.8) favouring drug interventions |
| BMI: body mass index; CI: confidence interval. | |
| Trials with data on mean change only | |
| Number of trials | 8 |
| Point estimate (95% CI) (kg) | ‐ 4.1 (‐6.3 to ‐1.8) favouring drug intervention |
| Trials with concealment of allocation | |
| Number of trials | 9 |
| Point estimate (95% CI) (kg) | ‐3.5 (‐5.8 to ‐1.2) favouring drug interventions |
| Trials with blinding of participants/personnel | |
| Number of trials | 7 |
| Point estimate (95% CI) (kg) | ‐4.2 (‐6.8 to ‐1.5) favouring drug interventions |
| Trials with blinding of outcome assessors | |
| Number of trials | 7 |
| Point estimate (95% CI) (kg) | ‐4.2 (‐6.8 to ‐1.5) favouring drug interventions |
| Trials without large sample size trials | |
| Number of trials | 10 |
| Point estimate (95% CI) (kg) | ‐3.4 (‐5.2 to ‐1.6) favouring drug interventions |
| Trials with 6 months' follow‐up only | |
| Number of trials | 9 |
| Point estimate (95% CI) (kg) | ‐3.5 (‐5.6 to ‐1.4) favouring drug interventions |
| Trials without trials with higher drug dose | |
| Number of trials | 10 |
| Point estimate (95% CI) (kg) | ‐3.4 (‐5.2 to ‐1.6) favouring drug interventions |
| Trials with trials with a high dose/active lifestyle intervention | |
| Number of trials | 6 |
| Point estimate (95% CI) (kg) | ‐4.3 (‐6.5 to ‐2.2) favouring drug interventions |
| Trials without trials with high attrition | |
| Number of trials | 9 |
| Point estimate (95% CI) (kg) | ‐4.4 (‐6.6 to ‐2.2) favouring drug interventions |
| CI: confidence interval. | |
| Outcome or subgroup title | No. of studies | No. of participants | Statistical method | Effect size |
| 1 Change in BMI (all trials) Show forest plot | 16 | 1884 | Mean Difference (IV, Random, 95% CI) | ‐1.34 [‐1.85, ‐0.83] |
| 2 Change in BMI (drug type) Show forest plot | 16 | 1884 | Mean Difference (IV, Random, 95% CI) | ‐1.34 [‐1.85, ‐0.83] |
| 2.1 Metformin | 8 | 543 | Mean Difference (IV, Random, 95% CI) | ‐1.35 [0.00, ‐0.69] |
| 2.2 Orlistat | 3 | 773 | Mean Difference (IV, Random, 95% CI) | ‐0.79 [‐1.08, ‐0.51] |
| 2.3 Sibutramine | 5 | 568 | Mean Difference (IV, Random, 95% CI) | ‐1.70 [‐2.89, ‐0.51] |
| 3 Change in BMI (dropout rate) Show forest plot | 16 | 1862 | Mean Difference (IV, Random, 95% CI) | ‐1.34 [‐1.85, ‐0.83] |
| 3.1 Dropouts < 20% | 9 | 597 | Mean Difference (IV, Random, 95% CI) | ‐1.11 [‐1.78, ‐0.44] |
| 3.2 Dropouts ≥ 20% | 6 | 1145 | Mean Difference (IV, Random, 95% CI) | ‐1.42 [‐2.34, ‐0.50] |
| 3.3 Unclear dropout rate | 1 | 120 | Mean Difference (IV, Random, 95% CI) | ‐2.73 [‐3.74, ‐1.72] |
| 4 Change in BMI (intention‐to‐treat (ITT) analysis) Show forest plot | 16 | 1862 | Mean Difference (IV, Random, 95% CI) | ‐1.34 [‐1.85, ‐0.83] |
| 4.1 No ITT | 5 | 282 | Mean Difference (IV, Random, 95% CI) | ‐1.56 [‐2.52, ‐0.60] |
| 4.2 ITT used | 11 | 1580 | Mean Difference (IV, Random, 95% CI) | ‐1.25 [‐1.86, ‐0.65] |
| 5 Change in BMI (funding) Show forest plot | 16 | 1862 | Mean Difference (IV, Random, 95% CI) | ‐1.34 [‐1.85, ‐0.83] |
| 5.1 Commercial | 5 | 1009 | Mean Difference (IV, Random, 95% CI) | ‐1.50 [‐2.69, ‐0.31] |
| 5.2 Noncommercial | 5 | 271 | Mean Difference (IV, Random, 95% CI) | ‐1.10 [‐1.77, ‐0.44] |
| 5.3 Commercial + noncommercial | 4 | 262 | Mean Difference (IV, Random, 95% CI) | ‐1.17 [‐1.86, ‐0.47] |
| 5.4 Unclear | 2 | 320 | Mean Difference (IV, Random, 95% CI) | ‐1.79 [‐3.54, ‐0.04] |
| 6 Change in BMI (publication date) Show forest plot | 16 | 1862 | Mean Difference (IV, Random, 95% CI) | ‐1.34 [‐1.85, ‐0.83] |
| 6.1 2007 or before | 8 | 1163 | Mean Difference (IV, Random, 95% CI) | ‐1.41 [‐2.21, ‐0.60] |
| 6.2 After 2007 | 8 | 699 | Mean Difference (IV, Random, 95% CI) | ‐1.26 [‐1.90, ‐0.62] |
| 7 Change in BMI (quality of trial) Show forest plot | 16 | 1862 | Mean Difference (IV, Random, 95% CI) | ‐1.34 [‐1.85, ‐0.83] |
| 7.1 Low | 6 | 322 | Mean Difference (IV, Random, 95% CI) | ‐1.40 [‐2.28, ‐0.52] |
| 7.2 Moderate | 10 | 1540 | Mean Difference (IV, Random, 95% CI) | ‐1.31 [‐1.95, ‐0.67] |
| 8 Change in BMI (country) Show forest plot | 16 | 1862 | Mean Difference (IV, Random, 95% CI) | ‐1.34 [‐1.85, ‐0.83] |
| 8.1 Middle income | 3 | 216 | Mean Difference (IV, Random, 95% CI) | ‐2.39 [‐3.08, ‐1.69] |
| 8.2 High income | 13 | 1646 | Mean Difference (IV, Random, 95% CI) | ‐1.09 [‐1.62, ‐0.56] |
| 9 Change in BMI (mean age) Show forest plot | 16 | 1884 | Mean Difference (IV, Random, 95% CI) | ‐1.34 [‐1.85, ‐0.83] |
| 9.1 Mean age < 12 years | 2 | 220 | Mean Difference (IV, Random, 95% CI) | ‐1.93 [‐3.53, ‐0.34] |
| 9.2 Mean age ≥ 12 years | 14 | 1664 | Mean Difference (IV, Random, 95% CI) | ‐1.25 [‐1.79, ‐0.71] |
| Outcome or subgroup title | No. of studies | No. of participants | Statistical method | Effect size |
| 1 Change in weight (all trials) Show forest plot | 11 | 1180 | Mean Difference (IV, Random, 95% CI) | ‐3.90 [‐5.86, ‐1.94] |
| 2 Change in weight (drug type) Show forest plot | 11 | 1180 | Mean Difference (IV, Random, 95% CI) | ‐3.90 [‐5.86, ‐1.94] |
| 2.1 Metformin | 4 | 372 | Mean Difference (IV, Random, 95% CI) | ‐3.24 [‐5.79, ‐0.69] |
| 2.2 Sibutramine | 5 | 568 | Mean Difference (IV, Random, 95% CI) | ‐4.71 [‐8.10, ‐1.32] |
| 2.3 Orlistat | 2 | 240 | Mean Difference (IV, Random, 95% CI) | ‐2.48 [‐4.31, ‐0.65] |
| Outcome or subgroup title | No. of studies | No. of participants | Statistical method | Effect size |
| 1 Serious adverse events Show forest plot | 5 | 1347 | Risk Ratio (M‐H, Random, 95% CI) | 1.43 [0.63, 3.25] |
| 1.1 Metformin | 1 | 76 | Risk Ratio (M‐H, Random, 95% CI) | 5.0 [0.25, 100.80] |
| 1.2 Orlistat | 3 | 773 | Risk Ratio (M‐H, Random, 95% CI) | 1.04 [0.41, 2.67] |
| 1.3 Sibutramine | 1 | 498 | Risk Ratio (M‐H, Random, 95% CI) | 3.53 [0.46, 27.33] |
| 2 Discontinued trial because of adverse events Show forest plot | 10 | 1664 | Risk Ratio (M‐H, Random, 95% CI) | 1.45 [0.83, 2.52] |
| 2.1 Metformin | 3 | 246 | Risk Ratio (M‐H, Random, 95% CI) | 1.20 [0.26, 5.48] |
| 2.2 Orlistat | 4 | 815 | Risk Ratio (M‐H, Random, 95% CI) | 2.49 [0.74, 8.32] |
| 2.3 Sibutramine | 3 | 603 | Risk Ratio (M‐H, Random, 95% CI) | 1.14 [0.53, 2.46] |