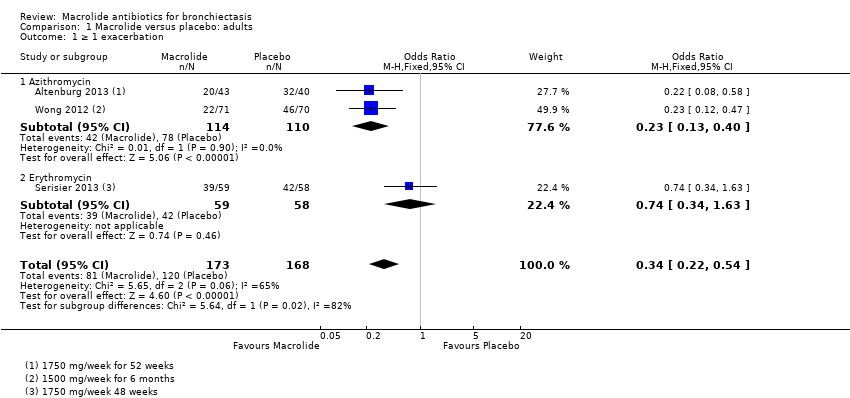
| 1 ≥ 1 exacerbation Show forest plot | 3 | 341 | Odds Ratio (M‐H, Fixed, 95% CI) | 0.34 [0.22, 0.54] |
|
| 1.1 Azithromycin | 2 | 224 | Odds Ratio (M‐H, Fixed, 95% CI) | 0.23 [0.13, 0.40] |
| 1.2 Erythromycin | 1 | 117 | Odds Ratio (M‐H, Fixed, 95% CI) | 0.74 [0.34, 1.63] |
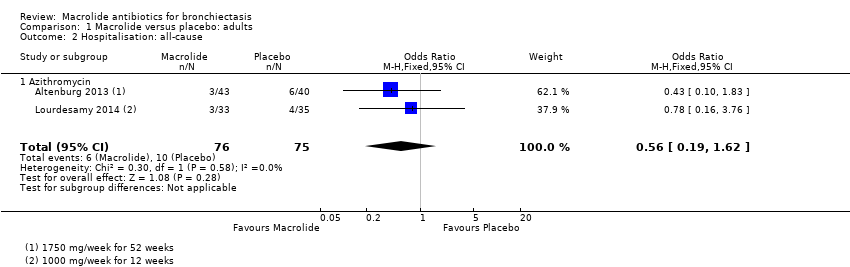
| 2 Hospitalisation: all‐cause Show forest plot | 2 | 151 | Odds Ratio (M‐H, Fixed, 95% CI) | 0.56 [0.19, 1.62] |
|
| 2.1 Azithromycin | 2 | 151 | Odds Ratio (M‐H, Fixed, 95% CI) | 0.56 [0.19, 1.62] |
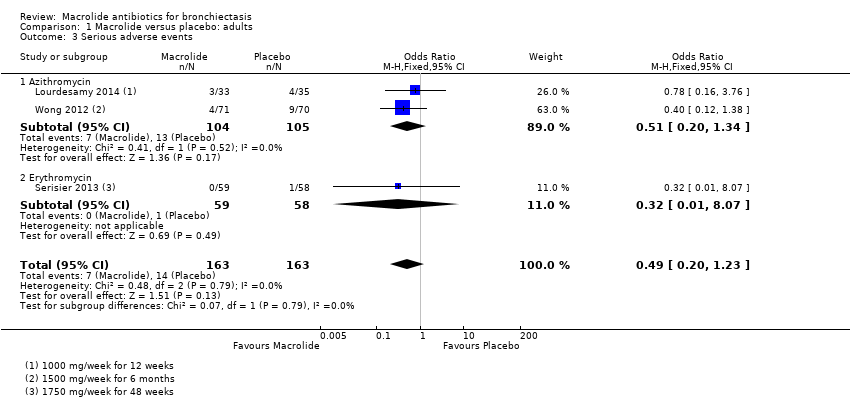
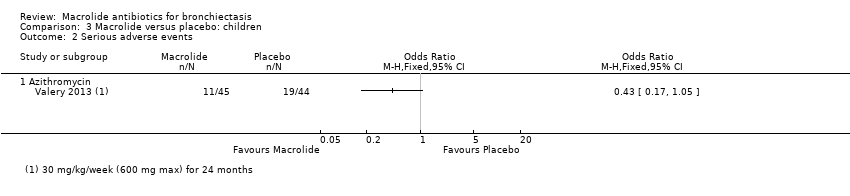
| 3 Serious adverse events Show forest plot | 3 | 326 | Odds Ratio (M‐H, Fixed, 95% CI) | 0.49 [0.20, 1.23] |
|
| 3.1 Azithromycin | 2 | 209 | Odds Ratio (M‐H, Fixed, 95% CI) | 0.51 [0.20, 1.34] |
| 3.2 Erythromycin | 1 | 117 | Odds Ratio (M‐H, Fixed, 95% CI) | 0.32 [0.01, 8.07] |
| 4 Sputum weight (g): endpoint Show forest plot | 1 | | Mean Difference (IV, Fixed, 95% CI) | Totals not selected |
|
| 4.1 Azithromycin | 1 | | Mean Difference (IV, Fixed, 95% CI) | 0.0 [0.0, 0.0] |
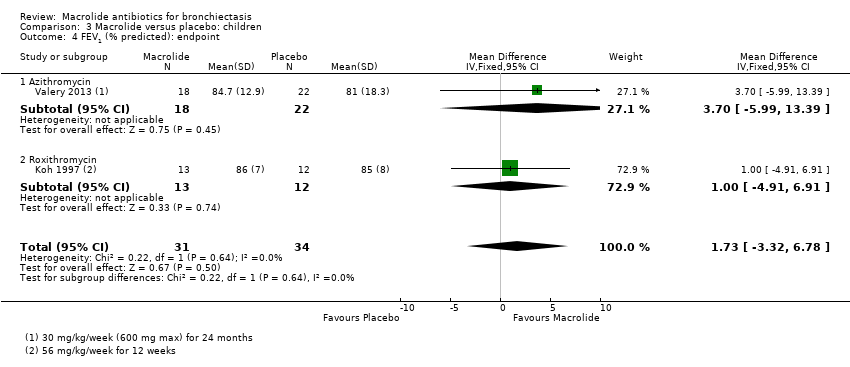
| 5 FEV1 (% predicted): endpoint Show forest plot | 1 | | Mean Difference (IV, Fixed, 95% CI) | Totals not selected |
|
| 5.1 Azithromycin | 1 | | Mean Difference (IV, Fixed, 95% CI) | 0.0 [0.0, 0.0] |
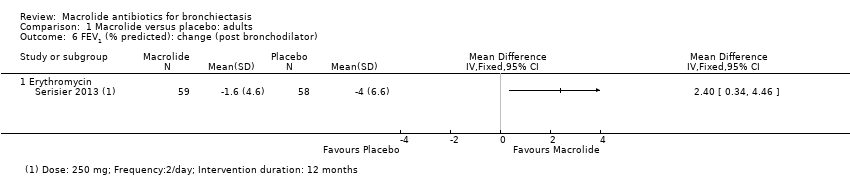
| 6 FEV1 (% predicted): change (post bronchodilator) Show forest plot | 1 | | Mean Difference (IV, Fixed, 95% CI) | Totals not selected |
|
| 6.1 Erythromycin | 1 | | Mean Difference (IV, Fixed, 95% CI) | 0.0 [0.0, 0.0] |
| 7 FEV1 (L): endpoint Show forest plot | 2 | 94 | Mean Difference (IV, Fixed, 95% CI) | 0.02 [‐0.17, 0.22] |
|
| 7.1 Azithromycin | 1 | 68 | Mean Difference (IV, Fixed, 95% CI) | ‐0.01 [‐0.23, 0.21] |
| 7.2 Roxithromycin | 1 | 26 | Mean Difference (IV, Fixed, 95% CI) | 0.15 [‐0.27, 0.57] |
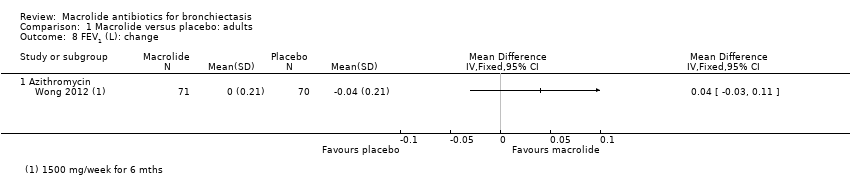
| 8 FEV1 (L): change Show forest plot | 1 | | Mean Difference (IV, Fixed, 95% CI) | Totals not selected |
|
| 8.1 Azithromycin | 1 | | Mean Difference (IV, Fixed, 95% CI) | 0.0 [0.0, 0.0] |
| 9 FVC (% predicted): endpoint Show forest plot | 1 | | Mean Difference (IV, Fixed, 95% CI) | Totals not selected |
|
| 9.1 Azithromycin | 1 | | Mean Difference (IV, Fixed, 95% CI) | 0.0 [0.0, 0.0] |
| 10 FVC (L): endpoint Show forest plot | 2 | 94 | Mean Difference (IV, Fixed, 95% CI) | 0.08 [‐0.19, 0.36] |
|
| 10.1 Azithromycin | 1 | 68 | Mean Difference (IV, Fixed, 95% CI) | ‐0.02 [‐0.34, 0.30] |
| 10.2 Roxithromycin | 1 | 26 | Mean Difference (IV, Fixed, 95% CI) | 0.38 [‐0.16, 0.92] |
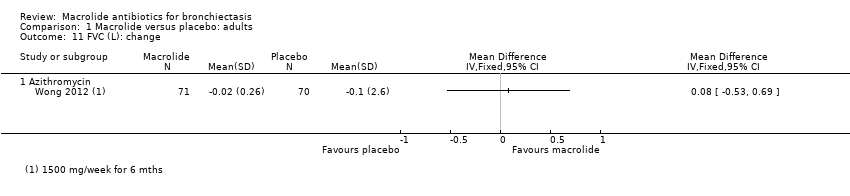
| 11 FVC (L): change Show forest plot | 1 | | Mean Difference (IV, Fixed, 95% CI) | Totals not selected |
|
| 11.1 Azithromycin | 1 | | Mean Difference (IV, Fixed, 95% CI) | 0.0 [0.0, 0.0] |
| 12 FEV1/FVC: endpoint Show forest plot | 1 | | Mean Difference (IV, Fixed, 95% CI) | Totals not selected |
|
| 12.1 Azithromycin | 1 | | Mean Difference (IV, Fixed, 95% CI) | 0.0 [0.0, 0.0] |
| 13 Adverse events Show forest plot | 5 | 435 | Odds Ratio (M‐H, Fixed, 95% CI) | 0.83 [0.51, 1.35] |
|
| 13.1 Azithromycin | 3 | 292 | Odds Ratio (M‐H, Fixed, 95% CI) | 0.77 [0.41, 1.45] |
| 13.2 Erythromycin | 1 | 117 | Odds Ratio (M‐H, Fixed, 95% CI) | 1.16 [0.51, 2.62] |
| 13.3 Roxithromycin | 1 | 26 | Odds Ratio (M‐H, Fixed, 95% CI) | 0.13 [0.01, 2.83] |
| 14 Azithromycin‐resistant bacteria (any) Show forest plot | 1 | | Odds Ratio (M‐H, Fixed, 95% CI) | Totals not selected |
|
| 14.1 Azithromycin | 1 | | Odds Ratio (M‐H, Fixed, 95% CI) | 0.0 [0.0, 0.0] |
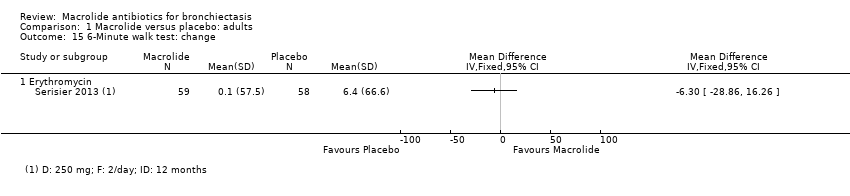
| 15 6‐Minute walk test: change Show forest plot | 1 | | Mean Difference (IV, Fixed, 95% CI) | Totals not selected |
|
| 15.1 Erythromycin | 1 | | Mean Difference (IV, Fixed, 95% CI) | 0.0 [0.0, 0.0] |
| 16 Quality of life: endpoint Show forest plot | 1 | 68 | Mean Difference (IV, Fixed, 95% CI) | ‐8.90 [‐13.13, ‐4.67] |
|
| 16.1 Azithromycin | 1 | 68 | Mean Difference (IV, Fixed, 95% CI) | ‐8.90 [‐13.13, ‐4.67] |
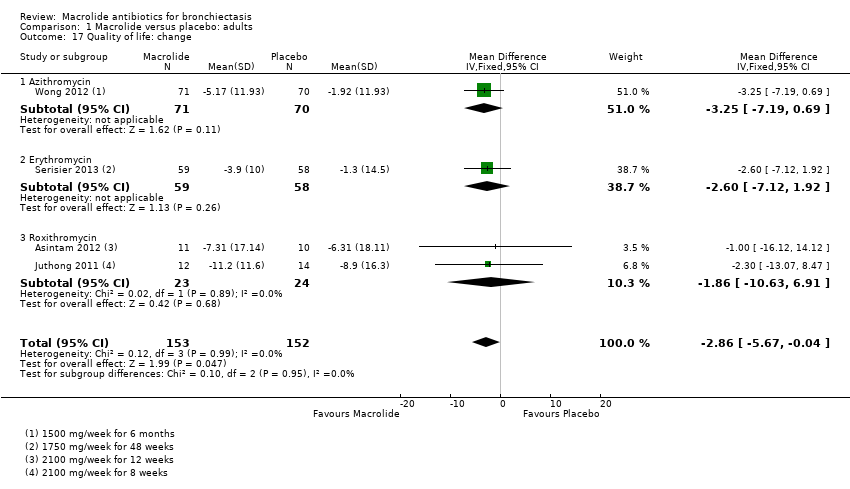
| 17 Quality of life: change Show forest plot | 4 | 305 | Mean Difference (IV, Fixed, 95% CI) | ‐2.86 [‐5.67, ‐0.04] |
|
| 17.1 Azithromycin | 1 | 141 | Mean Difference (IV, Fixed, 95% CI) | ‐3.25 [‐7.19, 0.69] |
| 17.2 Erythromycin | 1 | 117 | Mean Difference (IV, Fixed, 95% CI) | ‐2.60 [‐7.12, 1.92] |
| 17.3 Roxithromycin | 2 | 47 | Mean Difference (IV, Fixed, 95% CI) | ‐1.86 [‐10.63, 6.91] |