Antibióticos macrólidos para la bronquiectasia
Información
- DOI:
- https://doi.org/10.1002/14651858.CD012406.pub2Copiar DOI

- Base de datos:
-
- Cochrane Database of Systematic Reviews
- Versión publicada:
-
- 15 marzo 2018see what's new
- Tipo:
-
- Intervention
- Etapa:
-
- Review
- Grupo Editorial Cochrane:
-
Grupo Cochrane de Vías respiratorias
- Copyright:
-
- Copyright © 2018 The Cochrane Collaboration. Published by John Wiley & Sons, Ltd.
Cifras del artículo
Altmetric:
Citado por:
Autores
Contributions of authors
All review authors contributed to preparation of the Background section.
Lambert Felix, Nicola Relph, Stephen J Milan, and Sally Spencer contributed to the methods, results, discussion, and conclusions of the review.
David Evans, Carol Kelly, and Lambert Felix contributed to screening searches and identifying the included studies
James Chalmers, Iain Crossingham, and Carol Kelly contributed to the methods, discussion, and conclusions sections.
Sources of support
Internal sources
-
Edge Hill University, UK.
Funded Lambert Felix to provide support for a series of reviews on bronchiectasis. Carol Kelly and Sally Spencer were co‐applicants on the internal funding bid.
External sources
-
No sources of support supplied
Declarations of interest
Sally Spencer, Carol Kelly, and Nicola Relph were named co‐investigators on a study funded by Edge Hill University to develop a series of reviews on bronchiectasis. Lambert Felix was supported by that funding. No funding was received by any other review authors for participation in this systematic review.
David Evans provides freelance writing services to medical communication agencies.
Steve Milan: none known.
Iain Crossingham received travel and training expenses from Hamilton Medical that are not connected to the topic of this review.
James D Chalmers declares grant support from Pfizer, AstraZeneca, and GlaxoSmithKline. In addition, he is part of an innovative medicines initiative consortium that includes Novartis and Basilea. He has participated in advisory boards for Bayer HealthCare, Chiesi, and Raptor Pharmaceuticals. He has received fees for speaking from Napp, AstraZeneca, BI, and Pfizer. None of these conflicts of interest are related to the work involved in this review, and these conflicts are unrelated to the topic of this review.
Acknowledgements
We would like to thank Edge Hill University for support provided for this review. We would also like to thank Cochrane Airways for its support. We would like to thank the following translators: Chunli Lu, Wangyu Cai, and Hiraku Tsujimoto, for their invaluable contributions to extraction of data from studies not published in English.
The Background and Methods sections of this protocol are based on a standard template used by Cochrane Airways.
This project was supported by the National Institute for Health Research (NIHR) via Cochrane Infrastructure funding to Cochrane Airways. The views and opinions expressed therein are those of the review authors and do not necessarily reflect those of the Systematic Reviews Programme, NIHR, NHS, or the Department of Health.
Version history
| Published | Title | Stage | Authors | Version |
| 2018 Mar 15 | Macrolide antibiotics for bronchiectasis | Review | Carol Kelly, James D Chalmers, Iain Crossingham, Nicola Relph, Lambert M Felix, David J Evans, Stephen J Milan, Sally Spencer | |
| 2016 Oct 21 | Macrolide antibiotics for non‐cystic fibrosis bronchiectasis | Protocol | Carol Kelly, David J Evans, James D Chalmers, Iain Crossingham, Sally Spencer, Nicola Relph, Lambert M Felix, Stephen J Milan | |
Differences between protocol and review
We decided to present the results for adults and for children as separate comparisons. We also decided to present the results for different macrolides separately.
Regarding systemic markers of infection, during the course of the review, we decided to focus specifically on C‐reactive protein for the secondary outcome on systemic markers of infection, as it is the most widely used biomarker of systemic inflammation in clinical practice.
Keywords
MeSH
Medical Subject Headings (MeSH) Keywords
- Anti‐Bacterial Agents [adverse effects, *therapeutic use];
- Azithromycin [adverse effects, therapeutic use];
- Bronchiectasis [*drug therapy];
- Clarithromycin [adverse effects, therapeutic use];
- Erythromycin [administration & dosage, therapeutic use];
- Macrolides [adverse effects, *therapeutic use];
- Randomized Controlled Trials as Topic;
- Roxithromycin [adverse effects, therapeutic use];
Medical Subject Headings Check Words
Adult; Child, Preschool; Humans;
PICO

Study flow diagram.
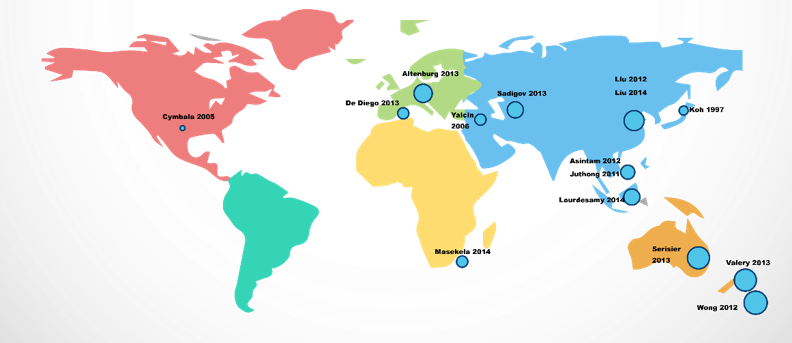
Global distribution of studies.
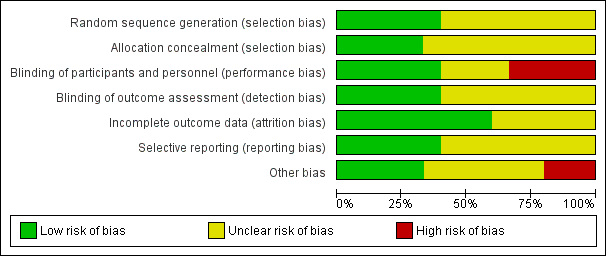
Risk of bias graph: review authors' judgements about each risk of bias item presented as percentages across all included studies.
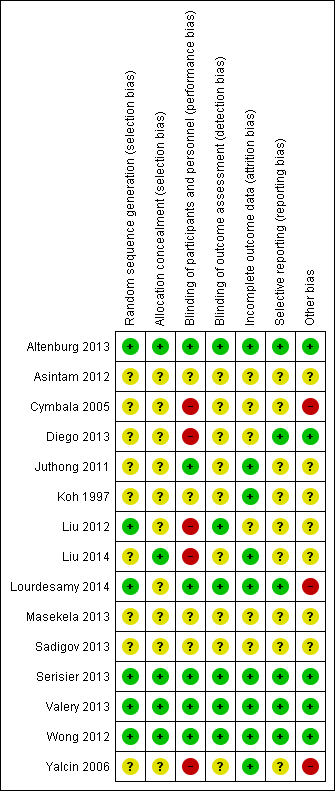
Risk of bias summary: review authors' judgements about each risk of bias item for each included study.

Analysis 1.1. Cates plot showing the absolute reduction in numbers of participants experiencing one or more exacerbations in adults treated with macrolides compared with placebo (OR 0.34, 95% CI 0.22 to 0.54). 714 people per 1000 in the placebo group experienced one or more exacerbations compared with 459 (95% CI 355 to 574) per 1000 in the macrolide group.
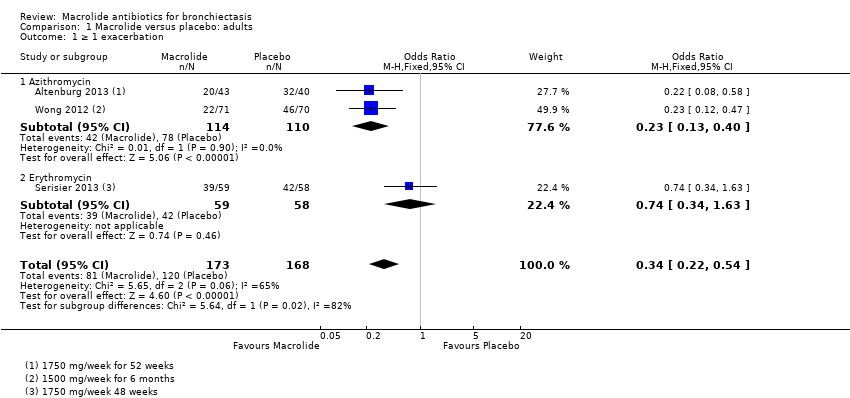
Comparison 1 Macrolide versus placebo: adults, Outcome 1 ≥ 1 exacerbation.
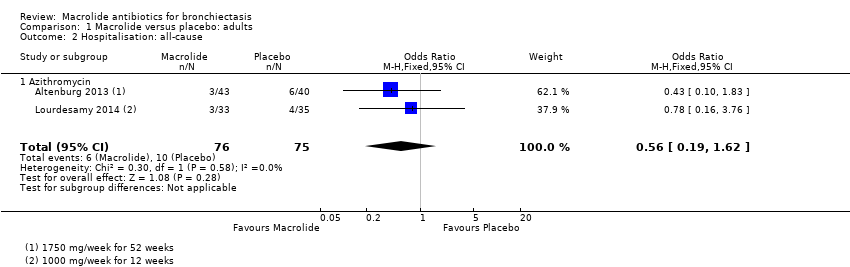
Comparison 1 Macrolide versus placebo: adults, Outcome 2 Hospitalisation: all‐cause.
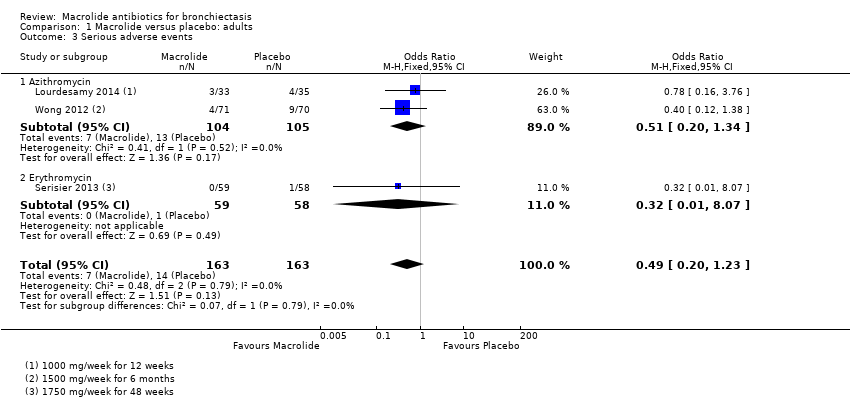
Comparison 1 Macrolide versus placebo: adults, Outcome 3 Serious adverse events.

Comparison 1 Macrolide versus placebo: adults, Outcome 4 Sputum weight (g): endpoint.

Comparison 1 Macrolide versus placebo: adults, Outcome 5 FEV1 (% predicted): endpoint.
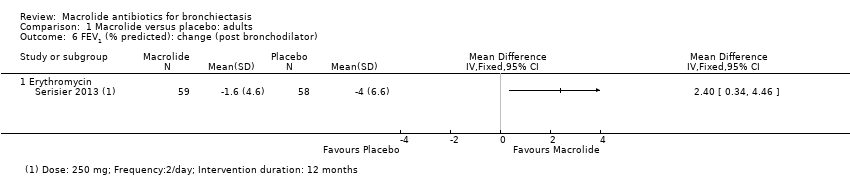
Comparison 1 Macrolide versus placebo: adults, Outcome 6 FEV1 (% predicted): change (post bronchodilator).

Comparison 1 Macrolide versus placebo: adults, Outcome 7 FEV1 (L): endpoint.
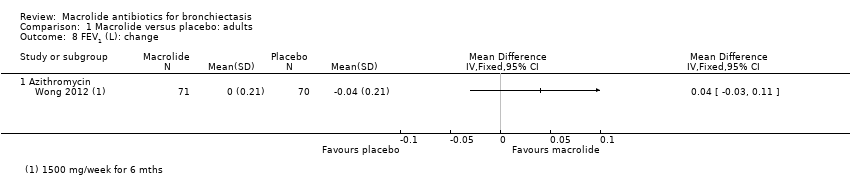
Comparison 1 Macrolide versus placebo: adults, Outcome 8 FEV1 (L): change.

Comparison 1 Macrolide versus placebo: adults, Outcome 9 FVC (% predicted): endpoint.

Comparison 1 Macrolide versus placebo: adults, Outcome 10 FVC (L): endpoint.
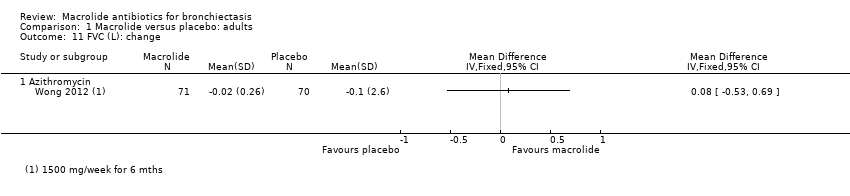
Comparison 1 Macrolide versus placebo: adults, Outcome 11 FVC (L): change.

Comparison 1 Macrolide versus placebo: adults, Outcome 12 FEV1/FVC: endpoint.

Comparison 1 Macrolide versus placebo: adults, Outcome 13 Adverse events.

Comparison 1 Macrolide versus placebo: adults, Outcome 14 Azithromycin‐resistant bacteria (any).
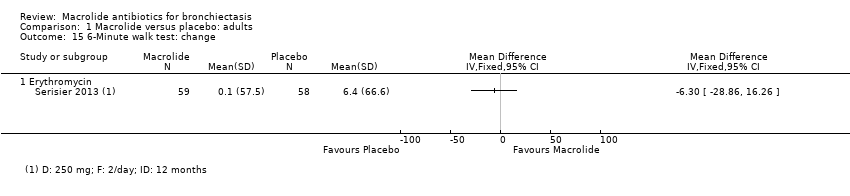
Comparison 1 Macrolide versus placebo: adults, Outcome 15 6‐Minute walk test: change.

Comparison 1 Macrolide versus placebo: adults, Outcome 16 Quality of life: endpoint.
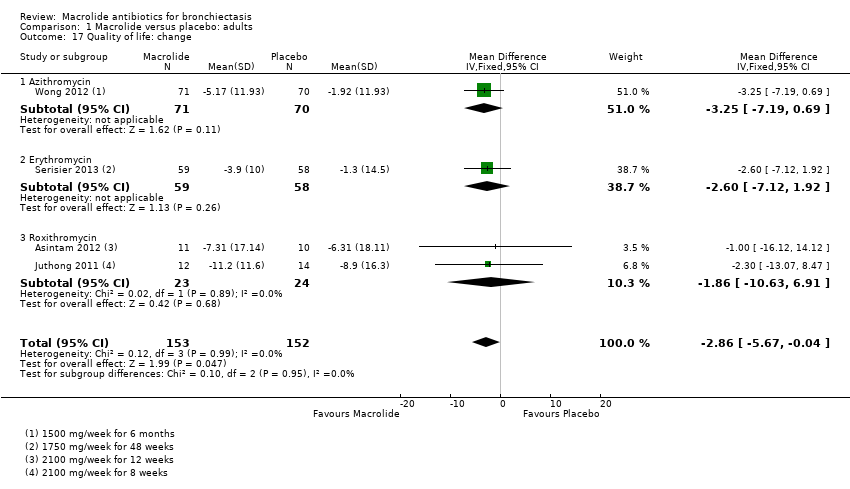
Comparison 1 Macrolide versus placebo: adults, Outcome 17 Quality of life: change.

Comparison 2 Macrolide versus no intervention: adults, Outcome 1 ≥ 1 exacerbation.

Comparison 2 Macrolide versus no intervention: adults, Outcome 2 QoL SGRQ: endpoint total score.

Comparison 3 Macrolide versus placebo: children, Outcome 1 Hospitalisation: all‐cause.
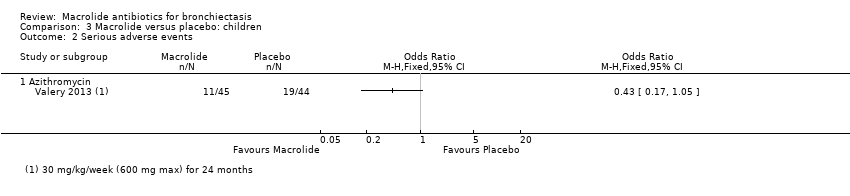
Comparison 3 Macrolide versus placebo: children, Outcome 2 Serious adverse events.
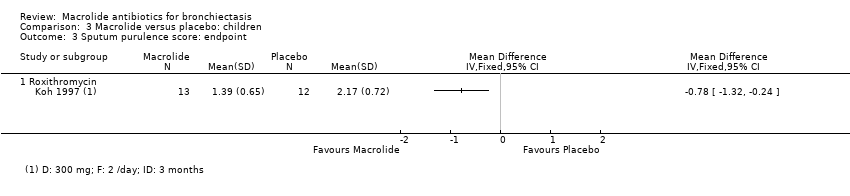
Comparison 3 Macrolide versus placebo: children, Outcome 3 Sputum purulence score: endpoint.
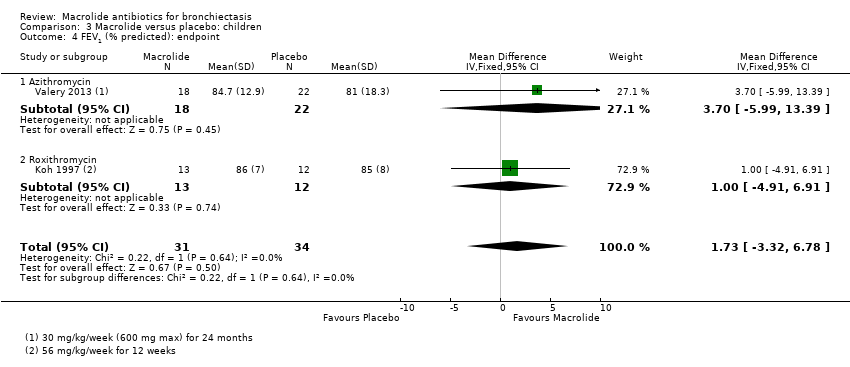
Comparison 3 Macrolide versus placebo: children, Outcome 4 FEV1 (% predicted): endpoint.

Comparison 3 Macrolide versus placebo: children, Outcome 5 Adverse events.

Comparison 3 Macrolide versus placebo: children, Outcome 6 Azithromycin‐resistant bacteria (any).
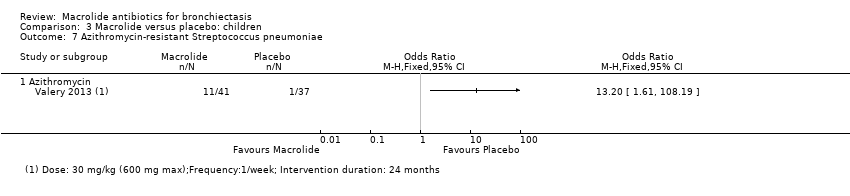
Comparison 3 Macrolide versus placebo: children, Outcome 7 Azithromycin‐resistant Streptococcus pneumoniae.

Comparison 3 Macrolide versus placebo: children, Outcome 8 Azithromycin‐resistant Staphylococcus aureus.
| Macrolides compared with placebo for adults with bronchiectasis | ||||||
| Patient or population: adults with bronchiectasis | ||||||
| Outcomes | Anticipated absolute effects* (95% CI) | Relative effect | No. of participants | Quality of the evidence | Comments | |
| Risk with placebo | Risk with macrolides | |||||
| ≥ 1 exacerbation | 714 per 1000 | 459 per 1000 | OR 0.34 | 341 | ⊕⊕⊕⊝ | 2 studies azithromycin (1750 mg/week for 52 weeks; 1500 mg/week for 6 months) 1 study erythromycin (3500 mg/week for 48 weeks) |
| Hospitalisation: all cause | 133 per 1000 | 79 per 1000 | OR 0.56 | 151 | ⊕⊕⊝⊝ | 2 studies azithromycin (1000 mg/week for 12 weeks; 1750 mg/week for 52 weeks) |
| Serious adverse events | 86 per 1000 | 44 per 1000 | OR 0.49 | 326 | ⊕⊕⊝⊝ | 2 studies azithromycin (1500 mg/week for 6 months; 1000 mg/week for 12 weeks) 1 study erythromycin (3500 mg/week for 48 weeks) |
| All‐cause mortality | 0 per 1000 | 0 per 1000 | not estimable | 540 | ⊕⊕⊝⊝ | 4 studies azithromycin (1000 to 1750 mg/week for 12 to 52 weeks) |
| Quality of life: endpoint | Mean SGRQ score at endpoint in placebo groups was 39.1 points. | MD 8.90 lower (13.13 lower to 4.67 lower) | ‐ | 68 | ⊕⊕⊕⊝ | 1 study azithromycin (1000 mg/week for 12 weeks) |
| Quality of life: change | Mean change in SGRQ score ranged from ‐1.3 to ‐8.9 points. | MD 2.86 lower | ‐ | 305 | ⊕⊕⊝⊝ | 1 study azithromycin (1500 mg/week for 6 months) |
| *The risk in the intervention group (and its 95% confidence interval) is based on the assumed risk in the comparison group and the relative effect of the intervention (and its 95% CI). | ||||||
| GRADE Working Group grades of evidence. | ||||||
| aEffect observed only with azithromycin (one point deducted in relation to design and implementation of available studies suggesting likelihood of bias). bUnclear allocation concealment and baseline imbalances on Lourdesamy (one point deducted in relation to design and implementation of available studies suggesting likelihood of bias). cTwo small studies and wide confidence interval (one point deducted for imprecision). dWide confidence interval (one point deducted for imprecision). eIn three of the seven studies, study methods were not clearly reported (one point deducted in relation to design and implementation of available studies suggesting likelihood of bias). fA total of 28 participants across four studies were lost to follow‐up with no further details available and unclear details of withdrawals in one study (one point deducted in relation to design and implementation of available studies suggesting likelihood of bias). gRandomisation, blinding, and other study methods unclear in two studies (Asintam; Juthong) (one point deducted in relation to design and implementation of available studies suggesting likelihood of bias). hWide confidence interval and mean difference does not exceed the threshold for clinical significance (one point deducted for imprecision). | ||||||
| Macrolides compared with no intervention for adults with bronchiectasis | ||||||
| Patient or population: adults with bronchiectasis | ||||||
| Outcomes | Anticipated absolute effects* (95% CI) | Relative effect | No. of participants | Quality of the evidence | Comments | |
| Risk with no intervention | Risk with macrolides | |||||
| ≥ 1 exacerbation | Study population | OR 0.31 | 43 | ⊕⊕⊕⊝ | Roxithromycin (1050 mg/week for 6 months) | |
| 762 per 1000 | 498 per 1000 | |||||
| Hospitalisations ‐ not reported | ‐ | ‐ | ‐ | ‐ | ‐ | |
| Serious adverse events ‐ not reported | ‐ | ‐ | ‐ | ‐ | ‐ | |
| Mortality | No deaths in two trials, although in 1 study (azithromycin), 6 participants were lost to follow‐up | not estimable | 88 | ⊕⊝⊝⊝ | 1 study azithromycin (750 mg/week for 3 months) | |
| QoL SGRQ: endpoint total score | Mean SGRQ: endpoint total score of 51.7 points | MD 8.81 lower (14.33 lower to 3.28 lower) | ‐ | 89 | ⊕⊕⊕⊝ | 1 study roxithromycin (1050 mg/week for 6 months) |
| QoL SGRQ: change in total score | Mean SGRQ: change in total score of 4.1 | MD 12 lower | ‐ | 30 | ⊕⊕⊕⊝ | Azithromycin (750 mg/week for 3 months) |
| *The risk in the intervention group (and its 95% confidence interval) is based on the assumed risk in the comparison group and the relative effect of the intervention (and its 95% CI). | ||||||
| GRADE Working Group grades of evidence. | ||||||
| aOpen‐label study (one point deducted in relation to design and implementation of available studies suggesting likelihood of bias). bUnclear randomisation and study methods (one point deducted in relation to design and implementation of available studies suggesting likelihood of bias). c6 participants in one study lost to follow‐up and no further details reported (one point deducted in relation to design and implementation of available studies suggesting likelihood of bias). | ||||||
| Macrolides compared with placebo for children with bronchiectasis | ||||||
| Patient or population: children with bronchiectasis | ||||||
| Outcomes | Anticipated absolute effects* (95% CI) | Relative effect | No. of participants | Quality of the evidence | Comments | |
| Risk with placebo | Risk with macrolides | |||||
| Exacerbation frequency | Number of exacerbations 195 (median: 4 range 0‐14) | Number of exacerbations 104 (median: 2 range 0‐9) | IRR 0.50 95% CI 0.35 to 0.71 | 89 | ⊕⊕⊝⊝ | Azithromycin (30 mg/kg/week for up to 24 months) |
| Hospitalisation: all‐cause | 205 per 1000 | 67 per 1000 | OR 0.28 | 89 | ⊕⊕⊝⊝ | Azithromycin (30 mg/kg/week for 24 months) |
| Serious adverse events | 432 per 1000 | 246 per 1000 | OR 0.43 | 89 | ⊕⊕⊝⊝ | Azithromycin (30 mg/kg/week for 24 months) |
| Mortality | 1 child died but study group was not stated. | ‐ | 42 | ⊕⊕⊝⊝ | Erythromycin (875 to 1750 mg/kg/week for 52 weeks) | |
| Quality of life not reported | ‐ | ‐ | ‐ | ‐ | ‐ | |
| *The risk in the intervention group (and its 95% confidence interval) is based on the assumed risk in the comparison group and the relative effect of the intervention (and its 95% CI). | ||||||
| GRADE Working Group grades of evidence. | ||||||
| aWide confidence interval that includes 1 (no difference) (one point deducted for imprecision). bLow event rates and low numbers (one point deducted in relation to design and implementation of available studies suggesting likelihood of bias). cUnclear information on randomisation, blinding, and other study methods (one point deducted in relation to design and implementation of available studies suggesting likelihood of bias). dNo information on participants lost to follow‐up (one point deducted in relation to design and implementation of available studies suggesting likelihood of bias). | ||||||
| Macrolides compared with no intervention for children with bronchiectasis | ||||||
| Patient or population: children with bronchiectasis | ||||||
| Outcomes | Anticipated absolute effects* (95% CI) | Relative effect | No. of participants | Quality of the evidence | Comments | |
| Risk with no intervention | Risk with macrolides | |||||
| Exacerbations ‐ not reported | ‐ | ‐ | ‐ | ‐ | ‐ | |
| Hospitalisation ‐ not reported | ‐ | ‐ | ‐ | ‐ | ‐ | |
| Serious adverse events ‐ not reported | ‐ | ‐ | ‐ | ‐ | ‐ | |
| Mortality | 0 per 1000 | 0 per 1000 | not estimable | 34 | ⊕⊕⊝⊝ | Clarithromycin (105 mg/kg/week for 3 months) |
| Quality of life ‐ not reported | ‐ | ‐ | ‐ | ‐ | ‐ | |
| *The risk in the intervention group (and its 95% confidence interval) is based on the assumed risk in the comparison group and the relative effect of the intervention (and its 95% CI). | ||||||
| GRADE Working Group grades of evidence. | ||||||
| aInsufficient information on study methods and procedures (one point deducted in relation to design and implementation of available studies suggesting likelihood of bias). bNot blinded (one point deducted in relation to design and implementation of available studies suggesting likelihood of bias). | ||||||
| Study | Adults/ Children | No. of participants | Type of macrolide | Macrolide dose | Frequency | Delivery mode | Combined weekly dose | Comparison | Duration (months unless stated) |
| Altenburg 2013 | Adults | 83 | Azithromycin | 250 mg | Once daily | Oral | 1750 mg | Placebo | 12 |
| Asintam 2012 | Adults | 30 | Roxithromycin | 300 mg | Once daily | Oral | 2100 mg | Placebo | 12 weeks |
| Cymbala 2005 | Adults | 12 | Azithromycin | 500 mg | 3 days per week | Oral | 1000 mg | No intervention | 6 |
| Diego 2013 | Adults | 36 | Azithromycin | 250 mg | 3 days per week | Oral | 750 mg | No intervention | 3 |
| Juthong 2011 | Adults | 26 | Roxithromycin | 300 mg | Once daily | Oral | 2100 mg | Placebo | 8 weeks |
| Koh 1997 | Children | 25 | Roxithromycin | 4 mg/kg | Twice daily | Oral | 56 mg/kg | Placebo | 12 weeks |
| Liu 2012 | Adults | 50 | Roxithromycin, ambroxol hydrochloride | 150 mg | Once daily | Oral | 1050 mg | Ambroxol hydrochloride (no intervention) | 6 |
| Liu 2014 | Adults | 52 | Roxithromycin | 150 mg | Once daily | Oral | 1050 mg | No intervention | 6 |
| Lourdesamy 2014 | Adults | 78 | Azithromycin | 1000 mg | Weekly | 1000 mg | Placebo | 3 | |
| Masekela 2013 | Children | 42 | Erythromycin | 125 mg for children weighing < 15 kg and 250 mg ≥ 15 kg | Daily | Oral | 875 mg for children weighing < 15 kg and 1750 mg ≥ 15 kg | Placebo | 12 |
| Sadigov 2013 | Adults | 65 | Azithromycin | 500 mg | 3 days per week | Oral | 1500 mg | Placebo | 6 |
| Serisier 2013 | Adults | 117 | Erythromycin | 250 mg | Twice daily | Oral | 3500 mg | Placebo | 11 |
| Valery 2013 | Children | 89 | Azithromycin | 30 mg/kg up to a maximum of 600 mg | Once a week | Oral | 30 mg/kg up to a maximum of 600 mg | Placebo | 24 |
| Wong 2012 | Adults | 141 | Azithromycin | 500 mg | 3 days per week | Oral | 1500 mg | Placebo | 6 |
| Yalcin 2006 | Children | 34 | Clarithromycin, supportive therapies | 15 mg/kg | Daily | Oral | 105 mg/kg | Supportive therapies (no intervention) | 3 |
| Outcome or subgroup title | No. of studies | No. of participants | Statistical method | Effect size |
| 1 ≥ 1 exacerbation Show forest plot | 3 | 341 | Odds Ratio (M‐H, Fixed, 95% CI) | 0.34 [0.22, 0.54] |
| 1.1 Azithromycin | 2 | 224 | Odds Ratio (M‐H, Fixed, 95% CI) | 0.23 [0.13, 0.40] |
| 1.2 Erythromycin | 1 | 117 | Odds Ratio (M‐H, Fixed, 95% CI) | 0.74 [0.34, 1.63] |
| 2 Hospitalisation: all‐cause Show forest plot | 2 | 151 | Odds Ratio (M‐H, Fixed, 95% CI) | 0.56 [0.19, 1.62] |
| 2.1 Azithromycin | 2 | 151 | Odds Ratio (M‐H, Fixed, 95% CI) | 0.56 [0.19, 1.62] |
| 3 Serious adverse events Show forest plot | 3 | 326 | Odds Ratio (M‐H, Fixed, 95% CI) | 0.49 [0.20, 1.23] |
| 3.1 Azithromycin | 2 | 209 | Odds Ratio (M‐H, Fixed, 95% CI) | 0.51 [0.20, 1.34] |
| 3.2 Erythromycin | 1 | 117 | Odds Ratio (M‐H, Fixed, 95% CI) | 0.32 [0.01, 8.07] |
| 4 Sputum weight (g): endpoint Show forest plot | 1 | Mean Difference (IV, Fixed, 95% CI) | Totals not selected | |
| 4.1 Azithromycin | 1 | Mean Difference (IV, Fixed, 95% CI) | 0.0 [0.0, 0.0] | |
| 5 FEV1 (% predicted): endpoint Show forest plot | 1 | Mean Difference (IV, Fixed, 95% CI) | Totals not selected | |
| 5.1 Azithromycin | 1 | Mean Difference (IV, Fixed, 95% CI) | 0.0 [0.0, 0.0] | |
| 6 FEV1 (% predicted): change (post bronchodilator) Show forest plot | 1 | Mean Difference (IV, Fixed, 95% CI) | Totals not selected | |
| 6.1 Erythromycin | 1 | Mean Difference (IV, Fixed, 95% CI) | 0.0 [0.0, 0.0] | |
| 7 FEV1 (L): endpoint Show forest plot | 2 | 94 | Mean Difference (IV, Fixed, 95% CI) | 0.02 [‐0.17, 0.22] |
| 7.1 Azithromycin | 1 | 68 | Mean Difference (IV, Fixed, 95% CI) | ‐0.01 [‐0.23, 0.21] |
| 7.2 Roxithromycin | 1 | 26 | Mean Difference (IV, Fixed, 95% CI) | 0.15 [‐0.27, 0.57] |
| 8 FEV1 (L): change Show forest plot | 1 | Mean Difference (IV, Fixed, 95% CI) | Totals not selected | |
| 8.1 Azithromycin | 1 | Mean Difference (IV, Fixed, 95% CI) | 0.0 [0.0, 0.0] | |
| 9 FVC (% predicted): endpoint Show forest plot | 1 | Mean Difference (IV, Fixed, 95% CI) | Totals not selected | |
| 9.1 Azithromycin | 1 | Mean Difference (IV, Fixed, 95% CI) | 0.0 [0.0, 0.0] | |
| 10 FVC (L): endpoint Show forest plot | 2 | 94 | Mean Difference (IV, Fixed, 95% CI) | 0.08 [‐0.19, 0.36] |
| 10.1 Azithromycin | 1 | 68 | Mean Difference (IV, Fixed, 95% CI) | ‐0.02 [‐0.34, 0.30] |
| 10.2 Roxithromycin | 1 | 26 | Mean Difference (IV, Fixed, 95% CI) | 0.38 [‐0.16, 0.92] |
| 11 FVC (L): change Show forest plot | 1 | Mean Difference (IV, Fixed, 95% CI) | Totals not selected | |
| 11.1 Azithromycin | 1 | Mean Difference (IV, Fixed, 95% CI) | 0.0 [0.0, 0.0] | |
| 12 FEV1/FVC: endpoint Show forest plot | 1 | Mean Difference (IV, Fixed, 95% CI) | Totals not selected | |
| 12.1 Azithromycin | 1 | Mean Difference (IV, Fixed, 95% CI) | 0.0 [0.0, 0.0] | |
| 13 Adverse events Show forest plot | 5 | 435 | Odds Ratio (M‐H, Fixed, 95% CI) | 0.83 [0.51, 1.35] |
| 13.1 Azithromycin | 3 | 292 | Odds Ratio (M‐H, Fixed, 95% CI) | 0.77 [0.41, 1.45] |
| 13.2 Erythromycin | 1 | 117 | Odds Ratio (M‐H, Fixed, 95% CI) | 1.16 [0.51, 2.62] |
| 13.3 Roxithromycin | 1 | 26 | Odds Ratio (M‐H, Fixed, 95% CI) | 0.13 [0.01, 2.83] |
| 14 Azithromycin‐resistant bacteria (any) Show forest plot | 1 | Odds Ratio (M‐H, Fixed, 95% CI) | Totals not selected | |
| 14.1 Azithromycin | 1 | Odds Ratio (M‐H, Fixed, 95% CI) | 0.0 [0.0, 0.0] | |
| 15 6‐Minute walk test: change Show forest plot | 1 | Mean Difference (IV, Fixed, 95% CI) | Totals not selected | |
| 15.1 Erythromycin | 1 | Mean Difference (IV, Fixed, 95% CI) | 0.0 [0.0, 0.0] | |
| 16 Quality of life: endpoint Show forest plot | 1 | 68 | Mean Difference (IV, Fixed, 95% CI) | ‐8.90 [‐13.13, ‐4.67] |
| 16.1 Azithromycin | 1 | 68 | Mean Difference (IV, Fixed, 95% CI) | ‐8.90 [‐13.13, ‐4.67] |
| 17 Quality of life: change Show forest plot | 4 | 305 | Mean Difference (IV, Fixed, 95% CI) | ‐2.86 [‐5.67, ‐0.04] |
| 17.1 Azithromycin | 1 | 141 | Mean Difference (IV, Fixed, 95% CI) | ‐3.25 [‐7.19, 0.69] |
| 17.2 Erythromycin | 1 | 117 | Mean Difference (IV, Fixed, 95% CI) | ‐2.60 [‐7.12, 1.92] |
| 17.3 Roxithromycin | 2 | 47 | Mean Difference (IV, Fixed, 95% CI) | ‐1.86 [‐10.63, 6.91] |
| Outcome or subgroup title | No. of studies | No. of participants | Statistical method | Effect size |
| 1 ≥ 1 exacerbation Show forest plot | 1 | Odds Ratio (M‐H, Fixed, 95% CI) | Totals not selected | |
| 1.1 Roxithromycin | 1 | Odds Ratio (M‐H, Fixed, 95% CI) | 0.0 [0.0, 0.0] | |
| 2 QoL SGRQ: endpoint total score Show forest plot | 2 | 89 | Mean Difference (IV, Fixed, 95% CI) | ‐8.81 [‐14.33, ‐3.28] |
| 2.1 Roxithromycin | 2 | 89 | Mean Difference (IV, Fixed, 95% CI) | ‐8.81 [‐14.33, ‐3.28] |
| Outcome or subgroup title | No. of studies | No. of participants | Statistical method | Effect size |
| 1 Hospitalisation: all‐cause Show forest plot | 1 | Odds Ratio (M‐H, Fixed, 95% CI) | Totals not selected | |
| 1.1 Azithromycin | 1 | Odds Ratio (M‐H, Fixed, 95% CI) | 0.0 [0.0, 0.0] | |
| 2 Serious adverse events Show forest plot | 1 | Odds Ratio (M‐H, Fixed, 95% CI) | Totals not selected | |
| 2.1 Azithromycin | 1 | Odds Ratio (M‐H, Fixed, 95% CI) | 0.0 [0.0, 0.0] | |
| 3 Sputum purulence score: endpoint Show forest plot | 1 | Mean Difference (IV, Fixed, 95% CI) | Totals not selected | |
| 3.1 Roxithromycin | 1 | Mean Difference (IV, Fixed, 95% CI) | 0.0 [0.0, 0.0] | |
| 4 FEV1 (% predicted): endpoint Show forest plot | 2 | 65 | Mean Difference (IV, Fixed, 95% CI) | 1.73 [‐3.32, 6.78] |
| 4.1 Azithromycin | 1 | 40 | Mean Difference (IV, Fixed, 95% CI) | 3.70 [‐5.99, 13.39] |
| 4.2 Roxithromycin | 1 | 25 | Mean Difference (IV, Fixed, 95% CI) | 1.0 [‐4.91, 6.91] |
| 5 Adverse events Show forest plot | 1 | Odds Ratio (M‐H, Fixed, 95% CI) | Totals not selected | |
| 5.1 Azithromycin | 1 | Odds Ratio (M‐H, Fixed, 95% CI) | 0.0 [0.0, 0.0] | |
| 6 Azithromycin‐resistant bacteria (any) Show forest plot | 1 | Odds Ratio (M‐H, Fixed, 95% CI) | Totals not selected | |
| 6.1 Azithromycin | 1 | Odds Ratio (M‐H, Fixed, 95% CI) | 0.0 [0.0, 0.0] | |
| 7 Azithromycin‐resistant Streptococcus pneumoniae Show forest plot | 1 | Odds Ratio (M‐H, Fixed, 95% CI) | Totals not selected | |
| 7.1 Azithromycin | 1 | Odds Ratio (M‐H, Fixed, 95% CI) | 0.0 [0.0, 0.0] | |
| 8 Azithromycin‐resistant Staphylococcus aureus Show forest plot | 1 | Odds Ratio (M‐H, Fixed, 95% CI) | Totals not selected | |
| 8.1 Azithromycin | 1 | Odds Ratio (M‐H, Fixed, 95% CI) | 0.0 [0.0, 0.0] | |