Toma de decisiones compartida para los pacientes con asma
Información
- DOI:
- https://doi.org/10.1002/14651858.CD012330.pub2Copiar DOI

- Base de datos:
-
- Cochrane Database of Systematic Reviews
- Versión publicada:
-
- 03 octubre 2017see what's new
- Tipo:
-
- Intervention
- Etapa:
-
- Review
- Grupo Editorial Cochrane:
-
Grupo Cochrane de Vías respiratorias
- Copyright:
-
- Copyright © 2017 The Cochrane Collaboration. Published by John Wiley & Sons, Ltd.
Cifras del artículo
Altmetric:
Citado por:
Autores
Contributions of authors
KK wrote the Background and Methods sections of this review with support from PM.
For the full review, KK, PM, and RN screened search results and selected studies for inclusion. KK and RN finalised the included studies, extracted data, and assessed risk of bias in the included studies. KK conducted the analyses and wrote up the results, with input from RN. RN and KK assessed the quality of the evidence using the Grading of Recommendations Assessment, Development and Evaluation (GRADE) approach. RN, PM, and KA wrote the Discussion section, with input from KK. All review authors contributed to interpretation of findings and assisted in preparing the manuscript for submission.
Sources of support
Internal sources
-
Kayleigh M Kew, UK.
Supported by St George's, University of London
External sources
-
National Institute for Health Research (NIHR), UK.
Evidence to guide care in adults and children with asthma, 13/89/14
This project was supported by the NIHR, via Cochrane Infrastructure, Cochrane Programme Grant, or Cochrane Incentive funding to the Cochrane Airways Group. The views and opinions expressed therein are those of the review authors and do not necessarily reflect those of the Systematic Reviews Programme, the NIHR, the NHS, or the Department of Health
Declarations of interest
KK is funded to prepare Cochrane reviews by a Programme Grant awarded by the NIHR to the Cochrane Airways Group.
PM has reported no conflicts.
KA is a consultant respiratory paediatrician with respiratory interest in the NHS. He has no alternative sources of funding.
RN is a qualified general practitioner and the deputy Co‐ordinating Editor of Cochrane Airways. She is funded by an NIHR grant to Cochrane Airways.
Acknowledgements
The Background and Methods sections of this review are based on a standard template used by Cochrane Airways. We are grateful for advice and editorial expertise provided by the Cochrane Airways staff.
Sally Spencer was the Editor for this review and commented critically on the review.
Version history
| Published | Title | Stage | Authors | Version |
| 2017 Oct 03 | Shared decision‐making for people with asthma | Review | Kayleigh M Kew, Poonam Malik, Krishnan Aniruddhan, Rebecca Normansell | |
| 2016 Aug 23 | Shared decision‐making for people with asthma | Protocol | Kayleigh M Kew, Poonam Malik | |
Differences between protocol and review
In the Dealing with missing data section, we changed the wording after "Where this was not possible, and we considered that the missing data may introduce serious bias" from "we explored the impact of including such studies in the overall assessment of results by a sensitivity analysis" to "we explored the impact in the Grading of Recommendations Assessment, Development and Evaluation (GRADE) rating for that outcome."
Rebecca Normansell joined the review author team at the review stage. She extracted data and assessed studies for risk of bias, instead of PM, as had been planned. This was a more practical approach, as KK and RN are based in the same office.
We had planned to exclude cross‐over trials owing to the likelihood of carry‐over of effects, but for future updates, we will include the first phase of a cross‐over trial. We did not identify any relevant cross‐over trials during our searches.
Keywords
MeSH
Medical Subject Headings (MeSH) Keywords
Medical Subject Headings Check Words
Adult; Child; Humans;
PICO

Study flow diagram.
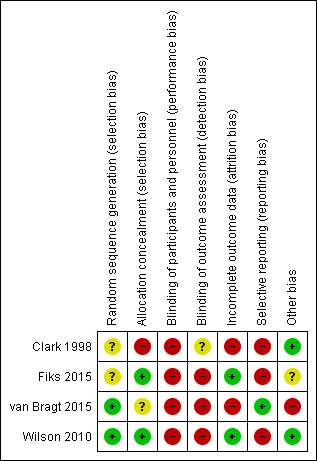
Risk of bias summary: review authors' judgements about each risk of bias item for each included study.

Comparison 1 Shared decision‐making versus usual care, Outcome 1 Quality of life improvement (AQLQ responders).

Comparison 1 Shared decision‐making versus usual care, Outcome 2 Quality of life scores (ITG‐ASF).

Comparison 1 Shared decision‐making versus usual care, Outcome 3 Quality of life scores (mini‐AQLQ).
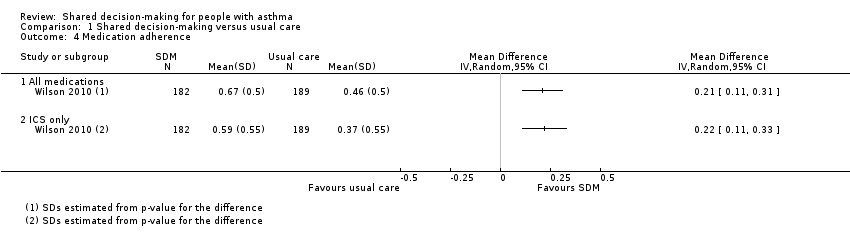
Comparison 1 Shared decision‐making versus usual care, Outcome 4 Medication adherence.

Comparison 1 Shared decision‐making versus usual care, Outcome 5 Exacerbations of asthma.
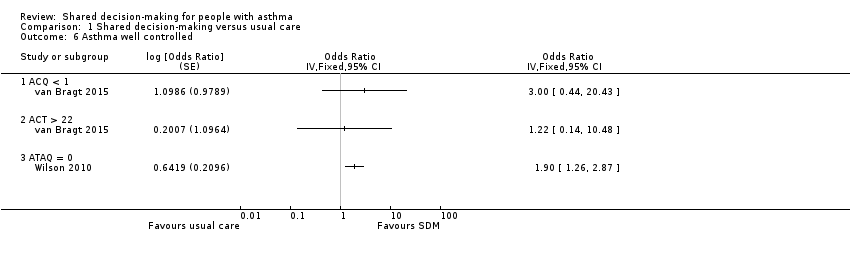
Comparison 1 Shared decision‐making versus usual care, Outcome 6 Asthma well controlled.
| Shared decision‐making compared with usual care for people with asthma | |||||||
| Patient or population: adults and children with asthma | |||||||
| Outcomes | Anticipated absolute effects* (95% CI) | Relative effect | No. of participants | Quality of the evidence | Comments | ||
| Risk with usual care | Risk with shared decision‐making | ||||||
| Asthma‐related quality of life (follow‐up: 6 to 24 months) | AQLQ responders | 556 per 1000 | 704 per 1000 | OR 1.90 | 371 | ⊕⊕⊕⊝ | Participants achieving > 0.5‐point improvement (MCID for this scale) |
| ITG‐ASF daytime symptom scale | Mean ITG‐ASF daytime symptom score was 12 | MD 4 higher | ‐ | 53 | ⊕⊝⊝⊝ | Higher score = Better quality of life The same study also reported mean night‐time symptom scale and functional limitation scale (see Analysis 1.2). | |
| Mini‐AQLQ | Mini‐AQLQ score was 5.5 | MD 0.4 higher | ‐ | 371 | ⊕⊕⊝⊝ | Higher score = Better quality of life. MCID 0.5 | |
| Parent/patient satisfaction | Presentation on forest plot not possible; summarised narratively in text and Table 2 | ‐ | ‐ | ‐ | |||
| Medication adherence (follow‐up: 12 to 24 months) | ICS only | The ICS adherence was 0.59 | MD 0.22 higher | ‐ | 371 | ⊕⊕⊕⊝ | Adherence calculated using continuous medication acquisition (CMA) from pharmacy data. Maximum score 1. The same study reported all‐medication adherence (see Analysis 1.4). |
| Exacerbations of asthma (follow‐up: 6 months) | Requiring ED visit | 222 per 1,000 | 77 per 1,000 | OR 0.29 | 53 | ⊕⊕⊝⊝ | The same study reported exacerbations requiring hospital admission, "specialist visits", and GP visits (see Analysis 1.5). |
| Asthma control (follow‐up: 12 to 24 months) | Asthma well controlled; ATAQ = 0 | No control group risk presented | Not estimable | OR 1.90 | 371 (1 RCT) | ⊕⊕⊕⊝ | Lower score = Better asthma control A different small study reported asthma control on ACT and ACQ (see Analysis 1.6). |
| Adverse events (all) | Included trials did not measure or report any adverse events. | ‐ | ‐ | ‐ | |||
| *The risk in the intervention group (and its 95% confidence interval) is based on the assumed risk in the comparison group and the relative effect of the intervention (and its 95% CI). | |||||||
| GRADE Working Group grades of evidence. | |||||||
| aRisk of performance and detected bias. Downgraded once. bOne study. Confidence intervals include possible harm and benefit of intervention. Downgraded once. cOnly quality of life subscales reported. Downgraded once for indirectness. dAlthough the mean difference for this scale lies below the MCID, the responder analysis suggests that significantly more people achieved the MCID change with the intervention. No downgrade. eAdherence calculated using continuous medication acquisition from pharmacy data. This is a proxy measure and may overestimate true adherence. Downgraded once. fOne study. Confidence intervals very wide and include possible harm and benefit of intervention. Downgraded twice. | |||||||
| Study ID | Country | Population | Age (years) | Design | Intervention | Aimed at | Control |
| USA | 74 physicians; 637 children | 1 to 12 | Cluster RCT | SDM seminars | HCPs | Usual care | |
| USA | 60 families | 6 to 12 | Individual RCT | SDM portal | HCPs and patients/parents | Usual care + decision support | |
| Holland | 33 children | 6 to 12 | Cluster RCT | SDM online tool | HCPs and patients/parents | Enhanced usual care | |
| USA | 612 adults | 18 to 65 | Individual RCT | SDM structured sessions | HCPs | 1. Guideline‐led decision‐making 2. Usual care | |
| HCP: healthcare provider; RCT: randomised controlled trial; SDM: shared decision‐making. | |||||||
| Was/did the clinician: | SDM | Control | P value (GEEa) |
| Reassuring and encouragingb | 4.63 | 4.42 | 0.006 |
| Look into how family managed | 3.98 | 3.69 | 0.02 |
| Describe how child should be fully | 71.% | 59% | 0.007 |
| Describe at least 1 of 3 goals: | 75% | 64% | 0.07 |
| Give information to relieve specific | 4.1 | 3.9 | 0.007 |
| Enable family to know how to make | 4.3 | 4.2 | 0.07 |
| aGEE method to assess "Time2" (follow‐up) scores with baseline scores and group assignment as covariates in regression models. NB: A total of 472 parents were followed up; numbers in each group are not given. | |||
| Outcome or subgroup title | No. of studies | No. of participants | Statistical method | Effect size |
| 1 Quality of life improvement (AQLQ responders) Show forest plot | 1 | Odds Ratio (M‐H, Random, 95% CI) | Totals not selected | |
| 2 Quality of life scores (ITG‐ASF) Show forest plot | 1 | Mean Difference (IV, Random, 95% CI) | Totals not selected | |
| 2.1 ITG‐ASF night‐time symptom scale | 1 | Mean Difference (IV, Random, 95% CI) | 0.0 [0.0, 0.0] | |
| 2.2 ITG‐ASF daytime symptom scale | 1 | Mean Difference (IV, Random, 95% CI) | 0.0 [0.0, 0.0] | |
| 2.3 ITG‐ASF functional limitation scale | 1 | Mean Difference (IV, Random, 95% CI) | 0.0 [0.0, 0.0] | |
| 3 Quality of life scores (mini‐AQLQ) Show forest plot | 1 | Mean Difference (IV, Random, 95% CI) | Totals not selected | |
| 4 Medication adherence Show forest plot | 1 | Mean Difference (IV, Random, 95% CI) | Totals not selected | |
| 4.1 All medications | 1 | Mean Difference (IV, Random, 95% CI) | 0.0 [0.0, 0.0] | |
| 4.2 ICS only | 1 | Mean Difference (IV, Random, 95% CI) | 0.0 [0.0, 0.0] | |
| 5 Exacerbations of asthma Show forest plot | 1 | Odds Ratio (M‐H, Random, 95% CI) | Totals not selected | |
| 5.1 Requiring hospital admission | 1 | Odds Ratio (M‐H, Random, 95% CI) | 0.0 [0.0, 0.0] | |
| 5.2 Requiring ED visit | 1 | Odds Ratio (M‐H, Random, 95% CI) | 0.0 [0.0, 0.0] | |
| 5.3 Requiring specialist visit | 1 | Odds Ratio (M‐H, Random, 95% CI) | 0.0 [0.0, 0.0] | |
| 5.4 Requiring GP visit | 1 | Odds Ratio (M‐H, Random, 95% CI) | 0.0 [0.0, 0.0] | |
| 6 Asthma well controlled Show forest plot | 2 | Odds Ratio (Fixed, 95% CI) | Totals not selected | |
| 6.1 ACQ < 1 | 1 | Odds Ratio (Fixed, 95% CI) | 0.0 [0.0, 0.0] | |
| 6.2 ACT > 22 | 1 | Odds Ratio (Fixed, 95% CI) | 0.0 [0.0, 0.0] | |
| 6.3 ATAQ = 0 | 1 | Odds Ratio (Fixed, 95% CI) | 0.0 [0.0, 0.0] | |