La prise de décision partagée pour les personnes souffrant d'asthme
Appendices
Appendix 1. Sources and search methods for the Cochrane Airways Group Specialised Register (CAGR)
Electronic searches: core databases
| Database | Frequency of search |
| MEDLINE (Ovid) | Weekly |
| Embase (Ovid) | Weekly |
| CENTRAL (the Cochrane Library) | Monthly |
| PsycINFO (Ovid) | Monthly |
| CINAHL (EBSCO) | Monthly |
| AMED (EBSCO) | Monthly |
Handsearches: core respiratory conference abstracts
| Conference | Years searched |
| American Academy of Allergy, Asthma and Immunology (AAAAI) | 2001 onwards |
| American Thoracic Society (ATS) | 2001 onwards |
| Asia Pacific Society of Respirology (APSR) | 2004 onwards |
| British Thoracic Society Winter Meeting (BTS) | 2000 onwards |
| Chest Meeting | 2003 onwards |
| European Respiratory Society (ERS) | 1992, 1994, 2000 onwards |
| International Primary Care Respiratory Group Congress (IPCRG) | 2002 onwards |
| Thoracic Society of Australia and New Zealand (TSANZ) | 1999 onwards |
MEDLINE search strategy used to identify trials for the CAGR
Condition search
1. exp Asthma/
2. asthma$.mp.
3. (antiasthma$ or anti‐asthma$).mp.
4. Respiratory Sounds/
5. wheez$.mp.
6. Bronchial Spasm/
7. bronchospas$.mp.
8. (bronch$ adj3 spasm$).mp.
9. bronchoconstrict$.mp.
10. exp Bronchoconstriction/
11. (bronch$ adj3 constrict$).mp.
12. Bronchial Hyperreactivity/
13. Respiratory Hypersensitivity/
14. ((bronchial$ or respiratory or airway$ or lung$) adj3 (hypersensitiv$ or hyperreactiv$ or allerg$ or insufficiency)).mp.
15. ((dust or mite$) adj3 (allerg$ or hypersensitiv$)).mp.
16. or/1‐15
17. exp Aspergillosis, Allergic Bronchopulmonary/
18. lung diseases, fungal/
19. aspergillosis/
20. 18 and 19
21. (bronchopulmonar$ adj3 aspergillosis).mp.
22. 17 or 20 or 21
23. 16 or 22
24. Lung Diseases, Obstructive/
25. exp Pulmonary Disease, Chronic Obstructive/
26. emphysema$.mp.
27. (chronic$ adj3 bronchiti$).mp.
28. (obstruct$ adj3 (pulmonary or lung$ or airway$ or airflow$ or bronch$ or respirat$)).mp.
29. COPD.mp.
30. COAD.mp.
31. COBD.mp.
32. AECB.mp.
33. or/24‐32
34. exp Bronchiectasis/
35. bronchiect$.mp.
36. bronchoect$.mp.
37. kartagener$.mp.
38. (ciliary adj3 dyskinesia).mp.
39. (bronchial$ adj3 dilat$).mp.
40. or/34‐39
41. exp Sleep Apnea Syndromes/
42. (sleep$ adj3 (apnea$ or apnoea$)).mp.
43. (hypopnoea$ or hypopnoea$).mp.
44. OSA.mp.
45. SHS.mp.
46. OSAHS.mp.
47. or/41‐46
48. Lung Diseases, Interstitial/
49. Pulmonary Fibrosis/
50. Sarcoidosis, Pulmonary/
51. (interstitial$ adj3 (lung$ or disease$ or pneumon$)).mp.
52. ((pulmonary$ or lung$ or alveoli$) adj3 (fibros$ or fibrot$)).mp.
53. ((pulmonary$ or lung$) adj3 (sarcoid$ or granulom$)).mp.
54. or/48‐53
55. 23 or 33 or 40 or 47 or 54
Filter to identify randomised controlled trials (RCTs)
1. exp "clinical trial [publication type]"/
2. (randomised or randomised).ab,ti.
3. placebo.ab,ti.
4. dt.fs.
5. randomly.ab,ti.
6. trial.ab,ti.
7. groups.ab,ti.
8. or/1‐7
9. Animals/
10. Humans/
11. 9 not (9 and 10)
12. 8 not 11
The MEDLINE strategy and RCT filter are adapted to identify trials in other electronic databases
Appendix 2. Search strategy to identify relevant trials from the CAGR
#1 AST:MISC1
#2 MeSH DESCRIPTOR Asthma Explode All
#3 asthma*:ti,ab
#4 #1 or #2 or #3
#5 shared* NEAR decision*:ti,ab
#6 sharing* NEAR decision*:ti,ab
#7 informed* NEAR decision*:ti,ab
#8 informed* NEAR choice*:ti,ab
#9 decision* NEAR aid*:ti,ab
#10 ((share* or sharing* or informed*) AND (decision* or deciding* or choice*)):ti
#11 MeSH DESCRIPTOR Decision Making
#12 MeSH DESCRIPTOR Decision Support Techniques
#13 MeSH DESCRIPTOR Decision Support Systems, Clinical
#14 MeSH DESCRIPTOR Choice Behavior
#15 decision* NEAR making*:ti,ab
#16 decision* NEAR support*:ti,ab
#17 choice* NEAR behavio?r*:ti,ab
#18 ((decision* or choice*) AND (making* or support* or behavior* or behaviour*)):ti
#19 MeSH DESCRIPTOR Patient Participation
#20 patient* NEAR participation*:ti,ab
#21 consumer* NEAR participation*:ti,ab
#22 patient* NEAR involvement*:ti,ab
#23 consumer* NEAR involvement*:ti,ab
#24 ((patient* or consumer*) AND (involvement* or involving* or participation* or participating*)):ti
#25 MeSH DESCRIPTOR Professional‐Patient Relations
#26 MeSH DESCRIPTOR Physician‐Patient Relations
#27 MeSH DESCRIPTOR Patient‐Centered Care
#28 ((patient* or person* or client* or consumer*) NEAR (centred or centered or focused or oriented)):ti,ab
#29 #5 or #6 or #7 or #8 or #9 or #10 or #11 or #12 or #13 or #14 or #15 or #16 or #17 or #18 or #19 or #20 or #21 or #22 or #23 or #24 or #25 or #26 or #27 or #28
#30 #4 AND #29
(Note: In search line #1, MISC1 denotes the field in the record where the reference has been coded for condition, in this case, asthma.)

Study flow diagram.
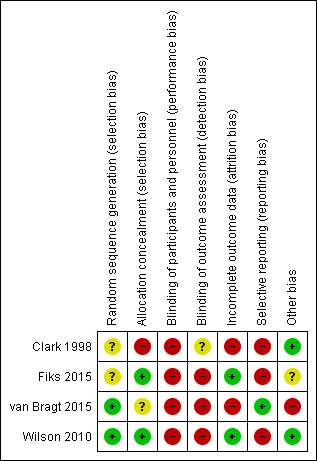
Risk of bias summary: review authors' judgements about each risk of bias item for each included study.

Comparison 1 Shared decision‐making versus usual care, Outcome 1 Quality of life improvement (AQLQ responders).

Comparison 1 Shared decision‐making versus usual care, Outcome 2 Quality of life scores (ITG‐ASF).

Comparison 1 Shared decision‐making versus usual care, Outcome 3 Quality of life scores (mini‐AQLQ).
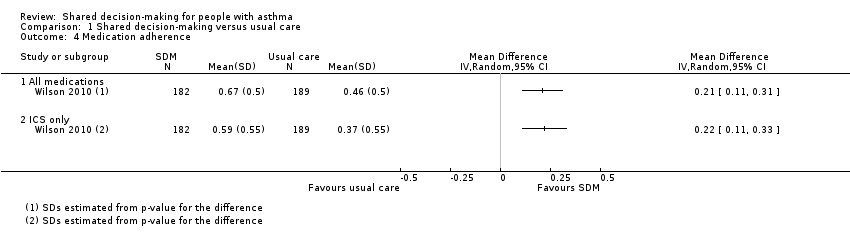
Comparison 1 Shared decision‐making versus usual care, Outcome 4 Medication adherence.

Comparison 1 Shared decision‐making versus usual care, Outcome 5 Exacerbations of asthma.
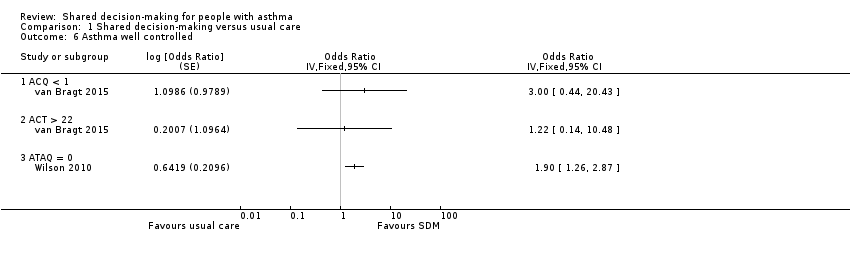
Comparison 1 Shared decision‐making versus usual care, Outcome 6 Asthma well controlled.
| Shared decision‐making compared with usual care for people with asthma | |||||||
| Patient or population: adults and children with asthma | |||||||
| Outcomes | Anticipated absolute effects* (95% CI) | Relative effect | No. of participants | Quality of the evidence | Comments | ||
| Risk with usual care | Risk with shared decision‐making | ||||||
| Asthma‐related quality of life (follow‐up: 6 to 24 months) | AQLQ responders | 556 per 1000 | 704 per 1000 | OR 1.90 | 371 | ⊕⊕⊕⊝ | Participants achieving > 0.5‐point improvement (MCID for this scale) |
| ITG‐ASF daytime symptom scale | Mean ITG‐ASF daytime symptom score was 12 | MD 4 higher | ‐ | 53 | ⊕⊝⊝⊝ | Higher score = Better quality of life The same study also reported mean night‐time symptom scale and functional limitation scale (see Analysis 1.2). | |
| Mini‐AQLQ | Mini‐AQLQ score was 5.5 | MD 0.4 higher | ‐ | 371 | ⊕⊕⊝⊝ | Higher score = Better quality of life. MCID 0.5 | |
| Parent/patient satisfaction | Presentation on forest plot not possible; summarised narratively in text and Table 2 | ‐ | ‐ | ‐ | |||
| Medication adherence (follow‐up: 12 to 24 months) | ICS only | The ICS adherence was 0.59 | MD 0.22 higher | ‐ | 371 | ⊕⊕⊕⊝ | Adherence calculated using continuous medication acquisition (CMA) from pharmacy data. Maximum score 1. The same study reported all‐medication adherence (see Analysis 1.4). |
| Exacerbations of asthma (follow‐up: 6 months) | Requiring ED visit | 222 per 1,000 | 77 per 1,000 | OR 0.29 | 53 | ⊕⊕⊝⊝ | The same study reported exacerbations requiring hospital admission, "specialist visits", and GP visits (see Analysis 1.5). |
| Asthma control (follow‐up: 12 to 24 months) | Asthma well controlled; ATAQ = 0 | No control group risk presented | Not estimable | OR 1.90 | 371 (1 RCT) | ⊕⊕⊕⊝ | Lower score = Better asthma control A different small study reported asthma control on ACT and ACQ (see Analysis 1.6). |
| Adverse events (all) | Included trials did not measure or report any adverse events. | ‐ | ‐ | ‐ | |||
| *The risk in the intervention group (and its 95% confidence interval) is based on the assumed risk in the comparison group and the relative effect of the intervention (and its 95% CI). | |||||||
| GRADE Working Group grades of evidence. | |||||||
| aRisk of performance and detected bias. Downgraded once. bOne study. Confidence intervals include possible harm and benefit of intervention. Downgraded once. cOnly quality of life subscales reported. Downgraded once for indirectness. dAlthough the mean difference for this scale lies below the MCID, the responder analysis suggests that significantly more people achieved the MCID change with the intervention. No downgrade. eAdherence calculated using continuous medication acquisition from pharmacy data. This is a proxy measure and may overestimate true adherence. Downgraded once. fOne study. Confidence intervals very wide and include possible harm and benefit of intervention. Downgraded twice. | |||||||
| Study ID | Country | Population | Age (years) | Design | Intervention | Aimed at | Control |
| USA | 74 physicians; 637 children | 1 to 12 | Cluster RCT | SDM seminars | HCPs | Usual care | |
| USA | 60 families | 6 to 12 | Individual RCT | SDM portal | HCPs and patients/parents | Usual care + decision support | |
| Holland | 33 children | 6 to 12 | Cluster RCT | SDM online tool | HCPs and patients/parents | Enhanced usual care | |
| USA | 612 adults | 18 to 65 | Individual RCT | SDM structured sessions | HCPs | 1. Guideline‐led decision‐making 2. Usual care | |
| HCP: healthcare provider; RCT: randomised controlled trial; SDM: shared decision‐making. | |||||||
| Was/did the clinician: | SDM | Control | P value (GEEa) |
| Reassuring and encouragingb | 4.63 | 4.42 | 0.006 |
| Look into how family managed | 3.98 | 3.69 | 0.02 |
| Describe how child should be fully | 71.% | 59% | 0.007 |
| Describe at least 1 of 3 goals: | 75% | 64% | 0.07 |
| Give information to relieve specific | 4.1 | 3.9 | 0.007 |
| Enable family to know how to make | 4.3 | 4.2 | 0.07 |
| aGEE method to assess "Time2" (follow‐up) scores with baseline scores and group assignment as covariates in regression models. NB: A total of 472 parents were followed up; numbers in each group are not given. | |||
| Outcome or subgroup title | No. of studies | No. of participants | Statistical method | Effect size |
| 1 Quality of life improvement (AQLQ responders) Show forest plot | 1 | Odds Ratio (M‐H, Random, 95% CI) | Totals not selected | |
| 2 Quality of life scores (ITG‐ASF) Show forest plot | 1 | Mean Difference (IV, Random, 95% CI) | Totals not selected | |
| 2.1 ITG‐ASF night‐time symptom scale | 1 | Mean Difference (IV, Random, 95% CI) | 0.0 [0.0, 0.0] | |
| 2.2 ITG‐ASF daytime symptom scale | 1 | Mean Difference (IV, Random, 95% CI) | 0.0 [0.0, 0.0] | |
| 2.3 ITG‐ASF functional limitation scale | 1 | Mean Difference (IV, Random, 95% CI) | 0.0 [0.0, 0.0] | |
| 3 Quality of life scores (mini‐AQLQ) Show forest plot | 1 | Mean Difference (IV, Random, 95% CI) | Totals not selected | |
| 4 Medication adherence Show forest plot | 1 | Mean Difference (IV, Random, 95% CI) | Totals not selected | |
| 4.1 All medications | 1 | Mean Difference (IV, Random, 95% CI) | 0.0 [0.0, 0.0] | |
| 4.2 ICS only | 1 | Mean Difference (IV, Random, 95% CI) | 0.0 [0.0, 0.0] | |
| 5 Exacerbations of asthma Show forest plot | 1 | Odds Ratio (M‐H, Random, 95% CI) | Totals not selected | |
| 5.1 Requiring hospital admission | 1 | Odds Ratio (M‐H, Random, 95% CI) | 0.0 [0.0, 0.0] | |
| 5.2 Requiring ED visit | 1 | Odds Ratio (M‐H, Random, 95% CI) | 0.0 [0.0, 0.0] | |
| 5.3 Requiring specialist visit | 1 | Odds Ratio (M‐H, Random, 95% CI) | 0.0 [0.0, 0.0] | |
| 5.4 Requiring GP visit | 1 | Odds Ratio (M‐H, Random, 95% CI) | 0.0 [0.0, 0.0] | |
| 6 Asthma well controlled Show forest plot | 2 | Odds Ratio (Fixed, 95% CI) | Totals not selected | |
| 6.1 ACQ < 1 | 1 | Odds Ratio (Fixed, 95% CI) | 0.0 [0.0, 0.0] | |
| 6.2 ACT > 22 | 1 | Odds Ratio (Fixed, 95% CI) | 0.0 [0.0, 0.0] | |
| 6.3 ATAQ = 0 | 1 | Odds Ratio (Fixed, 95% CI) | 0.0 [0.0, 0.0] | |