Fluvastatin zur Lipidsenkung
Abstract
Background
Fluvastatin is thought to be the least potent statin on the market, however, the dose‐related magnitude of effect of fluvastatin on blood lipids is not known.
Objectives
Primary objective
To quantify the effects of various doses of fluvastatin on blood total cholesterol, low‐density lipoprotein (LDL cholesterol), high‐density lipoprotein (HDL cholesterol), and triglycerides in participants with and without evidence of cardiovascular disease.
Secondary objectives
To quantify the variability of the effect of various doses of fluvastatin.
To quantify withdrawals due to adverse effects (WDAEs) in randomised placebo‐controlled trials.
Search methods
The Cochrane Hypertension Information Specialist searched the following databases for randomised controlled trials up to February 2017: the Cochrane Central Register of Controlled Trials (CENTRAL) (2017, Issue 1), MEDLINE (1946 to February Week 2 2017), MEDLINE In‐Process, MEDLINE Epub Ahead of Print, Embase (1974 to February Week 2 2017), the World Health Organization International Clinical Trials Registry Platform, CDSR, DARE, Epistemonikos and ClinicalTrials.gov. We also contacted authors of relevant papers regarding further published and unpublished work. No language restrictions were applied.
Selection criteria
Randomised placebo‐controlled and uncontrolled before and after trials evaluating the dose response of different fixed doses of fluvastatin on blood lipids over a duration of three to 12 weeks in participants of any age with and without evidence of cardiovascular disease.
Data collection and analysis
Two review authors independently assessed eligibility criteria for studies to be included, and extracted data. We entered data from placebo‐controlled and uncontrolled before and after trials into Review Manager 5 as continuous and generic inverse variance data, respectively. WDAEs information was collected from the placebo‐controlled trials. We assessed all trials using the 'Risk of bias' tool under the categories of sequence generation, allocation concealment, blinding, incomplete outcome data, selective reporting, and other potential biases.
Main results
One‐hundred and forty‐five trials (36 placebo controlled and 109 before and after) evaluated the dose‐related efficacy of fluvastatin in 18,846 participants. The participants were of any age with and without evidence of cardiovascular disease, and fluvastatin effects were studied within a treatment period of three to 12 weeks. Log dose‐response data over doses of 2.5 mg to 80 mg revealed strong linear dose‐related effects on blood total cholesterol and LDL cholesterol and a weak linear dose‐related effect on blood triglycerides. There was no dose‐related effect of fluvastatin on blood HDL cholesterol. Fluvastatin 10 mg/day to 80 mg/day reduced LDL cholesterol by 15% to 33%, total cholesterol by 11% to 25% and triglycerides by 3% to 17.5%. For every two‐fold dose increase there was a 6.0% (95% CI 5.4 to 6.6) decrease in blood LDL cholesterol, a 4.2% (95% CI 3.7 to 4.8) decrease in blood total cholesterol and a 4.2% (95% CI 2.0 to 6.3) decrease in blood triglycerides. The quality of evidence for these effects was judged to be high. When compared to atorvastatin and rosuvastatin, fluvastatin was about 12‐fold less potent than atorvastatin and 46‐fold less potent than rosuvastatin at reducing LDL cholesterol. Very low quality of evidence showed no difference in WDAEs between fluvastatin and placebo in 16 of 36 of these short‐term trials (risk ratio 1.52 (95% CI 0.94 to 2.45).
Authors' conclusions
Fluvastatin lowers blood total cholesterol, LDL cholesterol and triglyceride in a dose‐dependent linear fashion. Based on the effect on LDL cholesterol, fluvastatin is 12‐fold less potent than atorvastatin and 46‐fold less potent than rosuvastatin. This review did not provide a good estimate of the incidence of harms associated with fluvastatin because of the short duration of the trials and the lack of reporting of adverse effects in 56% of the placebo‐controlled trials.
PICO
Laienverständliche Zusammenfassung
Fluvastatin zur Lipidsenkung
Fragestellung
Welche Wirkung haben verschiedene Dosen von Fluvastatin auf Blutfette (Blutlipide)?
Die Wirkungen verschiedener Dosen von Fluvastatin auf Blutfette wurden in 145 Studien quantifiziert.
Hintergrund
Man nimmt an, dass Fluvastatin das Statin mit der geringsten Wirksamkeit ist, aber die genaue dosisabhängige Wirkung von Fluvastatin auf Blutfette ist unbekannt. Es wäre interessant zu wissen, um wieviel Fluvastatin in den 145 gefundenen Studien die Blutfette senkt.
Recherchedatum
Die Evidenz ist auf dem Stand von Februar 2017.
Studienmerkmale
Randomisierte placebokontrollierte und unkontrollierte Vorher‐Nachher‐Studien mit verschiedenen, konstanten Fluvastatindosen. Die Studien dauerten drei bis zwölf Wochen.
Die Teilnehmer konnten jeden Alters und Geschlechts mit oder ohne Anzeichen von Herz‐Kreislauf‐Erkrankungen sein.
Die 145 eingeschlossenen Studien umfassten 18.846 Teilnehmer.
Hauptergebnisse
Fluvastatin als 10 mg / Tag bis 80 mg / Tag reduzierte das LDL‐Cholesterin um 15% bis 33%. Es gab starke lineare dosisabhängige Wirkungen auf das Gesamtcholesterin und LDL‐Cholesterin im Blut und eine schwache lineare dosisabhängige Wirkung auf Triglyceride im Blut. Es gab keine dosisabhängige Wirkung von Fluvastatin auf das HDL‐Cholesterin im Blut.
Basierend auf der Wirkung auf das LDL‐Cholesterin ist Fluvastatin 12‐fach weniger wirksam als Atorvastatin und 46‐fach weniger wirksam als Rosuvastatin.
Von den 36 placebokontrollierten Studien berichteten nur 16 über Studienabbrüche aufgrund von unerwünschten Wirkungen. Solche Studienabbrüche waren höher, relatives Risiko 1,52 (95% ‐Konfidenzintervall (CI) 0,94 bis 2,45), was Ungewissheit, aber die Möglichkeit eines Anstiegs der unerwünschten Wirkungen zeigt.
Qualität der Evidenz
Die Qualität der Evidenz war für die Blutfettwerte hoch. Für Studienabbrüche aufgrund von unerwünschten Wirkungen war die Qualität der Evidenz sehr niedrig, da 20 (55,6%) von 36 placebokontrollierten Studien nicht über solche Abbrüche berichteten.
Authors' conclusions
Summary of findings
| LDL cholesterol lowering efficacy of fluvastatin | ||||||
| Patient or population: participants with normal or abnormal lipid profiles Settings: ambulatory care Intervention: fluvastatin Comparison: LDL cholesterol percentage change from baseline for all trials | ||||||
| Outcomes | Anticipated absolute effects mmol/L (95%CI) | Percent reduction % | No of Participants | Quality of the evidence | Comments | |
| Before exposure to fluvastatin1 | After exposure to fluvastatin | |||||
| LDL‐cholesterol fluvastatin 10 mg/day | 4.81 (4.44 to 5.17) | 4.08 (3.98 to 4.16) | 15.2 (17.1 to 13.4) | 595 | ⊕⊕⊕⊕ | Effect predicted from log dose‐response equation is 14.8%. Randomised and before and after design not different P = 0.94. |
| LDL‐cholesterol fluvastatin 20 mg/day | 4.87 (4.54 to 5.21) | 3.90 (3.88 to 3.91) | 20.0 (19.7 to 20.3) | 9010 | ⊕⊕⊕⊕ | Effect predicted from log dose‐response equation is 20.8%. Randomised and before and after design not different P = 0.16. |
| LDL‐cholesterol fluvastatin 40 mg/day | 4.74 (4.41 to 5.06) | 3.51 (3.48 to 3.54) | 25.9 (25.3 to 26.5) | 3658 | ⊕⊕⊕⊕ | Effect predicted from log dose‐response equation is 26.8%. Randomised and before and after design not different P = 0.58. |
| LDL‐cholesterol fluvastatin 80 mg/day | 4.80 (4.47 to 5.13) | 3.13 (3.10 to 3.15) | 34.9 (35.5 to 34.3) | 4928 | ⊕⊕⊕⊕ | Effect predicted from log dose‐response equation is 32.8%. Randomised and before and after design not different P = 0.07. |
| CI: Confidence interval | ||||||
| GRADE Working Group grades of evidence | ||||||
| 1. Mean baseline values. | ||||||
| Total cholesterol lowering efficacy of fluvastatin | ||||||
| Patient or population: participants with normal or abnormal lipid profiles Settings: ambulatory care Intervention: fluvastatin Comparison: Total cholesterol percentage change from baseline for all trials | ||||||
| Outcomes | Anticipated absolute effects mmol/L (95%CI) | Percent reduction % | No of Participants | Quality of the evidence | Comments | |
| Before exposure to fluvastatin1 | After exposure to fluvastatin | |||||
| Total cholesterol fluvastatin 10 mg/day | 6.90 (6.47 to 7.33) | 6.16 (6.02 to 6.30) | 10.7 (12.7 to 8.6) | 287 | ⊕⊕⊕⊕ | Effect predicted from log dose‐response equation is 10.9%. Randomised and before and after design not different P = 0.86. |
| Total cholesterol fluvastatin 20 mg/day | 6.99 (6.61 to 7.37) | 5.96 (5.94 to 5.98) | 14.8 (15.1 to 14.5) | 6309 | ⊕⊕⊕⊕ | Effect predicted from log dose‐response equation is 15.2%. Randomised versus before and after design borderline different P = 0.044. |
| Total cholesterol fluvastatin 40 mg/day | 6.91 (6.54 to 7.27) | 5.60 (5.57 to 5.64) | 18.9 (19.3 to 18.4) | 2966 | ⊕⊕⊕⊕ | Effect predicted from log dose‐response equation is 19.4%. Randomised and before and after design not different P = 0.106. |
| Total cholesterol fluvastatin 80 mg/day | 6.97 (6.62, 7.32) | 5.24 (5.12 to 5.27) | 24.9 (25.5 to 24.4) | 3943 | ⊕⊕⊕⊕ | Effect predicted from log dose‐response equation is 23.6%. Randomised and before and after design not different P = 0.595. |
| CI: Confidence interval | ||||||
| GRADE Working Group grades of evidence | ||||||
| 1. Mean baseline values. | ||||||
| Triglyceride lowering efficacy of fluvastatin | ||||||
| Patient or population: participants with normal or abnormal lipid profiles Settings: ambulatory care Intervention: fluvastatin Comparison: Triglyceride percentage change from baseline for all trials | ||||||
| Outcomes | Anticipated absolute effects mmol/L (95%CI) | Percent Reduction % | No of Participants | Quality of the evidence | Comments | |
| Before exposure to fluvastatin1 | After exposure to fluvastatin | |||||
| Triglycerides fluvastatin 10 mg/day | 1.93 (1.63 to 2.22) | 1.87 (1.73 to 2.01) | 3.0 (10.1 to ‐4.2) | 259 | ⊕⊕⊕⊕ | Effect predicted from log dose‐response equation is 5.2%. Only RCT data. |
| Triglycerides fluvastatin 20 mg/day | 1.98 (1.68 to 2.28) | 1.76 (1.74 to 1.77) | 11.1 (11.8 to 10.3) | 7510 | ⊕⊕⊕⊕ | Effect predicted from log dose‐response equation is 9.4%. Randomised and before and after design not different P = 0.277. |
| Triglycerides fluvastatin 40 mg/day | 1.94 (1.70 to 2.17) | 1.72 (1.69 to 1.75) | 11.1 (12.6 to 9.6) | 2646 | ⊕⊕⊕⊕ | Effect predicted from log dose‐response equation is 13.6% Randomised and before and after design not different P = 0.186. |
| Triglycerides fluvastatin 80 mg/day | 1.92 (1.67 to 2.17) | 1.59 (1.56 to 1.62) | 17.5 (19.1 to 15.9) | 3623 | ⊕⊕⊕⊕ | Effect predicted from log dose‐response equation is 17.7% Randomised and before and after design not different P = 0.496. |
| CI: Confidence interval | ||||||
| GRADE Working Group grades of evidence | ||||||
| 1. Mean baseline values. | ||||||
| Withdrawal due to adverse events due to fluvastatin | ||||||
| Patient or population: participants with normal or abnormal lipid profiles Settings: ambulatory care Intervention: fluvastatin Comparison: WDAEs fluvastatin versus placebo | ||||||
| Outcomes | Illustrative Comparative Risks* (95%CI) | Relative effect | No of Participants | Quality of the evidence | Comments | |
| Assumed risk | Corresponding risk | |||||
| placebo | fluvastatin | |||||
| WDAEs within 3‐12 weeks | RR 1.52 (0.94 to 2.45) | 3023 | ⊕⊝⊝⊝ | only 16 out of 36 placebo controlled trials reported withdrawals due to adverse effects. | ||
| 18 per 1000 | 27 per 1000 (17 to 44) | |||||
| *The basis for the assumed risk is the measure of absolute effect with the placebo group. The corresponding risk (and its 95% confidence interval) is based on the assumed risk in the comparison group and the relative effect of the intervention (and its 95% CI). CI: Confidence interval; RR: Risk Ratio | ||||||
| GRADE Working Group grades of evidence | ||||||
| 1. Downgraded 2 levels due to high risk of selective reporting and other biases. 2. Downgraded 1 level due to wide confidence intervals. | ||||||
Background
Description of the condition
Cardiovascular disease is the major cause of death and disability in the developed world (Eisenberg 1998). Existing evidence shows a weak association in young adults between adverse cardiovascular events and concentration of total cholesterol or low‐density lipoprotein (LDL) cholesterol in the serum (NCEP 1993).
The current recommended treatment for secondary prevention of adverse cardiovascular events after diet and lifestyle changes is drug therapy with the drug class widely known as "statins".
Description of the intervention
Fluvastatin is the least potent widely prescribed statin in the world. Fluvastatin and the seven other statins are prescribed to prevent adverse cardiovascular events and to lower total cholesterol and LDL cholesterol. Importantly, statins have been shown in individual randomised controlled trials (RCTs), and in a systematic review and meta‐analysis of RCTs to reduce mortality and major vascular events in people with occlusive vascular disease (CTT 2005).
How the intervention might work
Statins act on the liver by inhibiting the rate‐limiting enzyme for cholesterol synthesis, 3‐hydroxy‐3‐methyl‐glutaryl‐CoA (HMG Co‐A) reductase. This enzyme is the first step in a sequence of reactions resulting in the production of cholesterol and its derivatives, LDL cholesterol and very low‐density lipoprotein (VLDL cholesterol) particles. The prevailing hypothesis is that statins reduce mortality and morbidity in people with occlusive vascular disease by reducing the production of cholesterol. However, the HMG Co‐A reductase enzyme is also responsible for the production of coenzyme Q₁₀, vitamin D, steroid hormones, and many other compounds. It therefore remains possible that the beneficial effects of statins are due to an action other than the reduction of cholesterol, often referred to as the pleiotropic effects of statins (Liao 2005).
Most important for this review is the fact that a fasting blood lipid profile consisting of total cholesterol, LDL cholesterol, HDL cholesterol, and triglycerides is used clinically to monitor the effect of a prescribed statin. The outcome therefore in this review, presented as the percentage reduction in the five serum lipids, represents the best available pharmacological marker of the magnitude of the statin effect.
Why it is important to do this review
Statins are the most widely prescribed class of drugs in the world. Statin prescribing and the average prescribed doses are increasing. Clinicians currently have an approximate sense of the different potency of the different statins, but a systematic assessment of the potency, the slope of the dose‐response relationship, and the variability of the effect has not been completed for any of the statins. It is possible that in addition to differences in potency, the slope of the dose‐response relationship or the variability of response differs between different statins. A small number of previous systematic reviews have assessed the effect of statins on serum lipids (Bandolier 2004; Edwards 2003; Law 2003; Ward 2007). They have demonstrated that different statins have different potencies in terms of lipid lowering, and that higher doses of statins cause greater lowering of serum lipids than lower doses (Kellick 1997; Schaefer 2004; Schectman 1996). However, none of these systematic reviews has calculated the slope of the dose response or the variability of effect, and none of them is up‐to‐date. The most comprehensive systematic review to date (Law 2003) has the limitation that it presents the data based on the average reduction in LDL cholesterol concentration rather than on the percentage reduction from baseline. The purpose of our systematic review is to build on Law's work. Since fluvastatin is the least potent statin, we have chosen this as the third drug to study in this class, to complement the reviews we published on the lipid‐lowering efficacy of atorvastatin (Adams 2014) and rosuvastatin (Adams 2015). We used the surrogate marker to measure the pharmacological effect of statins, the percentage reduction from baseline, to describe the dose‐response relationship of the effect of fluvastatin on total cholesterol, LDL cholesterol, HDL cholesterol, and triglycerides. We plan to use the methodology established for atorvastatin (Adams 2014) and rosuvastatin (Adams 2015) to study the other drugs in the class (cerivastatin, lovastatin, pravastatin, simvastatin, and pitavastatin) in subsequent reviews, and to compare the results with fluvastatin, rosuvastatin and atorvastatin.
Objectives
Primary objective
To quantify the effects of various doses of fluvastatin on the surrogate markers: blood total cholesterol, LDL cholesterol, triglycerides and HDL cholesterol in people with and without evidence of cardiovascular disease.
We recognise that the outcomes important to patients are mortality and cardiovascular morbidity, however, that is not the objective of this systematic review. We want to learn more about the pharmacology of fluvastatin by characterising the dose‐related effect and variability of the effect of fluvastatin on the surrogate markers.
Secondary objective
To quantify the variability of the effect of various doses of fluvastatin on withdrawals due to adverse effects (WDAEs).
Methods
Criteria for considering studies for this review
Types of studies
Randomised placebo‐controlled trials. We have also included uncontrolled before and after trials because it has been shown that there is no placebo effect of statins on lipid parameters. Therefore in this case a placebo control is not essential (Tsang 2002). We did not include cross‐over trials, but if the outcomes were reported for the parallel arms prior to the cross‐over we did include that data.
Types of participants
Participants could be of any age, with and without evidence of cardiovascular disease. They could have normal lipid parameters or any type of hyperlipidaemia or dyslipidaemia. We accepted participants with various comorbid conditions, including type 2 diabetes mellitus, hypertension, metabolic syndrome, chronic renal failure or cardiovascular disease.
Types of interventions
Fluvastatin must have been administered at a constant daily dose compared to placebo or alone for a period of three to 12 weeks. We have chosen this administration time window to allow at least three weeks for a steady‐state effect of fluvastatin to occur and to keep it short enough to minimise participants dropping out. We included studies where fluvastatin was administered once daily in the morning or evening, twice daily or where it was not specified. Trials required a washout baseline dietary stabilisation period of at least three weeks, where all previous lipid‐altering medication was withdrawn. This baseline phase ensured participants follow a standard lipid‐regulating diet and helped to stabilise baseline lipid values prior to treatment. In trials where participants were not receiving lipid‐altering medications or dietary supplements before receiving the test drug, we did not require washout baseline dietary stabilisation periods.
Types of outcome measures
Fluvastatin 10 mg/day, 20 mg/day, 40 mg/day and 80 mg/day are the doses predominantly prescribed. Because of this and because most of the trials studied these doses we have presented these doses in the 'Summary of findings' tables.
Lipid parameters: For the placebo‐controlled trials we present the mean percentage change from baseline for different doses of fluvastatin minus the mean percentage change from baseline with placebo for each of the lipid parameters below. For the before and after trials we present the mean percentage change from baseline of different doses of fluvastatin. RCT data and before and after data were combined because it was shown for most data that there was a lack of difference in the mean differences between the two types of studies.
Primary outcomes
-
LDL cholesterol.
Secondary outcomes
-
Total cholesterol.
-
HDL cholesterol.
-
Triglycerides.
-
End of treatment variability (standard deviation (SD)) and coefficient of variation of LDL cholesterol measurements for each dose of fluvastatin. It is important to know whether fluvastatin has an effect on the variability of lipid measures and ultimately to compare this with the effect of other statins.
-
Withdrawals due to adverse effects (WDAEs) limited to the placebo‐controlled trials.
Search methods for identification of studies
Electronic searches
The Cochrane Hypertension Information Specialist conducted systematic searches in the following databases for randomised controlled trials (RCTs) without language, publication year or publication status restrictions:
-
the Cochrane Central Register of Controlled Trials (CENTRAL) via the Cochrane Register of Studies (CRS‐Web) (searched 10 February 2017);
-
MEDLINE Ovid (1946 to February Week 2 2017), MEDLINE Ovid Epub Ahead of Print, and MEDLINE Ovid In‐Process & Other Non‐Indexed Citations (searched 10 February 2017);
-
Embase Ovid (searched 10 February 2017);
-
ClinicalTrials.gov (www.clinicaltrials.gov) searched 10 February 2017);
-
World Health Organization International Clinical Trials Registry Platform (www.who.int/trialsearch) searched 10 February 2017).
The Information Specialist modelled subject strategies for databases on the search strategy designed for MEDLINE. We present search strategies for major databases in Appendix 1.
Searching other resources
-
The Cochrane Hypertension Information Specialist searched the Cochrane Database of Systematic Reviews (CDSR) via Wiley, the Database of Abstracts of Reviews of Effects (DARE) via Wiley, and Epistemonikos to retrieve existing systematic reviews relevant to this systematic review, so that we could scan their reference lists for additional trials.
-
We checked the bibliographies of included studies and any relevant systematic reviews identified for further references to relevant trials.
-
We contacted experts/organisations in the field to obtain additional information on relevant trials.
-
We contacted original authors for clarification and further data if trial reports were unclear.
-
We performed an initial search of Web of Science on 4 April 2016 and omitted this database from subsequent searches, as it did not yield any unique included studies.
We included grey literature by searching other resources:
-
ProQuest Dissertations and Theses (search.proquest.com/pqdtft/);
-
Novartis (www.novartis.ca/products/en/pharmaceuticals‐az.shtml);
-
US Food and Drug Administration (www.fda.gov/);
-
European Patent Office (worldwide.espacenet.com.
Data collection and analysis
Selection of studies
Initial selection of trials involved retrieving and reading the titles and abstracts of each paper found from the electronic search databases or bibliographic citations. We have provided a PRISMA flow diagram (Figure 1). Two review authors (SA and SS) analysed the full‐text papers independently, to decide on the trials to be included. We resolved disagreements by recourse to a third review author (JMW). Two review authors (SA and SS) independently extracted the appropriate data from each of the included trials. If there was disagreement over a value, we reached consensus by data recalculation to determine the correct value.

Fluvastatin flow diagram
Data extraction and management
We directly extracted the mean percentage change from the data or calculated it from the baseline and endpoint values. We added the calculated data to the Data and analyses section of the review. When the calculated data differed from the given data by more than 10%, we judged the data set as not being reliable and these data were not included in the review. We extracted standard deviations (SDs) and standard errors (SEs) from the report or calculated them when possible. We entered data from placebo‐controlled and uncontrolled before and after trials into Review Manager 5 (RevMan 2014) as continuous and generic inverse variance data, respectively.
Assessment of risk of bias in included studies
We assessed all trials using the 'Risk of bias' tool under the categories of adequate sequence generation, allocation concealment, blinding, incomplete outcome data, selective reporting, and other potential biases. We appreciate that the first three items are inappropriate for before and after trials and that this is a limitation. However, because the lipid parameters were measured in a remote laboratory they were considered unlikely to be affected by the trial design. We produced 'Risk of bias' tables' as outlined in the Cochrane Handbook for Systematic Reviews of Interventions, Chapter 8 (Higgins 2011).
Measures of treatment effect
We analysed the treatment effects as mean difference for each dose in the placebo‐controlled RCTs and generic inverse variance for each dose in the before and after uncontrolled trials separately. In the event that the mean effects from the two trial designs were not different, we re‐analysed all efficacy study data using the generic inverse variance to determine the overall weighted treatment effects and their 95% confidence intervals (CIs) for serum total cholesterol, LDL cholesterol, HDL cholesterol, and triglycerides.
Unit of analysis issues
The unit of analysis is the mean values for the people completing the trial for each trial. We expected follow‐up to be reasonably high for these short‐term trials. The data however represent treatment efficacy and not real‐world effectiveness of fluvastatin on these lipid parameters.
Dealing with missing data
When data were missing, we requested them from the authors. The most common type of value that was not reported was the SD of the change.
In the case of a missing SD for the change in lipid parameters, we imputed the SD using the following hierarchy (listed from high to low preference).
-
SD calculated either from the t statistics corresponding to the exact P value reported or from the 95% CI of the mean difference between treatment groups.
-
Average weighted SD of the change from other trials in the review (Furukawa 2006).
Because it is common for the SD to be miscalculated, and in order not to overweight trials where it is inaccurately calculated and lower than expected, when SD values were less than 40% of the average weighted SDs, we used the imputed value by the method of Furukawa (Furukawa 2006).
Assessment of heterogeneity
The Chi2 test to identify heterogeneity is not appropriate because it has low power when there are few studies, but has excessive power to detect clinically unimportant heterogeneity when there are many studies. The I² is a better statistic. The I² calculates between‐study variance/(between‐study variance + within‐study variance). This measures the proportion of total variation in the estimate of the treatment effect that is due to heterogeneity between studies. This statistic is also independent of the number of studies in the analysis (Higgins 2002).
Assessment of reporting biases
We assessed publication bias using funnel plots, as outlined in the Cochrane Handbook for Systematic Reviews of Interventions, Chapter 10 (Sterne 2011).
Data synthesis
We entered all placebo‐controlled studies into Review Manager 5 (RevMan 2014) as mean difference fixed‐effect model data to determine the weighted treatment effect and 95% CIs for serum total cholesterol, LDL cholesterol, HDL cholesterol, and triglycerides. We entered all uncontrolled before and after studies as generic inverse variance fixed‐effect model data to determine the weighted treatment effect. If the effect in the placebo‐controlled trials was not statistically significantly different from the before and after trials, we entered all trials for each dose as generic inverse variance to determine the best overall weighted treatment effect for each dose.
If an I² was ≥50%, we used the random‐effects model to assess whether the pooled effect was statistically significant.
We recorded trial data of each study and dose in GraphPad Prism 4, to yield a weighted least squares analysis based on the inverse of the square of the standard error (SE) for each lipid parameter, to generate weighted log dose response curves. We entered the number of participants in placebo‐controlled trials who prematurely withdrew due to at least one adverse effect in Review Manager 5 (RevMan 2014) as dichotomous data for each dose and all combined doses of fluvastatin.
The relative potency of fluvastatin with respect to atorvastatin and rosuvastatin, was determined as the ratio of the milligram (mg) amount of fluvastatin to the mg amount of atorvastatin or rosuvastatin needed to produce the same specified effect. These values were calculated from the log dose response curves of fluvastatin, atorvastatin and rosuvastatin for total cholesterol, LDL cholesterol and triglycerides. The relative potencies were estimated from these dose ratios.
Data presentation ‐ ’Summary of findings’ tables
We used the Grading of Recommendations, Assessment, Development and Evaluation (GRADE) approach to assess the quality of the supporting evidence behind each estimate of treatment effect (Schünemann 2011a; Schünemann 2011b). We presented key findings of the review, including a summary of the amount of data, the magnitude of the effect size and the overall quality of the evidence, in summary of findings Table for the main comparison. We preselected the following outcomes: LDL cholesterol lowering efficacy of fluvastatin (by dose), and WDAEs.
Subgroup analysis and investigation of heterogeneity
The main subgroup analyses are the different doses of fluvastatin. We assessed heterogeneity using I² (Higgins 2002). If the I² was ≥ 50%, we attempted to identify possible causes for this by carrying out a number of planned subgroup analyses, provided there were sufficient numbers of trials (see below).
We analysed subgroups based on the following factors.
-
Placebo‐controlled trials versus before and after trials (described above).
-
Men versus women.
-
Morning administration time versus evening administration time.
-
Novartis funded versus non‐Novartis funded trials.
Sensitivity analysis
We conducted sensitivity analyses to assess the effect of different co morbidities, such as familial hyperlipidaemia, on the treatment effect. We compared the treatment effects as generic inverse variance between trials whose participants were reported to have type IIa or familial hypercholesterolaemia versus trials whose participants were not reported to have genetic hypercholesterolaemia. Trials were not included in the comparison if the participants had both familial and non‐familial hypercholesterolaemia. We conducted sensitivity analyses to assess the effect of different methods of dosing, such as twice daily versus single dose, on the treatment effect.
Results
Description of studies
This review included 145 trials involving 18,846 people. There were 109 before and after trials, 35 randomised double‐blind placebo‐controlled trials, one randomised single‐blind placebo‐controlled trial. The number of placebo and fluvastatin participants were 2925 and 15,921, respectively. The number of male and female participants reported in 125 of the 145 trials were 9836 and 8845, respectively. Participants could be of any age. There were 13 familial hypercholesterolaemia trials and 99 non‐familial hypercholesterolaemia trials.
Results of the search
Database searching identified a total of 10,530 records. After the duplicates were removed, 8085 records remained. The number of irrelevant records was 7776. From these remaining records, 309 were obtained as full‐text articles and assessed for eligibility. The number of excluded records with reasons was 79 trials. The final number of included studies was 145. (Figure 1).
Included studies
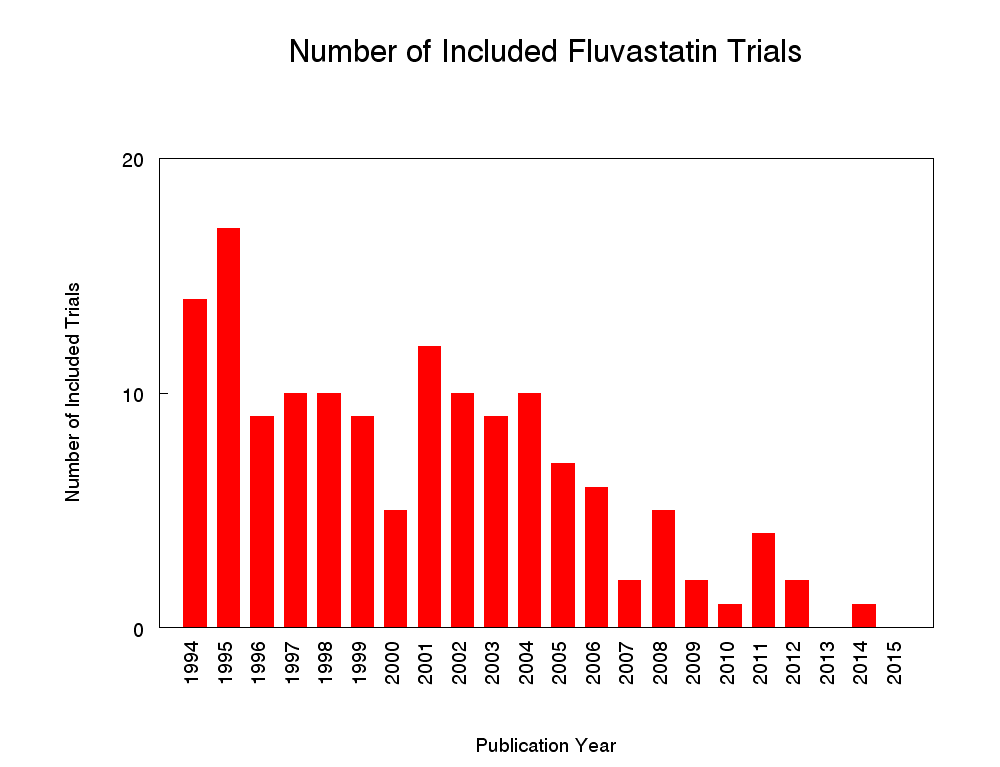
Two hundred and twenty citations to 145 trials met the inclusion criteria and had extractable data to evaluate the dose‐related blood lipid‐lowering effect of fluvastatin. Each included study is summarised in the Characteristics of included studies table. The publication languages of the 145 included studies were 119 (82.1%) English, seven (4.8%) Japanese, six (4.1%) Russian, three (2.1%) Chinese, three (2.1%) German, three (2.1%) Polish, one (0.7%) Czech, French, Hungarian and Spanish, respectively. Of the 36 placebo‐controlled trials, 33 (91.7%) were double‐blind, one (2.8%) was single‐blind, and two (5.6%) were open‐label trials. Trials evaluating the lipid‐altering efficacy of fluvastatin were first published in 1994. Between 1994 and 2014, the number of available studies increased and then decreased. The year with the most available studies was 1995 (Figure 2).

Number of included studies according to publication year
The baseline mean (range) lipid parameters were as follows: total cholesterol, 7.01 mmol/L (3.88 mmol/L to 10.52 mmol/L), 271 mg/dL (150 mg/dL to 407 mg/dL); LDL‐cholesterol, 4.93 mmol/L (2.07 mmol/L to 8.00 mmol/L), 191 mg/dL (80 mg/dL to 309 mg/dL); HDL‐cholesterol 1.24 mmol/L (0.87 mmol/L to 1.77 mmol/L), 47.9 mg/dL (33.6 mg/dL to 68.4 mg/dL) and triglycerides, 2.04 mmol/L (0.8 to mmol/L 5.9 mmol/L), 181 mg/dL (71 mg/dL to 523 mg/dL). Trials were available for the dose range of 2.5 mg to 80 mg fluvastatin daily and were sufficient to generate dose‐response regression lines for total cholesterol, LDL cholesterol and triglycerides (Figure 3; Figure 4; Figure 5).
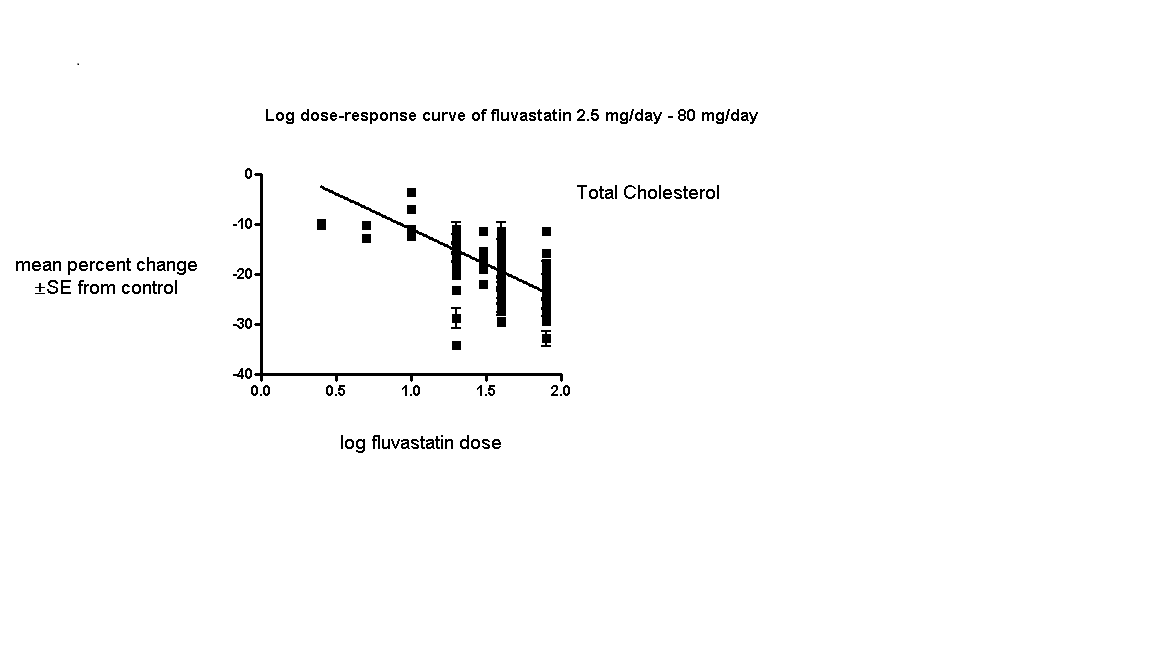
Log dose fluvastatin response curve for total cholesterol
Values represent the results of each trial for each dose comparison. The standard error bars cannot be seen because they all lie within the points

Log dose fluvastatin response curve for LDL cholesterol
Values represent the results of each trial for each dose comparison. The standard error bars cannot be seen because they all lie within the points

Log dose fluvastatin response curve for triglycerides
Values represent the results of each trial for each dose comparison. The standard error bars cannot be seen because they all lie within the points
Excluded studies
Seventy‐nine studies were excluded. Reasons for exclusion included confounding, inappropriate dosing, pooled data, attrition bias if more than 25% participants were not included in the efficacy analysis, inappropriate outcomes such as median percentage change from baseline or absolute change from baseline that could not be converted to percentage change from baseline, inadequate dietary baseline stabilisation period and combined data for all cross‐over periods. Trials in which participants were receiving drugs that affect blood lipid level concentrations, for example immunosuppressants such as cyclosporine and protease inhibitors such as ritonavir and indinavir were classified as excluded trials. The reasons for excluding each trial are listed in the Characteristics of excluded studies table.
Risk of bias in included studies
Sequence generation was not applicable to the 109 before‐and‐after trials. Of the 36 randomised placebo‐controlled trials, four (11.1%) were judged to have low risk of bias for sequence generation. The others were judged unclear.
Allocation
Allocation concealment was not applicable to the 109 before‐and‐after trials. The single‐blinded trial was judged a high risk of bias for this category. Of the 35 double‐blind randomised placebo‐controlled trials, three (8.6%) were judged a low risk of bias for allocation concealment.
Blinding
We judged the risk of performance and detection bias for lipid parameters to be low for all the trials as they were done in remote laboratories and unlikely to influenced by the investigators.
There was a high risk of detection bias of withdrawals due to adverse effects (WDAEs) assessment in the two open‐label randomised placebo‐controlled trials and in the single‐blind randomised placebo‐controlled trial. Of the 33 double‐blind randomised placebo‐controlled trials, six (18.2%) were judged a low risk of detection bias for WDAEs.
Incomplete outcome data
Incomplete outcome reporting leading to attrition bias was not a problem in this review as few participants were lost to follow‐up and were balanced across the groups in the placebo‐controlled trials. Overall, 91.9% of the participants completed the treatment.
Selective reporting
Out of 145 trials, 143 (98.6%) reported the primary lipid outcome LDL‐C, thus selection bias was not a potential source of bias for this outcome.
Out of 36 placebo‐controlled trials, only 16 (44.4%) reported WDAEs. The trials that did not report could have deliberately not done so because WDAEs were increased. Therefore, selective reporting bias was judged an important source of bias for this outcome. See 'Risk of bias' tables in Characteristics of included studies, and for the overall risk of bias, see (Figure 6).

'Risk of bias' graph: Summary of overall risk of bias for the lipid parameters according to each item.
Other potential sources of bias
The main other potential source of bias was industry funding. Out of the 145 trials, 48 (33.1%) reported funding by industry, 14 (9.7%) reported no industry funding and in 83 (57.2%) trials, the source of funding was not reported. Out of 48 industry funded trials, 35 (72.9%) were funded by Novartis, marketers of fluvastatin and 13 (27.1%) were funded by other pharmaceutical companies. The Novartis funded trials might be biased in favour of fluvastatin and would be expected to overestimate the treatment effect while trials funded by rival pharmaceutical companies might be biased against fluvastatin and be expected to underestimate the treatment effect. In trials where the source of funding was not reported, bias could be for or against fluvastatin. Novartis funded versus non‐Novartis funded LDL cholesterol efficacy data were available for the doses of 10 mg/day, 20 mg/day, 40 mg/day and 80 mg/day. These data were analysed separately using the generic inverse variance fixed‐effect model in RevMan 5. The sensitivity analysis revealed that the lipid‐lowering efficacy of fluvastatin in Novartis‐funded versus non‐Novartis funded trials were not different for most doses analysed; 10 mg/day (‐16.6% versus ‐16.2%; P = 0.94), 20 mg/day (‐19.77% versus ‐18.94%; P = 0.05), 40 mg/day (‐23.25% versus ‐25.65%; P = 0.007), and 80 mg/day (‐34.80% versus ‐33.88%; P = 0.28). Assessment for publication bias was done by reviewing the funnel plots for all lipid outcomes with 10 or more trials. None of these funnel plots suggested publication bias.
The determination of lipids in the blood samples were done by laboratories not connected to the trial personnel or participants, therefore we judged the overall risk of bias to be low for both the placebo‐controlled RCTs and for the before and after design trials (see Figure 6).
Effects of interventions
See: Summary of findings for the main comparison ; Summary of findings 2 ; Summary of findings 3 ; Summary of findings 4
See: summary of findings Table for the main comparison for the main comparison LDL‐cholesterol lowering efficacy of fluvastatin for all trials.
Overall efficacy of fluvastatin
Values from all data describing the efficacy of fluvastatin to lower the lipid parameters from placebo and before and after trials from the Data and analyses section were entered as generic inverse variance data separately into GraphPad Prism 4 to yield log dose‐response curves for placebo and before and after trials. To compare slope results of placebo‐controlled versus before and after trials, t‐tests from the formula t = (Placebo Slope‐Before and After Slope)/SQRT(SE2placebo slope+SE2before and after slope) were performed from the slopes and standard errors of the curves for total cholesterol, LDL cholesterol, HDL cholesterol and triglycerides. The results showed that for most lipid parameters there were no differences between placebo‐controlled trials and before and after trials for total cholesterol P = 0.118, LDL cholesterol P = 0.0077, HDL cholesterol P = 0.115 and triglycerides P = 0.624. This demonstrates that the two trial designs provide similar estimates of the lipid‐lowering efficacy of fluvastatin except for LDL cholesterol.
In addition, two‐tailed one sample t‐tests were performed from the placebo‐controlled trials to test for the difference between placebo mean effects and zero.The results of these tests demonstrated the placebo means were not different from zero except for the triglycerides: total cholesterol: 0.61 (95% CI ‐0.54 to 1.76) P = 0.3057, LDL cholesterol: 0.59 (95% CI ‐0.97 to 2.15) P = 0.4627, HDL cholesterol 0.68 (95%CI ‐1.116 to 2.47) P = 0.5028 and triglycerides: 5.59 (95%CI 2.51 to 8.68) P = 0.001. The triglyceride placebo mean appears to be different because blood triglyceride measurements are extremely variable and are not as reliable because there is a broad biological variability both within and among individuals. The evidence of lack of a placebo effect provided further justification for combining all the trials to determine the overall efficacy.
Validation for combining the results from the two trial designs was previously shown in the atorvastatin and rosuvastatin reviews (Adams 2014; Adams 2015).
Combining the results from the two trial designs was done by entering all data into the RevMan 5 using the generic inverse variance model outside of this review (data and analysis are not shown). The mean parameters from this analysis are summarised in Table 1.
| Fluvastatin dose (mg/day) | 2.5 | 5 | 10 | 20 | 30 | 40 | 80 |
| Total Cholesterol (mean percentage change from control) | ‐9.8 | ‐11.7 | ‐10.7 | ‐14.8 | ‐18.0 | ‐18.85 | ‐24.9 |
| 95% confidence interval | (‐12.0 to ‐7.7) | (‐14.2 to ‐9.2) | (‐12.7 to ‐8.6) | (‐15.1 to ‐14.5) | (‐19.2 to ‐16.7) | (‐19.3 to ‐18.4) | (‐25.4 to ‐24.4) |
| LDL‐Ca (mean percentage change from control) | ‐12.1 | ‐14.5 | ‐15.2 | ‐20.0 | ‐25.3 | ‐25.9 | ‐34.9 |
| 95% confidence interval | (‐14.2 to ‐10.1) | (‐16.3 to ‐12.7) | (‐17.1 to ‐13.3) | (‐20.3 to ‐19.7) | (‐26.9 to ‐23.7) | (‐26.5 to ‐25.3) | (‐35.5 to ‐34.3) |
| Triglycerides (mean percentage change from control) | ‐3.3 | ‐5.3 | ‐3.0 | ‐11.1 | ‐5.9 | ‐11.1 | ‐17.5 |
| 95% confidence interval | (‐14.6 to 8.0) | (‐13.1 to 2.5) | (‐10.1 to 4.2) | (‐11.8 to ‐10.3) | (‐20.1 to 8.3) | (‐12.6 to ‐9.6) | (‐19.1 to ‐15.9) |
aLDL‐C: low‐density lipoprotein cholesterol
Primary Outcome: LDL cholesterol
In total 143/145 (98.6%) trials and 18,606/18,846 (97%) participants contributed to the LDL cholesterol data analysis.
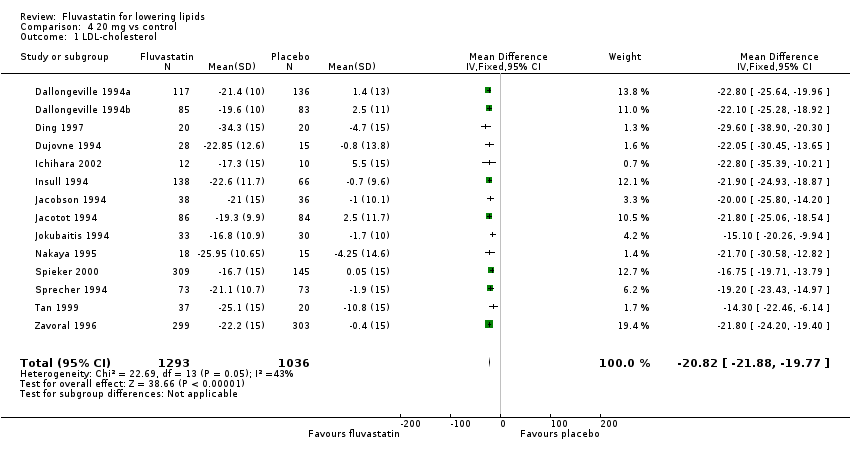
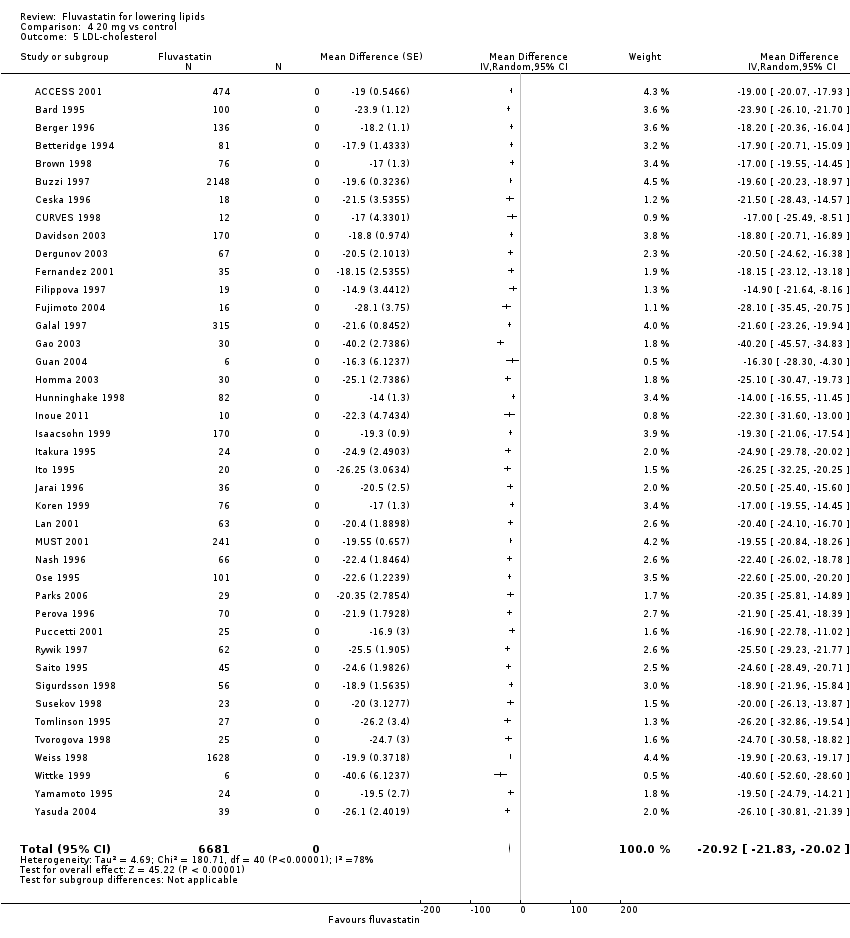
The effect of different doses of fluvastatin on LDL cholesterol are shown in the Data and analyses section (Analysis 1.1; Analysis 2.1; Analysis 2.2; Analysis 3.1; Analysis 4.1; Analysis 4.5; Analysis 5.1; Analysis 6.1; Analysis 6.5; Analysis 7.1; Analysis 7.5). The analysis for LDL cholesterol yielded the log dose‐response straight‐line equation, y = ‐19.98 log(x) + 5.181. This equation provides the best estimate of the mean reductions in blood LDL‐cholesterol from baseline for fluvastatin doses ranging from 2.5 mg/day to 80 mg/day as it uses all the available data. Using this formula, the calculated reductions in total blood LDL‐cholesterol for doses of 2.5 mg per day to 80 mg per day ranged from 2.8% to 32.8%. For every two‐fold dose increase there was a 6.01% (95% CI 5.43 to 6.60) percentage decrease in blood LDL cholesterol (Figure 4).
Secondary Outcome: Total cholesterol
In total 131/145 (90.3%) trials and 13,797/18,846 (73.2%) participants contributed to the total cholesterol data analysis.
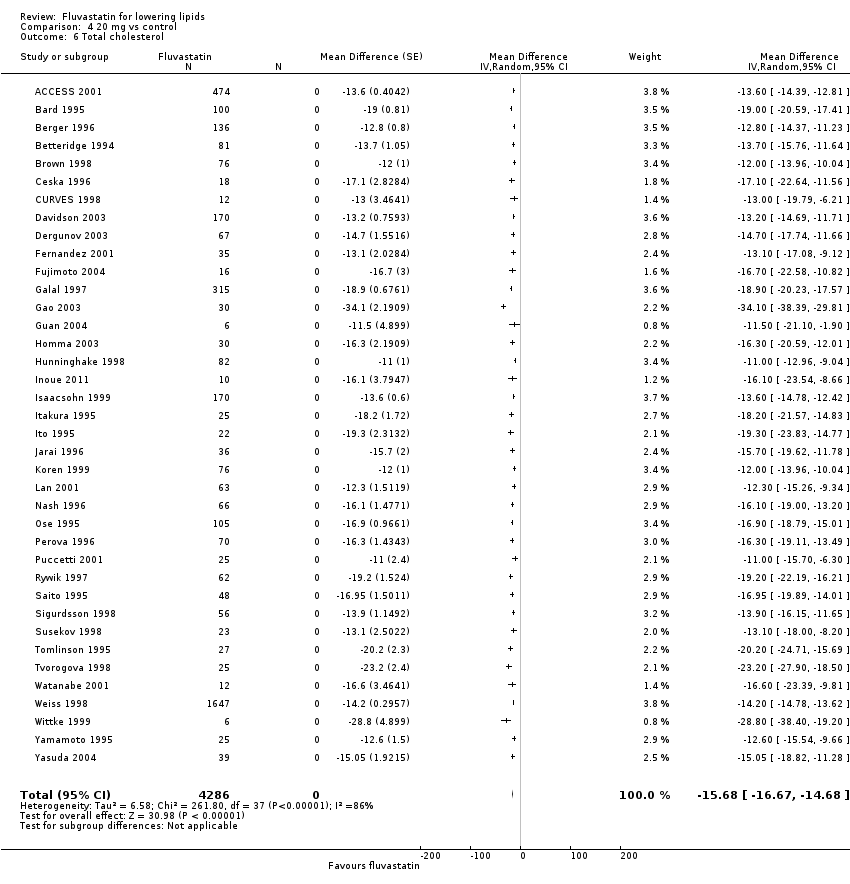
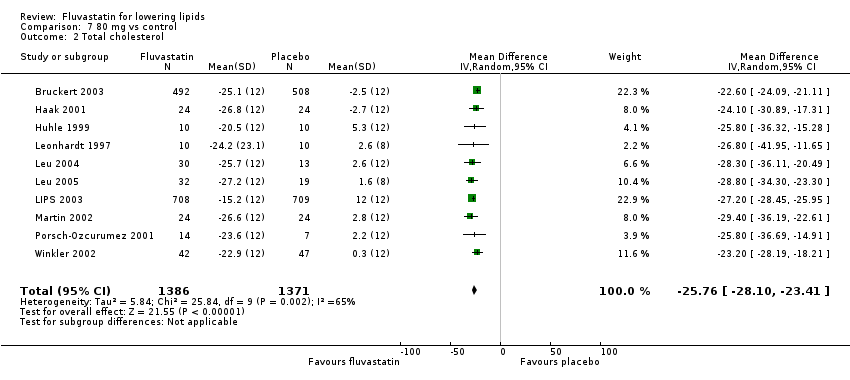
The effect of different doses of fluvastatin on total cholesterol are shown in the Data and analyses section (Analysis 3.2; Analysis 4.2; Analysis 4.6; Analysis 5.2; Analysis 6.2; Analysis 6.6; Analysis 7.2; Analysis 7.6). The analysis for total cholesterol yielded the log dose‐response straight‐line equation, y = ‐14.08 log(x) + 3.155. This equation provides the best estimate of the mean reductions in blood total cholesterol from baseline for fluvastatin doses ranging from 2.5 mg/day to 80 mg/day as it uses all the available data. Using this formula, the calculated reductions in total blood cholesterol for doses of 2.5 mg per day to 80 mg per day ranged from 2.45% to 23.6%. For every two‐fold dose increase there was a 4.24% (95% CI 3.68 to 4.8) percentage decrease in blood total cholesterol (Figure 3).
Secondary Outcome: HDL cholesterol
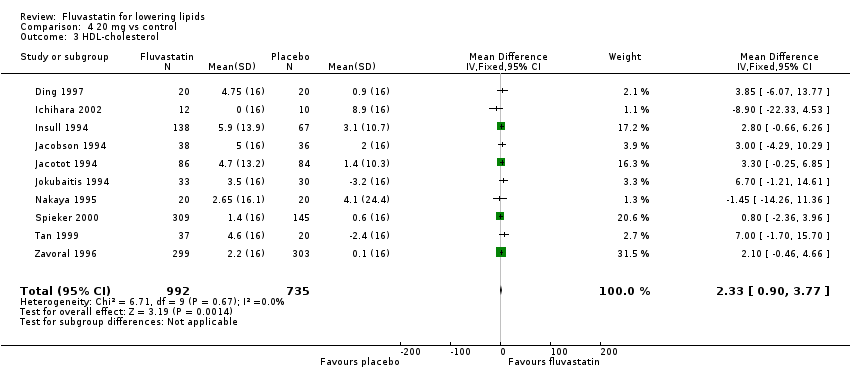
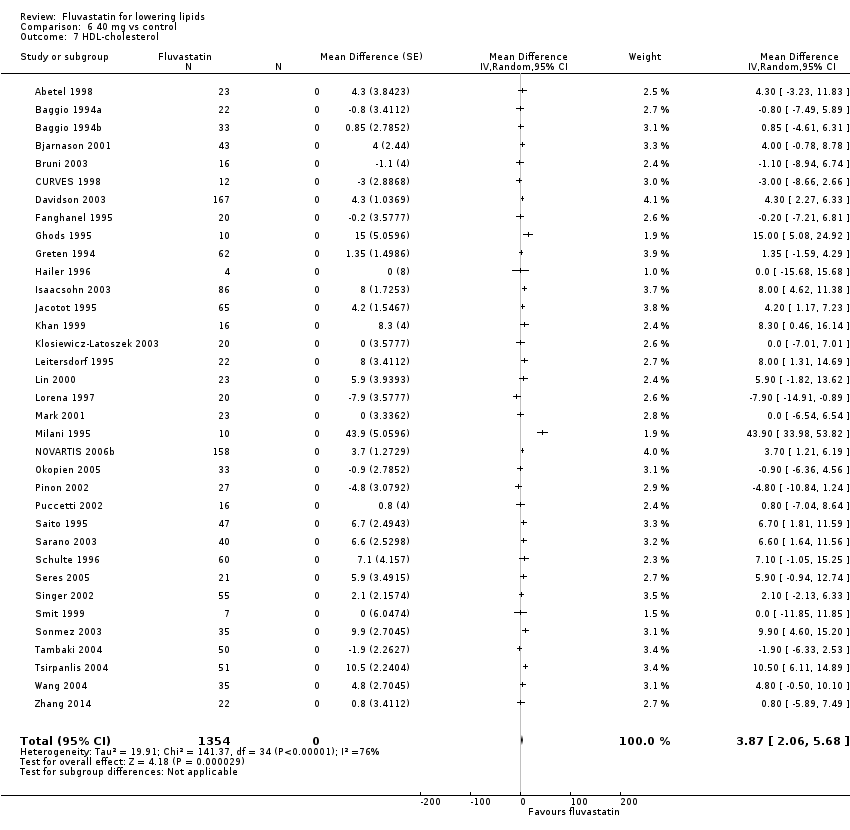
The GraphPad Prism 4 analysis showed that fluvastatin doses ranging from 2.5 mg/day to 80 mg/day had no dose‐related effect on blood HDL cholesterol. All doses of fluvastatin caused a small increase in HDL cholesterol. When all trials and doses were pooled using generic inverse variance the magnitude of the increase was 3.7% (95% CI 3.4 to 4.0).
Secondary Outcome: Triglycerides
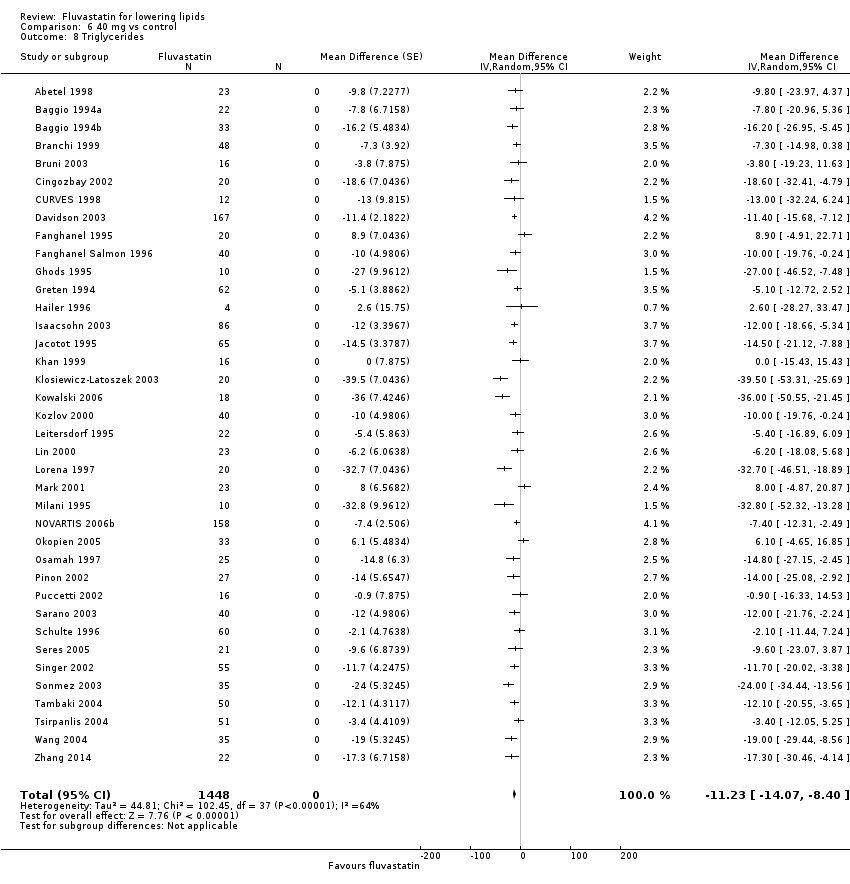
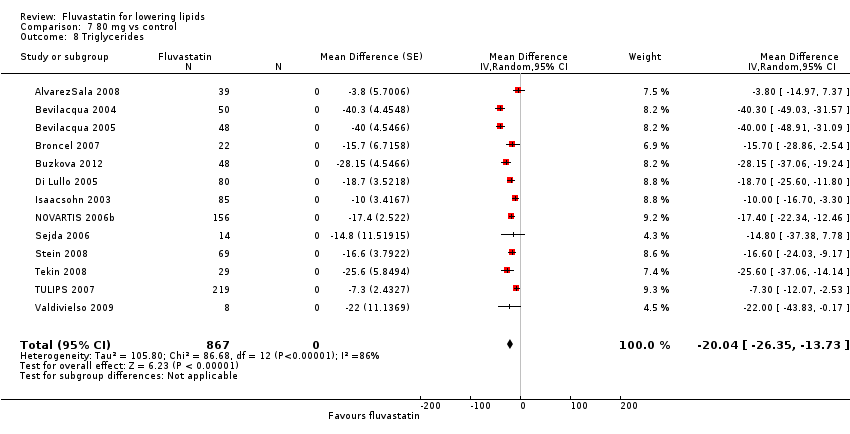
In total 112/145 (77.2%) trials and 14,324/18,846 (76%) participants contributed to the triglyceride data analysis. The effect of different doses of fluvastatin on triglycerides are shown in the Data and analyses section (Analysis 3.4; Analysis 4.4; Analysis 4.8; Analysis 6.4; Analysis 6.8; Analysis 7.4; Analysis 7.8). The analysis for triglycerides yielded the log dose‐response straight‐line equation, y = ‐13.83 log(x) + 8.602. This equation provides the best estimate of the mean reductions in blood triglycerides from baseline for fluvastatin doses ranging from 2.5 mg/day to 80 mg/day as it uses all the available data. Using this formula, the calculated reductions in total blood triglycerides for doses of 5 mg per day to 80 mg per day ranged from 1.1% to 17.7%. For every two‐fold dose increase there was a 4.16% (95% CI 1.98 to 6.34) percentage decrease in blood triglycerides (Figure 5).
Secondary Outcome: End of treatment variability
End‐of‐treatment variabilities of fluvastatin and placebo were compared to determine the effect of fluvastatin on variability of blood lipids when expressed as a co‐efficient of variation. Compared with placebo, fluvastatin (all doses) increased the co‐efficient of variation of blood LDL cholesterol (24.75 versus 30.1; P = 0.03 N = 55). Fluvastatin did not significantly affect the end‐of‐treatment variabilities of total cholesterol, HDL‐cholesterol and triglycerides.
Secondary Outcome: Withdrawal data
Sixteen (44.4%) of the 36 placebo‐controlled trials reported WDAEs during the three to 12 week treatment period. In seven trials, no participant discontinued treatment due to adverse effects or died during the study, therefore a risk ratio was not estimable. There was no fluvastatin dose‐response relationship for WDAEs. The effect of different doses of fluvastatin on withdrawal due to adverse effects (WDAEs) are shown in the Data and analyses section (Analysis 1.2; Analysis 2.3; Analysis 3.5; Analysis 4.9; Analysis 6.9; Analysis 7.9). WDAEs were not different between fluvastatin and placebo for any of the fluvastatin doses. The pooled estimate for all doses compared to placebo showed a risk ratio (RR) of 1.52 (95% CI 0.94 to 2.45) for WDAEs in these short‐term trials (Analysis 8.1).
Subgroup Analyses
Male versus female participant data were available for the 5 mg/day, 20 mg/day and 40 mg/day doses. These data were analysed separately for LDL‐cholesterol lowering efficacy using the generic inverse variance fixed‐effect model in RevMan 5 outside of this review. The subgroup analysis revealed that the efficacy of fluvastatin in male participants and female participants were not different. The efficacy for the 5 mg/day dose (male versus female participant) was: (‐13.9 versus ‐13.2; P = 0.79); for the 20 mg/day dose (male versus female participant) was: (‐21.83 versus ‐18.15; P = 0.21); and for the 40 mg/day dose (male versus female participant) was: (‐25.61 versus ‐27.82; P = 0.43).
A comparison of morning administration time versus evening administration time was not possible because only one trial provided appropriate data. Twice‐daily administration versus single‐dose administration were available for doses of 20 mg/day, 40 mg/day and 80 mg/day. These data were compared for LDL cholesterol lowering efficacy. The percentage reductions in twice‐daily versus single‐dose regimens showed no difference: 20 mg/day ‐20.01 (95 % CI ‐20.33 to ‐19.69) versus ‐19.99 (95 % CI ‐20.31 to ‐19.68) P = 0.965; 40 mg/day ‐25.90 (95 % CI ‐26.45 to ‐25.35) versus ‐26.07 (95 % CI ‐26.62 to ‐25.51) P = 0.670; and 80 mg/day ‐34.89 (95 % CI ‐35.45 to ‐34.33) versus ‐34.33 (95 % CI ‐34.93 to ‐33.73) P = 0.224.
Sensitivity Analyses
Familial versus non‐familial hypercholesterolaemia participant data were available for the doses 5 mg/day, 20 mg/day, 30 mg/day and 40 mg/day. These data were analysed separately for LDL cholesterol lowering efficacy using the generic inverse variance fixed‐effect model in RevMan 5. The efficacy of fluvastatin in familial patients tended to be less than in non‐familial patients: 5 mg/day ‐13.6 (95% CI ‐16.0 to ‐11.2) versus ‐15.9 (95% CI ‐20.2 to ‐11.6) P = 0.36; 20 mg/day ‐18.8 (95% CI ‐22.8 to ‐14.8) versus ‐19.8 (95% CI ‐20.2 to ‐19.4) P = 0.37; 30 mg/day ‐13.4 (95% CI ‐19.0 to ‐7.8) versus ‐26.9 (95% CI ‐30.4 to ‐23.5) P = 0.003; and 40 mg/day ‐26.2 (95% CI ‐28.1 to ‐24.4) versus ‐24.3 (95% CI ‐24.8 to ‐23.9) P = 1.00.
Discussion
Summary of main results
Long‐term, daily fluvastatin intake is effective at lowering blood LDL cholesterol concentrations and does so in a predictable dose‐related manner. The 'Summary of findings' table documents that fluvastatin lowers LDL cholesterol by 15% at 10 mg/day and by 33% at 80 mg/day (summary of findings Table for the main comparison). These moderate reductions reflect a reduction in synthesis of cholesterol by the liver and indicate that liver HMG CoA reductase is being inhibited by up to one third over this dose range. This has significant implications beyond circulating LDL cholesterol, as LDL cholesterol is only one of many important biochemical products that are produced by the HMG CoA reductase pathway. Those other products, including co‐enzyme Q10, heme A, vitamin D, steroid hormones and many other compounds, are also likely to be reduced by about one third with the 80 mg dose of fluvastatin. It is important to recognise that the long‐term consequences of reduction of these products is presently unknown.
In the data and analysis section it can be seen that there are more trials and data with the before and after design than from placebo‐controlled trials. For the doses where there is a large number of trials and participants, it can be seen that estimates of the effect of fluvastatin on the lipid parameters are similar with the two different trial designs. This, plus the demonstration that the placebo effect was not different from zero, justified using generic inverse variance to pool and display the combined estimates in Table 1. In addition, all trial data were entered into GraphPad Prism 4 to calculate the regression lines shown in Figure 4; Figure 3 and Figure 5. The overall efficacy results from GraphPad Prism 4 provide the best estimate of the treatment effect, because it is based on a regression line calculated from all the data for all the doses. The estimates of the average treatment effect from the regression lines are similar to the mean value for all the data for each dose (see summary of findings Table for the main comparison).
In this review, it was established using regression analysis that there was a correlation between the baseline value and fluvastatin effect on LDL cholesterol when the effect was expressed as absolute change from baseline (P < 0.0001). There was no correlation between the baseline value and the fluvastatin effect when the effect was expressed as per cent reduction from baseline (P = 0.21). This finding provides strong support for the fact that systematic reviews reporting the effect of statins on absolute changes in lipid parameters are problematic and potentially misleading.
What is the effect of fluvastatin on the end of treatment variability?
End‐of‐treatment variabilities of fluvastatin and placebo were compared to determine the effect of fluvastatin on variability of blood lipids when expressed as a co‐efficient of variation. Compared with placebo, fluvastatin at all doses increased the co‐efficient of variation of blood LDL cholesterol. Fluvastatin did not statistically significantly affect the variability of total cholesterol, HDL‐cholesterol and triglyceride measurements. In order to increase the power to answer this question we identified 66 placebo‐controlled trials from the atorvastatin (Adams 2015), rosuvastatin (Adams 2014) and fluvastatin reviews. In this comparison, the end‐of‐treatment variability expressed as the coefficient of variation for the statin was significantly increased as compared to placebo: total cholesterol (19.5 versus 15.9; P = 0.0005 N = 150) and LDL cholesterol (29.0 versus 23.3; P = 0.0004 N = 171). There was no increase in the end‐of‐treatment variability for the statin compared with placebo for HDL cholesterol (25.28 versus 25.32; P = 0.977 N = 142) and triglycerides (52.8 versus 51.1; P = 0.776 N = 123). The most plausible explanation for the increase in end of treatment variability for total cholesterol and LDL cholesterol with statins is that it reflects some individual variability in response to the statin that would not be present in the people receiving placebo.
Does fluvastatin increase withdrawals due to adverse effects?
Of 36 placebo‐controlled trials, 16 (44%) reported withdrawals due to adverse effects (WDAEs). This analysis represented only 3023 participants, 1759 of whom received fluvastatin and 1264 of whom received placebo. The pooled estimate for all doses provided a risk ratio (RR) of 1.52 (95% CI 0.94 to 2.45), demonstrating uncertainty, but the possibility of an increase in adverse effects even in these short‐term trials. As 20 (56%) of 36 placebo‐controlled trials did not report WDAEs, risk of selective reporting bias for this outcome is high, and the null effect may be a result of that bias. Furthermore, this analysis was limited to trials of three to 12 weeks’ duration and thus does not reflect adverse effects of fluvastatin that occur after intake of longer duration. Risk of participant selection bias is also high in these trials, as many of the participants studied could have been selected because they were known to tolerate statins at baseline.
Overall completeness and applicability of evidence
This review included 145 trials with 18,846 participants. As such it provided us with robust evidence of the dose‐related lipid‐lowering effects of fluvastatin. It was unknown when we did the review whether the time of fluvastatin administration is important with respect to lipid lowering. Only one trial (Scharnagl 2006) compared morning and evening administration and did not show a difference. A sensitivity analysis comparing twice‐daily versus single‐dose regimen data were available for the doses 20 mg/day, 40 mg/day and 80 mg/day. The percentage reductions in twice‐daily versus single‐dose regimens showed no difference. We therefore felt justified in combining data from both dosing regimens. Recently a Cochrane review has attempted to answer this question and concluded that statin lipid‐lowering effect is the same for morning and evening administration (Izquiero‐Palomares 2016).
Practitioners can use this evidence to calculate the expected effect of doses of fluvastatin commonly utilised in society. It is unlikely that further research will change these estimates appreciably. However, there was a fair amount of heterogeneity in many of the estimates and it is possible that this was due to differences in the populations being studied (e.g. gender or genetic differences) (Thompson 2005). To explore this, where it was possible, we compared the effect of fluvastatin in males and females plus in patients with familial and non‐familial hypercholesterolaemia. A subgroup analysis comparing male versus female participant data was available for the doses 5 mg/day, 20 mg/day and 40 mg/day and no difference was proven. However, we judged the amount of data available were insufficient to answer whether the lipid‐lowering effect of fluvastatin differed in males and females. If anything, it would be anticipated that the effect would be greater in females because on average they weigh less than males. It is important for authors to report data separately by sex and if this had been done in all these trials, we likely would have been able to answer this important question. The results of this subgroup analysis for both atorvastatin and rosuvastatin suggested a larger effect in females than males: atorvastatin 10 mg/day (Adams 2015) male versus female ‐39.2 (95% CI ‐41.6 to ‐36.9) versus ‐41.8 (95% CI ‐43.4 to ‐40.2) P = 0.08 and rosuvastatin 10 mg/day (Adams 2014) male versus female ‐45.1 (95% CI ‐47.9 to ‐42.2) versus ‐49.4 (95% CI ‐51.7 to ‐47.2) P = 0.02.
Familial versus non‐familial hypercholesterolaemia participant data were available for the fluvastatin doses 5 mg/day, 20 mg/day, 30 mg/day and 40 mg/day. These data were analysed separately for LDL cholesterol‐lowering efficacy using the generic inverse variance fixed‐effect model in RevMan 5. The percentage reduction in familial patients was less than non‐familial for all doses except 40 mg/day (see results). These findings of a lesser affect in familial hypercholesterinaemic participants is consistent with what was found for atorvastatin (Adams 2015): atorvastatin 10 mg/day ‐34.7 (95% CI ‐36.6 to ‐32.8) versus ‐36.3 (95% CI ‐36.7 to ‐35.8) P = 0.12 and 20 mg/day ‐38.0 (95% CI ‐39.8 to ‐36.2) versus ‐43.6 (95% CI ‐44.4 to ‐42.8) P < 0.00001.
The profound and relatively consistent effect of fluvastatin on lipid parameters shown in this review is probably appreciated by clinicians who treat patients with these drugs. The ability to know whether a patient is taking a statin or not is also most likely evident to investigators involved in statin placebo‐controlled randomised controlled trials (RCTs). Knowledge of the lipid parameters almost certainly leads to loss of blinding in statin RCTs. The present review calls attention to that problem and efforts to prevent this loss of blinding are needed in future statin RCTs (Higgins 2011).
We have used data from the Cholesterol Treatment Trialists’ (CTT) publications to determine the effects of fluvastatin, atorvastatin and rosuvastatin on LDL cholesterol lowering and reduction of myocardial infarction. In two RCTs a mean fluvastatin dose of 72 mg/day reduced LDL cholesterol by 31.9%, and reduced myocardial infarction, relative risk, 0.68 (95% CI 0.55 to 0.85) as compared to placebo. In five RCTs a mean atorvastatin dose of 26 mg/day reduced LDL cholesterol by 44.0% and reduced myocardial infarction, relative risk, 0.67 (95% CI 0.58 to 0.77) as compared to placebo. In four RCTs a mean rosuvastatin dose of 16 mg/day reduced LDL cholesterol by 48.8% and reduced myocardial infarction, relative risk, 0.82 (95% CI 0.73 to 0.93) as compared to placebo. Thus despite reducing LDL cholesterol by a much lesser amount with fluvastatin than atorvastatin and rosuvastatin, fluvastatin reduced myocardial infarction similarly to atorvastatin and to a greater degree than rosuvastatin. Fluvastatin 72 mg is equivalent to about 6 mg of atorvastatin and about 1.6 mg of rosuvastatin in LDL cholesterol lowering. These findings call into question the commonly held belief that the effect of statins to reduce myocardial infarction is solely due to lipid lowering. It certainly suggests that statins could be acting by some other mechanism to reduce myocardial infarction and calls for more head‐to‐head RCTs comparing different statins.
Quality of the evidence
The summary of all ’Risk of bias’ parameters for the lipid effects suggests a high risk of bias (Figure 6). However, the lipid parameter outcomes are probably relatively resistant to bias. If anything, a high risk of bias would lead to an overestimate of the lipid‐lowering effects rather than an underestimate. However, because of the objectivity of the lipid measurements we think that the estimates of effects are reasonably accurate. This view is strengthened by the fact that the two different trial designs, placebo‐controlled RCTs and before and after design produced similar results. Furthermore, we could not show evidence of funding bias. Comparing Novartis‐funded trials where an overestimate of the effect might be expected and non‐Novartis‐funded trials where a bias towards underestimating the effect of fluvastatin may be expected did not show any difference in the effect of fluvastatin on lipid parameters. Furthermore, review of funnel plots did not suggest evidence of publication bias.
Low risk of bias is not true for the harm outcome, withdrawals due to adverse effects (WDAE). This was reported in 16 (44.4%) of the 36 placebo‐controlled trials. There is therefore a high risk of selective reporting bias for this outcome and this combined with the high risk of other biases means that we cannot be confident that not finding a significant increase in WDAEs is correct (summary of findings Table 4).
Potential biases in the review process
Combining the placebo‐controlled trials with the before and after trials is a limitation of the review. We have explained why the increased risk of bias associated with the before and after design is less in this instance because the lipid parameters were measured in a remote laboratory. Another limitation of this review is that many trials did not report standard deviations for the lipid‐lowering effects. Where possible these values were determined by the method of (Furukawa 2006), from t‐statistics corresponding to the exact P values reported or from the 95% CI of the mean difference between treatment groups. In trials where the standard deviation was not reported and could not be calculated, the standard deviations were imputed as the average of this parameter from trials that reported it. Such imputation might weight some studies more or less; however, this has been shown in other reviews not to have much effect on the estimate of the effect size (Heran 2008; Musini 2014). Another limitation is that few studies were available to demonstrate the lipid‐lowering effect of fluvastatin at very low and very high doses. We did not downgrade the quality of evidence due to heterogeneity of LDL cholesterol because the confidence intervals for the pooled result estimates were narrow.
Agreements and disagreements with other studies or reviews
The best estimate of the mean per cent reduction in blood LDL‐cholesterol for any dose of fluvastatin can be calculated from the log dose‐response equation. Using this equation y = ‐19.73 log(x) + 4.869, a fluvastatin dose of 40 mg/day reduces LDL cholesterol by an average of 26.7%. This is close to the range of 22.0% to 26.0% reduction in LDL cholesterol from the six comparative trials from the Drug Effectiveness Review Project (DERP) (Smith 2009) and a range of 24.8% to 29.4% reduction in LDL cholesterol in 23 placebo‐controlled trials from (Law 2003).
Comparison of the effect with other statins
The greatest value in doing this type of review is the ability to compare fluvastatin to other statins. At present we can compare fluvastatin to atorvastatin and rosuvastatin, which have been reviewed using the same protocol. The most important finding in this review is that the slope of the dose response effect for fluvastatin on LDL, total cholesterol and triglycerides is not different from the slopes of the dose response curve for atorvastatin (Adams 2015) and rosuvastatin (Adams 2014). This provides some confirmation that the three statins are all causing lipid lowering by a similar mechanism. However, it also demonstrates that fluvastatin is much less potent than the other two drugs: fluvastatin is 12‐fold less potent than atorvastatin in lowering LDL cholesterol and 46‐fold less potent than rosuvastatin. This means that fluvastatin 80 mg/day reduces LDL cholesterol on average by 32.7 %; the dose of atorvastatin and rosuvastatin to achieve the same reduction in LDL cholesterol is 7 mg/day and 2 mg/day, respectively.

Fluvastatin flow diagram
Number of included studies according to publication year

Log dose fluvastatin response curve for total cholesterol
Values represent the results of each trial for each dose comparison. The standard error bars cannot be seen because they all lie within the points

Log dose fluvastatin response curve for LDL cholesterol
Values represent the results of each trial for each dose comparison. The standard error bars cannot be seen because they all lie within the points

Log dose fluvastatin response curve for triglycerides
Values represent the results of each trial for each dose comparison. The standard error bars cannot be seen because they all lie within the points

'Risk of bias' graph: Summary of overall risk of bias for the lipid parameters according to each item.
Comparison 1 2.5 mg vs control, Outcome 1 LDL‐cholesterol.
Comparison 1 2.5 mg vs control, Outcome 2 WDAEs.

Comparison 2 5 mg vs control, Outcome 1 LDL‐cholesterol.

Comparison 2 5 mg vs control, Outcome 2 LDL‐cholesterol.

Comparison 2 5 mg vs control, Outcome 3 WDAEs.

Comparison 3 10 mg vs control, Outcome 1 LDL‐cholesterol.

Comparison 3 10 mg vs control, Outcome 2 Total cholesterol.

Comparison 3 10 mg vs control, Outcome 3 HDL‐cholesterol.

Comparison 3 10 mg vs control, Outcome 4 Triglycerides.

Comparison 3 10 mg vs control, Outcome 5 WDAEs.
Comparison 4 20 mg vs control, Outcome 1 LDL‐cholesterol.

Comparison 4 20 mg vs control, Outcome 2 Total cholesterol.
Comparison 4 20 mg vs control, Outcome 3 HDL‐cholesterol.

Comparison 4 20 mg vs control, Outcome 4 Triglycerides.
Comparison 4 20 mg vs control, Outcome 5 LDL‐cholesterol.
Comparison 4 20 mg vs control, Outcome 6 Total cholesterol.

Comparison 4 20 mg vs control, Outcome 7 HDL‐cholesterol.

Comparison 4 20 mg vs control, Outcome 8 Triglycerides.

Comparison 4 20 mg vs control, Outcome 9 WDAE.

Comparison 5 30 mg vs control, Outcome 1 LDL‐cholesterol.
Comparison 5 30 mg vs control, Outcome 2 Total cholesterol.

Comparison 5 30 mg vs control, Outcome 3 HDL‐cholesterol.

Comparison 6 40 mg vs control, Outcome 1 LDL‐cholesterol.
Comparison 6 40 mg vs control, Outcome 2 Total cholesterol.
Comparison 6 40 mg vs control, Outcome 3 HDL‐cholesterol.
Comparison 6 40 mg vs control, Outcome 4 Triglycerides.
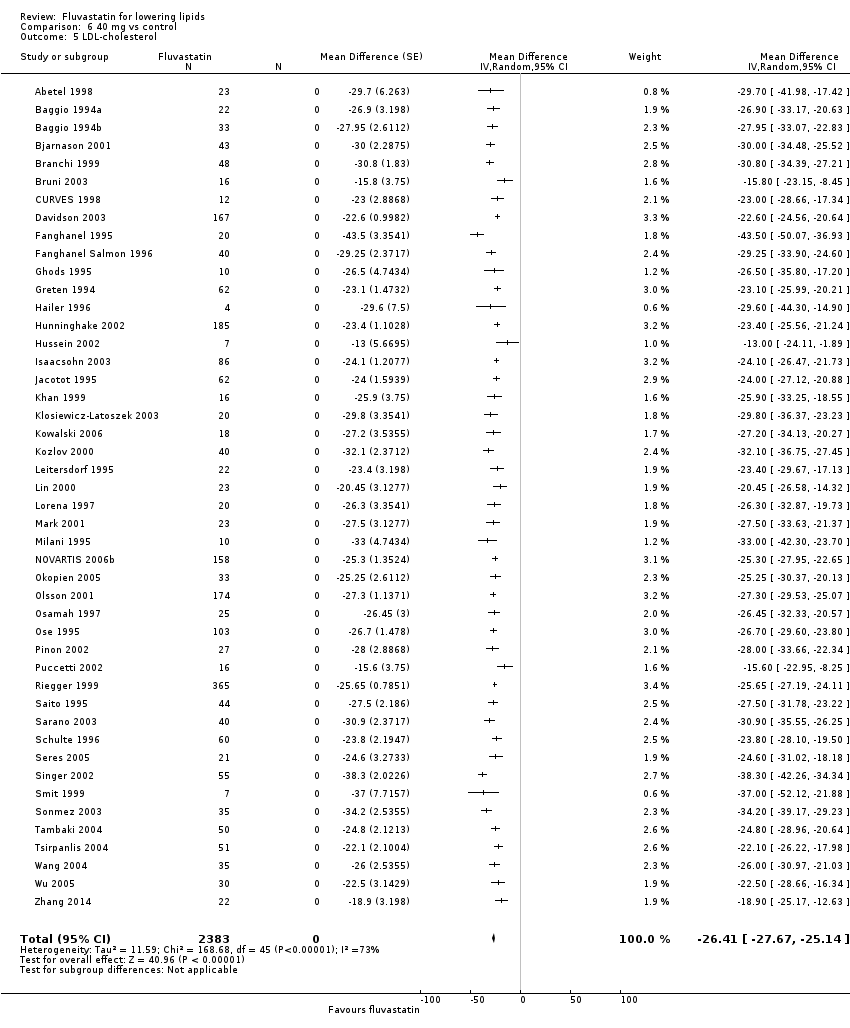
Comparison 6 40 mg vs control, Outcome 5 LDL‐cholesterol.

Comparison 6 40 mg vs control, Outcome 6 Total cholesterol.
Comparison 6 40 mg vs control, Outcome 7 HDL‐cholesterol.
Comparison 6 40 mg vs control, Outcome 8 Triglycerides.

Comparison 6 40 mg vs control, Outcome 9 WDAE.

Comparison 7 80 mg vs control, Outcome 1 LDL‐cholesterol.
Comparison 7 80 mg vs control, Outcome 2 Total cholesterol.

Comparison 7 80 mg vs control, Outcome 3 HDL‐cholesterol.

Comparison 7 80 mg vs control, Outcome 4 Triglycerides.

Comparison 7 80 mg vs control, Outcome 5 LDL‐cholesterol.

Comparison 7 80 mg vs control, Outcome 6 Total cholesterol.
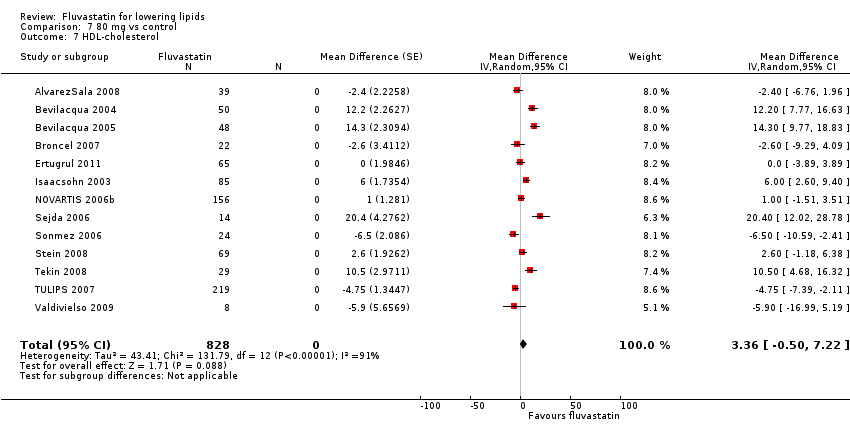
Comparison 7 80 mg vs control, Outcome 7 HDL‐cholesterol.
Comparison 7 80 mg vs control, Outcome 8 Triglycerides.

Comparison 7 80 mg vs control, Outcome 9 WDAEs.

Comparison 8 all doses vs control, Outcome 1 WDAEs.
| LDL cholesterol lowering efficacy of fluvastatin | ||||||
| Patient or population: participants with normal or abnormal lipid profiles Settings: ambulatory care Intervention: fluvastatin Comparison: LDL cholesterol percentage change from baseline for all trials | ||||||
| Outcomes | Anticipated absolute effects mmol/L (95%CI) | Percent reduction % | No of Participants | Quality of the evidence | Comments | |
| Before exposure to fluvastatin1 | After exposure to fluvastatin | |||||
| LDL‐cholesterol fluvastatin 10 mg/day | 4.81 (4.44 to 5.17) | 4.08 (3.98 to 4.16) | 15.2 (17.1 to 13.4) | 595 | ⊕⊕⊕⊕ | Effect predicted from log dose‐response equation is 14.8%. Randomised and before and after design not different P = 0.94. |
| LDL‐cholesterol fluvastatin 20 mg/day | 4.87 (4.54 to 5.21) | 3.90 (3.88 to 3.91) | 20.0 (19.7 to 20.3) | 9010 | ⊕⊕⊕⊕ | Effect predicted from log dose‐response equation is 20.8%. Randomised and before and after design not different P = 0.16. |
| LDL‐cholesterol fluvastatin 40 mg/day | 4.74 (4.41 to 5.06) | 3.51 (3.48 to 3.54) | 25.9 (25.3 to 26.5) | 3658 | ⊕⊕⊕⊕ | Effect predicted from log dose‐response equation is 26.8%. Randomised and before and after design not different P = 0.58. |
| LDL‐cholesterol fluvastatin 80 mg/day | 4.80 (4.47 to 5.13) | 3.13 (3.10 to 3.15) | 34.9 (35.5 to 34.3) | 4928 | ⊕⊕⊕⊕ | Effect predicted from log dose‐response equation is 32.8%. Randomised and before and after design not different P = 0.07. |
| CI: Confidence interval | ||||||
| GRADE Working Group grades of evidence | ||||||
| 1. Mean baseline values. | ||||||
| Total cholesterol lowering efficacy of fluvastatin | ||||||
| Patient or population: participants with normal or abnormal lipid profiles Settings: ambulatory care Intervention: fluvastatin Comparison: Total cholesterol percentage change from baseline for all trials | ||||||
| Outcomes | Anticipated absolute effects mmol/L (95%CI) | Percent reduction % | No of Participants | Quality of the evidence | Comments | |
| Before exposure to fluvastatin1 | After exposure to fluvastatin | |||||
| Total cholesterol fluvastatin 10 mg/day | 6.90 (6.47 to 7.33) | 6.16 (6.02 to 6.30) | 10.7 (12.7 to 8.6) | 287 | ⊕⊕⊕⊕ | Effect predicted from log dose‐response equation is 10.9%. Randomised and before and after design not different P = 0.86. |
| Total cholesterol fluvastatin 20 mg/day | 6.99 (6.61 to 7.37) | 5.96 (5.94 to 5.98) | 14.8 (15.1 to 14.5) | 6309 | ⊕⊕⊕⊕ | Effect predicted from log dose‐response equation is 15.2%. Randomised versus before and after design borderline different P = 0.044. |
| Total cholesterol fluvastatin 40 mg/day | 6.91 (6.54 to 7.27) | 5.60 (5.57 to 5.64) | 18.9 (19.3 to 18.4) | 2966 | ⊕⊕⊕⊕ | Effect predicted from log dose‐response equation is 19.4%. Randomised and before and after design not different P = 0.106. |
| Total cholesterol fluvastatin 80 mg/day | 6.97 (6.62, 7.32) | 5.24 (5.12 to 5.27) | 24.9 (25.5 to 24.4) | 3943 | ⊕⊕⊕⊕ | Effect predicted from log dose‐response equation is 23.6%. Randomised and before and after design not different P = 0.595. |
| CI: Confidence interval | ||||||
| GRADE Working Group grades of evidence | ||||||
| 1. Mean baseline values. | ||||||
| Triglyceride lowering efficacy of fluvastatin | ||||||
| Patient or population: participants with normal or abnormal lipid profiles Settings: ambulatory care Intervention: fluvastatin Comparison: Triglyceride percentage change from baseline for all trials | ||||||
| Outcomes | Anticipated absolute effects mmol/L (95%CI) | Percent Reduction % | No of Participants | Quality of the evidence | Comments | |
| Before exposure to fluvastatin1 | After exposure to fluvastatin | |||||
| Triglycerides fluvastatin 10 mg/day | 1.93 (1.63 to 2.22) | 1.87 (1.73 to 2.01) | 3.0 (10.1 to ‐4.2) | 259 | ⊕⊕⊕⊕ | Effect predicted from log dose‐response equation is 5.2%. Only RCT data. |
| Triglycerides fluvastatin 20 mg/day | 1.98 (1.68 to 2.28) | 1.76 (1.74 to 1.77) | 11.1 (11.8 to 10.3) | 7510 | ⊕⊕⊕⊕ | Effect predicted from log dose‐response equation is 9.4%. Randomised and before and after design not different P = 0.277. |
| Triglycerides fluvastatin 40 mg/day | 1.94 (1.70 to 2.17) | 1.72 (1.69 to 1.75) | 11.1 (12.6 to 9.6) | 2646 | ⊕⊕⊕⊕ | Effect predicted from log dose‐response equation is 13.6% Randomised and before and after design not different P = 0.186. |
| Triglycerides fluvastatin 80 mg/day | 1.92 (1.67 to 2.17) | 1.59 (1.56 to 1.62) | 17.5 (19.1 to 15.9) | 3623 | ⊕⊕⊕⊕ | Effect predicted from log dose‐response equation is 17.7% Randomised and before and after design not different P = 0.496. |
| CI: Confidence interval | ||||||
| GRADE Working Group grades of evidence | ||||||
| 1. Mean baseline values. | ||||||
| Withdrawal due to adverse events due to fluvastatin | ||||||
| Patient or population: participants with normal or abnormal lipid profiles Settings: ambulatory care Intervention: fluvastatin Comparison: WDAEs fluvastatin versus placebo | ||||||
| Outcomes | Illustrative Comparative Risks* (95%CI) | Relative effect | No of Participants | Quality of the evidence | Comments | |
| Assumed risk | Corresponding risk | |||||
| placebo | fluvastatin | |||||
| WDAEs within 3‐12 weeks | RR 1.52 (0.94 to 2.45) | 3023 | ⊕⊝⊝⊝ | only 16 out of 36 placebo controlled trials reported withdrawals due to adverse effects. | ||
| 18 per 1000 | 27 per 1000 (17 to 44) | |||||
| *The basis for the assumed risk is the measure of absolute effect with the placebo group. The corresponding risk (and its 95% confidence interval) is based on the assumed risk in the comparison group and the relative effect of the intervention (and its 95% CI). CI: Confidence interval; RR: Risk Ratio | ||||||
| GRADE Working Group grades of evidence | ||||||
| 1. Downgraded 2 levels due to high risk of selective reporting and other biases. 2. Downgraded 1 level due to wide confidence intervals. | ||||||
| Fluvastatin dose (mg/day) | 2.5 | 5 | 10 | 20 | 30 | 40 | 80 |
| Total Cholesterol (mean percentage change from control) | ‐9.8 | ‐11.7 | ‐10.7 | ‐14.8 | ‐18.0 | ‐18.85 | ‐24.9 |
| 95% confidence interval | (‐12.0 to ‐7.7) | (‐14.2 to ‐9.2) | (‐12.7 to ‐8.6) | (‐15.1 to ‐14.5) | (‐19.2 to ‐16.7) | (‐19.3 to ‐18.4) | (‐25.4 to ‐24.4) |
| LDL‐Ca (mean percentage change from control) | ‐12.1 | ‐14.5 | ‐15.2 | ‐20.0 | ‐25.3 | ‐25.9 | ‐34.9 |
| 95% confidence interval | (‐14.2 to ‐10.1) | (‐16.3 to ‐12.7) | (‐17.1 to ‐13.3) | (‐20.3 to ‐19.7) | (‐26.9 to ‐23.7) | (‐26.5 to ‐25.3) | (‐35.5 to ‐34.3) |
| Triglycerides (mean percentage change from control) | ‐3.3 | ‐5.3 | ‐3.0 | ‐11.1 | ‐5.9 | ‐11.1 | ‐17.5 |
| 95% confidence interval | (‐14.6 to 8.0) | (‐13.1 to 2.5) | (‐10.1 to 4.2) | (‐11.8 to ‐10.3) | (‐20.1 to 8.3) | (‐12.6 to ‐9.6) | (‐19.1 to ‐15.9) |
| aLDL‐C: low‐density lipoprotein cholesterol | |||||||
| Outcome or subgroup title | No. of studies | No. of participants | Statistical method | Effect size |
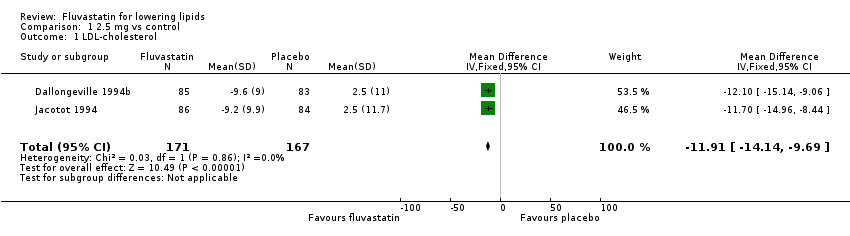
| 1 LDL‐cholesterol Show forest plot | 2 | 338 | Mean Difference (IV, Fixed, 95% CI) | ‐11.91 [‐14.14, ‐9.69] |
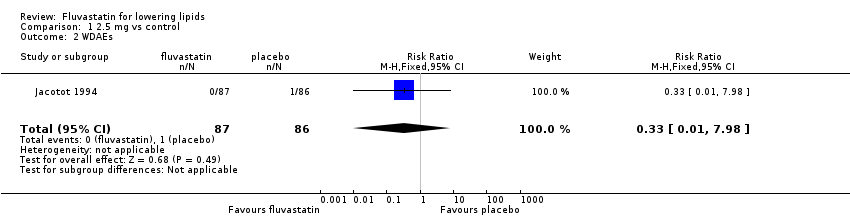
| 2 WDAEs Show forest plot | 1 | 173 | Risk Ratio (M‐H, Fixed, 95% CI) | 0.33 [0.01, 7.98] |
| Outcome or subgroup title | No. of studies | No. of participants | Statistical method | Effect size |
| 1 LDL‐cholesterol Show forest plot | 2 | 332 | Mean Difference (IV, Fixed, 95% CI) | ‐15.76 [‐18.91, ‐12.60] |
| 2 LDL‐cholesterol Show forest plot | 2 | 91 | Mean Difference (Fixed, 95% CI) | ‐13.85 [‐16.02, ‐11.69] |
| 3 WDAEs Show forest plot | 1 | 171 | Risk Ratio (M‐H, Fixed, 95% CI) | 0.34 [0.01, 8.16] |
| Outcome or subgroup title | No. of studies | No. of participants | Statistical method | Effect size |
| 1 LDL‐cholesterol Show forest plot | 5 | 570 | Mean Difference (IV, Random, 95% CI) | ‐14.49 [‐17.95, ‐11.02] |
| 2 Total cholesterol Show forest plot | 3 | 259 | Mean Difference (IV, Random, 95% CI) | ‐8.44 [‐13.95, ‐2.93] |
| 3 HDL‐cholesterol Show forest plot | 3 | 259 | Mean Difference (IV, Fixed, 95% CI) | 1.86 [‐1.28, 5.00] |
| 4 Triglycerides Show forest plot | 3 | 259 | Mean Difference (IV, Fixed, 95% CI) | ‐2.96 [‐10.19, 4.28] |
| 5 WDAEs Show forest plot | 2 | 211 | Risk Ratio (M‐H, Fixed, 95% CI) | 0.34 [0.01, 8.16] |
| Outcome or subgroup title | No. of studies | No. of participants | Statistical method | Effect size |
| 1 LDL‐cholesterol Show forest plot | 14 | 2329 | Mean Difference (IV, Fixed, 95% CI) | ‐20.82 [‐21.88, ‐19.77] |
| 2 Total cholesterol Show forest plot | 12 | 2023 | Mean Difference (IV, Fixed, 95% CI) | ‐15.81 [‐16.75, ‐14.88] |
| 3 HDL‐cholesterol Show forest plot | 10 | 1727 | Mean Difference (IV, Fixed, 95% CI) | 2.33 [0.90, 3.77] |
| 4 Triglycerides Show forest plot | 10 | 1712 | Mean Difference (IV, Fixed, 95% CI) | ‐9.67 [‐12.61, ‐6.73] |
| 5 LDL‐cholesterol Show forest plot | 41 | 6681 | Mean Difference (Random, 95% CI) | ‐20.92 [‐21.83, ‐20.02] |
| 6 Total cholesterol Show forest plot | 38 | 4286 | Mean Difference (Random, 95% CI) | ‐15.68 [‐16.67, ‐14.68] |
| 7 HDL‐cholesterol Show forest plot | 32 | 6239 | Mean Difference (Random, 95% CI) | 5.34 [4.51, 6.17] |
| 8 Triglycerides Show forest plot | 29 | 5798 | Mean Difference (Random, 95% CI) | ‐9.15 [‐11.36, ‐6.94] |
| 9 WDAE Show forest plot | 7 | 1060 | Risk Ratio (M‐H, Random, 95% CI) | 0.87 [0.14, 5.46] |
| Outcome or subgroup title | No. of studies | No. of participants | Statistical method | Effect size |
| 1 LDL‐cholesterol Show forest plot | 7 | 336 | Mean Difference (Random, 95% CI) | ‐24.03 [‐27.72, ‐20.34] |
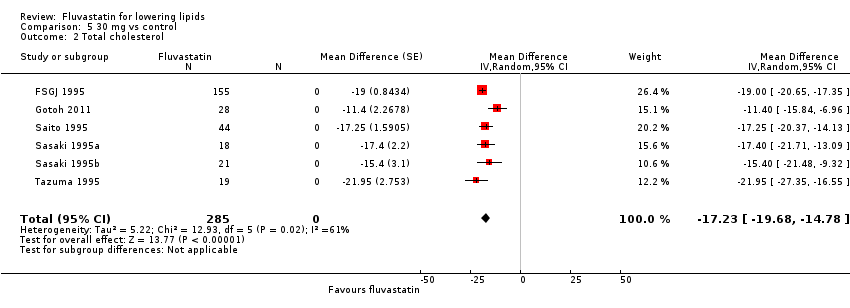
| 2 Total cholesterol Show forest plot | 6 | 285 | Mean Difference (Random, 95% CI) | ‐17.23 [‐19.68, ‐14.78] |
| 3 HDL‐cholesterol Show forest plot | 2 | 47 | Mean Difference (Random, 95% CI) | 7.86 [‐0.36, 16.07] |
| Outcome or subgroup title | No. of studies | No. of participants | Statistical method | Effect size |
| 1 LDL‐cholesterol Show forest plot | 11 | 1275 | Mean Difference (IV, Random, 95% CI) | ‐27.04 [‐30.69, ‐23.40] |
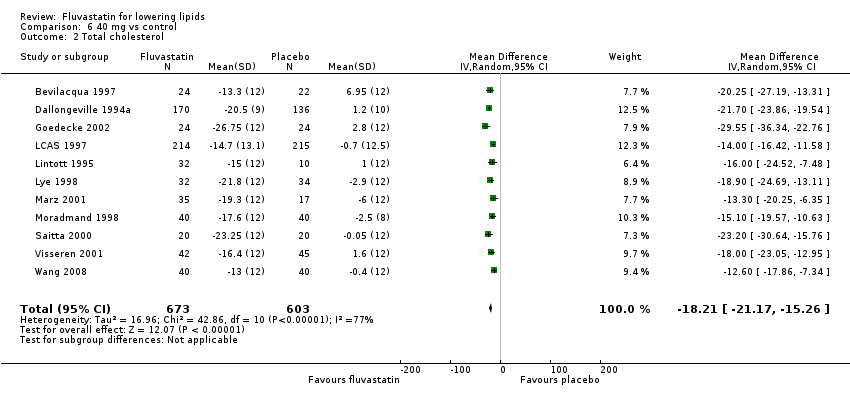
| 2 Total cholesterol Show forest plot | 11 | 1276 | Mean Difference (IV, Random, 95% CI) | ‐18.21 [‐21.17, ‐15.26] |
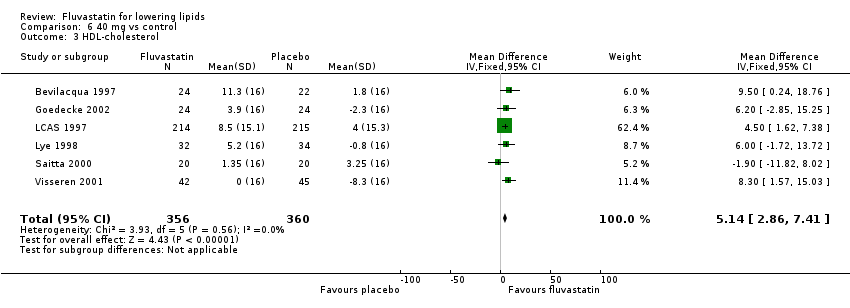
| 3 HDL‐cholesterol Show forest plot | 6 | 716 | Mean Difference (IV, Fixed, 95% CI) | 5.14 [2.86, 7.41] |
| 4 Triglycerides Show forest plot | 10 | 1198 | Mean Difference (IV, Fixed, 95% CI) | ‐13.53 [‐17.27, ‐9.78] |
| 5 LDL‐cholesterol Show forest plot | 46 | 2383 | Mean Difference (Random, 95% CI) | ‐26.41 [‐27.67, ‐25.14] |
| 6 Total cholesterol Show forest plot | 44 | 1690 | Mean Difference (Random, 95% CI) | ‐19.52 [‐20.60, ‐18.45] |
| 7 HDL‐cholesterol Show forest plot | 35 | 1354 | Mean Difference (Random, 95% CI) | 3.87 [2.06, 5.68] |
| 8 Triglycerides Show forest plot | 38 | 1448 | Mean Difference (Random, 95% CI) | ‐11.23 [‐14.07, ‐8.40] |
| 9 WDAE Show forest plot | 4 | 236 | Risk Ratio (M‐H, Fixed, 95% CI) | 3.47 [0.75, 16.11] |
| Outcome or subgroup title | No. of studies | No. of participants | Statistical method | Effect size |
| 1 LDL‐cholesterol Show forest plot | 10 | 2727 | Mean Difference (IV, Random, 95% CI) | ‐34.62 [‐38.60, ‐30.64] |
| 2 Total cholesterol Show forest plot | 10 | 2757 | Mean Difference (IV, Random, 95% CI) | ‐25.76 [‐28.10, ‐23.41] |
| 3 HDL‐cholesterol Show forest plot | 9 | 2644 | Mean Difference (IV, Random, 95% CI) | 1.06 [‐2.26, 4.38] |
| 4 Triglycerides Show forest plot | 10 | 2756 | Mean Difference (IV, Fixed, 95% CI) | ‐17.28 [‐19.63, ‐14.92] |
| 5 LDL‐cholesterol Show forest plot | 22 | 2201 | Mean Difference (Random, 95% CI) | ‐33.04 [‐35.17, ‐30.90] |
| 6 Total cholesterol Show forest plot | 17 | 1186 | Mean Difference (Random, 95% CI) | ‐23.27 [‐24.99, ‐21.55] |
| 7 HDL‐cholesterol Show forest plot | 13 | 828 | Mean Difference (Random, 95% CI) | 3.36 [‐0.50, 7.22] |
| 8 Triglycerides Show forest plot | 13 | 867 | Mean Difference (Random, 95% CI) | ‐20.04 [‐26.35, ‐13.73] |
| 9 WDAEs Show forest plot | 4 | 1430 | Risk Ratio (M‐H, Fixed, 95% CI) | 1.33 [0.71, 2.51] |
| Outcome or subgroup title | No. of studies | No. of participants | Statistical method | Effect size |
| 1 WDAEs Show forest plot | 16 | 3023 | Risk Ratio (M‐H, Fixed, 95% CI) | 1.52 [0.94, 2.45] |