工作場所照明在改善白天工作人員的警覺性和情緒方面的作用
Abstract
Background
Exposure to light plays a crucial role in biological processes, influencing mood and alertness. Daytime workers may be exposed to insufficient or inappropriate light during daytime, leading to mood disturbances and decreases in levels of alertness.
Objectives
To assess the effectiveness and safety of lighting interventions to improve alertness and mood in daytime workers.
Search methods
We searched the Cochrane Central Register of Controlled Trials (CENTRAL), MEDLINE, Embase, seven other databases; ClinicalTrials.gov and the World Health Organization trials portal up to January 2018.
Selection criteria
We included randomised controlled trials (RCTs), and non‐randomised controlled before‐after trials (CBAs) that employed a cross‐over or parallel‐group design, focusing on any type of lighting interventions applied for daytime workers.
Data collection and analysis
Two review authors independently screened references in two stages, extracted outcome data and assessed risk of bias. We used standardised mean differences (SMDs) and 95% confidence intervals (CI) to pool data from different questionnaires and scales assessing the same outcome across different studies. We combined clinically homogeneous studies in a meta‐analysis. We used the GRADE system to rate quality of evidence.
Main results
The search yielded 2844 references. After screening titles and abstracts, we considered 34 full text articles for inclusion. We scrutinised reports against the eligibility criteria, resulting in the inclusion of five studies (three RCTs and two CBAs) with 282 participants altogether. These studies evaluated four types of comparisons: cool‐white light, technically known as high correlated colour temperature (CCT) light versus standard illumination; different proportions of indirect and direct light; individually applied blue‐enriched light versus no treatment; and individually applied morning bright light versus afternoon bright light for subsyndromal seasonal affective disorder.
We found no studies comparing one level of illuminance versus another.
We found two CBA studies (163 participants) comparing high CCT light with standard illumination. By pooling their results via meta‐analysis we found that high CCT light may improve alertness (SMD −0.69, 95% CI −1.28 to −0.10; Columbia Jet Lag Scale and the Karolinska Sleepiness Scale) when compared to standard illumination. In one of the two CBA studies with 94 participants there was no difference in positive mood (mean difference (MD) 2.08, 95% CI −0.1 to 4.26) or negative mood (MD −0.45, 95% CI −1.84 to 0.94) assessed using the Positive and Negative Affect Schedule (PANAS) scale. High CCT light may have fewer adverse events than standard lighting (one CBA; 94 participants). Both studies were sponsored by the industry. We graded the quality of evidence as very low.
We found no studies comparing light of a particular illuminance and light spectrum or CCT versus another combination of illuminance and light spectrum or CCT.
We found no studies comparing daylight versus artificial light.
We found one RCT (64 participants) comparing the effects of different proportions of direct and indirect light: 100% direct lighting, 70% direct lighting plus 30% indirect lighting, 30% direct lighting plus 70% indirect lighting and 100% indirect lighting. There was no substantial difference in mood, as assessed by the Beck Depression Inventory, or in adverse events, such as ocular, reading or concentration problems, in the short or medium term. We graded the quality of evidence as low.
We found two RCTs comparing individually administered light versus no treatment. According to one RCT with 25 participants, blue‐enriched light individually applied for 30 minutes a day may enhance alertness (MD −3.30, 95% CI −6.28 to −0.32; Epworth Sleepiness Scale) and may improve mood (MD −4.8, 95% CI −9.46 to −0.14; Beck Depression Inventory). We graded the quality of evidence as very low. One RCT with 30 participants compared individually applied morning bright light versus afternoon bright light for subsyndromal seasonal affective disorder. There was no substantial difference in alertness levels (MD 7.00, 95% CI −10.18 to 24.18), seasonal affective disorder symptoms (RR 1.60, 95% CI 0.81, 3.20; number of participants presenting with a decrease of at least 50% in SIGH‐SAD scores) or frequency of adverse events (RR 0.53, 95% CI 0.26 to 1.07). Among all participants, 57% had a reduction of at least 50% in their SIGH‐SAD score. We graded the quality of evidence as low.
Publication bias could not be assessed for any of these comparisons.
Authors' conclusions
There is very low‐quality evidence based on two CBA studies that high CCT light may improve alertness, but not mood, in daytime workers. There is very low‐quality evidence based on one CBA study that high CCT light may also cause less irritability, eye discomfort and headache than standard illumination. There is low‐quality evidence based on one RCT that different proportions of direct and indirect light in the workplace do not affect alertness or mood. There is very low‐quality evidence based on one RCT that individually applied blue‐enriched light improves both alertness and mood. There is low‐quality evidence based on one RCT that individually administered bright light during the afternoon is as effective as morning exposure for improving alertness and mood in subsyndromal seasonal affective disorder.
PICO
淺顯易懂的口語結論
工作場所照明在改善白天工作人員的警覺性和情緒方面的作用
本篇文獻回顧之目的為何?
本篇 Cochrane 回顧的目的是想找到特定種類的照明是否能改善白天工作人員的警覺水平 (levels of alertness) 和情緒狀態 (state of mood)。
我們蒐集並分析 5 篇文獻來探討這個問題。
關鍵訊息
冷白光 (cool‐white light),專業名稱為高相關色溫光線 (high correlated colour temperature light),可提高白天工作人員的警覺性,但不能改善情緒。冷白光還可以減少刺激、眼睛不適和頭痛。改變工作場所中直接或間接光線的比例不會影響警覺性或情緒。配戴可提供富含藍光的 LED (light emitting diode, 發光二極體) 的眼鏡可以提高工作人員的警覺性和情緒。對於臨床表現尚不足以診斷為季節性憂鬱症的人來說,暴露於下午的明亮光線下就如同暴露於早晨明亮光線一樣,能提高警覺性與改善情緒。所有文獻的證據等級都為低或非常低品質,因此,仍需要更多的研究來佐證。
本篇文獻回顧的研究內容為何?
光在許多生物功能中扮演重要的角色,例如睡眠調節,它可能會影響一個人的情緒狀態和警覺水平。大部分白天時間在室內度過的日間工作人員可能會處於低光照環境中。這可能會導致警覺性降低和情緒障礙。
我們分析了研究的數據,這些研究調查了任何類型的照明對白天室內的工作人員警覺性和情緒的影響。不同類型的照明 (包括冷白光) 與暖光 (warm light) 比較、不同級別的照明強度、單獨照明或暴露於日光下。
本篇文獻回顧的主要結果為何?
我們納入了 5 項研究,共有 282 名受試者。受試者為辦公室人員和醫院工作人員。2 項研究調查了冷白光的影響,一項研究專注於間接光。2 項研究調查了單一光源使用特殊玻璃或燈箱 (帶有半透明玻璃或塑料側面的扁平盒子,其中包含光線) 的效果。
冷白光可能會提高警覺性,但無法改善情緒,它可能可以減少煩躁、眼睛不適和頭痛。這些發現是基於企業贊助的 2 項研究。
改變工作場所中直接和間接光的比例可能不會顯著影響警覺性或情緒。
使用裝有 LED 眼鏡提供的富含藍光產品可以提高警覺性和情緒。
暴露於下午時段燈箱的明亮光線下,就像暴露在上午的明亮光線一樣,能改善那些出現季節性憂鬱症狀但尚未確診的人群其警覺性和情緒。
所有研究結果的證據等級均為低或非常低品質 (由於研究和受試者數量少,以及研究進行方式存在問題),因此仍需要更多的研究來支持。
我們發現沒有研究調查以下措施造成的影響:光線強度、光線強度結合光線顏色、或暴露於日光。
本篇文獻回顧的更新日期為何?
我們搜尋了截至 2018 年 1 月 17 日的研究。
Authors' conclusions
Summary of findings
| High correlated colour temperature light versus standard illumination for improving mood and alertness in daytime workers | ||||
| Patient or population: daytime workers | ||||
| Outcomes | Anticipated absolute effects (95% CI) | № of participants (studies) | Quality of the evidence | |
| Risk with standard illumination | Risk with CCT light | |||
| Alertness KS range 1 to 9 (worst) | ‐‐ | SMD** 0.69 lower | 163 Effective sample size = 50 | ⊕⊝⊝⊝ |
| Mood (positive) | Mean standard positive mood 25.9 | MD 2.08 higher | 94 Effective sample size = 34 | ⊕⊝⊝⊝ |
| Mood (negative) | Mean standard negative mood 13.7 | MD 0.45 lower | 94 Effective sample size = 34 | ⊕⊝⊝⊝ |
| Adverse events ‐ eye discomfort | Mean standard adverse events 1.7 | MD 0.23 lower | 94 Effective sample size = 34 | ⊕⊝⊝⊝ |
| * Effective sample sizes applied to correct for the unit‐of‐analysis error. ** As a rule of thumb, 0.2 Standard Deviations represents a small difference, 0.5 a moderate difference, and 0.8 a large difference. CI: confidence interval; CCT: correlated colour temperature; MD: mean difference; PANAS: Positive and Negative Affect Schedule; SMD: standardised mean difference. | ||||
| GRADE Working Group grades of evidence | ||||
| 1 The assessment of risk of bias for non‐randomised studies starts at low‐quality evidence. We downgraded the level of evidence with one level, i.e. to very low quality, due to imprecision caused by a small sample size. 2 We would have downgraded the level of evidence with one more level due to imprecision caused by wide confidence intervals that include a null effect but we had already reached a judgment of very low‐quality evidence. | ||||
| Indirect light versus direct light for improving mood and alertness in daytime workers | ||||
| Patient or population: daytime workers | ||||
| Outcomes | Anticipated absolute effects (95% CI) | № of participants | Quality of the evidence | |
| Risk with direct light | Risk with indirect light | |||
| Alertness | Not assessed | Not assessed | Not assessed | Not assessed |
| Mood | Mean mood 5.8 | MD 1 higher | 22 | ⊕⊕⊝⊝ |
| Adverse events (ocular problems) | Mean adverse events 0.4 | MD 0.1 lower | 22 | ⊕⊕⊝⊝ |
| CI: confidence interval; MD: mean difference; RCT: randomised controlled trial. | ||||
| GRADE Working Group grades of evidence | ||||
| 1 We downgraded the level of evidence with one level, i.e. from high to moderate quality, due to risk of bias (the authors did not fully describe how or if they employed allocation concealment, outcome assessors were not blinded and there was a high and unbalanced attrition rate). 2 We downgraded the level of evidence with one level, i.e. from moderate to low quality, due to imprecision (a small sample size and a wide confidence interval including a null effect). | ||||
| Individually applied blue‐enriched light versus no treatment for improving mood and alertness in daytime workers | ||||
| Patient or population: daytime workers | ||||
| Outcomes | Anticipated absolute effects (95% CI) | № of participants | Quality of the evidence | |
| Risk with light as usual | Risk with blue‐enriched light | |||
| Alertness | Mean alertness | MD 3.3 lower | 25 | ⊕⊝⊝⊝ |
| Mood | Mean mood | MD 4.8 lower | 25 | ⊕⊝⊝⊝ |
| Adverse events | Not assessed | Not assessed | Not assessed | Not assessed |
| CI: confidence interval; MD: mean difference; RCT: randomised controlled trial. | ||||
| GRADE Working Group grades of evidence | ||||
| 1 We downgraded the level of evidence with two levels, i.e. from high to low quality, due to risk of bias (the authors did not fully describe how or if they employed allocation concealment, outcome assessors were not blinded, results for SIGH‐HDRS were not reported and there was a high attrition rate). 2 We downgraded the level of evidence with one level, i.e. from low to very low quality, due to imprecision (a small sample size and a wide confidence interval). | ||||
| Morning bright light versus afternoon bright light for improving mood and alertness in daytime workers | |||||
| Patient or population: daytime workers | |||||
| Outcomes | Anticipated absolute effects* (95% CI) | Relative effect with morning bright light | № of participants | Quality of the evidence | |
| Risk with afternoon bright light | Risk with morning bright light | ||||
| Alertness | Mean 59 (SD 23) | Mean 66 (SD 25) | MD 7 higher | 30 | ⊕⊕⊝⊝ |
| Mood | 426 per 1000 | 688 per 1000 | RR 1.60 | 30 | ⊕⊕⊝⊝ |
| Adverse events (frequency) | 712 per 1000 | 375 per 1000 | RR 0.53 | 30 | ⊕⊕⊝⊝ |
| *The risk in the intervention group (and its 95% confidence interval) is based on the assumed risk in the comparison group and the relative effect of the intervention (and its 95% CI). CI: confidence interval; MD: mean difference; RCT: randomised controlled trial; RR: risk ratio; SIGH‐SAD: Structured Interview Guide for the Hamilton Depression Rating Scale‐Seasonal Affective Disorders Version. | |||||
| GRADE Working Group grades of evidence | |||||
| 1 We downgraded the level of evidence with one level, i.e. from high to moderate quality, due to risk of bias (the authors did not fully describe their randomisation method nor how or if they employed allocation concealment). 2 We downgraded the level of evidence with one level, i.e. from moderate to low quality, due to imprecision (a small sample size and a wide confidence interval including a null effect). | |||||
Background
Description of the condition
Exposure to light plays a crucial role in a diversity of biological processes. Light is not only fundamental to the image‐forming process that generates vision, but it also exerts non‐visual effects; promotes entrainment of the circadian clock (Bonmati‐Carrion 2014); and influences alertness, cognition (Chellappa 2011), and mood (Sahin 2013).
Alertness is a behavioural and physiological state of proper responsiveness to both internal and external stimuli. The understanding of alertness encompasses multiple dimensions in addition to vigilance, such as attention, impulse control and motivation (Shapiro 2006). However, for practical reasons, alertness has been regarded and evaluated as the opposite of sleepiness and fatigue (Kaida 2006a; Samn 1982). From the epidemiological perspective, the majority of data focus on the presence of symptoms of sleepiness rather than on the more subjective construct of alertness. Up to 25% of the general population report excessive sleepiness during daytime (Drake 2010; Ohayon 1997). The prevalence of daytime sleepiness is also considerable among daytime workers, affecting 12% of female and 7% of male workers (Doi 2003). Daytime sleepiness in the workforce is attributed to work‐related activities, long commutes and sleep deprivation (Doi 2002). In addition, other causes of excessive sleepiness are commonly found in the general population, such as sleep disorders, circadian misalignment and the use of sedative drugs. Impairment of alertness impacts quality of life at the individual level, and productivity, absenteeism and occupational accident risk at the organisational level (Liu 2000; Mullins 2014).
Light also influences mood, defined as the transitory state of pervasive emotions not oriented to any particular object or person (Clark 1982), thus impacting well‐being, behaviour and performance (Seibert 1991). This understanding has emerged partially by the recognition of the effectiveness of bright light therapy in seasonal affective disorder and in non‐seasonal affective syndromes. Adults exposed to low levels of illumination are more prone to exhibit symptoms of atypical depression (Espiritu 1994). People with depression show diminished amplitude of physiological rhythms, such as those of melatonin, cortisol and body temperature (Lanfumey 2013), which has been implicated in the pathophysiology of affective disorders.
Indoors, illuminance levels usually range from 100 Lux to 200 Lux, rarely surpassing 500 Lux. These levels of illuminance are considered sub‐optimal for non‐visual, biological effects of light (Hébert 1998; Mills 2007), which may bring negative consequences to daytime workers that spend most of the daytime indoors. This understanding has underpinned the development of lighting strategies focusing on alertness and other types of non‐visual effects. The body of research regarding lighting interventions in the workplace has evolved significantly over the last two decades through the conduction of studies in the laboratory (Borisuit 2015; Hoffmann 2008) and in the field (Boubekri 2014; Iskra‐Golec 2012; Kort 2010; Viola 2008). Nevertheless, there is still a lack of a clear knowledge about which types of light intervention should be recommended to effectively improve alertness and mood.
Description of the intervention
There are many different types of lighting interventions, which range from naturalistic approaches of exposure to daylight in a well‐designed workplace to the modification of light in its illuminance and spectrum. Examples of lighting interventions are:
-
different levels of illuminance;
-
manipulation of light spectrum or correlated colour temperature (CCT);
-
combined interventions (both illuminance and light spectrum or CCT);
-
exposure to daylight;
-
exposure to direct versus indirect light sources;
-
individual administration of light.
In addition to the range of types of interventions, there is considerable variability in lighting interventions in terms of the intensity (dosage), duration and timing of light delivery, and in terms of the comparator. Since it is virtually impossible to use an inactive control (total absence of light), comparators are some type of active control intervention. Polychromatic white light and light with different levels of illuminance or CCT are some of the most common comparators.
How the intervention might work
A vast body of evidence supports the existence of non‐visual effects of light. Exposure to high levels of illuminance reduces brain delta waves (Kuller 1993), indicating the promotion of alertness. Bright light reduces levels of sleepiness when applied at night‐time (Cajochen 2000), and during daytime (Phipps‐Nelson 2003). Bright light activates wakefulness‐promoting areas in the brain stem, hypothalamus and thalamus (Vandewalle 2006; Vandewalle 2007), improving neurobehavioural performance (Boyce 1997).
Formation of visual images depends basically on rods and cones located in the retina, but the non‐visual effect of light has also been attributed to the intrinsically photosensitive retinal ganglion cells (ipRGC), another type of retinal cell that contains the photopigment melanopsin. The sensitivity of melanopsin peaks at the blue spectrum of light (Berson 2002), which is different from the sensitivity of other opsins found in rods and cones. Rods and cones are also involved in the non‐visual effects of light, but to a lesser extent (Hubbard 2013). Modifying light in its spectrum to obtain blue‐enriched light aims at the maximum stimulation of ipRGCs to potentialise the non‐visual effect of light and to promote alertness. However, the alerting effect of light does not seem to be exclusive to the blue spectrum of light. Exposure to red light also increases subjective levels of alertness and the power in beta frequency on the electroencephalogram (Plitnick 2010), and improves performance (Sahin 2014), possibly through mechanisms independent of the circadian system involving activation of rods and cones.
Therefore, two mechanisms of action are hypothesised in the generation of the non‐visual effects of light: a circadian pathway through the stimulation of the suprachiasmatic nucleus of the circadian system leading to subsequent inhibition of melatonin secretion that is highly mediated by ipRGCs; and a direct effect, independent of the circadian system (Cajochen 2007; Chang 2013). The extent to which the direct effect of light is exerted through ipRGCs or through the participation of rods and cones is not totally clear. This theoretical debate brings practical implications considering the different peaks of sensitivity of melanopsin and other opsins. However, one important limitation to this dichotomic approach is the impossibility to separate the circadian effect completely from the direct effect of light. The majority of studies aiming at the elucidation of the direct effects of light employ protocols of light exposure occurring during daytime, when the circadian influence is less important, but still possible.
Why it is important to do this review
Poor exposure to light during daytime has been associated with lower levels of alertness and a negative impact on mood. However, many trials evaluating the efficacy of lighting interventions in improving alertness and mood are conducted within the laboratory, rather than in real settings, which may not be representative of real‐life effectiveness. A systematic review of lighting interventions focusing on the improvement of alertness and mood will help clarify which types of intervention are effective and safe in real‐life settings.
Objectives
To assess the effectiveness and safety of lighting interventions to improve alertness and mood in daytime workers.
Methods
Criteria for considering studies for this review
Types of studies
We considered for inclusion both individually randomised controlled trials (RCT) and cluster‐RCTs, and non‐randomised controlled before‐after (CBA) trials that employed a cross‐over or parallel‐group design or interrupted time‐series reporting at least three measurements before the intervention and three measurements after. Our decision to include non‐randomised studies was based on the fact that lighting interventions are usually carried out to entire floors and offices, rather than being applied at the individual level.
We included only studies conducted at real workplaces, thus excluding studies conducted under laboratory conditions.
Types of participants
We included studies conducted with adults aged 18 years and above performing work exclusively indoors, in the period restricted to 7:00 a.m. to 10:00 p.m., irrespective of type of work, industry and comorbidities.
We excluded studies conducted with participants on other types of working schedules such as night shifts or rotating shifts, to minimise the influence of circadian misalignment effects.
Types of interventions
We considered for inclusion trials that had compared the effectiveness of different types of light interventions as follows:
-
one level of illuminance versus another;
-
light of a particular spectrum or CCT versus another; such as blue‐enriched light versus standard illumination, or 'cool white' light (greater than 5000 K) versus 'warm white' light (less than 5000 K);
-
light of a particular illuminance and light spectrum or CCT versus another combination of illuminance and light spectrum or CCT;
-
daylight versus artificial light;
-
indirect versus direct light sources; or
-
individually administered light versus no treatment.
Types of outcome measures
The scope of this review was to evaluate the efficacy of lighting interventions on alertness and mood since there is compelling evidence that exposure to light during daytime plays a fundamental role in regulating the sleep‐wake cycle and in influencing mood. We included studies that assessed at least one of our primary outcomes.
Primary outcomes
-
Alertness.
We considered for inclusion studies measuring self‐perception of alertness, sleepiness and fatigue using validated scales such as the Karolinska Sleepiness Scale (Kaida 2006a), Stanford Sleepiness Scale (Hoddes 1973), Epworth Sleepiness Scale (ESS; Johns 1991), Samn‐Perelli fatigue checklist (Samn 1982), and visual analogue scales (VAS), or studies evaluating objective parameters, such as blinking duration, pupillometry and electroencephalogram.
-
Mood.
We included studies evaluating mood using validated scales and questionnaires containing questions about different feelings and emotions, such as the Profile of Mood States (Morfeld 2007) and the Positive and Negative Affect Schedule (PANAS) (Watson 1988). We also included studies using VAS.
Secondary outcomes
-
Adverse events.
Number of participants presenting any type of adverse effects caused by lighting interventions such as ocular irritation, photosensitivity, migraine, irritability and insomnia.
Search methods for identification of studies
Electronic searches
We conducted a systematic literature search to identify all published and unpublished trials that could be considered eligible for inclusion in this review. We adapted the search strategy we developed for PubMed for use in the other electronic databases. The literature search identified potential studies in all languages.
We searched the following electronic databases from inception to January 2018 for identifying potential studies:
-
Cochrane Central Register of Controlled Trials (CENTRAL) (Wiley Online Library) (Appendix 1);
-
MEDLINE (PubMed) (Appendix 2);
-
Embase (Embase.com) (Appendix 3);
-
PsycINFO (EBSCOhost) (Appendix 4);
-
NIOSHTIC (OSH‐UPDATE) (Appendix 5);
-
NIOSHTIC‐2 (OSH‐UPDATE) (Appendix 5);
-
HSELINE (OSH‐UPDATE) (Appendix 5);
-
CISDOC (OSH‐UPDATE) (Appendix 5);
-
LILACS (BVS) (Appendix 6);
-
SCOPUS (EBSCOhost) (Appendix 7).
We conducted a search for unpublished trials in ClinicalTrials.gov (www.ClinicalTrials.gov) (Appendix 8) and the World Health Organization (WHO) trials portal (www.who.int/ictrp/en/) (Appendix 9). We imposed no restriction on language of publication.
Searching other resources
We performed handsearching of the reference lists of all primary studies to find additional references.
Data collection and analysis
Selection of studies
We conducted the selection of eligible studies in two stages. First, two review authors (DVP, RR) independently screened titles and abstracts of all potentially relevant studies found by the systematic search to identify studies for inclusion. The same review authors coded them as 'include' (eligible or potentially eligible/unclear) or 'exclude.' At this stage, we excluded all references that clearly did not fulfil the inclusion criteria or that fulfilled the exclusion criteria. At the second stage, we retrieved the full‐text reports/publications and two review authors (DVP, RR) independently assessed the full text and identified studies for inclusion. We included all references that fulfilled the inclusion criteria. We recorded reasons for exclusion of the ineligible studies assessed as full‐texts and reported these in the Characteristics of excluded studies table. We resolved disagreements through discussion. We identified and excluded duplicates. We recorded the selection process in sufficient detail to complete a PRISMA study flow diagram (Figure 1).

PRISMA study flow diagram.
If studies had had multiple publications, we planned to collate the reports of the same study so that each study, rather than each report, was the unit of interest for the review, and such studies had a single identifier with multiple references.
Data extraction and management
We used a data collection form for study characteristics and outcome adapted from EPOC 2013 and previously piloted on one study. One review author (DVP) extracted the following study characteristics from included studies. A second review author (RR) spot‐checked study characteristics for accuracy against the trial report.
-
Methods: study design, total duration of study, study location, study setting, withdrawals and date of study.
-
Participants: number (n), mean age or age range, sex/gender, severity of condition, inclusion criteria and exclusion criteria.
-
Interventions: description of intervention, comparison, duration, intensity, content of both intervention and control condition, and co‐interventions.
-
Outcomes: description of primary and secondary outcomes specified and collected, and at which time points reported.
-
Notes: funding for trial and notable conflicts of interest of trial authors.
Two review authors (DVP, RR) independently extracted outcome data from included studies. We resolved disagreements by consensus. One review author (DVP) transferred data into Review Manager 5 (RevMan 2014). We double‐checked that data were entered correctly by comparing the data presented in the systematic review with those of the study reports.
Assessment of risk of bias in included studies
Two review authors (DVP, RR) independently assessed risk of bias for each study using the criteria outlined in the Cochrane Handbook for Systematic Reviews of Interventions (Higgins 2011). We resolved disagreements by discussion.
We assessed the risk of bias of all studies included in the review according to the following domains.
-
Random sequence generation.
-
Allocation concealment.
-
Blinding of participants and personnel.
-
Blinding of outcome assessment.
-
Incomplete outcome data.
-
Selective outcome reporting.
-
Other bias (non‐controlled co‐interventions or other potential source of bias).
When assessing the risk of bias of cluster trials, we added the domains of recruitment bias, baseline imbalance, loss of clusters, incorrect analysis and comparability with individually randomised trials. For cross‐over trials, we added the domains of carry‐over effect, availability of two‐periods of data, incorrect analysis and comparability of results with those from parallel‐group trials.
For CBA trials, we used the validated instrument for appraising the risk of bias of CBA studies by Downs 1998. The instrument has good reliability and internal consistency and validity and consists of five sub‐scales: reporting, external validity, bias, confounding and power). We used only the combined score on the two internal validity sub‐scales (bias and confounding) to judge the quality of the included controlled before‐after studies. We used an arbitrary cut‐off score of 50% of the maximum attainable score of the internal validity scale to discern low risk of bias from high risk of bias.
We also checked for relevant and considerable baseline differences between control and intervention groups based on age and gender.
We graded each potential risk of bias as high, low or unclear, and, whenever possible, we provided a quote from the study report together with a justification for our judgement in the 'Risk of bias' table. We summarised the risk of bias judgements across different studies for each of the domains listed.
When considering treatment effects, we took into account the risk of bias for the studies that had contributed to that outcome.
We judged a study to have a high risk of bias overall when we judged one or more domains to have a high risk of bias. Conversely, we judged a study to have a low risk of bias when we judged low risk of bias for all domains.
Assessment of bias in conducting the systematic review
We conducted this review according to the published protocol (Pachito 2016) and report deviations from it in the 'Differences between protocol and review' section.
Measures of treatment effect
We entered the outcome data for each study into the data tables in Review Manager 5 to calculate treatment effects (RevMan 2014). For dichotomous outcomes, we used risk ratios (RR) with 95% confidence intervals (CI). For continuous outcome, we planned to use mean difference (MD) and 95% CI for studies that assessed the same outcome measured the same way and standardised mean differences (SMD) and 95% CI for studies that assessed the same outcome measured in different ways (e.g. different scale or questionnaires). When only effect estimates and their 95% CI or standard errors were reported in studies, we entered these data into Review Manager 5 using the generic inverse variance method (RevMan 2014). We ensured that higher scores for continuous outcomes had the same meaning for a particular outcome.
Unit of analysis issues
For studies that employed a cluster‐randomised design and that had not made an allowance for the design effect, we calculated the design effect based on a fairly large assumed intracluster correlation coefficient (ICC) of 0.10. We based this assumption of 0.10 being a realistic estimate by analogy on studies about implementation research (Campbell 2001). We followed the methods stated in the Cochrane Handbook for Systematic Reviews of Interventions for the calculations (Higgins 2011).
Dealing with missing data
We contacted one investigator to verify key study characteristics and obtain missing numerical outcome data (Fostervold 2008).
When numerical outcome data were missing, such as standard deviations or correlation coefficients, we calculated them from other available statistics such as P values according to the methods described in the Cochrane Handbook for Systematic Reviews of Interventions (Higgins 2011).
Assessment of heterogeneity
We assessed the clinical homogeneity of the results of included studies based on similarity of intervention, outcome and follow‐up (Verbeek 2012).
Since the inclusion criteria for participant populations were well‐defined and somewhat restricted, we considered all populations as being sufficiently homogeneous to be compared, and Interventions similar when they represented the same mechanism of provision or modification of the light source (e.g. different illuminance levels, modification of light spectrum, exposure to daylight).
-
One level of illuminance versus another.
-
Light of a particular spectrum or CCT versus another; such as blue‐enriched light versus standard illumination, or 'cool white' light (greater than 5000 K) versus 'warm white' light (less than 5000 K).
-
Light of a particular illuminance and light spectrum or CCT versus another combination of illuminance and light spectrum or CCT.
-
Daylight versus artificial light.
-
Indirect versus direct light source.
-
Individually administered light versus no treatment.
We considered validated subjective scales and questionnaires and VAS that evaluated alertness or mood as being similar enough to be compared.
We used the I² statistic to measure heterogeneity across trials in each analysis. We considered substantial heterogeneity for I² values of 50% or greater (Higgins 2011), although we recognise that there is uncertainty in the I² measurement when there are few studies in a meta‐analysis. We used a significance level of P < 0.1 to assess heterogeneity.
Assessment of reporting biases
If we can include a sufficient number of studies in future updates of this review, we will explore reporting biases, according to the following domains (Higgins 2011).
-
Publication bias.
-
Multiple publication bias.
-
Location bias.
-
Citation bias.
-
Outcome reporting bias.
Data synthesis
We pooled data from studies judged to be clinically homogeneous using Review Manager 5 (RevMan 2014). When more than one study provided usable data in any single comparison, we performed a meta‐analysis. We previously defined that for meta‐analyses with an I² statistic lower than 50%, we would use a fixed‐effect model, and for an I² statistic of 50% or greater, we would use a random‐effects model. We planned not to pool results of studies in meta‐analysis when the I² statistic was higher than 75%.
For meta‐analysis, we planned to consider two distinct groups of controlled trials: randomised, and non‐randomised or quasi‐randomised.
For studies with multiple trial arms, we included all relevant arms. We had planned to describe study arms irrelevant to this review in detail in the Characteristics of included studies table. However, all study arms were relevant to this review.
'Summary of findings' table
We created 'Summary of findings' tables using both primary outcomes and the secondary outcome, namely alertness, mood and adverse events. When multiple measurements were reported for the same outcome, we elected the most representative measurement from the clinical perspective, and provided reasons for that. We used the five GRADE domains (study limitations, consistency of effect, imprecision, indirectness and publication bias) to assess the quality of the body of evidence as it relates to the studies that had contributed data to the meta‐analyses for the prespecified outcomes. We used methods and recommendations described in Section 8.5 and Chapter 12 of the Cochrane Handbook for Systematic Reviews of Interventions (Higgins 2011), and we used GRADEpro software. We justified all decisions to downgrade or upgrade the quality of studies in the footnotes.
Subgroup analysis and investigation of heterogeneity
If we can include a sufficient number of studies in future updates of this review, we will carry out subgroup analyses. We will conduct separate analyses based on the type of workers (blue‐collar (people who perform manual labour) versus white‐collar (people who perform professional jobs) workers) and the intensity, duration, timing and length of intervention. We will also compare intensity (dosage) of light using the criteria of photopic illuminance and melanopic illuminance, whenever possible.
We will also compare light interventions of different lengths: short term (up to three months), medium term (from three months up to one year) and long term (longer than one year) separately.
We found too few studies to perform subgroup analyses in this version of our review.
Sensitivity analysis
If we can include a sufficient number of studies in future updates of this review, we will perform sensitivity analyses defined a priori to assess the robustness of our conclusions. This will involve excluding studies with:
-
high risk of bias; or
-
industry sponsorship, respectively.
Bias in industry‐sponsored studies may exist in multiple levels and, therefore, may affect confidence in the results (Chopra 2003).
We found too few studies to perform sensitivity analyses in this version of our review.
Reaching conclusions
We based our conclusions only on the findings from the quantitative or narrative synthesis of the included studies, and we considered the quality of evidence for each outcome. We avoided making recommendations for practice based on more than just the evidence, such as values and available resources. Our implications for research suggest priorities for future research and outline what the remaining uncertainties are in the area.
Results
Description of studies
Results of the search
Our systematic search conducted in January 2018 yielded 2844 references, after the removal of 533 duplicates. After the screening of titles and abstracts, 34 full‐text articles were considered for inclusion. We scrutinised these study reports against our eligibility criteria, reaching the final inclusion of five studies. Studies excluded at this point are listed in the Characteristics of excluded studies table. Reasons for exclusion were design, setting and population different from the scope of this review. We found no ongoing studies that could fulfil our inclusion criteria and we identified no potential studies from other sources. The PRISMA study flow diagram is depicted in Figure 1.
Included studies
Study designs
Of the five included studies, three were RCTs (Avery 2001; Bragard 2013; Fostervold 2008) and two were CBA studies (Mills 2007; Viola 2008). All RCTs employed individual allocations, two with a parallel design (Avery 2001; Fostervold 2008), and one with a cross‐over design (Bragard 2013). Both CBA studies employed cluster allocation, one with a parallel design (Mills 2007), and one with a cross‐over design (Viola 2008).
Neither of the studies employing cluster allocation took into account the unity of analysis error, which meant we had to correct the effect estimates. We also performed the necessary adjustments for the cross‐over study by Bragard 2013.
Study location and time of the year
All studies were conducted in the Northern hemisphere, between latitudes of 47º 60' (Avery 2001) and 59º 91' (Fostervold 2008). Four studies were conducted in Europe and one study was conducted in North America (Avery 2001). All studies were conducted during wintertime, sometimes starting in the previous autumn or ending in the beginning of next spring, with the exception of the study by Fostervold 2008, which was conducted over a one‐year period.
Type of settings and participants
Four studies recruited participants irrespective of the presence of symptoms or complaints related to mood disorders or to difficulty in maintaining satisfactory levels of alertness during daytime (Bragard 2013; Fostervold 2008; Mills 2007; Viola 2008). Avery 2001 recruited participants presenting subsyndromal seasonal affective disorder.
Four studies recruited participants using advertisements (Avery 2001; Fostervold 2008; Mills 2007; Viola 2008), and one study used direct invitations in the workplace (Bragard 2013). In this last case, participation rate was either not reported or as low as 25% (Bragard 2013).
Four studies recruited office workers, working either in private offices or in open‐plan offices (Avery 2001; Fostervold 2008; Mills 2007; Viola 2008). Only one study focused on health workers performing activities in a windowless hospital department (Bragard 2013).
Sample sizes
The number of participants in the included studies ranged from 25 to 94 (mean 56). Studies with the lowest number of participants were the ones by Avery 2001 (n = 30), and Bragard 2013 (n = 25), in which the authors assessed individually applied light.
Interventions
One level of illuminance versus another
We found no studies employing this comparison.
Light of a particular spectrum or CCT versus another
We found two studies employing this comparison (Mills 2007; Viola 2008).
Mills 2007 and Viola 2008 assessed lamp changes to entire floors, comparing high CCT office lighting (17,000 K) versus standard lighting systems (2900 K for Mills 2007, and 4000 K for Viola 2008). Both types of fluorescent tubes were 18 W with a similar spectral power distribution in the medium and long wavelength ranges, but with more output between 420 nm to 480 nm for the 17,000 K light source. Both studies deployed the ActiViva Active, Philips as the 17,000 K light source.
Light of a particular illuminance and light spectrum or CCT versus another combination of illuminance and light spectrum or CCT
We found no studies employing this comparison.
Daylight versus artificial light
We found no studies employing this comparison.
Indirect versus direct light sources
We found one study employing this comparison (Fostervold 2008).
Fostervold 2008 evaluated four types of lighting systems, with different proportions of indirect and direct light sources. Lighting scheme 1 provided 100% indirect lighting; lighting scheme 2 provided 70% indirect lighting and 30% direct lighting; lighting scheme 3 provided 30% indirect lighting and 70% direct lighting; and lighting scheme 4 provided 100% direct lighting.
Individually administered light versus no treatment
We found two studies employing this comparison. The study by Avery 2001 evaluated using light boxes and the one by Bragard 2013 evaluated using glasses with mounted light emitting diodes (LEDs).
Avery 2001 assessed two hours of bright light in the morning, during the first two hours available between 07:00 a.m. and 12:00 a.m., versus two hours of bright light during the afternoon, during the last two hours available between 12:00 a.m. and 17:00 p.m. The bright light source was a light box, positioned 60 cm from the participant, capable of emitting 2500 Lux (Philips Bright Light). The study by Bragard 2013 assessed the use of glasses equipped with eight LEDs generating blue‐enriched light. Participants wore glasses at work in the morning between 07:00 and 09:00 a.m. for a maximum of 30 minutes daily at least five days a week.
Multiple intervention arms
The study by Fostervold 2008 employed multiple interventions arms that assessed four different types of lighting systems (lighting schemes 1 to 4; see Characteristics of included studies table). All the other studies restricted interventions to one arm. None of the included studies had cointerventions, the effects of which could have affected those of the lighting interventions.
Outcomes
Alertness
Avery 2001 assessed alertness using a VAS with a 100‐mm line. Other studies employed validated scales, such as the Epworth Sleepiness Scale (Bragard 2013); the Columbia Jet Lag Scale, specifically its items 'Decreased Daytime Alertness' and 'Sleepiness in Day' (Mills 2007); or the Karolinska Sleepiness Scale (Viola 2008). One included study did not assess alertness (Fostervold 2008).
Mood
Included studies employed validated scales and subscales for measuring mood, such as the Structured Interview Guide for the Hamilton Depression Rating Scale‐Seasonal Affective Disorders Version (SIGH‐SAD) and its subscales (Avery 2001; Bragard 2013) (Williams 1994); the Beck Depression Inventory (BDI; Bragard 2013; Fostervold 2008); or the PANAS scale for positive and negative mood (Viola 2008). In addition, Avery 2001 evaluated mood using a VAS 100‐mm line. One included study did not assess mood (Mills 2007).
Adverse events
Bragard 2013 and Mills 2007 did not evaluate adverse events related to light exposure. Avery 2001 used a questionnaire focusing on mild adverse events that were reported as one outcome. Fostervold 2008 evaluated ocular problems (pain or itching in the eyes, tired eyes, photophobia, redness of the eyes); reading problems (focusing problems, problems with line tracking, foggy letters or words, doubling of letters or words, shivering text); concentration problems; and musculoskeletal problems (pain in the neck, shoulder, back, forearm, or leg). Viola 2008 used a study questionnaire evaluating the incidence of irritability, eye strain, eye discomfort, eye fatigue, difficulty focusing and difficulty concentrating and blurred vision.
Follow‐up
The lengths of follow‐up were: two weeks (Avery 2001), four weeks (Viola 2008), three months (Mills 2007), 16 weeks (roughly 3.7 months) (Bragard 2013), and five months (Fostervold 2008).
Excluded studies
We excluded 29 studies (Characteristics of excluded studies table). The majority of these studies were conducted in laboratory settings or they employed cross‐sectional designs. Reasons for exclusion were as follows.
-
Setting: 10 studies were conducted in a laboratory, rather than at the workplace (Chen 2004; Hawes 2012; Huiberts 2016; Kaida 2006b; Kraneburg 2017; Leichtfried 2015; Lerchl 2009; Münch 2012; Vimalanathan 2014; Vossen 2016). One study applied the lighting intervention purely in a residential setting (Buffoli 2007), and one combined light exposure in residential and occupational settings (Partonen 2000). One study did not specify the setting and attempts to contact the primary researcher failed (NCT02858765).
-
Design: 10 were cross‐sectional studies or narrative reviews (Axarli 2008; Hadi 2015; Hegde 1991; Noell‐Waggoner 2008; Pathak 2014; Robertson 1989; Singh 2010; Stammerjohn 1981; van Bommel 2006; Weiss 2013). One study was uncontrolled with the participation of adults attending a lecture within a University facility (Lehrl 2007).
-
Outcome: neither alertness nor mood was evaluated (Aarås 1998; Haans 2014).
-
Population: one study assessed lighting interventions in undergraduate and graduate students (Gray 2012).
-
Intervention: in one study, the intervention of interest was different colours of walls (Janardana 2010) and in another study, the intervention was ventilation systems (Robertson 1985).
Risk of bias in included studies
Allocation
Randomisation
Three studies allocated participants to groups using randomisation (Avery 2001; Bragard 2013; Fostervold 2008). Bragard 2013 performed randomisation by random draw and we judged this to result in a low risk of bias. However, Avery 2001 and Fostervold 2008 did not describe the methods used to conduct randomisation. After contacting the authors for clarification, we considered the stratified randomisation procedure used for randomisation in Fostervold 2008, to be appropriate and thus of low risk of bias. Because we did not receive clarification on how randomisation was performed in Avery 2001, we judged it to have an unclear risk of bias. The studies by Mills 2007 and Viola 2008 employed cluster allocation, but did not mention randomising clusters into the study arms. Therefore we judged the two studies to have a high risk of bias.
Allocation concealment
None of the RCTs reported how allocation concealment was guaranteed (Avery 2001; Bragard 2013; Fostervold 2008), leading to the judgement of unclear risk of bias in this domain. We considered CBA studies to have a high risk of bias in this domain by design (Mills 2007; Viola 2008).
Blinding
Blinding of participants and personnel
Studies individually applying interventions, using light boxes (Avery 2001) and glasses equipped with LEDs (Bragard 2013), did not employ any type of sham intervention. Blinding was not feasible in studies in which the intervention was ambient lighting (Fostervold 2008; Mills 2007; Viola 2008). Therefore, we judged all studies to have a high risk of bias in this domain.
Blinding of outcome assessment
In the study by Avery 2001, a psychiatrist blindly evaluated participants for outcome assessment. This was the only study we judged to be at low risk of bias in this domain. All other studies assessed outcomes using self‐assessed questionnaires (Bragard 2013; Fostervold 2008; Mills 2007; Viola 2008). As participants were not blinded, we judged this modality of outcome assessment to lead to a high risk of bias.
Incomplete outcome data
Two studies presented no attrition (Mills 2007) or very limited attrition (Avery 2001) during the entire follow‐up period and thereby we judged both to have a low risk of bias. Reasons for a judgment of high risk of bias in this domain were imbalance in attrition distribution between study arms (Fostervold 2008), and lack of information on attrition with respective to study arms (Viola 2008), or with respective to reasons of attrition (Bragard 2013).
Selective reporting
The study by Bragard 2013 did not report data obtained for the SIGH‐HDRS scale, reporting only results of the Beck Depression Inventory. Consequently we judged the study to have a high risk of bias . All other studies reported full data for each of the prespecified outcomes and therefore we judged them to have a low risk of reporting bias (Avery 2001; Fostervold 2008; Mills 2007; Viola 2008).
Other potential sources of bias
We could not rule out the possibility of baseline imbalance in the Avery 2001 study, due to missing data for baseline values of VAS for two participants in the a.m. group and five in the p.m. group. Consequently we judged the study to have an unclear risk of bias.
The risk of bias assessment of studies that employed cluster allocation or a cross‐over design included specific additional risk of bias domains. We assessed the risk of bias of CBA studies using a combined score of the two internal validity subscales (bias and confounding) of the Downs and Black Checklist (Downs 1998).
Risk of bias of studies employing cluster allocation
Two studies allocated participants in clusters rather than at the individual level (Mills 2007; Viola 2008). Specific risk of bias domains for CBA studies with cluster allocation include: recruitment bias, baseline imbalance, loss of clusters, incorrect analysis and comparability with individually randomised trials.
We judged Mills 2007 to have a high risk of recruitment bias, due to the low participation rate (49%). We judged Viola 2008 to have an unclear risk of recruitment bias since the authors did not report participation rate.
We judged both Mills 2007 and Viola 2008 to have a low risk of bias due to baseline imbalance. There were no differences between study arms regarding baseline values for the Columbia Jet Lag Scale in Mills 2007, and Viola 2008 employed a crossover design.
Both Mills 2007 and Viola 2008 reported data for all clusters included in the study and therefore we judged them to be at low risk of bias for loss of clusters.
We judged both Mills 2007 and Viola 2008 to have a high risk of bias for the incorrect analysis domain because in both cases the authors did not account for the design effect in their statistical analyses.
We judged both Mills 2007 and Viola 2008 to have an unclear risk of bias due to comparability with individually randomised trials since we found no individually randomised trials employing the same intervention.
Risk of bias of cross‐over studies
Two studies employed a cross‐over design (Bragard 2013; Viola 2008). Specific risk of bias domains for this category include: carry‐over effect, availability of data for the two time periods, incorrect analysis and comparability of results with those from parallel‐group trials.
We could not discard the possibility of carry‐over effect in either study, considering that neither employed a washout period. Therefore we judged both Bragard 2013 and Viola 2008 to have an unclear risk of bias in this domain.
Regarding availability of data for the two time periods and incorrect analysis domains, we judged both Bragard 2013 and Viola 2008 to have a low risk of bias, as they presented paired analyses from both periods.
For comparability of results with those from parallel‐group trials, we judged Bragard 2013 to be at unclear risk of bias and Viola 2008 to be at low risk of bias when we compared them with parallel‐group trials that had employed the same comparisons.
We present the results of our judgment of the risk of bias of included studies for the above domains in Figure 2 and Figure 3.
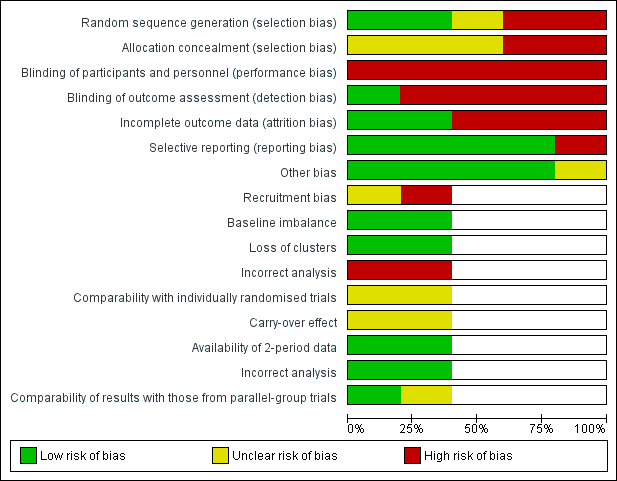
Risk of bias graph: review authors' judgements about each risk of bias item presented as percentages across all included studies.

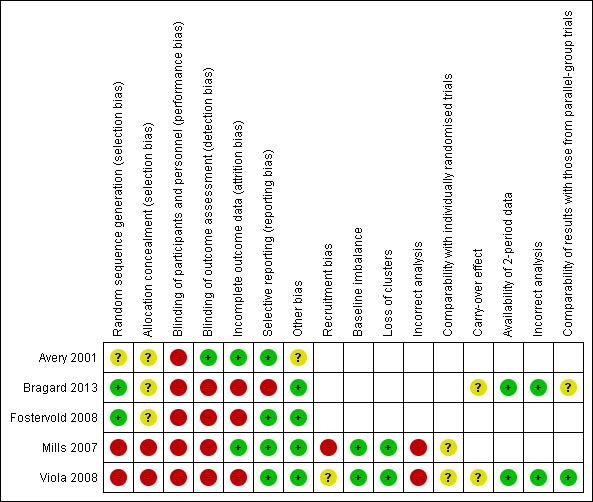
Risk of bias summary: review authors' judgements about each risk of bias item for each included study.
Risk of bias of controlled before‐after studies
Two studies employed a CBA design (Mills 2007; Viola 2008). For these studies, we assessed risk of bias also by using the Downs and Black Scale (Downs 1998).
The study by Mills 2007 scored 9/13 points, and we judged it to be at low risk of bias according to our prespecified cut‐off score of 50% of the maximum attainable score of the internal validity scale. Our judgements were as follows.
-
Items 16, 17, 18, 19, 20, 21, 22, 25, 26: low risk.
-
Items 14, 15, 23, 24: high or unclear risk.
The study by Viola 2008 scored 7/13 points, and we judged it to be at low risk of bias, according to the same criterion. Our judgements were as follows.
-
Items 16, 17, 18, 19, 20, 21, 22: low risk.
-
Items 14, 15, 23, 24, 25, 26: high or unclear risk.
Reporting biases
Overall, we considered there to be a low risk for reporting biases influencing conclusions in this review. Publication bias could not be assessed as the single meta‐analysis in this review included only two studies. We did not locate redundant or multiple publications for any of the included studies, leading us to conclude that there was a low risk for multiple publication bias. All the included studies were published in peer‐reviewed journals and they were indexed in at least one of the searched databases. Therefore, we considered location bias as low risk. We found no additional studies after searching the reference lists of included studies, leading to the judgement of a low risk of citation bias. Only one study did not report some of the prespecified outcomes. The remaining four studies reported all outcomes described in their methods sections. For this reason, we considered there to be a low risk of outcome reporting bias.
Effects of interventions
See: Summary of findings for the main comparison High correlated colour temperature light versus standard illumination for improving mood and alertness in daytime workers; Summary of findings 2 Indirect light versus direct light for improving mood and alertness in daytime workers; Summary of findings 3 Individually applied blue‐enriched light versus no treatment for improving mood and alertness in daytime workers; Summary of findings 4 Morning bright light versus afternoon bright light for improving mood and alertness in daytime workers
Comparison 1: One level of illuminance versus another
We found no studies.
Comparison 2: Light of a particular CCT versus another
We found two cluster‐CBA studies comparing high CCT versus standard illumination that did not make the necessary adjustments for the unit‐of‐analysis error (Mills 2007; Viola 2008). We corrected for this using a prespecified ICC of 0.1. We calculated the effective sample size using the following formula. Effective sample size = 1 + (M − 1) ICC, where M was the mean cluster size.
All analyses reported below were adjusted according to this method.
Primary outcomes
Alertness
The studies comparing high CCT versus standard illumination assessed alertness using the Columbia Jet Lag Scale (Mills 2007), and the Karolinska Sleepiness Scale (Viola 2008).
For the study by Mills 2007, we based our conclusions on the results reported for the item 'Decreased Daytime Alertness,' because we considered this item as the better representative of alertness among all items that compose the multidimensional Columbia Jet Lag Scale. After adjusting for the design effect, there was no statistically significant difference for the item 'Decreased Daytime Alertness' (MD −0.30, 95% CI −1.15 to 0.55; participants = 69; effective sample size = 16; Analysis 1.1). The results presented for the item 'Sleepiness in Day' also supported this finding (MD −0.70, 95% CI −1.67 to 0.27; participants = 69; effective sample size = 16; Analysis 1.2).
Contrary to these findings, in the study by Viola 2008, participants exposed to high CCT light reported better levels of alertness using the Karolinska Sleepiness Scale (MD −0.44, 95% CI −0.79 to −0.09; participants = 94; effective sample size = 34; Analysis 1.3).
By pooling the results of Mills 2007 and Viola 2008 via meta‐analysis we found that high CCT lighting improved alertness (SMD −0.69, 95% CI −1.28 to −0.10; participants = 163; effective sample size = 50; I² = 0%; very low‐quality evidence; Analysis 1.4; Figure 4).
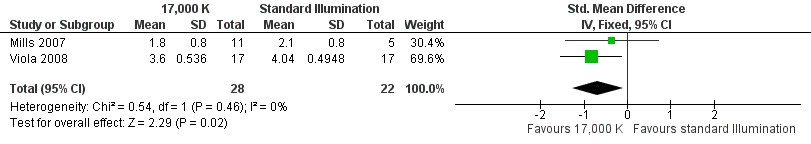
Forest plot of comparison: 4 High correlated colour temperature light versus standard illumination, outcome: alertness.
Mood
The study by Viola 2008 compared the effects of high CCT versus standard illumination on mood , using the PANAS scale (Watson 1988). There was no difference between high CCT and standard illumination for both positive (MD 2.08, 95% CI −0.10 to 4.26; participants = 94; effective sample size = 34; very low‐quality evidence) (Analysis 1.5) and negative feelings and emotions (MD −0.45, 95% CI −1.84 to 0.94; participants = 94; effective sample size = 34; very low‐quality evidence; Analysis 1.6).
Secondary outcome
Adverse events
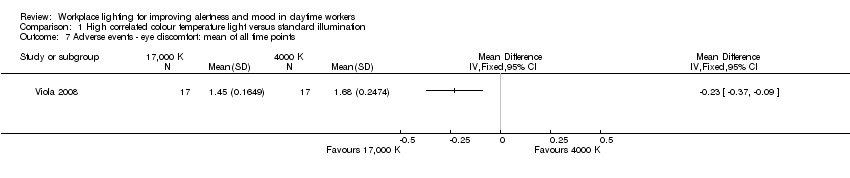
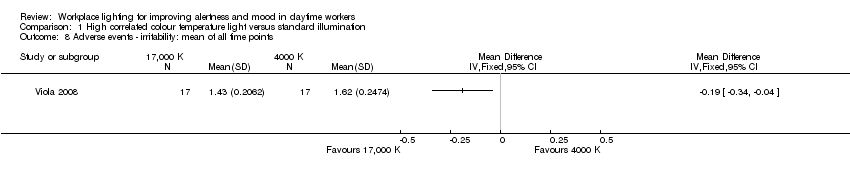
The study by Viola 2008 assessed several adverse events, including irritability, headache, eye strain, eye discomfort, eye fatigue, difficulties in focusing, difficulties in concentration and blurred vision. We considered eye discomfort the most relevant adverse event from the clinical perspective and based our conclusions on this result. The high CCT light group presented fewer adverse events than standard illumination (mean of all time points; MD −0.23, 95% CI −0.37 to −0.09; participants = 94; effective sample size = 34; very low‐quality evidence; Analysis 1.7).
Comparison 3: Light of a particular illuminance and light spectrum or CCT versus another combination of illuminance and light spectrum or CCT
We found no studies.
Comparison 4: Daylight versus artificial light
We found no studies.
Comparison 5: Indirect versus direct light sources
The RCT study by Fostervold 2008 compared different proportions of direct and indirect indoor lighting according to the following four schemes: 100% indirect lighting; 70% indirect lighting combined with 30% direct lighting; 30% indirect lighting combined with 70% direct lighting; and 100% direct lighting. The authors measured intervention effects on their chosen outcomes in the medium term (two to five months). Our conclusions are based on the comparison of indirect versus direct lighting for the five‐month period. We selected the measurements carried out at the five‐month period to account for effects in a longer period of follow‐up.
Primary outcomes
Alertness
The Fostervold 2008 study did not assess alertness.
Mood
The Fostervold 2008 study assessed mood using the BDI Scale. There was no statistically significant difference between participants exposed to indirect lighting and those exposed to direct lighting (MD 1.00, 95% CI −2.86 to 4.86; participants = 22; low‐quality evidence; Analysis 2.1).
Secondary outcome
Adverse events
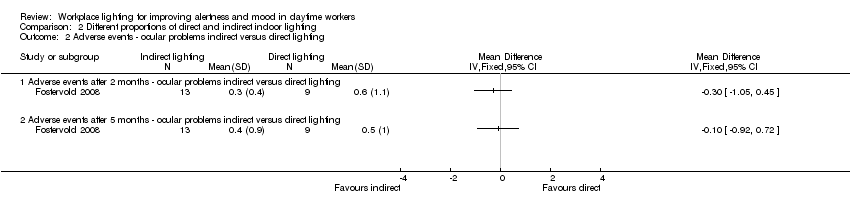
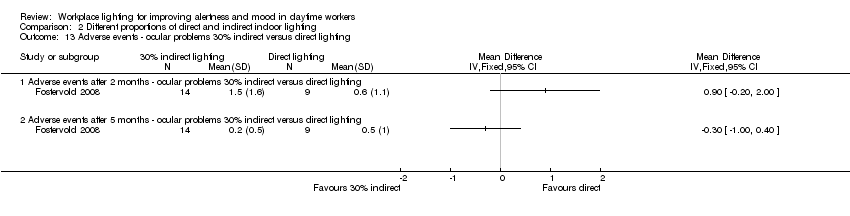
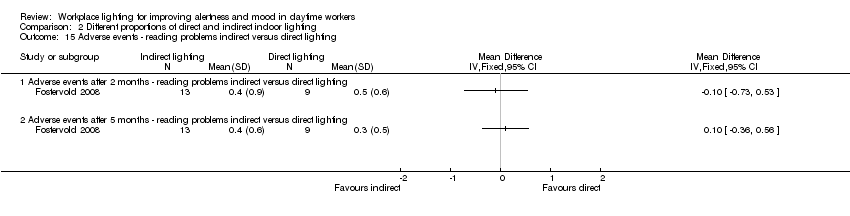
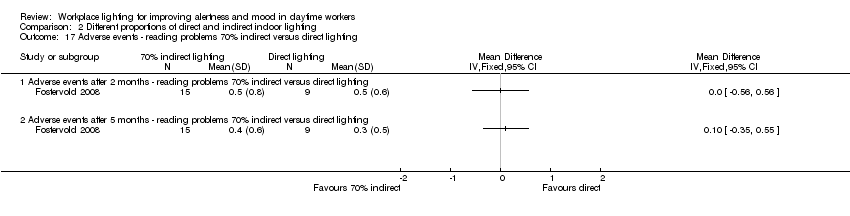
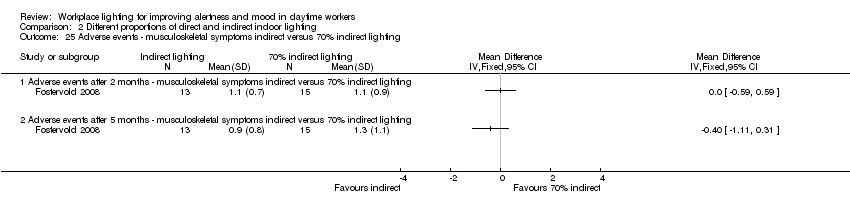
The Fostervold 2008 study measured ocular, reading and concentration problems, and musculoskeletal symptoms. The authors assessed each one of these symptoms at both time points (two and five months). We based our conclusions on the measurements of ocular problems, because we considered this group of symptoms as the most clinically relevant.
There was no statistically significant difference between indirect and direct lighting in regards to ocular problems after five months (MD −0.10, 95% CI −0.92 to 0.72; participants = 22; low‐quality evidence; Analysis 2.2).
Comparison 6: Individually administered light versus no treatment
The cross‐over RCT by Bragard 2013 compared individually applied blue‐enriched light versus no treatment. The authors presented results for baseline, after one month of intervention, after one month without treatment and after the second period receiving intervention. Results below refer to paired analyses between baseline and first period of intervention.
Primary outcomes
Alertness
The Bragard 2013 study assessed alertness using the ESS. After one month of exposure to blue‐enriched light, participants reported higher levels of alertness in relation to baseline levels (MD −3.30, 95% CI −6.28 to −0.32, participants = 25; cross‐over design; very low‐quality evidence; Analysis 3.1).
Mood
The Bragard 2013 study assessed mood using the Structured Interview Guide for the Hamilton Depressive Rating Scale, seasonal affective disorders version (SIGH‐HDRS) and the BDI‐II. The investigators reported only results for BDI‐II. Participants exposed to blue‐enriched light reported lower scores for the BDI‐II, which indicated improvement in the mood state, when compared to baseline levels (MD −4.80, 95% CI −9.46 to −0.14; participants = 25; cross‐over design; very low‐quality evidence; Analysis 3.2).
Secondary outcome
Adverse events
The Bragard 2013 study did not report adverse events.
Comparison 7: morning bright light versus afternoon bright light
The RCT study by Avery 2001 compared exposure to morning bright light versus afternoon bright light. The authors measured effects on outcomes after two weeks of intervention.
Primary outcomes
Alertness
The Avery 2001 study assessed alertness using a VAS. There was no statistically significant difference between the two groups (MD 7.00, 95% CI −10.18 to 24.18; participants = 30; low‐quality evidence; Analysis 4.1).
Mood
The Avery 2001 study assessed mood using six different measurements, namely frequency of participants showing a reduction of at least 50% in SIGH‐SAD scores from baseline; SIGH‐SAD score; HDRS‐21; HDRS‐17; SAD‐subscale and VAS. We considered the reduction of at least 50% in SIGH‐SAD scores from baseline the most relevant outcome from the clinical perspective, considering that the study participants were people with subsyndromal mood disorder and that the SIGH‐SAD encompasses specific items for seasonal affective disorder. Therefore, we based our conclusions on this measurement.
There was no statistically significant difference in respective to the number of participants reporting a reduction of at least 50% in SIGH‐SAD scores from baseline in the group exposed to bright light in the afternoon compared with exposure in the morning (RR 1.60, 95% CI 0.81 to 3.20; participants = 30; low‐quality evidence; Analysis 4.2).
Secondary outcomes
Adverse events
The Avery 2001 study reported that there were no major adverse events. The authors reported minor adverse events, such as glare from the bright light, eyestrain, headache and agitation as one outcome. There was no difference between groups regarding minor side effects (RR 0.53, 95% CI 0.26 to 1.07; participants = 30; low‐quality evidence; Analysis 4.8).
Discussion
Summary of main results
There is very low‐quality evidence based on two cluster‐CBA studies conducted with 163 participants that high correlated colour temperature light may improve alertness measured with a modified version of the Columbia Jet Lag Scale and the Karolinska Sleepiness Scale (SMD of 0.69 lower, 95% CI −1.28 to −0.1) when compared with standard illumination.
There is very low‐quality evidence based on one cluster‐CBA study with a unit‐of‐analysis error conducted with 94 participants that there is no difference in positive mood (MD 2.08, 95% CI −0.1 to 4.26) or negative mood (MD −0.45, 95% CI −1.84 to 0.94) between high CCT light and standard lighting, when assessed using the PANAS scale.
There is very low‐quality evidence based on one cluster‐CBA study conducted with 94 participants that high CCT light may cause less irritability, eye discomfort and headache than standard illumination, suggesting that high CCT light is well tolerated and safe.
There is low‐quality evidence based on one RCT conducted with 64 participants that different proportions of direct and indirect light in the workplace do not affect alertness, mood or adverse effects.
There is very low‐quality evidence based on one cross‐over RCT conducted with 25 participants that individually applied blue‐enriched light given for 30 minutes a day for at least five days a week increased alertness, as assessed using the ESS (MD −3.30, 95% CI −6.28 to −0.32) and improved mood, as assessed using the BDI (MD −4.80, 95% CI −9.46 to −0.14).
There is low‐quality evidence based on one RCT conducted with 30 participants that individually administered bright light during the afternoon is as effective as morning exposure for improving alertness and mood in subsyndromal seasonal affective disorder. There was no difference in the number of participants presenting with a change in alertness levels (MD 7.00, 95% CI −10.18 to 24.18), a decrease of at least 50% in SIGH‐SAD scores (RR 1.60, 95% CI 0.81 to 3.20) or in the frequency of adverse events (RR 0.53, 95% CI 0.26 to 1.07).
Overall completeness and applicability of evidence
All the included studies were conducted in the Northern hemisphere, between latitudes 47º 60' and 59º 91'. It was not possible to estimate whether the findings of these studies could be extrapolated to tropical or subtropical regions, where natural light is intense even in the winter.
With the exception of the Bragard 2013 study that was conducted within a hospital facility, all other studies applied lighting interventions in single‐occupancy or open plan offices. We found no studies that included blue‐collar workers, and it seems logical to assume that the effects of lighting might be significantly different for this population.
In all included studies participants assessed their own alertness and mood subjectively. None of the studies used objective measures of alertness, such as pupillometry or ocular reflectance, possibly due to their intrusive nature.
We found no studies that evaluated different levels of illuminance, light of a particular illuminance and light spectrum or CCT versus another combination of illuminance and light spectrum or CCT; or exposure to day light.
Quality of the evidence
All findings in this review are based on low‐quality or very low‐quality evidence. None of three included RCTs stated methods used for ensuring allocation concealment. The nature of the intervention itself imposed limitations to blinding of personnel and participants. In four out of five included studies participants assessed the outcomes of interest using self‐report scales or questionnaires and thus we judged them to have a high risk of bias in the blinding of outcome assessors domain. The study by Avery 2001 was an exception in that it employed a blind outcome assessor and thus we judged it to have a low risk of bias in this domain.
Two CBA studies employed cluster allocation. However, neither of them corrected for the unit‐of‐analysis error by calculating the effective sample size. Consequently we performed this correction and the resultant calculated sample sizes were appreciably lower than the original sample sizes due to the low number of clusters in each study. This resulted in wide confidence intervals meaning highly imprecise results.
Both studies evaluating the effects of high CCT light (Mills 2007; Viola 2008) were sponsored by the industry, raising concerns about funding bias. The potential for bias in industry‐sponsored studies may exist in multiple levels, and ideally, results should be replicated by independent research for a greater confidence in the results.
Potential biases in the review process
We chose to include non‐randomised CBA studies based on the assumption that ambient lighting interventions would make randomisation more cumbersome, yet not impossible. Indeed, two of the five included studies were non‐randomised, controlled before‐after studies with cluster allocation. The inclusion of non‐randomised studies had implications on our assessment of the quality of evidence such that evidence produced by the CBA studies started at low quality to begin with.
We assumed that different types of validated scales were comparable across studies. However, distinct scales may reflect a construct somewhat different from the outcome of interest. For instance, one study assessed sleepiness using the ESS, which is considered an instrument to assess trait aspects of sleepiness. Another study assessed alertness using the Karolinska Sleepiness Scale, which primarily addresses transitory states. Regardless of these differences, we considered that both instruments provided reliable measurements of alertness.
For studies employing different measurements for the same outcome, we selected the most relevant one from the clinical perspective, to base our conclusions on.
For studies that allocated participants in clusters, we accounted for the design effect by employing an intraclass coefficient we had defined a priori as 0.1. We then calculated the effective sample size. This adjustment might have underestimated effect sizes and underpowered the results.
We could not rule out publication bias, since we could include only two studies in the single meta‐analysis.
Agreements and disagreements with other studies or reviews
To the best of our knowledge, this is the first attempt to conduct a systematic review of the effectiveness of workplace lighting interventions to improve alertness and mood in daytime workers. Therefore, it was not possible to compare our results against those of previous reviews.
Laboratory studies have supported the assumption that blue‐enriched light may particularly enhance alertness. According to Chellappa 2011, exposure to light at 6500 K improves subjective alertness, sustained attention, well‐being and visual comfort, in addition to reducing melatonin levels, even for levels of illuminance as low as 40 Lux. One laboratory study using different lighting systems showed that high CCT light reduces fatigue levels and improves reaction time and mood (Hawes 2012).
In this sense, our findings are partially aligned with the evidence derived from laboratory studies. We found very low‐quality evidence that high CCT light improves subjective alertness and very low‐quality evidence that individually applied blue‐enriched light improves alertness and mood.

PRISMA study flow diagram.

Risk of bias graph: review authors' judgements about each risk of bias item presented as percentages across all included studies.
Risk of bias summary: review authors' judgements about each risk of bias item for each included study.

Forest plot of comparison: 4 High correlated colour temperature light versus standard illumination, outcome: alertness.

Comparison 1 High correlated colour temperature light versus standard illumination, Outcome 1 Alertness ‐ Item Decreased Daytime Alertness from Columbia Jet Lag Scale 14 weeks.

Comparison 1 High correlated colour temperature light versus standard illumination, Outcome 2 Alertness ‐ Item Sleepiness in Day from Columbia Jet Lag Scale 14 weeks.

Comparison 1 High correlated colour temperature light versus standard illumination, Outcome 3 Alertness ‐ Karolinska Sleepiness Scale: mean of all time points.

Comparison 1 High correlated colour temperature light versus standard illumination, Outcome 4 Alertness ‐ meta‐analysis.

Comparison 1 High correlated colour temperature light versus standard illumination, Outcome 5 Mood ‐ Positive Mood PANAS Scale: mean of all time points.

Comparison 1 High correlated colour temperature light versus standard illumination, Outcome 6 Mood ‐ Negative Mood PANAS Scale: mean of all time points.
Comparison 1 High correlated colour temperature light versus standard illumination, Outcome 7 Adverse events ‐ eye discomfort: mean of all time points.
Comparison 1 High correlated colour temperature light versus standard illumination, Outcome 8 Adverse events ‐ irritability: mean of all time points.
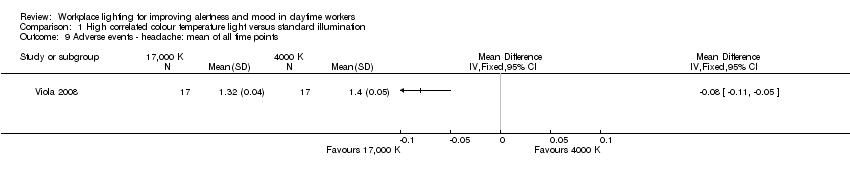
Comparison 1 High correlated colour temperature light versus standard illumination, Outcome 9 Adverse events ‐ headache: mean of all time points.

Comparison 1 High correlated colour temperature light versus standard illumination, Outcome 10 Adverse events ‐ eye strain: mean of all time points.
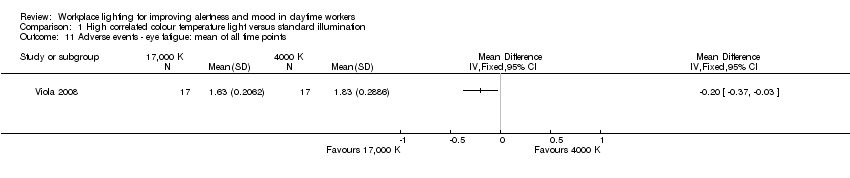
Comparison 1 High correlated colour temperature light versus standard illumination, Outcome 11 Adverse events ‐ eye fatigue: mean of all time points.

Comparison 1 High correlated colour temperature light versus standard illumination, Outcome 12 Adverse events ‐ difficult focusing: mean of all time points.

Comparison 1 High correlated colour temperature light versus standard illumination, Outcome 13 Adverse events ‐ difficulty concentrating: mean of all time points.

Comparison 1 High correlated colour temperature light versus standard illumination, Outcome 14 Adverse events ‐ blurred vision: mean of all time points.
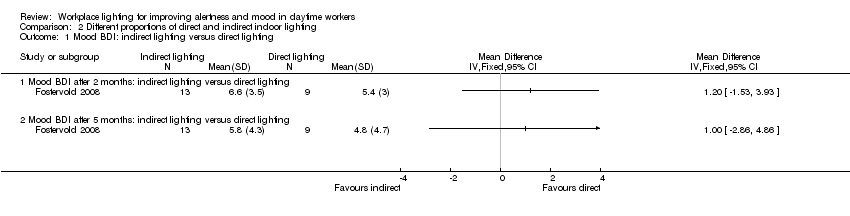
Comparison 2 Different proportions of direct and indirect indoor lighting, Outcome 1 Mood BDI: indirect lighting versus direct lighting.
Comparison 2 Different proportions of direct and indirect indoor lighting, Outcome 2 Adverse events ‐ ocular problems indirect versus direct lighting.

Comparison 2 Different proportions of direct and indirect indoor lighting, Outcome 3 Mood Beck Depression Inventory (BDI): indirect lighting versus 70% indirect lighting.
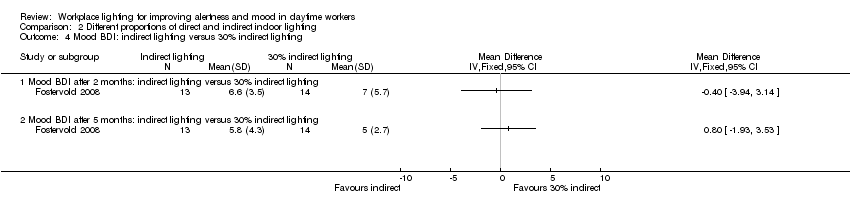
Comparison 2 Different proportions of direct and indirect indoor lighting, Outcome 4 Mood BDI: indirect lighting versus 30% indirect lighting.
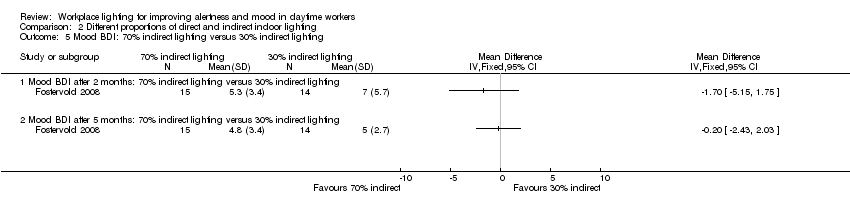
Comparison 2 Different proportions of direct and indirect indoor lighting, Outcome 5 Mood BDI: 70% indirect lighting versus 30% indirect lighting.
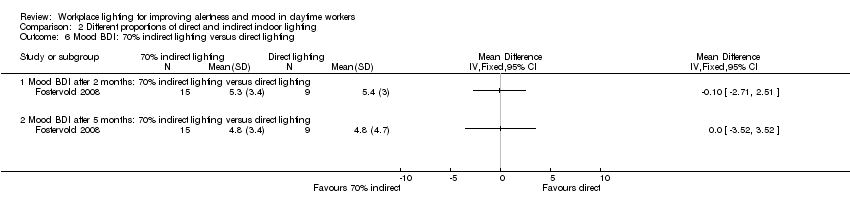
Comparison 2 Different proportions of direct and indirect indoor lighting, Outcome 6 Mood BDI: 70% indirect lighting versus direct lighting.

Comparison 2 Different proportions of direct and indirect indoor lighting, Outcome 7 Mood BDI: 30% indirect lighting versus direct lighting.
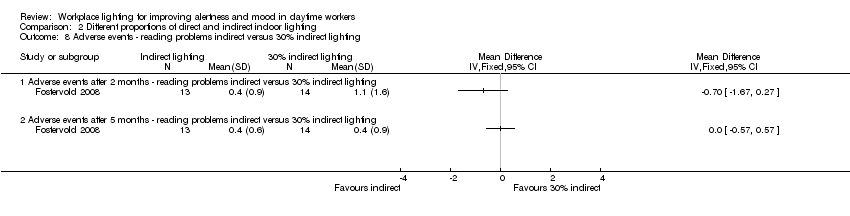
Comparison 2 Different proportions of direct and indirect indoor lighting, Outcome 8 Adverse events ‐ reading problems indirect versus 30% indirect lighting.

Comparison 2 Different proportions of direct and indirect indoor lighting, Outcome 9 Adverse events ‐ ocular problems indirect versus 70% indirect lighting.

Comparison 2 Different proportions of direct and indirect indoor lighting, Outcome 10 Adverse events ‐ ocular problems indirect versus 30% indirect lighting.

Comparison 2 Different proportions of direct and indirect indoor lighting, Outcome 11 Adverse events ‐ ocular problems 70% indirect versus 30% indirect lighting.

Comparison 2 Different proportions of direct and indirect indoor lighting, Outcome 12 Adverse events ‐ ocular problems 70% indirect versus direct lighting.
Comparison 2 Different proportions of direct and indirect indoor lighting, Outcome 13 Adverse events ‐ ocular problems 30% indirect versus direct lighting.

Comparison 2 Different proportions of direct and indirect indoor lighting, Outcome 14 Adverse events ‐ reading problems indirect versus 70% indirect lighting.
Comparison 2 Different proportions of direct and indirect indoor lighting, Outcome 15 Adverse events ‐ reading problems indirect versus direct lighting.

Comparison 2 Different proportions of direct and indirect indoor lighting, Outcome 16 Adverse events ‐ reading problems 70% indirect versus 30% indirect lighting.
Comparison 2 Different proportions of direct and indirect indoor lighting, Outcome 17 Adverse events ‐ reading problems 70% indirect versus direct lighting.

Comparison 2 Different proportions of direct and indirect indoor lighting, Outcome 18 Adverse events ‐ reading problems 30% indirect versus direct lighting.
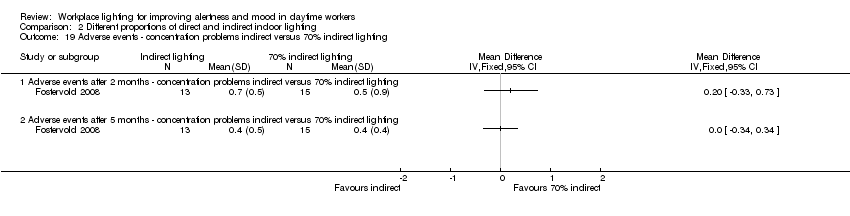
Comparison 2 Different proportions of direct and indirect indoor lighting, Outcome 19 Adverse events ‐ concentration problems indirect versus 70% indirect lighting.

Comparison 2 Different proportions of direct and indirect indoor lighting, Outcome 20 Adverse events ‐ concentration problems indirect versus 30% indirect lighting.

Comparison 2 Different proportions of direct and indirect indoor lighting, Outcome 21 Adverse events ‐ concentration problems indirect versus direct lighting.

Comparison 2 Different proportions of direct and indirect indoor lighting, Outcome 22 Adverse events ‐ concentration problems 70% indirect versus 30% indirect lighting.
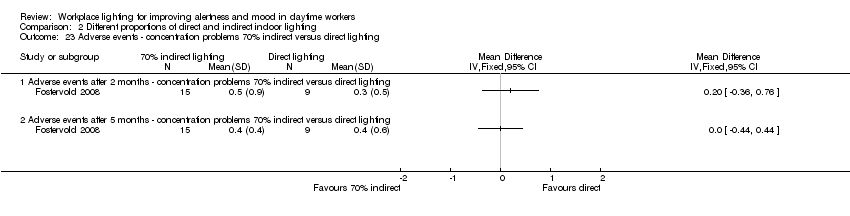
Comparison 2 Different proportions of direct and indirect indoor lighting, Outcome 23 Adverse events ‐ concentration problems 70% indirect versus direct lighting.
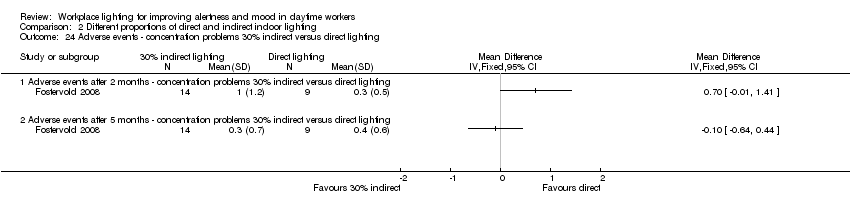
Comparison 2 Different proportions of direct and indirect indoor lighting, Outcome 24 Adverse events ‐ concentration problems 30% indirect versus direct lighting.
Comparison 2 Different proportions of direct and indirect indoor lighting, Outcome 25 Adverse events ‐ musculoskeletal symptoms indirect versus 70% indirect lighting.
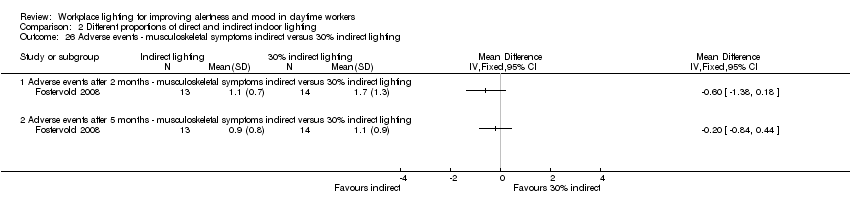
Comparison 2 Different proportions of direct and indirect indoor lighting, Outcome 26 Adverse events ‐ musculoskeletal symptoms indirect versus 30% indirect lighting.

Comparison 2 Different proportions of direct and indirect indoor lighting, Outcome 27 Adverse events ‐ musculoskeletal symptoms indirect versus direct lighting.

Comparison 2 Different proportions of direct and indirect indoor lighting, Outcome 28 Adverse events ‐ musculoskeletal symptoms 70% indirect versus 30% indirect lighting.

Comparison 2 Different proportions of direct and indirect indoor lighting, Outcome 29 Adverse events ‐ musculoskeletal symptoms 70% indirect versus direct lighting.

Comparison 2 Different proportions of direct and indirect indoor lighting, Outcome 30 Adverse events ‐ musculoskeletal symptoms 30% indirect versus direct lighting.

Comparison 3 Individually applied blue‐enriched light versus no treatment, Outcome 1 Alertness ‐ Epworth Sleepiness Scale.

Comparison 3 Individually applied blue‐enriched light versus no treatment, Outcome 2 Mood Beck Depression Inventory‐II.

Comparison 4 Morning bright light versus afternoon bright light, Outcome 1 Alertness (visual analogue scale (VAS)) after 2 weeks of intervention.

Comparison 4 Morning bright light versus afternoon bright light, Outcome 2 Mood (≥ 50% of reduction of Structured Interview Guide for the Hamilton Depression Rating Scale‐Seasonal Affective Disorders Version (SIGH‐SAD) scores from baseline after 2 weeks of treatment)).
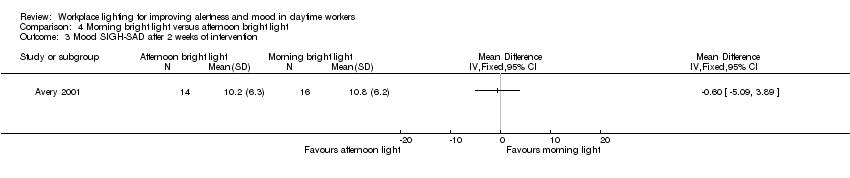
Comparison 4 Morning bright light versus afternoon bright light, Outcome 3 Mood SIGH‐SAD after 2 weeks of intervention.
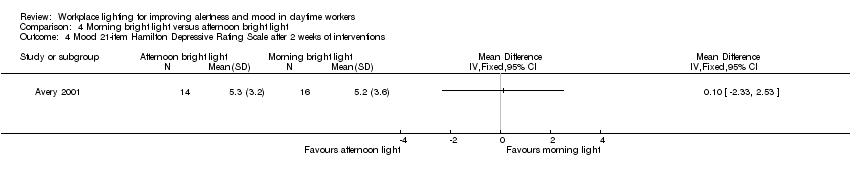
Comparison 4 Morning bright light versus afternoon bright light, Outcome 4 Mood 21‐item Hamilton Depressive Rating Scale after 2 weeks of interventions.

Comparison 4 Morning bright light versus afternoon bright light, Outcome 5 Mood 17‐item Hamilton Depressive Rating Scale after 2 weeks of intervention.

Comparison 4 Morning bright light versus afternoon bright light, Outcome 6 Mood Seasonal Affective Disorders subscale after 2 weeks of intervention.

Comparison 4 Morning bright light versus afternoon bright light, Outcome 7 Mood VAS after 2 weeks of intervention.
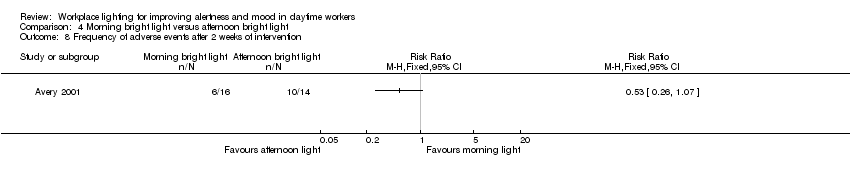
Comparison 4 Morning bright light versus afternoon bright light, Outcome 8 Frequency of adverse events after 2 weeks of intervention.
| High correlated colour temperature light versus standard illumination for improving mood and alertness in daytime workers | ||||
| Patient or population: daytime workers | ||||
| Outcomes | Anticipated absolute effects (95% CI) | № of participants (studies) | Quality of the evidence | |
| Risk with standard illumination | Risk with CCT light | |||
| Alertness KS range 1 to 9 (worst) | ‐‐ | SMD** 0.69 lower | 163 Effective sample size = 50 | ⊕⊝⊝⊝ |
| Mood (positive) | Mean standard positive mood 25.9 | MD 2.08 higher | 94 Effective sample size = 34 | ⊕⊝⊝⊝ |
| Mood (negative) | Mean standard negative mood 13.7 | MD 0.45 lower | 94 Effective sample size = 34 | ⊕⊝⊝⊝ |
| Adverse events ‐ eye discomfort | Mean standard adverse events 1.7 | MD 0.23 lower | 94 Effective sample size = 34 | ⊕⊝⊝⊝ |
| * Effective sample sizes applied to correct for the unit‐of‐analysis error. ** As a rule of thumb, 0.2 Standard Deviations represents a small difference, 0.5 a moderate difference, and 0.8 a large difference. CI: confidence interval; CCT: correlated colour temperature; MD: mean difference; PANAS: Positive and Negative Affect Schedule; SMD: standardised mean difference. | ||||
| GRADE Working Group grades of evidence | ||||
| 1 The assessment of risk of bias for non‐randomised studies starts at low‐quality evidence. We downgraded the level of evidence with one level, i.e. to very low quality, due to imprecision caused by a small sample size. 2 We would have downgraded the level of evidence with one more level due to imprecision caused by wide confidence intervals that include a null effect but we had already reached a judgment of very low‐quality evidence. | ||||
| Indirect light versus direct light for improving mood and alertness in daytime workers | ||||
| Patient or population: daytime workers | ||||
| Outcomes | Anticipated absolute effects (95% CI) | № of participants | Quality of the evidence | |
| Risk with direct light | Risk with indirect light | |||
| Alertness | Not assessed | Not assessed | Not assessed | Not assessed |
| Mood | Mean mood 5.8 | MD 1 higher | 22 | ⊕⊕⊝⊝ |
| Adverse events (ocular problems) | Mean adverse events 0.4 | MD 0.1 lower | 22 | ⊕⊕⊝⊝ |
| CI: confidence interval; MD: mean difference; RCT: randomised controlled trial. | ||||
| GRADE Working Group grades of evidence | ||||
| 1 We downgraded the level of evidence with one level, i.e. from high to moderate quality, due to risk of bias (the authors did not fully describe how or if they employed allocation concealment, outcome assessors were not blinded and there was a high and unbalanced attrition rate). 2 We downgraded the level of evidence with one level, i.e. from moderate to low quality, due to imprecision (a small sample size and a wide confidence interval including a null effect). | ||||
| Individually applied blue‐enriched light versus no treatment for improving mood and alertness in daytime workers | ||||
| Patient or population: daytime workers | ||||
| Outcomes | Anticipated absolute effects (95% CI) | № of participants | Quality of the evidence | |
| Risk with light as usual | Risk with blue‐enriched light | |||
| Alertness | Mean alertness | MD 3.3 lower | 25 | ⊕⊝⊝⊝ |
| Mood | Mean mood | MD 4.8 lower | 25 | ⊕⊝⊝⊝ |
| Adverse events | Not assessed | Not assessed | Not assessed | Not assessed |
| CI: confidence interval; MD: mean difference; RCT: randomised controlled trial. | ||||
| GRADE Working Group grades of evidence | ||||
| 1 We downgraded the level of evidence with two levels, i.e. from high to low quality, due to risk of bias (the authors did not fully describe how or if they employed allocation concealment, outcome assessors were not blinded, results for SIGH‐HDRS were not reported and there was a high attrition rate). 2 We downgraded the level of evidence with one level, i.e. from low to very low quality, due to imprecision (a small sample size and a wide confidence interval). | ||||
| Morning bright light versus afternoon bright light for improving mood and alertness in daytime workers | |||||
| Patient or population: daytime workers | |||||
| Outcomes | Anticipated absolute effects* (95% CI) | Relative effect with morning bright light | № of participants | Quality of the evidence | |
| Risk with afternoon bright light | Risk with morning bright light | ||||
| Alertness | Mean 59 (SD 23) | Mean 66 (SD 25) | MD 7 higher | 30 | ⊕⊕⊝⊝ |
| Mood | 426 per 1000 | 688 per 1000 | RR 1.60 | 30 | ⊕⊕⊝⊝ |
| Adverse events (frequency) | 712 per 1000 | 375 per 1000 | RR 0.53 | 30 | ⊕⊕⊝⊝ |
| *The risk in the intervention group (and its 95% confidence interval) is based on the assumed risk in the comparison group and the relative effect of the intervention (and its 95% CI). CI: confidence interval; MD: mean difference; RCT: randomised controlled trial; RR: risk ratio; SIGH‐SAD: Structured Interview Guide for the Hamilton Depression Rating Scale‐Seasonal Affective Disorders Version. | |||||
| GRADE Working Group grades of evidence | |||||
| 1 We downgraded the level of evidence with one level, i.e. from high to moderate quality, due to risk of bias (the authors did not fully describe their randomisation method nor how or if they employed allocation concealment). 2 We downgraded the level of evidence with one level, i.e. from moderate to low quality, due to imprecision (a small sample size and a wide confidence interval including a null effect). | |||||
| Outcome or subgroup title | No. of studies | No. of participants | Statistical method | Effect size |
| 1 Alertness ‐ Item Decreased Daytime Alertness from Columbia Jet Lag Scale 14 weeks Show forest plot | 1 | Mean Difference (IV, Fixed, 95% CI) | Totals not selected | |
| 2 Alertness ‐ Item Sleepiness in Day from Columbia Jet Lag Scale 14 weeks Show forest plot | 1 | Mean Difference (IV, Fixed, 95% CI) | Totals not selected | |
| 3 Alertness ‐ Karolinska Sleepiness Scale: mean of all time points Show forest plot | 1 | Mean Difference (IV, Fixed, 95% CI) | Totals not selected | |
| 4 Alertness ‐ meta‐analysis Show forest plot | 2 | 50 | Std. Mean Difference (IV, Fixed, 95% CI) | ‐0.69 [‐1.28, ‐0.10] |
| 5 Mood ‐ Positive Mood PANAS Scale: mean of all time points Show forest plot | 1 | Mean Difference (IV, Fixed, 95% CI) | Totals not selected | |
| 6 Mood ‐ Negative Mood PANAS Scale: mean of all time points Show forest plot | 1 | Mean Difference (IV, Fixed, 95% CI) | Totals not selected | |
| 7 Adverse events ‐ eye discomfort: mean of all time points Show forest plot | 1 | Mean Difference (IV, Fixed, 95% CI) | Totals not selected | |
| 8 Adverse events ‐ irritability: mean of all time points Show forest plot | 1 | Mean Difference (IV, Fixed, 95% CI) | Totals not selected | |
| 9 Adverse events ‐ headache: mean of all time points Show forest plot | 1 | Mean Difference (IV, Fixed, 95% CI) | Totals not selected | |
| 10 Adverse events ‐ eye strain: mean of all time points Show forest plot | 1 | Mean Difference (IV, Fixed, 95% CI) | Totals not selected | |
| 11 Adverse events ‐ eye fatigue: mean of all time points Show forest plot | 1 | Mean Difference (IV, Fixed, 95% CI) | Totals not selected | |
| 12 Adverse events ‐ difficult focusing: mean of all time points Show forest plot | 1 | Mean Difference (IV, Fixed, 95% CI) | Totals not selected | |
| 13 Adverse events ‐ difficulty concentrating: mean of all time points Show forest plot | 1 | Mean Difference (IV, Fixed, 95% CI) | Totals not selected | |
| 14 Adverse events ‐ blurred vision: mean of all time points Show forest plot | 1 | Mean Difference (IV, Fixed, 95% CI) | Totals not selected | |
| Outcome or subgroup title | No. of studies | No. of participants | Statistical method | Effect size |
| 1 Mood BDI: indirect lighting versus direct lighting Show forest plot | 1 | Mean Difference (IV, Fixed, 95% CI) | Totals not selected | |
| 1.1 Mood BDI after 2 months: indirect lighting versus direct lighting | 1 | Mean Difference (IV, Fixed, 95% CI) | 0.0 [0.0, 0.0] | |
| 1.2 Mood BDI after 5 months: indirect lighting versus direct lighting | 1 | Mean Difference (IV, Fixed, 95% CI) | 0.0 [0.0, 0.0] | |
| 2 Adverse events ‐ ocular problems indirect versus direct lighting Show forest plot | 1 | Mean Difference (IV, Fixed, 95% CI) | Totals not selected | |
| 2.1 Adverse events after 2 months ‐ ocular problems indirect versus direct lighting | 1 | Mean Difference (IV, Fixed, 95% CI) | 0.0 [0.0, 0.0] | |
| 2.2 Adverse events after 5 months ‐ ocular problems indirect versus direct lighting | 1 | Mean Difference (IV, Fixed, 95% CI) | 0.0 [0.0, 0.0] | |
| 3 Mood Beck Depression Inventory (BDI): indirect lighting versus 70% indirect lighting Show forest plot | 1 | Mean Difference (IV, Fixed, 95% CI) | Totals not selected | |
| 3.1 Mood BDI after 2 months: indirect lighting versus 70% indirect lighting | 1 | Mean Difference (IV, Fixed, 95% CI) | 0.0 [0.0, 0.0] | |
| 3.2 Mood BDI after 5 months: indirect lighting versus 70% indirect lighting | 1 | Mean Difference (IV, Fixed, 95% CI) | 0.0 [0.0, 0.0] | |
| 4 Mood BDI: indirect lighting versus 30% indirect lighting Show forest plot | 1 | Mean Difference (IV, Fixed, 95% CI) | Totals not selected | |
| 4.1 Mood BDI after 2 months: indirect lighting versus 30% indirect lighting | 1 | Mean Difference (IV, Fixed, 95% CI) | 0.0 [0.0, 0.0] | |
| 4.2 Mood BDI after 5 months: indirect lighting versus 30% indirect lighting | 1 | Mean Difference (IV, Fixed, 95% CI) | 0.0 [0.0, 0.0] | |
| 5 Mood BDI: 70% indirect lighting versus 30% indirect lighting Show forest plot | 1 | Mean Difference (IV, Fixed, 95% CI) | Totals not selected | |
| 5.1 Mood BDI after 2 months: 70% indirect lighting versus 30% indirect lighting | 1 | Mean Difference (IV, Fixed, 95% CI) | 0.0 [0.0, 0.0] | |
| 5.2 Mood BDI after 5 months: 70% indirect lighting versus 30% indirect lighting | 1 | Mean Difference (IV, Fixed, 95% CI) | 0.0 [0.0, 0.0] | |
| 6 Mood BDI: 70% indirect lighting versus direct lighting Show forest plot | 1 | Mean Difference (IV, Fixed, 95% CI) | Totals not selected | |
| 6.1 Mood BDI after 2 months: 70% indirect lighting versus direct lighting | 1 | Mean Difference (IV, Fixed, 95% CI) | 0.0 [0.0, 0.0] | |
| 6.2 Mood BDI after 5 months: 70% indirect lighting versus direct lighting | 1 | Mean Difference (IV, Fixed, 95% CI) | 0.0 [0.0, 0.0] | |
| 7 Mood BDI: 30% indirect lighting versus direct lighting Show forest plot | 1 | Mean Difference (IV, Fixed, 95% CI) | Totals not selected | |
| 7.1 Mood BDI after 2 months: 30% indirect lighting versus direct lighting | 1 | Mean Difference (IV, Fixed, 95% CI) | 0.0 [0.0, 0.0] | |
| 7.2 Mood BDI after 5 months: 30% indirect lighting versus direct lighting | 1 | Mean Difference (IV, Fixed, 95% CI) | 0.0 [0.0, 0.0] | |
| 8 Adverse events ‐ reading problems indirect versus 30% indirect lighting Show forest plot | 1 | Mean Difference (IV, Fixed, 95% CI) | Totals not selected | |
| 8.1 Adverse events after 2 months ‐ reading problems indirect versus 30% indirect lighting | 1 | Mean Difference (IV, Fixed, 95% CI) | 0.0 [0.0, 0.0] | |
| 8.2 Adverse events after 5 months ‐ reading problems indirect versus 30% indirect lighting | 1 | Mean Difference (IV, Fixed, 95% CI) | 0.0 [0.0, 0.0] | |
| 9 Adverse events ‐ ocular problems indirect versus 70% indirect lighting Show forest plot | 1 | Mean Difference (IV, Fixed, 95% CI) | Totals not selected | |
| 9.1 Adverse events after 2 months ‐ ocular problems indirect versus 70% indirect lighting | 1 | Mean Difference (IV, Fixed, 95% CI) | 0.0 [0.0, 0.0] | |
| 9.2 Adverse events after 5 months ‐ ocular problems indirect versus 70% indirect lighting | 1 | Mean Difference (IV, Fixed, 95% CI) | 0.0 [0.0, 0.0] | |
| 10 Adverse events ‐ ocular problems indirect versus 30% indirect lighting Show forest plot | 1 | Mean Difference (IV, Fixed, 95% CI) | Totals not selected | |
| 10.1 Adverse events after 2 months ‐ ocular problems indirect versus 30% indirect lighting | 1 | Mean Difference (IV, Fixed, 95% CI) | 0.0 [0.0, 0.0] | |
| 10.2 Adverse events after 5 months ‐ ocular problems indirect versus 30% indirect lighting | 1 | Mean Difference (IV, Fixed, 95% CI) | 0.0 [0.0, 0.0] | |
| 11 Adverse events ‐ ocular problems 70% indirect versus 30% indirect lighting Show forest plot | 1 | Mean Difference (IV, Fixed, 95% CI) | Totals not selected | |
| 11.1 Adverse events after 2 months ‐ ocular problems 70% indirect versus 30% indirect lighting | 1 | Mean Difference (IV, Fixed, 95% CI) | 0.0 [0.0, 0.0] | |
| 11.2 Adverse events after 5 months ‐ ocular problems 70% indirect versus 30% indirect lighting | 1 | Mean Difference (IV, Fixed, 95% CI) | 0.0 [0.0, 0.0] | |
| 12 Adverse events ‐ ocular problems 70% indirect versus direct lighting Show forest plot | 1 | Mean Difference (IV, Fixed, 95% CI) | Totals not selected | |
| 12.1 Adverse events after 2 months ‐ ocular problems 70% indirect versus direct lighting | 1 | Mean Difference (IV, Fixed, 95% CI) | 0.0 [0.0, 0.0] | |
| 12.2 Adverse events after 5 months ‐ ocular problems 70% indirect versus direct lighting | 1 | Mean Difference (IV, Fixed, 95% CI) | 0.0 [0.0, 0.0] | |
| 13 Adverse events ‐ ocular problems 30% indirect versus direct lighting Show forest plot | 1 | Mean Difference (IV, Fixed, 95% CI) | Totals not selected | |
| 13.1 Adverse events after 2 months ‐ ocular problems 30% indirect versus direct lighting | 1 | Mean Difference (IV, Fixed, 95% CI) | 0.0 [0.0, 0.0] | |
| 13.2 Adverse events after 5 months ‐ ocular problems 30% indirect versus direct lighting | 1 | Mean Difference (IV, Fixed, 95% CI) | 0.0 [0.0, 0.0] | |
| 14 Adverse events ‐ reading problems indirect versus 70% indirect lighting Show forest plot | 1 | Mean Difference (IV, Fixed, 95% CI) | Totals not selected | |
| 14.1 Adverse events after 2 months ‐ reading problems indirect versus 70% indirect lightning | 1 | Mean Difference (IV, Fixed, 95% CI) | 0.0 [0.0, 0.0] | |
| 14.2 Adverse events after 5 months ‐ reading problems indirect versus 70% indirect lightning | 1 | Mean Difference (IV, Fixed, 95% CI) | 0.0 [0.0, 0.0] | |
| 15 Adverse events ‐ reading problems indirect versus direct lighting Show forest plot | 1 | Mean Difference (IV, Fixed, 95% CI) | Totals not selected | |
| 15.1 Adverse events after 2 months ‐ reading problems indirect versus direct lighting | 1 | Mean Difference (IV, Fixed, 95% CI) | 0.0 [0.0, 0.0] | |
| 15.2 Adverse events after 5 months ‐ reading problems indirect versus direct lighting | 1 | Mean Difference (IV, Fixed, 95% CI) | 0.0 [0.0, 0.0] | |
| 16 Adverse events ‐ reading problems 70% indirect versus 30% indirect lighting Show forest plot | 1 | Mean Difference (IV, Fixed, 95% CI) | Totals not selected | |
| 16.1 Adverse events after 2 months ‐ reading problems 70% indirect versus 30% indirect lighting | 1 | Mean Difference (IV, Fixed, 95% CI) | 0.0 [0.0, 0.0] | |
| 16.2 Adverse events after 5 months ‐ reading problems 70% indirect versus 30% indirect lighting | 1 | Mean Difference (IV, Fixed, 95% CI) | 0.0 [0.0, 0.0] | |
| 17 Adverse events ‐ reading problems 70% indirect versus direct lighting Show forest plot | 1 | Mean Difference (IV, Fixed, 95% CI) | Totals not selected | |
| 17.1 Adverse events after 2 months ‐ reading problems 70% indirect versus direct lighting | 1 | Mean Difference (IV, Fixed, 95% CI) | 0.0 [0.0, 0.0] | |
| 17.2 Adverse events after 5 months ‐ reading problems 70% indirect versus direct lighting | 1 | Mean Difference (IV, Fixed, 95% CI) | 0.0 [0.0, 0.0] | |
| 18 Adverse events ‐ reading problems 30% indirect versus direct lighting Show forest plot | 1 | Mean Difference (IV, Fixed, 95% CI) | Totals not selected | |
| 18.1 Adverse events after 2 months ‐ reading problems 30% indirect versus direct lighting | 1 | Mean Difference (IV, Fixed, 95% CI) | 0.0 [0.0, 0.0] | |
| 18.2 Adverse events after 5 months ‐ reading problems 30% indirect versus direct lighting | 1 | Mean Difference (IV, Fixed, 95% CI) | 0.0 [0.0, 0.0] | |
| 19 Adverse events ‐ concentration problems indirect versus 70% indirect lighting Show forest plot | 1 | Mean Difference (IV, Fixed, 95% CI) | Totals not selected | |
| 19.1 Adverse events after 2 months ‐ concentration problems indirect versus 70% indirect lighting | 1 | Mean Difference (IV, Fixed, 95% CI) | 0.0 [0.0, 0.0] | |
| 19.2 Adverse events after 5 months ‐ concentration problems indirect versus 70% indirect lighting | 1 | Mean Difference (IV, Fixed, 95% CI) | 0.0 [0.0, 0.0] | |
| 20 Adverse events ‐ concentration problems indirect versus 30% indirect lighting Show forest plot | 1 | Mean Difference (IV, Fixed, 95% CI) | Totals not selected | |
| 20.1 Adverse events after 2 months ‐ concentration problems indirect versus 30% indirect lighting | 1 | Mean Difference (IV, Fixed, 95% CI) | 0.0 [0.0, 0.0] | |
| 20.2 Adverse events after 5 months ‐ concentration problems indirect versus 30% indirect lighting | 1 | Mean Difference (IV, Fixed, 95% CI) | 0.0 [0.0, 0.0] | |
| 21 Adverse events ‐ concentration problems indirect versus direct lighting Show forest plot | 1 | Mean Difference (IV, Fixed, 95% CI) | Totals not selected | |
| 21.1 Adverse events after 2 months ‐ concentration problems indirect versus direct lighting | 1 | Mean Difference (IV, Fixed, 95% CI) | 0.0 [0.0, 0.0] | |
| 21.2 Adverse events after 5 months ‐ concentration problems indirect versus direct lighting | 1 | Mean Difference (IV, Fixed, 95% CI) | 0.0 [0.0, 0.0] | |
| 22 Adverse events ‐ concentration problems 70% indirect versus 30% indirect lighting Show forest plot | 1 | Mean Difference (IV, Fixed, 95% CI) | Totals not selected | |
| 22.1 Adverse events after 2 months ‐ concentration problems 70% indirect versus 30% indirect lighting | 1 | Mean Difference (IV, Fixed, 95% CI) | 0.0 [0.0, 0.0] | |
| 22.2 Adverse events after 5 months ‐ concentration problems 70% indirect versus 30% indirect lighting | 1 | Mean Difference (IV, Fixed, 95% CI) | 0.0 [0.0, 0.0] | |
| 23 Adverse events ‐ concentration problems 70% indirect versus direct lighting Show forest plot | 1 | Mean Difference (IV, Fixed, 95% CI) | Totals not selected | |
| 23.1 Adverse events after 2 months ‐ concentration problems 70% indirect versus direct lighting | 1 | Mean Difference (IV, Fixed, 95% CI) | 0.0 [0.0, 0.0] | |
| 23.2 Adverse events after 5 months ‐ concentration problems 70% indirect versus direct lighting | 1 | Mean Difference (IV, Fixed, 95% CI) | 0.0 [0.0, 0.0] | |
| 24 Adverse events ‐ concentration problems 30% indirect versus direct lighting Show forest plot | 1 | Mean Difference (IV, Fixed, 95% CI) | Totals not selected | |
| 24.1 Adverse events after 2 months ‐ concentration problems 30% indirect versus direct lighting | 1 | Mean Difference (IV, Fixed, 95% CI) | 0.0 [0.0, 0.0] | |
| 24.2 Adverse events after 5 months ‐ concentration problems 30% indirect versus direct lighting | 1 | Mean Difference (IV, Fixed, 95% CI) | 0.0 [0.0, 0.0] | |
| 25 Adverse events ‐ musculoskeletal symptoms indirect versus 70% indirect lighting Show forest plot | 1 | Mean Difference (IV, Fixed, 95% CI) | Totals not selected | |
| 25.1 Adverse events after 2 months ‐ musculoskeletal symptoms indirect versus 70% indirect lighting | 1 | Mean Difference (IV, Fixed, 95% CI) | 0.0 [0.0, 0.0] | |
| 25.2 Adverse events after 5 months ‐ musculoskeletal symptoms indirect versus 70% indirect lighting | 1 | Mean Difference (IV, Fixed, 95% CI) | 0.0 [0.0, 0.0] | |
| 26 Adverse events ‐ musculoskeletal symptoms indirect versus 30% indirect lighting Show forest plot | 1 | Mean Difference (IV, Fixed, 95% CI) | Totals not selected | |
| 26.1 Adverse events after 2 months ‐ musculoskeletal symptoms indirect versus 30% indirect lighting | 1 | Mean Difference (IV, Fixed, 95% CI) | 0.0 [0.0, 0.0] | |
| 26.2 Adverse events after 5 months ‐ musculoskeletal symptoms indirect versus 30% indirect lighting | 1 | Mean Difference (IV, Fixed, 95% CI) | 0.0 [0.0, 0.0] | |
| 27 Adverse events ‐ musculoskeletal symptoms indirect versus direct lighting Show forest plot | 1 | Mean Difference (IV, Fixed, 95% CI) | Totals not selected | |
| 27.1 Adverse events after 2 months ‐ musculoskeletal symptoms indirect versus direct lighting | 1 | Mean Difference (IV, Fixed, 95% CI) | 0.0 [0.0, 0.0] | |
| 27.2 Adverse events after 5 months ‐ musculoskeletal symptoms indirect versus direct lighting | 1 | Mean Difference (IV, Fixed, 95% CI) | 0.0 [0.0, 0.0] | |
| 28 Adverse events ‐ musculoskeletal symptoms 70% indirect versus 30% indirect lighting Show forest plot | 1 | Mean Difference (IV, Fixed, 95% CI) | Totals not selected | |
| 28.1 Adverse events after 2 months ‐ musculoskeletal symptoms 70% indirect versus 30% indirect lighting | 1 | Mean Difference (IV, Fixed, 95% CI) | 0.0 [0.0, 0.0] | |
| 28.2 Adverse events after 5 months ‐ musculoskeletal symptoms 70% indirect versus 30% indirect lighting | 1 | Mean Difference (IV, Fixed, 95% CI) | 0.0 [0.0, 0.0] | |
| 29 Adverse events ‐ musculoskeletal symptoms 70% indirect versus direct lighting Show forest plot | 1 | Mean Difference (IV, Fixed, 95% CI) | Totals not selected | |
| 29.1 Adverse events after 2 months ‐ musculoskeletal symptoms 70% indirect versus direct lighting | 1 | Mean Difference (IV, Fixed, 95% CI) | 0.0 [0.0, 0.0] | |
| 29.2 Adverse events after 5 months ‐ musculoskeletal symptoms 70% indirect versus direct lighting | 1 | Mean Difference (IV, Fixed, 95% CI) | 0.0 [0.0, 0.0] | |
| 30 Adverse events ‐ musculoskeletal symptoms 30% indirect versus direct lighting Show forest plot | 1 | Mean Difference (IV, Fixed, 95% CI) | Totals not selected | |
| 30.1 Adverse events after 2 months ‐ musculoskeletal symptoms 30% indirect versus direct lighting | 1 | Mean Difference (IV, Fixed, 95% CI) | 0.0 [0.0, 0.0] | |
| 30.2 Adverse events after 5 months ‐ musculoskeletal symptoms 30% indirect versus direct lighting | 1 | Mean Difference (IV, Fixed, 95% CI) | 0.0 [0.0, 0.0] | |
| Outcome or subgroup title | No. of studies | No. of participants | Statistical method | Effect size |
| 1 Alertness ‐ Epworth Sleepiness Scale Show forest plot | 1 | Mean Difference (Fixed, 95% CI) | Totals not selected | |
| 2 Mood Beck Depression Inventory‐II Show forest plot | 1 | Mean Difference (Fixed, 95% CI) | Totals not selected | |
| Outcome or subgroup title | No. of studies | No. of participants | Statistical method | Effect size |
| 1 Alertness (visual analogue scale (VAS)) after 2 weeks of intervention Show forest plot | 1 | Mean Difference (IV, Fixed, 95% CI) | Totals not selected | |
| 2 Mood (≥ 50% of reduction of Structured Interview Guide for the Hamilton Depression Rating Scale‐Seasonal Affective Disorders Version (SIGH‐SAD) scores from baseline after 2 weeks of treatment)) Show forest plot | 1 | Risk Ratio (M‐H, Fixed, 95% CI) | Totals not selected | |
| 3 Mood SIGH‐SAD after 2 weeks of intervention Show forest plot | 1 | Mean Difference (IV, Fixed, 95% CI) | Totals not selected | |
| 4 Mood 21‐item Hamilton Depressive Rating Scale after 2 weeks of interventions Show forest plot | 1 | Mean Difference (IV, Fixed, 95% CI) | Totals not selected | |
| 5 Mood 17‐item Hamilton Depressive Rating Scale after 2 weeks of intervention Show forest plot | 1 | Mean Difference (IV, Fixed, 95% CI) | Totals not selected | |
| 6 Mood Seasonal Affective Disorders subscale after 2 weeks of intervention Show forest plot | 1 | Mean Difference (IV, Fixed, 95% CI) | Totals not selected | |
| 7 Mood VAS after 2 weeks of intervention Show forest plot | 1 | Mean Difference (IV, Fixed, 95% CI) | Totals not selected | |
| 8 Frequency of adverse events after 2 weeks of intervention Show forest plot | 1 | Risk Ratio (M‐H, Fixed, 95% CI) | Totals not selected | |