Lavado intracavitario e irrigación de heridas para la prevención de la infección del sitio quirúrgico
Información
- DOI:
- https://doi.org/10.1002/14651858.CD012234.pub2Copiar DOI

- Base de datos:
-
- Cochrane Database of Systematic Reviews
- Versión publicada:
-
- 30 octubre 2017see what's new
- Tipo:
-
- Intervention
- Etapa:
-
- Review
- Grupo Editorial Cochrane:
-
Grupo Cochrane de Heridas
- Copyright:
-
- Copyright © 2017 The Authors. Cochrane Database of Systematic Reviews published by John Wiley & Sons, Ltd. on behalf of The Cochrane Collaboration.
- This is an open access article under the terms of the Creative Commons Attribution‐Non‐Commercial Licence, which permits use, distribution and reproduction in any medium, provided the original work is properly cited and is not used for commercial purposes.
Cifras del artículo
Altmetric:
Citado por:
Autores
Contributions of authors
Gill Norman: co‐ordinated the review, extracted and checked data, undertook and checked quality assessment, analysed data and performed statistical analysis, contacted study authors, produced the first draft of the review and is a guarantor of the review.
Ross Atkinson: extracted and checked data, undertook and checked quality assessment, analysed data and performed statistical analysis, contacted study authors, and contributed to the writing and editing of the review.
Tanya Smith: conceived and designed the review, extracted data and undertook quality assessment, and made an intellectual contribution to the review.
Ceri Rowlands: conceived and designed the review, extracted data and undertook quality assessment, and made an intellectual contribution to the review.
Amber Rithalia: extracted and checked data, undertook and checked quality assessment and made an intellectual contribution to the review.
Emma Crosbie contributed to editing the review and made an intellectual contribution to the review.
Jo Dumville: conceived and designed the review, checked the statistical analysis, advised on the review, contributed to writing and editing the review, secured funding for the review and is a guarantor of the review.
Contributions of the editorial base
Nicky Cullum (Coordinating Editor): edited the protocol and the review; advised on methodology interpretation and review content; approved the final review prior to submission.
Gill Rizzello (Managing Editor): co‐ordinated the editorial process; advised on content; edited the protocol and the review.
Reetu Child (Information Specialist) : designed the search strategy and edited the search methods section.
Naomi Shaw (Information Specialist): updated the search and edited the search methods section.
Ursula Gonthier (Editorial Assistant): edited the Abstract, the Plain Language Summary and the reference sections of the review.
Sources of support
Internal sources
-
Division of Nursing, Midwifery & Social Work, School of Health Sciences, Faculty of Biology, Medicine & Health, University of Manchester, UK.
Editorial base and additional support.
External sources
-
National Institute for Health Research (NIHR), UK.
This project was supported by the NIHR via Cochrane Infrastructure and Cochrane Programme
Grant funding (NIHR Cochrane Programme Grant 13/89/08 ‐ High Priority Cochrane Reviews in Wound Prevention and
Treatment) to Cochrane Wounds. The views and opinions expressed herein are those of the authors and do not necessarily reflect
those of the Systematic Reviews Programme, the NIHR, the National Health Service or the Department of Health. -
NIHR Manchester Biomedical Research Centre (BRC), UK.
This review was supported by Manchester BRC.
-
National Institute for Health Research Collaboration for Leadership in Applied Research and Care (NIHR CLAHRC), Greater Manchester, UK.
Jo Dumville was partly funded by the NIHR CLAHRC Greater Manchester. The funder had no role in the design of the studies, data collection and analysis, decision to publish, or preparation of the manuscript. However, the review may be considered to be affiliated to the work of the NIHR CLAHRC Greater Manchester. The views expressed herein are those of the authors and not necessarily those of the NHS, NIHR or the Department of Health.
Declarations of interest
Gill Norman: my employment at the University of Manchester is supported by a grant from National Institute for Health Research (NIHR), UK (NIHR Cochrane Programme Grant 13/89/08‐High Priority Cochrane Reviews in Wound Prevention and Treatment).
Ross Atkinson: none known.
Tanya Smith: none known.
Ceri Rowlands: none known.
Amber Rithalia: none known.
Emma Crosbie: I have received funding from an NIHR Clinician Scientist Award, the HTA, Wellbeing of Women/the Wellcome Trust and Central Manchester University Hospitals NHS Foundation Trust. I am an employee of the University of Manchester.
Jo Dumville: I receive research funding from the NIHR for the production of systematic reviews focusing on high priority Cochrane Reviews in the prevention and treatment of wounds. Work on this review was also partly funded by the National Institute for Health Research Collaboration for Leadership in Applied Health Research and Care (NIHR CLAHRC) Greater Manchester and the NIHR Manchester Biomedical Research Centre (BRC).
Acknowledgements
The authors are grateful to the following peer reviewers of the protocol: Liz McInnes, Emma Maund, Brian Hong, Jesús Lopez‐Alcalde, and Jamie Fenton. We also thank copy editors Denise Mitchell and Clare Dooley. We are also grateful to the following additional peer reviewers of the review: Kurinchi Gurusamy (Editor) and Gemma Villanueva.
The authors would like to thank Diebrecht Appelen, Pia Brandt Danborg, Debra Fayter, Alireza Firooz, Ursula Gonthier, Jae Hung Jung, Jörn Klein, Zhenmi Liu, Jesús Lopez‐Alcalde, Zuzana Mitrova, Teslin Seale Ahlenius and Gemma Villanueva for providing translation services. They are also grateful to Maggie Westby for assistance with statistical analysis.
Version history
| Published | Title | Stage | Authors | Version |
| 2017 Oct 30 | Intracavity lavage and wound irrigation for prevention of surgical site infection | Review | Gill Norman, Ross A Atkinson, Tanya A Smith, Ceri Rowlands, Amber D Rithalia, Emma J Crosbie, Jo C Dumville | |
| 2016 Jun 07 | Intracavity lavage and wound irrigation for prevention of surgical site infection | Protocol | Tanya A Smith, Ceri Rowlands, Jo C Dumville, Gill Norman | |
Differences between protocol and review
We have clarified that this review does not include studies where the irrigation was confined to the interior of (e.g.) the uterus, bowel or bladder, but did include studies in which (e.g.) the peritoneum was irrigated in addition to such procedures. We also did not include studies of surgery in the oral or aural cavities or in the eyes.
The protocol did not specify methods for dealing with studies with a 'split‐body' design, in which two operative sites are present on each participant and these are randomised to different treatment groups. We decided to include these studies in the review but not to include them in meta‐analyses with participant‐level randomisation; we included only one such study in the review and this decision did not materially affect the meta‐analyses involved due to limited data.
We prespecified two subgroup analyses on the basis of the surgical category and on the basis of whether participants were adults or children. We conducted the surgical category analysis for the primary outcome of SSI for the two comparisons with the largest number of participants and studies. However, small numbers of studies enrolling only children meant that we judged that the second prespecified analysis would be uninformative. We did not carry out any subgroup analyses for the secondary outcomes because there were many fewer studies and they were not well distributed between the surgical categories. We did carry out an exploratory subgroup analysis on the basis of the type of irrigation solution used in order to check that our analysis approach was reasonable. This is clearly reported as an additional post‐hoc analysis.
In addition to planned sensitivity analyses we conducted additional analyses to assess the impact of (1) including a study that we suspected contained participants also included in another study and (2) excluding a study where we had conducted a completed‐case analysis because of a substantial amount of attrition and the explanation provided for this attrition.
We had planned to analyse outcomes by the time point at which they were reported based on short, medium or long term. In practice we found that the overwhelming majority of the data reported were for time points of between two and eight weeks postoperatively, with the majority being at either four or six weeks, sometimes with interim but unreported follow‐up points. We therefore decided that we would group all the data together for the outcomes reported; dividing data reported at points that narrowly spanned the 30‐day cut‐off for short‐term data was not considered informative (medium term spanned from 30 days to 12 months).
In response to suggestions from the peer reviewers we have added adverse events to the 'Summary of findings tables'; we are grateful to them for this suggestion.
Keywords
MeSH
Medical Subject Headings (MeSH) Keywords
- Abscess [epidemiology];
- Anti‐Bacterial Agents [administration & dosage];
- Anti‐Infective Agents, Local [administration & dosage];
- Drug Combinations;
- Hypochlorous Acid [administration & dosage];
- Incidence;
- Povidone‐Iodine [administration & dosage];
- Randomized Controlled Trials as Topic;
- Sodium Hypochlorite [administration & dosage];
- Surgical Wound Dehiscence [epidemiology];
- Surgical Wound Infection [epidemiology, *prevention & control];
- Therapeutic Irrigation [methods];
Medical Subject Headings Check Words
Humans;
PICO

Study flow diagram
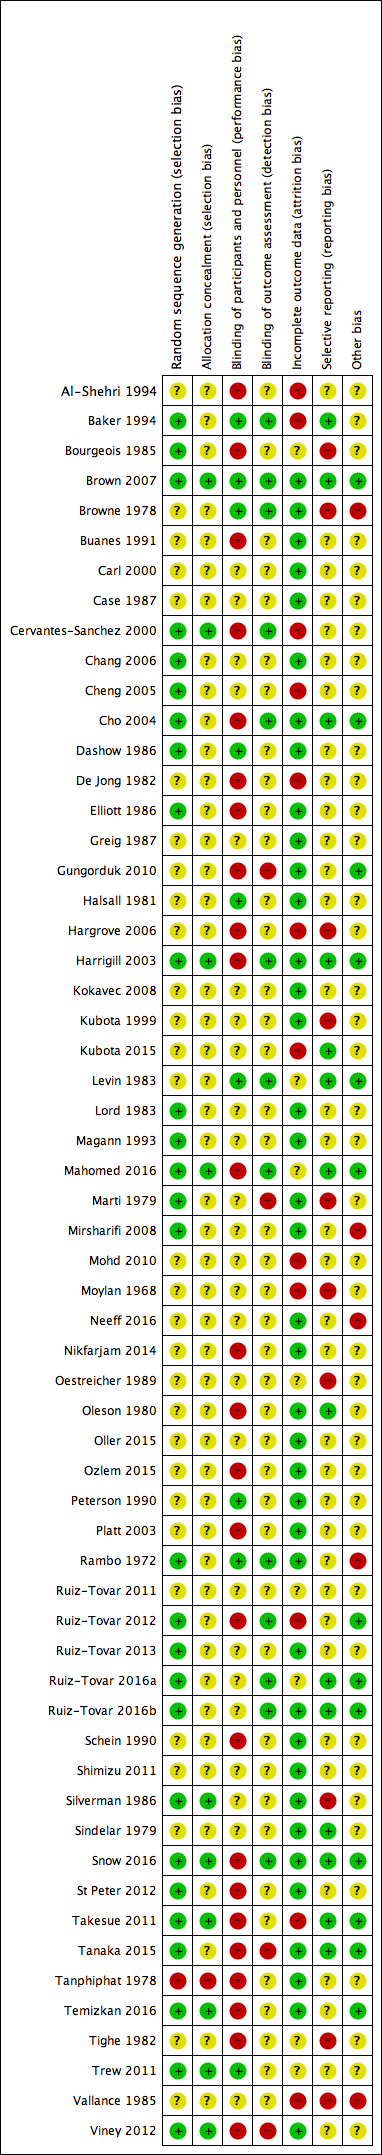
Risk of bias summary: review authors' judgements about each risk of bias item for each included study
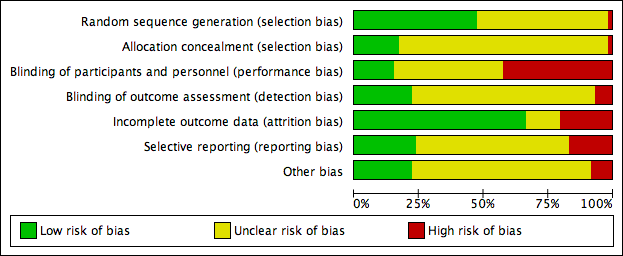
Risk of bias graph: review authors' judgements about each risk of bias item presented as percentages across all included studies

Funnel plot of comparison 1: all irrigation versus no irrigation, outcome: 1.1 surgical site infection

Funnel plot of comparison 2: antibacterial versus non‐antibacterial irrigation, outcome: 2.1 surgical site infection

Comparison 1 All irrigation versus no irrigation, Outcome 1 SSI.
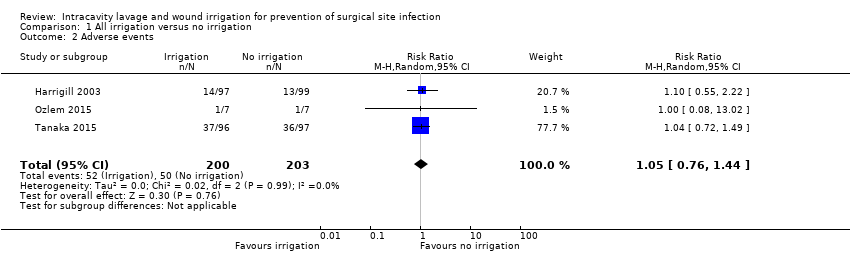
Comparison 1 All irrigation versus no irrigation, Outcome 2 Adverse events.
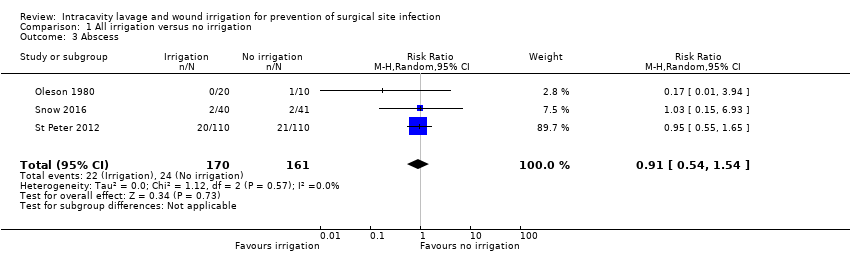
Comparison 1 All irrigation versus no irrigation, Outcome 3 Abscess.

Comparison 1 All irrigation versus no irrigation, Outcome 4 Mortality.
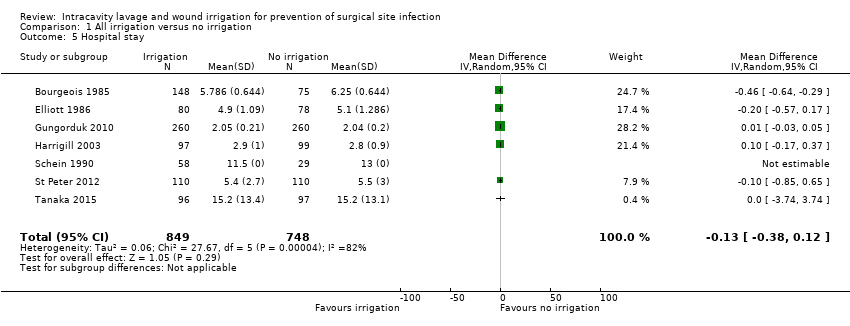
Comparison 1 All irrigation versus no irrigation, Outcome 5 Hospital stay.

Comparison 1 All irrigation versus no irrigation, Outcome 6 Return to theatre (reoperation).

Comparison 1 All irrigation versus no irrigation, Outcome 7 Readmission to hospital.

Comparison 2 Antibacterial irrigation versus non‐antibacterial irrigation, Outcome 1 SSI.

Comparison 2 Antibacterial irrigation versus non‐antibacterial irrigation, Outcome 2 Wound dehiscence.

Comparison 2 Antibacterial irrigation versus non‐antibacterial irrigation, Outcome 3 Adverse events.

Comparison 2 Antibacterial irrigation versus non‐antibacterial irrigation, Outcome 4 Abscess.
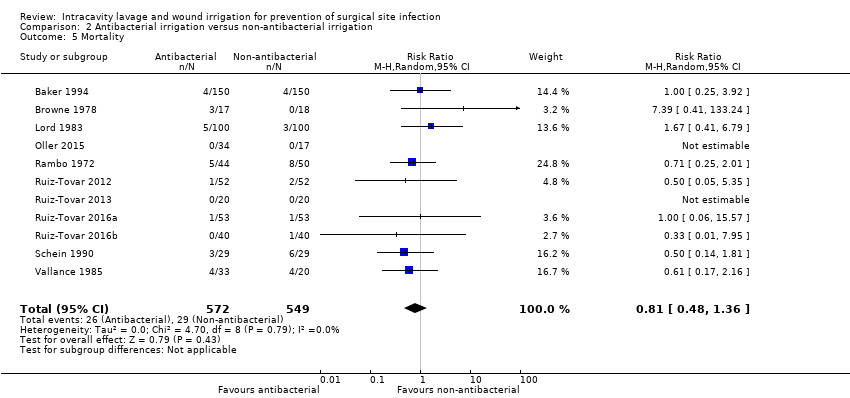
Comparison 2 Antibacterial irrigation versus non‐antibacterial irrigation, Outcome 5 Mortality.
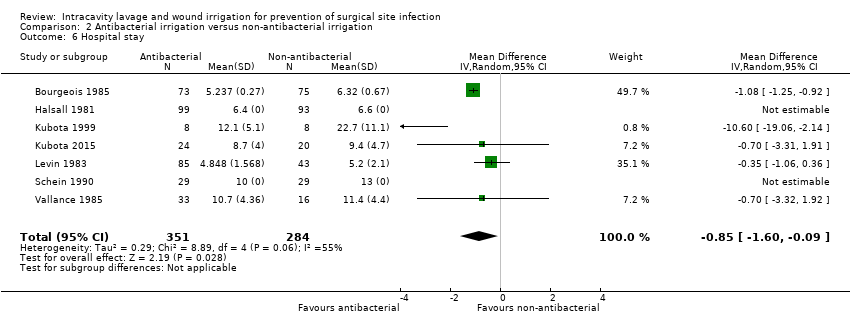
Comparison 2 Antibacterial irrigation versus non‐antibacterial irrigation, Outcome 6 Hospital stay.
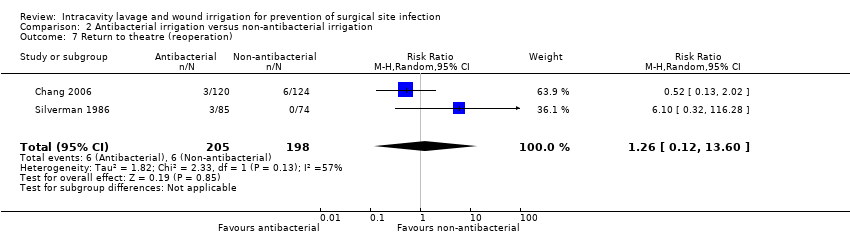
Comparison 2 Antibacterial irrigation versus non‐antibacterial irrigation, Outcome 7 Return to theatre (reoperation).

Comparison 3 Icodextrin versus lactated Ringer's solution, Outcome 1 Mortality.

Comparison 3 Icodextrin versus lactated Ringer's solution, Outcome 2 Adverse events.

Comparison 3 Icodextrin versus lactated Ringer's solution, Outcome 3 Treatment‐related adverse events.

Comparison 4 Standard irrigation versus pulsatile irrigation, Outcome 1 SSI.
| All irrigation compared with no irrigation for prevention of surgical site infection | ||||||
| Patient or population: participants undergoing clean, clean‐contaminated, contaminated or dirty surgical procedures Setting: hospitals | ||||||
| Outcomes | Anticipated absolute effects* (95% CI) | Relative effect | № of participants | Certainty of the evidence | Comments | |
| Risk with no irrigation | Risk with irrigation | |||||
| SSI | Study population: participants undergoing clean‐contaminated, contaminated or dirty surgical procedures | RR 0.87 | 6106 | ⊕⊕⊝⊝ | On the basis of the included studies there is no clear difference between the intervention and comparison groups in the incidence of SSI. | |
| 98 per 1000 | 85 per 1000 | |||||
| Risk difference: 13 fewer SSI occur per 1000 with irrigation than with no irrigation (31 fewer to 10 more) | ||||||
| Wound dehiscence | Study population: participants undergoing clean procedures (split‐body design) | RR 1.17 | 30 | ⊕⊕⊝⊝ | There is no clear difference between surgical sites treated with irrigation and those in the control condition. This is based on a single split‐body design with small numbers of participants. | |
| 200 per 1000 | 234 per 1000 | |||||
| Risk difference: 34 more wound dehiscences occur per 1000 with irrigation than with no irrigation (112 fewer to 412 more) | ||||||
| Adverse events | Study population: participants undergoing clean‐contaminated or dirty surgical procedures | RR 1.05 (0.76 to 1.44) | 403 (3 RCTs) | ⊕⊕⊝⊝ | There is no clear difference in the number of adverse events between participants treated with irrigation and those in the control condition. | |
| 247 per 1000 | 259 per 1000 (187 to 355) | |||||
| Risk difference: 12 more per 1000 (from 59 fewer to 108 more) | ||||||
| Adverse events: abscess formation | Study population: participants undergoing dirty or contaminated surgical procedures | RR 0.91 (0.54 to 1.54) | 331 (3 RCTs) | ⊕⊕⊕⊝ Moderate4 | There is no clear difference in the number of adverse events between participants treated with irrigation and those in the control condition. | |
| 149 per 1000 | 136 per 1000 | |||||
| Risk difference: 13 fewer per 1000 (from 69 fewer to 80 more) | ||||||
| *The risk in the intervention group (and its 95% confidence interval) is based on the assumed risk in the comparison group and the relative effect of the intervention (and its 95% CI). | ||||||
| GRADE Working Group grades of evidence | ||||||
| 1Downgraded once for risk of bias in one or more domains other than performance bias in studies that account for more than 50% of the analysis weight; downgraded once for imprecision because confidence intervals include both benefit and harm. Publication bias could not be clearly ruled out but was not additionally downgraded for as the evidence was unclear. | ||||||
| Irrigation with antibacterial compared with non‐antibacterial solution for prevention of surgical site infection | ||||||
| Patient or population: participants undergoing clean, clean‐contaminated, contaminated or dirty surgical procedures | ||||||
| Outcomes | Anticipated absolute effects* (95% CI) | Relative effect | № of participants | Certainty of the evidence | Comments | |
| Risk with non‐antibacterial | Risk with antibacterial | |||||
| SSI | Study population: participants undergoing clean‐contaminated, contaminated or dirty surgical procedures | RR 0.57 | 5141 | ⊕⊕⊝⊝ | The included studies found that there may be fewer SSIs in participants treated with antibacterial irrigation compared with those treated with non‐antibacterial irrigation. | |
| 140 per 1000 | 80 per 1000 | |||||
| Risk difference: 60 fewer SSI occur per 1000 with antibacterial irrigation than with non‐antibacterial (78 to 35 fewer) | ||||||
| Wound dehiscence | Study population: participants undergoing clean or clean‐contaminated surgical procedures | RR 1.26 | 660 | ⊕⊝⊝⊝ | The effect of antibacterial compared with non‐antibacterial irrigation on wound dehiscence is very uncertain. | |
| 45 per 1000 | 56 per 1000 | |||||
| Risk difference: 11 more wound dehiscences occur per 1000 with antibacterial irrigation than with non‐antibacterial (16 fewer to 64 more) | ||||||
| Adverse events | Study population: participants undergoing clean, clean‐contaminated or dirty surgical procedures | RR 0.55 (0.22 to 1.34) | 178 (3 RCTs) | ⊕⊕⊝⊝ | It is unclear whether there is a difference in the incidence of all adverse events between participants treated with antibacterial irrigation compared with those treated with non‐antibacterial irrigation. | |
| 67 per 1000 | 37 per 1000 (15 to 90) | |||||
| Risk difference: 30 fewer adverse events occur per 1000 with antibacterial irrigation than with non‐antibacterial (53 fewer to 23 more) | ||||||
| Adverse events: abscess formation | Study population: participants undergoing clean‐contaminated, contaminated or dirty surgical procedures | RR 0.82 (0.42 to 1.62) | 1309 (9 RCTs) | ⊕⊝⊝⊝ | The effect of antibacterial compared with non‐antibacterial irrigation on abscess formation is very uncertain | |
| 31 per 1000 | 25 per 1000 (13 to 50) | |||||
| Risk difference: 6 fewer abscesses form per 1000 with antibacterial irrigation than with non‐antibacterial (18 fewer to 19 more) | ||||||
| *The risk in the intervention group (and its 95% confidence interval) is based on the assumed risk in the comparison group and the relative effect of the intervention (and its 95% CI). | ||||||
| GRADE Working Group grades of evidence | ||||||
| 1Downgraded once for risk of bias due to high risk of bias for at least one domain in studies contributing over 50% of the weight and once for probable publication bias. We did not further downgrade for inconsistency because the inconsistency present appeared due to the difference between larger and smaller studies and hence was accounted for by the downgrade for potential publication bias. | ||||||
| Standard irrigation compared with pulsatile irrigation for prevention of surgical site infection | ||||||
| Patient or population: participants undergoing clean, clean‐contaminated, contaminated or dirty surgical procedures | ||||||
| Outcomes | Anticipated absolute effects* (95% CI) | Relative effect | № of participants | Certainty of the evidence | Comments | |
| Risk with standard irrigation | Risk with pulsatile irrigation | |||||
| SSI | Study population: participants undergoing clean or clean‐contaminated surgical procedures | RR 0.34 | 484 | ⊕⊕⊝⊝ | Included studies show that there may be fewer SSIs in participants treated with pulsatile saline irrigation compared with standard techniques; the evidence is low certainty due to high risk of biases in the study contributing the majority of participants and weight to the analysis. | |
| 165 per 1000 | 56 per 1000 | |||||
| Risk difference: 109 fewer SSI occur per 1000 with pulsatile irrigation than with standard (134 fewer to 62 fewer) | ||||||
| Wound dehiscence | Study population: participants undergoing clean‐contaminated surgical procedures | RR 0.31 | 128 | ⊕⊕⊝⊝ | There is no clear difference in the incidence of wound dehiscence between groups treated with standard or pulsatile techniques of saline irrigation. Confidence intervals include both benefit and harm and are wide and fragile. | |
| 16 per 1000 | 5 per 1000 | |||||
| Risk difference: 11 fewer wound dehiscences occur per 1000 with pulsatile irrigation than with standard (16 fewer to 106 more) | ||||||
| Adverse events | Study population: participants undergoing clean‐contaminated surgical procedures | RR 1.31 (0.87 to 1.97) | 128 (1 RCT) | ⊕⊕⊝⊝ | There is no clear difference in the incidence of adverse events between groups treated with standard or pulsatile techniques of saline irrigation. Confidence intervals include both benefit and harm and are wide and fragile. | |
| 486 per 1000 | 371 per 1000 | |||||
| Risk difference: 115 fewer adverse events occur per 1000 with pulsatile irrigation (360 fewer to 48 more) | ||||||
| Adverse events: abscess formation | There were no reported data on abscess formation | |||||
| *The risk in the intervention group (and its 95% confidence interval) is based on the assumed risk in the comparison group and the relative effect of the intervention (and its 95% CI). | ||||||
| GRADE Working Group grades of evidence | ||||||
| 1Downgraded twice for high risk of bias in multiple domains for study contributing most of the weight. | ||||||
| Comparison | Surgery | Participants (studies) | SSI RR (95% CI) | GRADE judgement: certainty of the evidence | Reason for downgrading |
| Icodextrin vs Ringer's solution | Clean‐contaminated (uterine) | 426 (1 RCT) | 2.89 (0.30 to 27.56) | Low | Downgraded twice for very serious imprecision |
| Povidone iodine vs Dermacyn | Clean (cardiac) | 190 (1 RCT) | 2.80 (1.05 to 7.47) | Low | Downgraded once for high risk of bias and once for imprecision |
| Povidone iodine vs chlorhexidine | Dirty (peritonitis) | 53 (1 RCT)1 | 1.13 (0.78 to 1.63) | Very low | Downgraded twice for high risk of bias in multiple domains and once for imprecision |
| Cepharin vs cefoxitin | Clean‐contaminated (caesarean section) | 132 (1 RCT)1 | Not estimable (no events in either group) | No assessment possible | ‐ |
| Epicillin vs lincomycin | Contaminated (appendicitis) | 162 (1 RCT)1 | Not estimable (data not reported for groups) | No assessment possible | ‐ |
| Gentamicin vs clindamycin | Clean (breast) | 51 (1 RCT)1 | Not estimable (no events in either group) | No assessment possible | ‐ |
| Cephapirin versus moxalactam | Clean‐contaminated (caesarean section) | 149 (total 360) (1 RCT)2 | 1.69 (0.29 to 9.84) | Low | Downgraded twice for very serious imprecision |
| Cephapirin versus cefamandole | Clean‐contaminated (caesarean section) | 134 (total 360) (1 RCT)2 | 1.37 (0.24 to 7.95) | Low | Downgraded twice for very serious imprecision |
| Cephapirin versus ampicillin | Clean‐contaminated (caesarean section) | 140 (total 360) (1 RCT)2 | 7.00 (0.37 to 133.06) | Low | Downgraded twice for very serious imprecision |
| Cefamandole versus moxalactam | Clean‐contaminated (caesarean section) | 143 (total 360) (1 RCT)2 | 1.23 (0.18 to 8.52) | Low | Downgraded twice for very serious imprecision |
| Cefamandole versus ampicillin | Clean‐contaminated (caesarean section) | 134 (total 360) (1 RCT)2 | 5.46 (0.27 to 111.65) | Low | Downgraded twice for very serious imprecision |
| Moxalactam versus ampicillin | Clean‐contaminated (caesarean section) | 149 (total 360) (1 RCT)2 | 4.44 (0.22 to 90.88) | Low | Downgraded twice for very serious imprecision |
| Cefazolin versus cefamandole | Clean‐contaminated (caesarean section) | 207 (1 RCT) | 4.58 (0.22 to 93.38) | Low | Downgraded twice for very serious imprecision |
| 1Three‐armed trial; not all participants relevant to this comparison. CI: confidence interval; RCT: randomised controlled trial; RR: risk ratio; SSI: surgical site infection | |||||
| Study | Surgical category/type | Participants | Interventions | Definition of SSI | Follow‐up | SSI events | Risk ratio (95% CI) | Wound dehiscence risk ratio (95% CI) |
| Comparison of irrigation compared with no irrigation | ||||||||
| Clean‐contaminated Caeasarean section | 223 | Antibiotic irrigation/saline irrigation No irrigation | NR | |||||
| Dirty Perforated appendicitis | 35 | Saline postoperative irrigation No postoperative irrigation | Temperature > 38.5C for > 24 h plus localised, drainage‐confirmed accumulation of fluid | 6 weeks | 9/39 2/44 | 5.08 (1.17 to 22.09) Not included in pooled analysis ‐ intervention too different | NR | |
| Contaminated Appendicitis | 283 | Saline irrigation No irrigation | Collection of pus or positive bacteriologic culture from wound discharge | 4 weeks | 11/127 39/156 | 0.25 (0.19 to 0.65) | NR | |
| Clean‐contaminated Gastrectomy | 34 | Saline irrigation No irrigation | Centers for Disease Control and Prevention criteria | 2 weeks | 1/17 3/17 | 0.33 (0.04 to 2.89) | NR | |
| Mixed Abdominal/inguinal hernia | 592 | Antiseptic irrigation No irrigation | Purulent discharge seen within 4 weeks or culturing of fluid from the wound was positive | 4 weeks | 36/279 39/279 | 0.92 (0.61 to 1.41) | NR | |
| Clean‐contaminated Caeasarean section | 158 | Antibiotic irrigation No irrigation | NR | 6 weeks | 0/80 1/78 | 0.33 (0.01 to 7.86) | NR | |
| Clean‐contaminated Caeasarean section | 520 | Saline irrigation No irrigation | Wound drained purulent material/serosanguineous fluid plus induration, warmth and tenderness | 6 weeks | 17/260 19/260 | 0.89 (0.48 to 1.68) | NR | |
| Clean‐contaminated Caeasarean section | 196 | Saline irrigation No irrigation | Undue tenderness, erythema, discharge, or separation of the incision accompanying fever | NR | 1/97 2/99 | 0.51 (0.05 to 5.54) | NR | |
| Clean‐contaminated Caeasarean section | 3270 | Antiseptic irrigation No irrigation | Abscess or wound draining pus or sero‐sanguinous fluid, or redness, induration, warmth and tenderness or general practitioner prescribed antibiotics | 4 weeks | 144/1520 147/1507 | 0.97 (0.78 to 1.21) | NR | |
| Dirty Perforated appendicitis | 33 | Antibiotic irrigation/saline irrigation No irrigation | NR | Mean 8 d (5‐16) | 5/20 4/10 | 0.63 (0.21 to 1.83) | NR | |
| Dirty Perforated appendicitis | 14 | Saline irrigation No irrigation | NR | NR | 2/7 0/7 | 5.00 (0.28 to 88.53) | NR | |
| Clean Breast | 30 | Saline irrigation No irrigation | Wound discharge, invasive infection | 8 weeks | 0/30 0/30 | Not estimable Not included in pooled analysis ‐ split‐body design | 1.15 (0.44 to 3.06) | |
| Dirty Abdominal infection | 87 | Saline irrigation/ Antibiotic irrigation No irrigation | Discharge of pus | 2 weeks | 10/58 6/29 | 0.83 (0.34 to 2.07) | NR | |
| Mixed Appendix | 83 | Saline irrigation No irrigation | NR | 6 weeks | 0/40 0/41 | Not estimable | NR | |
| Dirty Appendix | 220 | Saline irrigation No irrigation | NR | NR | ||||
| Clean‐contaminated Liver resection | 193 | Saline irrigation No irrigation | Incisional or organ/space infection Incisional infection: clinically apparent cellulitis, induration, or purulent discharge. Organ/space infection: radiologic evidence of fluid collection necessitating drainage or antibiotic therapy | 4 weeks | 21/96 13/97 | 1.63 (0.87 to 3.07) | NR | |
| Contaminated Appendix | 374 | Antiseptic irrigation No irrigation | Collection of pus that emptied itself spontaneously or after incision | 2 weeks | 13/128 12/124 | 1.05 (0.50 to 2.21) | NR | |
| Clean‐contaminated Caeasarean section | 430 | Saline irrigation No irrigation | Partial or total separation of incision, plus purulent or serous wound discharge with induration, warmth, and tenderness | NR | 1/215 2/215 | 0.50 (0.05 to 5.47) | NR | |
| Contaminated Appendix | 131 | Antiseptic irrigation No irrigation Non‐antibacterial irrigation | Prescence of pus either spontaneously or on probing. All infections confirmed bacteriologically | NR | 17/131 Results are not given by intervention group; no effect estimate calculable | NR | ||
| Clean‐contaminated Caeasarean section | 236 | Saline irrigation No irrigation | NR | NR | ||||
| Comparison of antibacterial irrigationwith non‐antibacterial irrigation | ||||||||
| Mixed Appendicits | 254 | Antibiotic Saline | Purulent discharge in wound, regardless of culture results, or occurrence of serous discharge with positive culture | 1 month | 1/120 7/134 | 0.16 (0.02 to 1.28) | NR | |
| Clean‐contaminated Colorectal | 330 | Antiseptic Saline | Spontaneous or incisional discharge from wound, pus or serous fluid, with infective organism identified on culture | 6 weeks | 17/150 17/150 | 1.00 (0.53 to 1.88) | NR | |
| Clean‐contaminated Caeasarean section | 223 | Antibiotic irrigation Saline irrigation (No irrigation) | NR | NR | ||||
| Dirty Peritonitis | 35 | Antiseptic irrigation Saline irrigation | NR | NR | ||||
| Clean‐contaminated | 40 | Antibiotic Saline | NR | 4‐6 weeks | 1/20 1/20 | 1.00 (0.07 to 14.90) | NR | |
| Clean Breast | 54 | Antibiotic Saline | NR | 6 weeks | 0/23 1/30 | 0.43 (0.02 to 10.11) | 0.43 (0.02 to 10.11) | |
| Clean Spinal | 244 | Antiseptic Saline | Superficial (above lumbosacral fascia) or deep (below lumbosacral fascia), early onset (within 2 weeks) or late onset (otherwise). Deep infections confirmed by laboratory parameters: erythrocyte sedimentation rate, level of C‐reactive protein, and positive biopsy culture | 2 weeks, long‐term follow‐up to 19 months | 0/120 6/124 | 0.08 (0.00 to 1.40) Only included in sensitivity analysis due to suspected data overlap with Cheng 2005 | 0.52 (0.05 to 5.62) | |
| Clean Spinal | 417 | Antiseptic Saline | Unusual pain, tenderness, erythema, induration, fever, or wound drainage; investigated with erythrocyte sedimentation rate, C‐reactive protein, and bacteriological cultures from operative site or blood | 2 weeks', long‐term follow‐up to mean 15.5 months | 0/208 7/206 | 0.07 (0.00 to 1.015) | NR | |
| Clean‐contaminated Caesarean | 360 | 4 antibiotics Saline | Wound breakdown with positive culture or presence of cellulitis | NR | 7/283 3/77 | 0.63 (0.17 to 2.40) | NR | |
| Mixed Colorectal | 129 | Antibiotic Saline | Discharge of pus from the wound "wound sepsis" | 1 month | 15/64 18/65 | 0.85 (0.47 to 1.53) | NR | |
| Mixed Appendicitis | 192 | Antiseptic Saline | Wound discharging pus | 4 weeks | 18/99 29/93 | 0.58 (0.35 to 0.98) | NR | |
| Clean Orthopaedic | 162 | Antiseptic Saline | Positive bacteriological examination | 6 weeks then mean 7.8 (2‐4) months | 0/89 2/73 | 0.16 (0.01 to 3.37) | NR | |
| Dirty Perforated appendicitis | 16 | Antiseptic Saline | NR | NR | 1/8 4/8 | 0.25 (0.04 to 1.77) | NR | |
| Dirty Perforated appendicitis | 44 | Antiseptic Saline | Infection at operation site, up to 30 d after surgery; confirmed causative pathogen(s) identical to those of appendicitis | 30 d | 0/24 4/20 | 0.09 (0.01 to 1.64) | NR | |
| Clean‐contaminated Caeasarean section | 128 | 2 Antibiotics Saline | Purulent wound discharge with or without wound separation | 8 weeks | 0/85 3/43 | 0.07 (0.00 to 1.38) | NR | |
| Mixed Gastrointestinal/colorectal | 200 | Antibiotic Saline | NR | NR | 3/100 9/100 | 0.33 (0.09 to 1.20) | NR | |
| Clean‐contaminated Caeasarean section | 100 | Antibiotic Saline | Hyperemic skin incision and fluctuant mass which when opened contained purulent material | NR | 2/50 4/50 | 0.50 (0.10 to 0.50) | NR | |
| Contaminated Appendicitis | 162 | 2 Antibiotics Saline | Septic complications with spontaneous or induced purulent discharge | 4 d; longer follow‐up unclear | Results are not given by intervention group; no effect estimate calculable | NR | ||
| Clean‐contaminated Cholecystectomy | 102 | Antibiotic Saline | Erythema, induration, tenderness, warmth, suppurative discharge | 6 weeks | 6/51 6/51 | 1.00 (0.35 to 2.89) | NR | |
| Clean‐contaminated Abdominal | 260 | Antibiotic Saline | NR, wounds were monitored with daily photographs | Until discharge | 12/124 23/116 | 0.49 (0.25 to 0.94) | NR | |
| Clean‐contaminated Colorectal | 197 | Antiseptic Non‐antibacterial | NR | NR | 19/101 22/96 | 0.82 (0.48 to 1.42) | NR | |
| Mixed General surgery | 540 | Antiseptic Saline | NR | NR | 16/267 15/273 | 1.09 (0.55 to 2.16) | NR | |
| Dirty Perforated appendicitis | 33 | Antibiotic irrigation Saline irrigation No irrigation | NR | mean 8 d (5‐16) | 3/10 2/10 | 1.50 (0.32 to 3.09) | NR | |
| Clean Breast | 51 | 2 Antibiotics Saline | NR | NR | 0/34 0/17 | Not estimable | NR | |
| Dirty Peritonitis | 94 | Antibiotic Saline | NR | NR | 11/44 13/50 | 0.96 (0.48 to 1.92) | NR | |
| Clean‐contaminated Colorectal | 128 | Antibiotic Saline | NR | NR | 6/64 27/64 | 0.22 (0.10 to 0.50) | NR | |
| Clean‐contaminated Colorectal | 108 | Antibiotic Saline | Presence of purulent discharge, confirmed with microbiologic culture | 30 d | 2/52 7/51 | 0.29 (0.06 to 1.31) | NR | |
| Clean Breast | 40 | Antibiotic Saline | NR | 2 weeks | 0/20 0/20 | Not estimable | NR | |
| Clean‐contaminated Colorectal | 106 | Antibiotic Saline | NR | 30 d | 2/52 7/52 | 0.20 (0.05 to 1.87) | NR | |
| Clean‐contaminated Bariatric surgery | 80 | Antibiotic Saline | NR | 30 d after discharge | NR | NR | ||
| Dirty Abdominal infection | 87 | Antibiotic Saline (No irrigation) | Discharge of pus | 2 weeks | 5/29 5/29 (6/29) | 1.00 (0.32 to 3.09) | NR | |
| Mixed Gastrointestinal/colorectal | 159 | Antibiotic Saline | Discharge of pus | 6 weeks | 10/85 24/74 | 0.36 (0.19 to 0.71) | NR | |
| Mixed General Surgery | 500 | Antiseptic Saline | Pus discharged within 12 weeks or serous drainage from questionable wounds plus positive culture | 12 weeks | 7/242 39/258 | 0.19 (0.09 to 0.42) | NR | |
| Clean‐contaminated Colorectal | 400 | Antiseptic Saline | National Nosocomial Infections Surveillance system | 30 d (total 3 months) | 19/180 29/183 | 0.67 (0.39 to 1.14) | 1.44 (0.71 to 2.93) | |
| Contaminated Appendix | 131 | Antiseptic irrigation Non‐antibacterial irrigation (No irrigation) | Prescence of pus either spontaneously or on probing. All infections confirmed bacteriologically | NR | 7/131 Results are not given by intervention group; No effect estimate calculable | NR | ||
| Dirty Peritonitis | 53 | 2 Antiseptics Saline | Pus in wound, sero‐sanguinous discharge, Inflammation or induration | 1 month | 23/29 10/16 | 0.61 (0.40 to 0.92) | NR | |
| Comparisons of two different agents in the same class | ||||||||
| Clean‐contaminated Uterine | 449 | 2 non‐antibacterials Icodextrin Ringer's solution | NR clearly; data on infection ambiguous | NR | ||||
| Clean‐contaminated Caesarean | 360 | 4 antibiotics (Saline) Cephapirin Cefamandole Moxalactam Ampicillin | Wound breakdown with positive culture or presence of cellulitis | NR | 3/70 2/64 2/79 0/70 | Cephapirin: cefamandole 1.37 (0.24 to 7.95) Cephapirin: moxalactam 1.69 (0.29 to 9.84) Cephapirin: ampicillin 7.00 (0.37 to 133.06) Cefamandole: moxalactam 1.23 (0.18 to 8.52) Cefamandole: ampicillin 5.46 (0.27 to 111.65) Moxalactam: ampicillin 4.44 (0.22 to 90.88) | NR | |
| Clean‐contaminated Caesarean | 128 | 2 antibiotics (Saline) Cephapirin cefoxitin | Purulent wound discharge with or without wound separation | 8 weeks | 0/44 0/41 | Not estimable; zero events | NR | |
| Contaminated Appendicitis | 162 | 2 antibiotics (Saline) Epicillin Lincomycin | Septic complications with spontaneous or induced purulent discharge | 4 d; longer follow‐up unclear | Not estimable; number of participants and events per group not reported | NR | ||
| Clean Cardiac | 190 | 2 antiseptics Povidone iodine Dermacyn | Centers for Disease Control and Prevention criteria | 6 weeks | 14/90 5/88 | 2.80 (1.05 to 7.47) | NR | |
| Clean Breast | 51 | 2 antibiotics Clindamycin Gentamicin | NR | NR | 0/17 0/17 | Not estimable; zero events | NR | |
| Clean‐contaminated Caesarean | 207 113 in relevant groups | 2 antibiotics Cefazolin Cefamandole | Presence of cellulitis and/or purulent exudate | > 2 weeks | 2/59 0/54 | 4.58 (0.22 to 93.38) | NR | |
| Clean Brain | 20 | 2 non‐antibacterials Saline Artificial CSF | NR | NR | ||||
| Clean‐contaminated Uterine | 498 | 2 non‐antibacterials Icodextrin Ringer's solution | NR | 4‐16 weeks | 3/217 1/209 | 2.89 (0.30 to 27.56) | NR | |
| Dirty Peritonitis | 53 | 2 antiseptics (Saline) Povidone iodine Chlorhexidine | Pus in wound, sero‐sanguinous discharge, Inflammation or induration | 1 month | 4/16 4/13 | 1.13 (95% CI 0.78 to 1.63) | NR | |
| Comparison of pulsatile versus standard irrigation delivery | ||||||||
| Clean Orthopaedic | 356 | Pulsatile saline Standard saline | Nosocomial Infection National Surveillance Survey | 30 days or discharge | 9/164 30/192 | 0.35 (0.17 to 0.72) | NR | |
| Clean‐contaminated Abdominal | 137 | Pulsatile saline Standard saline | Purulent drainage, with or without laboratory confirmation; organisms isolated from aseptically obtained culture of fluid or tissue; at least 1 of the following: pain or tenderness, localised swelling, redness, or heat and incision is deliberately opened by surgeon, unless incision is culture‐negative; diagnosis of superficial incisional SSI by surgeon or attending physician | 1 month | 4/66 12/62 | 0.31 (0.11 to 0.92) | 0.31 (0.01 to 7.55) | |
| 1Elliott is a 4‐armed trial with a factorial design, arms with and without intravenous antibiotics are combined CI: confidence interval; CSF: cerebrospinal fluid; NR: not reported; RR: risk ratio | ||||||||
| Comparison | Subgroup basis | Pre‐specified or exploratory | Subgroups used | Subgroup results | I2 & Chi2 subgroup differences | I2 & Chi2 overall |
| Irrigation vs no irrigation | Surgical classification | Pre‐specified | Clean‐contaminated Contaminated/Dirty/Mixed | 1.00 (0.82, 1.21) 0.74 (0.47 to 1.16) | I2 = 29.1%. Chi2 = 1.41 | I2 = 28% Chi2 = 16.58 |
| Irrigation vs no irrigation | Type of irrigation | Exploratory | Non‐antibacterial Antiseptic Antibiotic | 0.80 (0.46 to 1.41) 0.97 (0.81 to 1.17) 0.92 (0.42 to 1.99) | I2 = 0% Chi2 = 0.39 | I2 = 28% Chi2 = 16.58 |
| Antibacterial vs non‐antibacterial | Surgical classification | Pre‐specified | Clean Clean‐contaminated Contaminated/Dirty/Mixed | 0.17 (0.03 to 0.89) 0.57 (0.40 to 0.79) 0.61 (0.40 to 0.92) | I2= 9.7% Chi2 = 2.21 | I2 = 53% Chi2 = 56.94 |
| Antibacterial vs non‐antibacterial | Type of irrigation | Exploratory | Antiseptic Antibiotic | 0.63 (0.40 to 0.95) 0.57 (0.44 to 0.75) | I2= 0% Chi2 = 0.38 | I2 = 53% Chi2 = 56.94 |
| CI: confidence interval; RR: risk ratio | ||||||
| Study Surgical category/type | Participants (N) Follow‐up | Interventions | Mortality | Systemic antibiotics | Antibiotic resistance | Adverse events | Reoperation | Readmission | Length of stay (days (95% CI)) |
| Irrigation compared with no irrigation | |||||||||
| Clean‐contaminated Caeasarean section | 223 6 weeks | Antibiotic irrigation/Saline irrigation No irrigation | ‐ | ‐ | ‐ | Specific complication only | ‐ | ‐ | Difference in means ‐0.46 (‐0.64 to ‐0.29) |
| Dirty Perforated appendicitis | 85 6 weeks | Saline postoperative irrigation No postoperative irrigation | ‐ | ‐ | ‐ | ‐ | ‐ | ‐ | Medians 5 (3‐11) vs 5 (4‐12) |
| Contaminated Appendicitis | 283 4 weeks | Saline irrigation No irrigation | ‐ | ‐ | ‐ | No group data | ‐ | ‐ | ‐ |
| Clean‐contaminated Gastrectomy | 34 2 weeks (primary outcome) | Saline irrigation No irrigation | No secondary outcomes were reported | ||||||
| Mixed Abdominal/inguinal hernia | 592 4 weeks (primary outcome) | Antiseptic irrigation No irrigation | No secondary outcomes were reported | ||||||
| Clean‐contaminated Caeasarean section | 158 6 weeks | Antibiotic irrigation No irrigation | ‐ | ‐ | ‐ | Specific complication only | ‐ | ‐ | Difference in means ‐0.20 (‐0.57 to 0.17) |
| Clean‐contaminated Caeasarean section | 520 6 weeks | Saline irrigation No irrigation | ‐ | ‐ | ‐ | ‐ | ‐ | ‐ | Difference in means 0.01 (‐0.03 to 0.05) |
| Clean‐contaminated Caeasarean section | 196 NR | Saline irrigation No irrigation | ‐ | ‐ | ‐ | Overall RR 1.10 (0.55 to 2.22) | ‐ | ‐ | Difference in means 0.10 (‐0.17 to 0.37) |
| Clean‐contaminated Caeasarean section | 3270 4 weeks | Antiseptic irrigation No irrigation | ‐ | ‐ | ‐ | ‐ | RR 0.77 (0.29 to 2.07) | RR 1.29 (0.81 to 2.06) | ‐ |
| Dirty Perforated appendicitis | 33 mean 8 days (5‐16) | Antibiotic irrigation/Saline irrigation No irrigation | ‐ | ‐ | ‐ | Abscess RR 0.17 (0.01 to 3.94) | ‐ | ‐ | Medians 14 (8‐22) vs 13 (9‐22) |
| Dirty Perforated appendicitis | 14 NR | Saline irrigation No irrigation | ‐ | ‐ | ‐ | Overall RR 1.00 (0.08 to 13.02) Abscess but no group data | ‐ | ‐ | ‐ |
| Clean Breast | 30 8 weeks | Saline irrigation No irrigation | ‐ | ‐ | ‐ | ‐ | ‐ | ‐ | ‐ |
| Dirty Abdominal infection | 87 2 weeks | Saline irrigation Antibiotic irrigation No irrigation | RR 0.75 (0.30 to 1.90) | ‐ | ‐ | ‐ | ‐ | ‐ | Difference in means not estimable 11.5 vs 13 |
| Mixed Appendix | 83 6 weeks | Saline irrigation No irrigation | ‐ | ‐ | ‐ | Abscess RR 1.02 (0.15 to 6.93) | ‐ | ‐ | Medians 2.0 (1‐3) vs 2.0 (1‐2.25) |
| Dirty Appendix | 220 2‐4 weeks | Saline irrigation No irrigation | ‐ | ‐ | ‐ | Abscess RR 0.95 (0.55 to 1.65) | RR 0.33 (0.01 to 8.09) | RR 0.14 (0.01 to 2.73) | Difference in means ‐0.10 (‐0.85 to 0.65) |
| Clean‐contaminated Liver resection | 193 4 weeks | Saline irrigation No irrigation | RR 2.02 (0.36 to 2.04) | ‐ | ‐ | Overall RR 1.04 (0.72 to 1.49) | ‐ | ‐ | Difference in means 0.00 (‐3.74 to 3.74) |
| Contaminated Appendix | 374 2 weeks | Antiseptic irrigation No irrigation | No secondary outcomes were reported | ||||||
| Clean‐contaminated Caeasarean section | 430 NR | Saline irrigation No irrigation | No secondary outcomes were reported | ||||||
| Contaminated Appendix | 131 NR | Antiseptic irrigation No irrigation Non‐antibacterial irrigation | ‐ | 53/131 participants "distributed evenly across the groups" | ‐ | ‐ | ‐ | ‐ | No group data |
| Clean‐contaminated Caeasarean section | 236 NR | Saline irrigation No irrigation | ‐ | ‐ | ‐ | ‐ | ‐ | ‐ | Median discharge day: 3 in both groups |
| Antibacterial irrigation vs non‐antibacterial irrigation | |||||||||
| Mixed Appendicits | 254 1 month | Antibiotic Saline | ‐ | ‐ | ‐ | Abscess RR not estimable 0 events | No group data | ||
| Clean‐contaminated Colorectal | 330 6 weeks | Antiseptic Saline | RR 1.00 (0.25 to 3.92) | ‐ | ‐ | Abscess RR 2.0 (0.18 to 21.82) | No group data | ||
| Clean‐contaminated Caeasarean section | 223 6 weeks | Antibiotic irrigation Saline irrigation (No irrigation) | ‐ | ‐ | ‐ | Specific complication only | ‐ | ‐ | Difference in means ‐1.08 (‐1.25 to ‐0.92) |
| Dirty Peritonitis | 35 NR | Antiseptic irrigation Saline irrigation | RR 7.39 (0.41 to 133.24) | ‐ | ‐ | ‐ | ‐ | ||
| Clean‐contaminated Caeasarean section | 40 4‐6 weeks | Antibiotic Saline | ‐ | ‐ | ‐ | ‐ | ‐ | ||
| Clean Breast | 54 6 weeks | Antibiotic Saline | ‐ | ‐ | ‐ | ‐ | ‐ | ||
| Clean Spinal | 244 2 weeks, long‐term follow‐up to 19 months | Antiseptic Saline | ‐ | All 6 participants with SSI received these; all in saline group | 5/6 infections positive for MRSA | ‐ | ‐ | ||
| Clean Spinal | 417 2 weeks long ‐term follow ‐up to mean 15.5 months | Antiseptic Saline | ‐ | ‐ | ‐ | ‐ | ‐ | ||
| Clean‐contaminated Caeasarean section | 360 NR | 4 antibiotics Saline | ‐ | ‐ | ‐ | Abscess RR not estimable 0 events | ‐ | ||
| Mixed Colorectal | 129 1 month | Antibiotic Saline | No secondary outcomes were reported | ||||||
| Mixed Appendicitis | 192 4 weeks | Antiseptic Saline | ‐ | ‐ | ‐ | ‐ | Difference in means not estimable (6.4 vs 6.6) | ||
| Clean Orthopaedic | 162 mean 7‐8 months (range 2‐14 months) (primary outcome) | Antiseptic Saline | No secondary outcomes were reported | ‐ | |||||
| Dirty Perforated appendicitis | 16 NR | Antiseptic Saline | ‐ | ‐ | ‐ | Abscess RR 0.33 (0.02 to 7.14) | Difference in means ‐10.60 (‐19.06 to ‐2.14) | ||
| Dirty Perforated appendicitis | 44 30 days | Antiseptic Saline | ‐ | ‐ | ‐ | Abscess RR 0.83 (0.06 to 12.49) | Difference in means ‐0.70 (‐3.31 to 1.91) | ||
| Clean‐contaminated Caeasarean section | 128 8 weeks | Antibiotic Saline | ‐ | ‐ | ‐ | Specific complication only | Difference in means ‐0.35 (‐1.06 to 0.36) | ||
| Mixed Gastrointestinal/colorectal | 200 NR | Antibiotic Saline | RR 1.67 (0.41 to 6.79) | ‐ | Specific organisms | Specific complication only | ‐ | ||
| Clean‐contaminated Caeasarean section | 100 NR | Antibiotic Saline | ‐ | ‐ | ‐ | Specific complication only | ‐ | ||
| Contaminated Appendicitis | 162 4 days; longer follow‐up unclear | Antibiotic Saline | ‐ | ‐ | ‐ | Specific complication only | ‐ | ||
| Clean‐contaminated Cholecystectomy | 102 6 weeks | Antibiotic Saline | No secondary outcomes were reported | ||||||
| Clean‐contaminated Abdominal | 260 Until discharge | Antibiotic Saline | ‐ | ‐ | Kanamycin resistance Kanamycin: 12/12 Saline: "over half" of 23 | Specific complication only | ‐ | ||
| Clean‐contaminated Colorectal | 197 NR | Antiseptic Saline | No secondary outcomes were reported | ||||||
| Mixed General surgery | 540 NR | Antiseptic Saline | No secondary outcomes were reported | ‐ | |||||
| Dirty Perforated appendicitis | 33 Mean 8 days (5‐16 | Antibiotic irrigation Saline irrigation No irrigation | ‐ | ‐ | ‐ | Abscess RR not estimable 0 events | Medians 13 (9‐20 13 (10‐22) | ||
| Clean Breast | 51 NR | Antibiotic 1/ Antibiotic 2 Saline | RR not estimable, 0 events | ‐ | ‐ | ‐ | Medians 3 (1‐3) 3 (1‐3) | ||
| Dirty Peritonitis | 94 NR | Antibiotic Saline | RR 0.71 (0.25 to 2.01) | ‐ | Specific organisms | Abscess grouped with another event ‐ not estimable | ‐ | ||
| Clean‐contaminated Colorectal | 128 NR | Antibiotic Saline | No secondary outcomes were reported | ||||||
| Clean‐contaminated Colorectal | 108 30 days | Antibiotic Saline | RR 0.50 (0.05 to 5.35) | ‐ | ‐ | Abscess RR 0.14 (0.01 to 2.65) | Medians 6 (5‐32) 6.5 (5‐14) | ||
| Clean Breast | 40 2 weeks | Antibiotic Saline | RR not estimable, 0 events | ‐ | ‐ | Overall RR not estimable 0 events | Medians 3 (1‐3) 3 (1‐3) | ||
| Clean‐contaminated Colorectal | 106 30 days | Antibiotic Saline | RR 1.00 (0.06 to 15.57) | ‐ | ‐ | Specific complication only | Medians 6.5 (5‐14) 6 (5‐32) | ||
| Clean‐contaminated Bariatric surgery | 80 30 days | Antibiotic Saline | RR 0.33 (0.01 to 7.95) | ‐ | ‐ | Overall RR 0.50 (0.05 to 5.30) | ‐ | ||
| Dirty Abdominal infection | 87 2 weeks | Antibiotic Saline | RR 0.50 (0.14 to 1.81) | ‐ | ‐ | Overall RR 0.56 (0.21 to 1.46) Abscess RR 0.33 (0.01 to 7.86) | Difference in means not estimable 10 vs 13 | ||
| Mixed Gastrointestinal/colorectal | 159 6 weeks | Antibiotic Saline | ‐ | ‐ | ‐ | Abscess RR 0.96 (0.43 to 2.13) Specific additional complication | RR 6.10 (0.32 to 116.28) | ‐ | |
| Mixed General Surgery | 500 12 weeks | Antiseptic Saline | No secondary outcomes were reported | ||||||
| Clean‐contaminated Colorectal | 400 30 days (total 3 months) | Antiseptic Saline | ‐ | ‐ | MRSA 4/14 vs 8/24 MSSA 0/14 vs 3/24 | ‐ | ‐ | ||
| Contaminated Appendix | 131 NR | Antiseptic Non‐antibacterial (No irrigation) | ‐ | 53/131 participants "distributed evenly across the groups" | ‐ | ‐ | ‐ | ‐ | No group data |
| Dirty Peritonitis | 53 1 month | Antiseptic Saline | RR 0.61 (0.17 to 2.16) | ‐ | ‐ | ‐ | Difference in means ‐0.70 (‐3.32 to 1.92) | ||
| Comparisons of two different agents in the same class | |||||||||
| Clean‐contaminated Uterine | 449 28‐56 days | 2 non‐antibacterials Icodextrin Ringer's solution | RR not estimable ‐ 0 events | ‐ | ‐ | Total: RR 0.99 (0.96 to 1.02) Treatment‐related RR 1.42 (0.98 to 2.05) Serious RR 1.20 (0.80 to 1.78) Serious treatment‐related RR 0.71 (0.29 to 1.73) | ‐ | ‐ | ‐ |
| Clean‐contaminated Caeasarean section | 360 NR | 4 antibiotics (Saline) Cephapirin Cefamandole Moxalactam Ampicillin | ‐ | ‐ | ‐ | Abscess: no effect estimate calculable ‐ 0 events Other specific events | ‐ | ‐ | ‐ |
| Clean‐contaminated Caeasarean section | 128 8 weeks | 2 antibiotics (Saline) Cephapirin Cefoxitin | ‐ | ‐ | ‐ | Specific event data only | ‐ | ‐ | Difference in means 0.10 (‐0.78 to 0.58) |
| Contaminated Appendicitis | 162 4 days; longer follow‐up unclear | 2 antibiotics (Saline) Epicillin Lincomycin | ‐ | ‐ | ‐ | 1 abscess in antibiotic groups; no group data | ‐ | ‐ | ‐ |
| Clean Cardiac | 190 6 weeks | 2 antiseptics Povidone iodine Dermacyn | 4 deaths but no group data; group data for composite outcome with reopening of chest | ‐ | ‐ | ‐ | RR 8.80 (0.48 to 161.11) | ‐ | ‐ |
| Clean Breast | 51 NR | 2 antibiotics Clindamycin Gentamicin | RR not estimable, 0 events | ‐ | ‐ | ‐ | ‐ | ‐ | Median 3 (1‐3) in each group |
| Clean‐contaminated Caeasarean section | 207 113 in relevant groups 2 weeks + (primary outcome) | 2 antibiotics Cefazolin Cefamandole | No secondary outcomes were reported | ||||||
| Clean Brain | 20 10 days | 2 non‐antibacterials Saline Artificial CSF | ‐ | ‐ | ‐ | 2 participants in each group, included MRI data. RR not calculated | ‐ | ‐‐ | ‐ |
| Clean‐contaminated Uterine | 498 4‐16 weeks | 2 non‐antibacterials Icodextrin Ringer's solution | RR not estimable ‐ 0 events | ‐ | Total: RR 0.95 (0.73 to 1.24) Treatment‐related RR 1.16 (0.60 to 2.23) | ‐ | ‐ | ‐ | |
| Dirty Peritonitis | 53 1 month | 2 antiseptics (Saline) Povidone iodine Chlorhexidine | RR 0.45 (0.05 to 3.90) within 4 days, no group data for later events | ‐ | ‐ | ‐ | ‐ | ‐ | Difference in means 3.30 (0.53 to 3.90) |
| Comparison of pulsatile versus standard irrigationdelivery | |||||||||
| Clean Orthopaedic | 356 30 days or discharge | Pulsatile saline Standard saline | No group data | ‐ | No group data "half" SSI positive for MRSA | ‐ | ‐ | ‐ | ‐ |
| Clean‐contaminated Abdominal | 137 1 month | Pulsatile saline Standard saline | ‐ | No group data: 14/16 SSI treated | Qualitative data on organisms isolated | Complications, not wound infections RR 1.31 (0.87 to 1.97) | RR 0.56 (0.14 to 2.26) | RR 1.41 (0.53 to 3.73) | Median 9 (5 ‐45) 9 (4‐71) |
| More details of interventions can be found in Table 1 and Characteristics of included studies 1 Elliott is a four‐armed trial with a factorial design, arms with and without iv antibiotics are combined CI: confidence interval; CSF: cerebrospinal fluid; MRI: magnetic resonance imaging; MRSA: methicillin‐resistant Staphylococcus aureus; RR: risk ratio; SSI: surgical site infection | |||||||||
| Outcome or subgroup title | No. of studies | No. of participants | Statistical method | Effect size |
| 1 SSI Show forest plot | 14 | 6106 | Risk Ratio (M‐H, Random, 95% CI) | 0.87 [0.68, 1.11] |
| 1.1 clean or clean‐contaminated | 7 | 4801 | Risk Ratio (M‐H, Random, 95% CI) | 1.00 [0.82, 1.21] |
| 1.2 contaminated or dirty | 7 | 1305 | Risk Ratio (M‐H, Random, 95% CI) | 0.74 [0.47, 1.16] |
| 2 Adverse events Show forest plot | 3 | 403 | Risk Ratio (M‐H, Random, 95% CI) | 1.05 [0.76, 1.44] |
| 3 Abscess Show forest plot | 3 | 331 | Risk Ratio (M‐H, Random, 95% CI) | 0.91 [0.54, 1.54] |
| 4 Mortality Show forest plot | 2 | 280 | Risk Ratio (M‐H, Random, 95% CI) | 0.86 [0.36, 2.04] |
| 5 Hospital stay Show forest plot | 7 | 1597 | Mean Difference (IV, Random, 95% CI) | ‐0.13 [‐0.38, 0.12] |
| 6 Return to theatre (reoperation) Show forest plot | 2 | 3247 | Risk Ratio (M‐H, Random, 95% CI) | 0.72 [0.28, 1.84] |
| 7 Readmission to hospital Show forest plot | 2 | 3247 | Risk Ratio (M‐H, Random, 95% CI) | 0.70 [0.10, 4.90] |
| Outcome or subgroup title | No. of studies | No. of participants | Statistical method | Effect size |
| 1 SSI Show forest plot | 30 | 5141 | Risk Ratio (M‐H, Random, 95% CI) | 0.57 [0.44, 0.75] |
| 1.1 clean | 4 | 680 | Risk Ratio (M‐H, Random, 95% CI) | 0.16 [0.03, 0.89] |
| 1.2 clean‐contaminated | 13 | 2210 | Risk Ratio (M‐H, Random, 95% CI) | 0.57 [0.40, 0.79] |
| 1.3 contaminated or dirty | 13 | 2251 | Risk Ratio (M‐H, Random, 95% CI) | 0.61 [0.40, 0.92] |
| 2 Wound dehiscence Show forest plot | 3 | 660 | Risk Ratio (M‐H, Random, 95% CI) | 1.26 [0.65, 2.45] |
| 3 Adverse events Show forest plot | 3 | 178 | Risk Ratio (M‐H, Random, 95% CI) | 0.55 [0.22, 1.34] |
| 4 Abscess Show forest plot | 9 | 1309 | Risk Ratio (M‐H, Random, 95% CI) | 0.82 [0.42, 1.62] |
| 5 Mortality Show forest plot | 11 | 1121 | Risk Ratio (M‐H, Random, 95% CI) | 0.81 [0.48, 1.36] |
| 6 Hospital stay Show forest plot | 7 | 635 | Mean Difference (IV, Random, 95% CI) | ‐0.85 [‐1.60, ‐0.09] |
| 7 Return to theatre (reoperation) Show forest plot | 2 | 403 | Risk Ratio (M‐H, Random, 95% CI) | 1.26 [0.12, 13.60] |
| Outcome or subgroup title | No. of studies | No. of participants | Statistical method | Effect size |
| 1 Mortality Show forest plot | 2 | 875 | Risk Ratio (M‐H, Fixed, 95% CI) | 0.0 [0.0, 0.0] |
| 2 Adverse events Show forest plot | 2 | 875 | Risk Ratio (M‐H, Random, 95% CI) | 0.99 [0.96, 1.02] |
| 3 Treatment‐related adverse events Show forest plot | 2 | 875 | Risk Ratio (M‐H, Random, 95% CI) | 1.35 [0.98, 1.86] |
| Outcome or subgroup title | No. of studies | No. of participants | Statistical method | Effect size |
| 1 SSI Show forest plot | 2 | 484 | Risk Ratio (M‐H, Random, 95% CI) | 0.34 [0.19, 0.62] |