| Study Surgical category/type | Participants (N) Follow‐up | Interventions | Mortality
RR (95% CI) | Systemic antibiotics
RR (95% CI) | Antibiotic resistance
RR (95% CI) | Adverse events
RR (95% CI) | Reoperation
RR (95% CI) | Readmission
RR (95% CI) | Length of stay (days (95% CI)) |
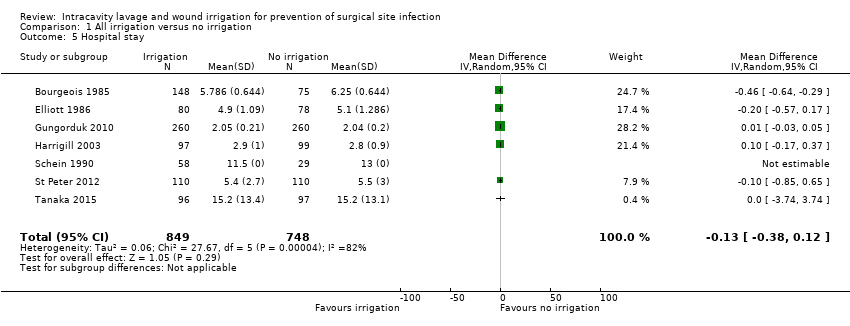
| Irrigation compared with no irrigation |
| Bourgeois 1985 Clean‐contaminated Caeasarean section | 223 6 weeks | Antibiotic irrigation/Saline irrigation No irrigation | ‐ | ‐ | ‐ | Specific complication only | ‐ | ‐ | Difference in means ‐0.46 (‐0.64 to ‐0.29) |
| Buanes 1991 Dirty Perforated appendicitis | 85 6 weeks | Saline postoperative irrigation No postoperative irrigation | ‐ | ‐ | ‐ | ‐ | ‐ | ‐ | Medians 5 (3‐11) vs 5 (4‐12) |
| Cervantes‐Sanchez 2000 Contaminated Appendicitis | 283 4 weeks | Saline irrigation No irrigation | ‐ | ‐ | ‐ | No group data | ‐ | ‐ | ‐ |
| Cho 2004 Clean‐contaminated Gastrectomy | 34 2 weeks (primary outcome) | Saline irrigation No irrigation | No secondary outcomes were reported |
| De Jong 1982 Mixed Abdominal/inguinal hernia | 592 4 weeks (primary outcome) | Antiseptic irrigation No irrigation | No secondary outcomes were reported |
| Elliott 19861 Clean‐contaminated Caeasarean section | 158 6 weeks | Antibiotic irrigation No irrigation | ‐ | ‐ | ‐ | Specific complication only | ‐ | ‐ | Difference in means ‐0.20 (‐0.57 to 0.17) |
| Gungorduk 2010 Clean‐contaminated Caeasarean section | 520 6 weeks | Saline irrigation No irrigation | ‐ | ‐ | ‐ | ‐ | ‐ | ‐ | Difference in means 0.01 (‐0.03 to 0.05) |
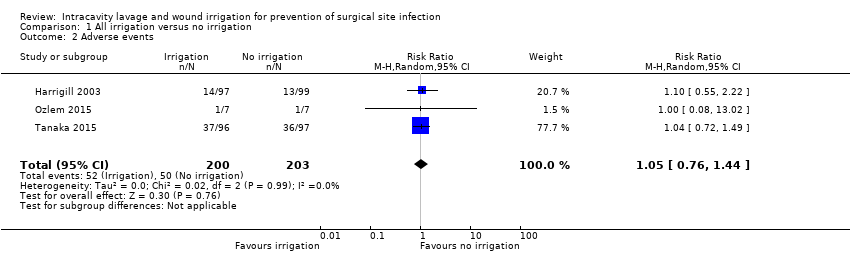
| Harrigill 2003 Clean‐contaminated Caeasarean section | 196 NR | Saline irrigation No irrigation | ‐ | ‐ | ‐ | Overall RR 1.10 (0.55 to 2.22) | ‐ | ‐ | Difference in means 0.10 (‐0.17 to 0.37) |
| Mahomed 2016 Clean‐contaminated Caeasarean section | 3270 4 weeks | Antiseptic irrigation No irrigation | ‐ | ‐ | ‐ | ‐ | RR 0.77 (0.29 to 2.07) | RR 1.29 (0.81 to 2.06) | ‐ |
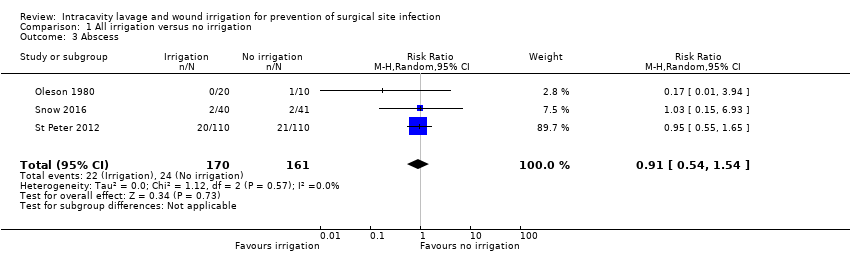
| Oleson 1980 Dirty Perforated appendicitis | 33 mean 8 days (5‐16) | Antibiotic irrigation/Saline irrigation No irrigation | ‐ | ‐ | ‐ | Abscess RR 0.17 (0.01 to 3.94) | ‐ | ‐ | Medians 14 (8‐22) vs 13 (9‐22) |
| Ozlem 2015 Dirty Perforated appendicitis | 14 NR | Saline irrigation No irrigation | ‐ | ‐ | ‐ | Overall RR 1.00 (0.08 to 13.02) Abscess but no group data | ‐ | ‐ | ‐ |
| Platt 2003 Clean Breast | 30 8 weeks | Saline irrigation No irrigation | ‐ | ‐ | ‐ | ‐ | ‐ | ‐ | ‐ |
| Schein 1990 Dirty Abdominal infection | 87 2 weeks | Saline irrigation Antibiotic irrigation No irrigation | RR 0.75 (0.30 to 1.90) | ‐ | ‐ | ‐ | ‐ | ‐ | Difference in means not estimable 11.5 vs 13 |
| Snow 2016 Mixed Appendix | 83 6 weeks | Saline irrigation No irrigation | ‐ | ‐ | ‐ | Abscess RR 1.02 (0.15 to 6.93) | ‐ | ‐ | Medians 2.0 (1‐3) vs 2.0 (1‐2.25) |
| St Peter 2012 Dirty Appendix | 220 2‐4 weeks | Saline irrigation No irrigation | ‐ | ‐ | ‐ | Abscess RR 0.95 (0.55 to 1.65) | RR 0.33 (0.01 to 8.09) | RR 0.14 (0.01 to 2.73) | Difference in means ‐0.10 (‐0.85 to 0.65) |
| Tanaka 2015 Clean‐contaminated Liver resection | 193 4 weeks | Saline irrigation No irrigation | RR 2.02 (0.36 to 2.04) | ‐ | ‐ | Overall RR 1.04 (0.72 to 1.49) | ‐ | ‐ | Difference in means 0.00 (‐3.74 to 3.74) |
| Tanphiphat 1978 Contaminated Appendix | 374 2 weeks | Antiseptic irrigation No irrigation | No secondary outcomes were reported |
| Temizkan 2016 Clean‐contaminated Caeasarean section | 430 NR | Saline irrigation No irrigation | No secondary outcomes were reported |
| Tighe 1982 Contaminated Appendix | 131 NR | Antiseptic irrigation No irrigation Non‐antibacterial irrigation | ‐ | 53/131 participants "distributed evenly across the groups" | ‐ | ‐ | ‐ | ‐ | No group data |
| Viney 2012 Clean‐contaminated Caeasarean section | 236 NR | Saline irrigation No irrigation | ‐ | ‐ | ‐ | ‐ | ‐ | ‐ | Median discharge day: 3 in both groups |
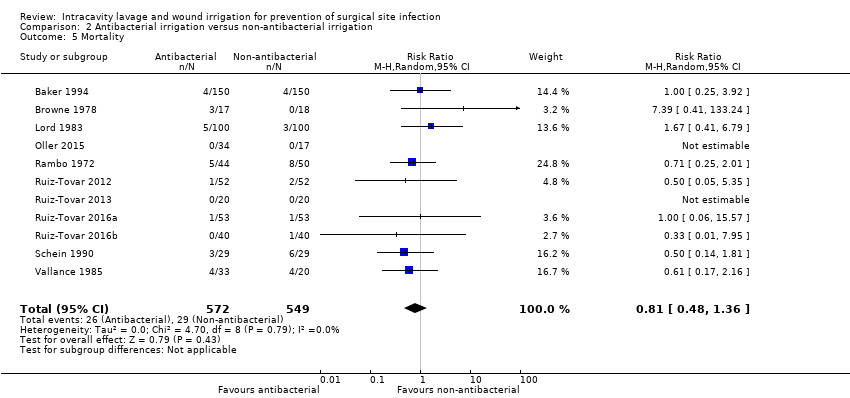
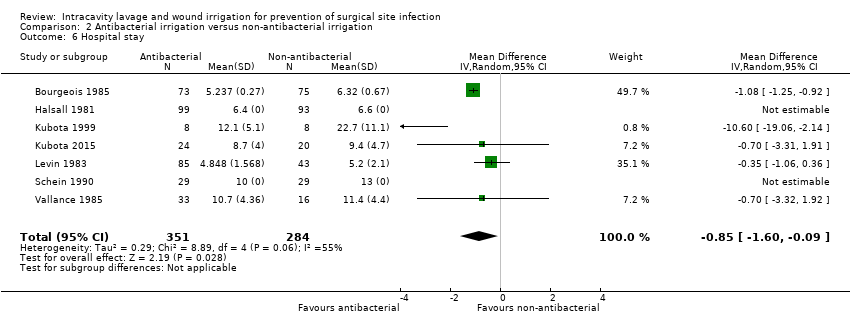
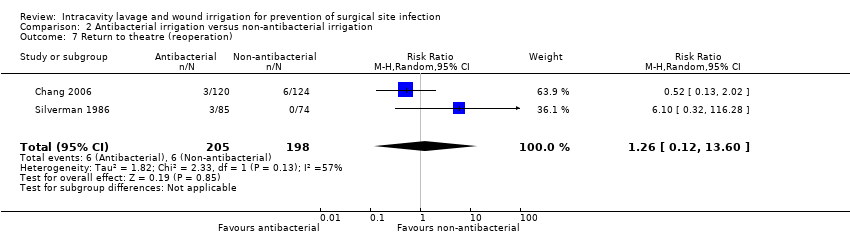
| Antibacterial irrigation vs non‐antibacterial irrigation |
| Al‐Shehri 1994 Mixed Appendicits | 254 1 month | Antibiotic Saline | ‐ | ‐ | ‐ | Abscess RR not estimable 0 events | | | No group data |
| Baker 1994 Clean‐contaminated Colorectal | 330 6 weeks | Antiseptic Saline | RR 1.00 (0.25 to 3.92) | ‐ | ‐ | Abscess RR 2.0 (0.18 to 21.82) | | | No group data |
| Bourgeois 1985 Clean‐contaminated Caeasarean section | 223 6 weeks | Antibiotic irrigation Saline irrigation (No irrigation) | ‐ | ‐ | ‐ | Specific complication only | ‐ | ‐ | Difference in means ‐1.08 (‐1.25 to ‐0.92) |
| Browne 1978 Dirty Peritonitis | 35 NR | Antiseptic irrigation Saline irrigation | RR 7.39 (0.41 to 133.24) | ‐ | ‐ | ‐ | | | ‐ |
| Carl 2000 Clean‐contaminated Caeasarean section | 40 4‐6 weeks | Antibiotic Saline | ‐ | ‐ | ‐ | ‐ | | | ‐ |
| Case 1987 Clean Breast | 54 6 weeks | Antibiotic Saline | ‐ | ‐ | ‐ | ‐ | | | ‐ |
| Chang 2006 Clean Spinal | 244 2 weeks, long‐term follow‐up to 19 months | Antiseptic Saline | ‐ | All 6 participants with SSI received these; all in saline group | 5/6 infections positive for MRSA | ‐ | | | ‐ |
| Cheng 2005 Clean Spinal | 417 2 weeks long ‐term follow ‐up to mean 15.5 months | Antiseptic Saline | ‐ | ‐ | ‐ | ‐ | | | ‐ |
| Dashow 1986 Clean‐contaminated Caeasarean section | 360 NR | 4 antibiotics Saline | ‐ | ‐ | ‐ | Abscess RR not estimable 0 events | | | ‐ |
| Greig 1987 Mixed Colorectal | 129 1 month | Antibiotic Saline | No secondary outcomes were reported |
| Halsall 1981 Mixed Appendicitis | 192 4 weeks | Antiseptic Saline | ‐ | ‐ | ‐ | ‐ | | | Difference in means not estimable (6.4 vs 6.6) |
| Kokavec 2008 Clean Orthopaedic | 162 mean 7‐8 months (range 2‐14 months) (primary outcome) | Antiseptic Saline | No secondary outcomes were reported | | ‐ |
| Kubota 1999 Dirty Perforated appendicitis | 16 NR | Antiseptic Saline | ‐ | ‐ | ‐ | Abscess RR 0.33 (0.02 to 7.14) | | | Difference in means ‐10.60 (‐19.06 to ‐2.14) |
| Kubota 2015 Dirty Perforated appendicitis | 44 30 days | Antiseptic Saline | ‐ | ‐ | ‐ | Abscess RR 0.83 (0.06 to 12.49) | | | Difference in means ‐0.70 (‐3.31 to 1.91) |
| Levin 1983 Clean‐contaminated Caeasarean section | 128 8 weeks | Antibiotic Saline | ‐ | ‐ | ‐ | Specific complication only | | | Difference in means ‐0.35 (‐1.06 to 0.36) |
| Lord 1983 Mixed Gastrointestinal/colorectal | 200 NR | Antibiotic Saline | RR 1.67 (0.41 to 6.79) | ‐ | Specific organisms | Specific complication only | | | ‐ |
| Magann 1993 Clean‐contaminated Caeasarean section | 100 NR | Antibiotic Saline | ‐ | ‐ | ‐ | Specific complication only | | | ‐ |
| Marti 1979 Contaminated Appendicitis | 162 4 days; longer follow‐up unclear | Antibiotic Saline | ‐ | ‐ | ‐ | Specific complication only | | | ‐ |
| Mirsharifi 2008 Clean‐contaminated Cholecystectomy | 102 6 weeks | Antibiotic Saline | No secondary outcomes were reported |
| Moylan 1968 Clean‐contaminated Abdominal | 260 Until discharge | Antibiotic Saline | ‐ | ‐ | Kanamycin resistance Kanamycin: 12/12 Saline: "over half" of 23 | Specific complication only | | | ‐ |
| Neeff 2016 Clean‐contaminated Colorectal | 197 NR | Antiseptic Saline | No secondary outcomes were reported |
| Oestreicher 1989 Mixed General surgery | 540 NR | Antiseptic Saline | No secondary outcomes were reported | | ‐ |
| Oleson 1980 Dirty Perforated appendicitis | 33 Mean 8 days (5‐16 | Antibiotic irrigation Saline irrigation No irrigation | ‐ | ‐ | ‐ | Abscess RR not estimable 0 events | | | Medians 13 (9‐20 13 (10‐22) |
| Oller 2015 Clean Breast | 51 NR | Antibiotic 1/ Antibiotic 2 Saline | RR not estimable, 0 events | ‐ | ‐ | ‐ | | | Medians 3 (1‐3) 3 (1‐3) |
| Rambo 1972 Dirty Peritonitis | 94 NR | Antibiotic Saline | RR 0.71 (0.25 to 2.01) | ‐ | Specific organisms | Abscess grouped with another event ‐ not estimable | | | ‐ |
| Ruiz‐Tovar 2011 Clean‐contaminated Colorectal | 128 NR | Antibiotic Saline | No secondary outcomes were reported |
| Ruiz‐Tovar 2012 Clean‐contaminated Colorectal | 108 30 days | Antibiotic Saline | RR 0.50 (0.05 to 5.35) | ‐ | ‐ | Abscess RR 0.14 (0.01 to 2.65) | | | Medians 6 (5‐32) 6.5 (5‐14) |
| Ruiz‐Tovar 2013 Clean Breast | 40 2 weeks | Antibiotic Saline | RR not estimable, 0 events | ‐ | ‐ | Overall RR not estimable 0 events | | | Medians 3 (1‐3) 3 (1‐3) |
| Ruiz‐Tovar 2016a Clean‐contaminated Colorectal | 106 30 days | Antibiotic Saline | RR 1.00 (0.06 to 15.57) | ‐ | ‐ | Specific complication only | | | Medians 6.5 (5‐14) 6 (5‐32) |
| Ruiz‐Tovar 2016b Clean‐contaminated Bariatric surgery | 80 30 days | Antibiotic Saline | RR 0.33 (0.01 to 7.95) | ‐ | ‐ | Overall RR 0.50 (0.05 to 5.30) | | | ‐ |
| Schein 1990 Dirty Abdominal infection | 87 2 weeks | Antibiotic Saline | RR 0.50 (0.14 to 1.81) | ‐ | ‐ | Overall RR 0.56 (0.21 to 1.46) Abscess RR 0.33 (0.01 to 7.86) | | | Difference in means not estimable 10 vs 13 |
| Silverman 1986 Mixed Gastrointestinal/colorectal | 159 6 weeks | Antibiotic Saline | ‐ | ‐ | ‐ | Abscess RR 0.96 (0.43 to 2.13) Specific additional complication | RR 6.10 (0.32 to 116.28) | | ‐ |
| Sindelar 1979 Mixed General Surgery | 500 12 weeks | Antiseptic Saline | No secondary outcomes were reported |
| Takesue 2011 Clean‐contaminated Colorectal | 400 30 days (total 3 months) | Antiseptic Saline | ‐ | ‐ | MRSA 4/14 vs 8/24 MSSA 0/14 vs 3/24 | ‐ | | | ‐ |
| Tighe 1982 Contaminated Appendix | 131 NR | Antiseptic Non‐antibacterial (No irrigation) | ‐ | 53/131 participants "distributed evenly across the groups" | ‐ | ‐ | ‐ | ‐ | No group data |
| Vallance 1985 Dirty Peritonitis | 53 1 month | Antiseptic Saline | RR 0.61 (0.17 to 2.16) | ‐ | ‐ | ‐ | | | Difference in means ‐0.70 (‐3.32 to 1.92) |
| Comparisons of two different agents in the same class |
| Brown 2007 Clean‐contaminated Uterine | 449 28‐56 days | 2 non‐antibacterials Icodextrin Ringer's solution | RR not estimable ‐ 0 events | ‐ | ‐ | Total: RR 0.99 (0.96 to 1.02) Treatment‐related RR 1.42 (0.98 to 2.05) Serious RR 1.20 (0.80 to 1.78) Serious treatment‐related RR 0.71 (0.29 to 1.73) | ‐ | ‐ | ‐ |
| Dashow 1986 Clean‐contaminated Caeasarean section | 360 NR | 4 antibiotics (Saline) Cephapirin Cefamandole Moxalactam Ampicillin | ‐ | ‐ | ‐ | Abscess: no effect estimate calculable ‐ 0 events Other specific events | ‐ | ‐ | ‐ |
| Levin 1983 Clean‐contaminated Caeasarean section | 128 8 weeks | 2 antibiotics (Saline) Cephapirin Cefoxitin | ‐ | ‐ | ‐ | Specific event data only | ‐ | ‐ | Difference in means 0.10 (‐0.78 to 0.58) |
| Marti 1979 Contaminated Appendicitis | 162 4 days; longer follow‐up unclear | 2 antibiotics (Saline) Epicillin Lincomycin | ‐ | ‐ | ‐ | 1 abscess in antibiotic groups; no group data | ‐ | ‐ | ‐ |
| Mohd 2010 Clean Cardiac | 190 6 weeks | 2 antiseptics Povidone iodine Dermacyn | 4 deaths but no group data; group data for composite outcome with reopening of chest | ‐ | ‐ | ‐ | RR 8.80 (0.48 to 161.11) | ‐ | ‐ |
| Oller 2015 Clean Breast | 51 NR | 2 antibiotics Clindamycin Gentamicin | RR not estimable, 0 events | ‐ | ‐ | ‐ | ‐ | ‐ | Median 3 (1‐3) in each group |
| Peterson 1990 Clean‐contaminated Caeasarean section | 207 113 in relevant groups 2 weeks + (primary outcome) | 2 antibiotics Cefazolin Cefamandole | No secondary outcomes were reported | | |
| Shimizu 2011 Clean Brain | 20 10 days | 2 non‐antibacterials Saline Artificial CSF | ‐ | ‐ | ‐ | 2 participants in each group, included MRI data. RR not calculated | ‐ | ‐‐ | ‐ |
| Trew 2011 Clean‐contaminated Uterine | 498 4‐16 weeks | 2 non‐antibacterials Icodextrin Ringer's solution | RR not estimable ‐ 0 events | ‐ | | Total: RR 0.95 (0.73 to 1.24) Treatment‐related RR 1.16 (0.60 to 2.23) | ‐ | ‐ | ‐ |
| Vallance 1985 Dirty Peritonitis | 53 1 month | 2 antiseptics (Saline) Povidone iodine Chlorhexidine | RR 0.45 (0.05 to 3.90) within 4 days, no group data for later events | ‐ | ‐ | ‐ | ‐ | ‐ | Difference in means 3.30 (0.53 to 3.90) |
| Comparison of pulsatile versus standard irrigationdelivery | |
| Hargrove 2006 Clean Orthopaedic | 356 30 days or discharge | Pulsatile saline Standard saline | No group data | ‐ | No group data "half" SSI positive for MRSA | ‐ | ‐ | ‐ | ‐ |
| Nikfarjam 2014 Clean‐contaminated Abdominal | 137 1 month | Pulsatile saline Standard saline | ‐ | No group data: 14/16 SSI treated | Qualitative data on organisms isolated | Complications, not wound infections RR 1.31 (0.87 to 1.97) | RR 0.56 (0.14 to 2.26) | RR 1.41 (0.53 to 3.73) | Median 9 (5 ‐45) 9 (4‐71) |