Paracetamol para el dolor lumbar
Información
- DOI:
- https://doi.org/10.1002/14651858.CD012230Copiar DOI

- Base de datos:
-
- Cochrane Database of Systematic Reviews
- Versión publicada:
-
- 06 junio 2016see what's new
- Tipo:
-
- Intervention
- Etapa:
-
- Review
- Grupo Editorial Cochrane:
-
Grupo Cochrane de Espalda y cuello
- Copyright:
-
- Copyright © 2019 The Cochrane Collaboration. Published by John Wiley & Sons, Ltd.
Cifras del artículo
Altmetric:
Citado por:
Autores
Contributions of authors
Conception, design, data collection, analysis, and drafting of the protocol and previous review: Gustavo C Machado, Manuela L Ferreira, Marina B Pinheiro, and Christopher G Maher.
Update and adaptation for Cochrane review: Bruno T Saragiotto, Christina Abdel Shaheed, and Christopher G Maher.
Collection and assembly of data for the Cochrane review: Bruno T Saragiotto, Christina Abdel Shaheed, Marina B Pinheiro, and Gustavo C Machado.
Critical revision of the updated review for important intellectual content: Gustavo C Machado, Manuela L Ferreira, Christina Abdel Shaheed, and Christopher G Maher.
Drafting of the review: Bruno T Saragiotto and Christopher G Maher.
Final approval of the review: all authors.
Sources of support
Internal sources
-
None, Other.
External sources
-
None, Other.
Declarations of interest
Bruno T Saragiotto: No relevant interests.
Gustavo C Machado: No relevant interests.
Manuela L Ferreira: No relevant interests.
Marina B Pinheiro: No relevant interests.
Christina Abdel Shaheed: No relevant interests.
Christopher G Maher is an author of the PACE trial, which was included in this review, however he did not participate in the 'Risk of bias' assessment or data extraction in this review. PACE was an investigator‐initiated trial, funded by the National Health and Medical Research Council of Australia and GlaxoSmithKline (a manufacturer of paracetamol).
Acknowledgements
Bruno Tirotti Saragiotto is supported by CNPQ (National Council for Scientific and Technological Development), Brazil. Chris Maher is supported by National Health and Medical Research Council of Australia. Gustavo Machado and Marina Pinheiro each hold an International Postgraduate Research Scholarship/Postgraduate Award from the Australian Government. Manuela Ferreira holds a Sydney Medical Foundation Fellowship.
Version history
| Published | Title | Stage | Authors | Version |
| 2016 Jun 06 | Paracetamol for low back pain | Review | Bruno T Saragiotto, Gustavo C Machado, Manuela L Ferreira, Marina B Pinheiro, Christina Abdel Shaheed, Christopher G Maher | |
Differences between protocol and review
This is an update of a review published in the BMJ (Machado 2015). The study protocol was previously registered on PROSPERO (registration number CRD42013006367). We followed the new recommendations of the Cochrane Back and Neck Group in this review (Furlan 2015), which was not stated in the protocol or previous version of this review as it was not yet published. However, there were no substantial changes from the protocol or the previous version of this review.
Keywords
MeSH
Medical Subject Headings (MeSH) Keywords
Medical Subject Headings Check Words
Humans; Middle Aged;
PICO

Study flow diagram.
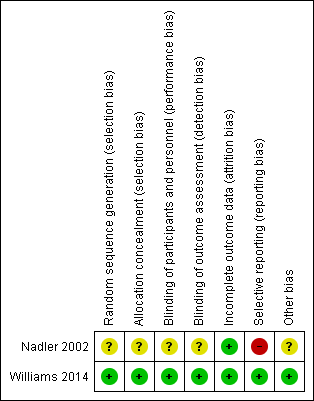
Risk of bias summary: review authors' judgements about each risk of bias item for each included study.

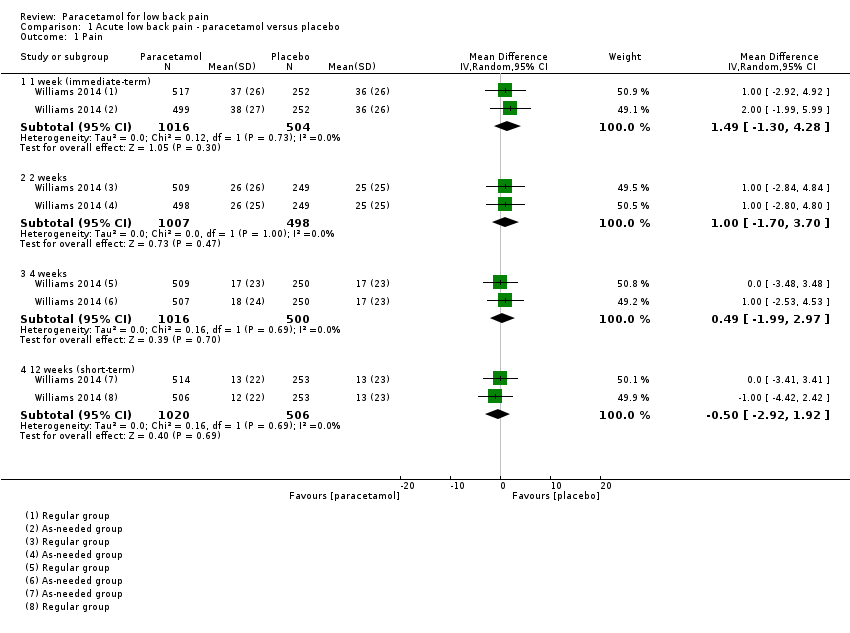
Forest plot of comparison: 1 Acute low back pain ‐ paracetamol versus placebo, outcome: 1.1 Pain.
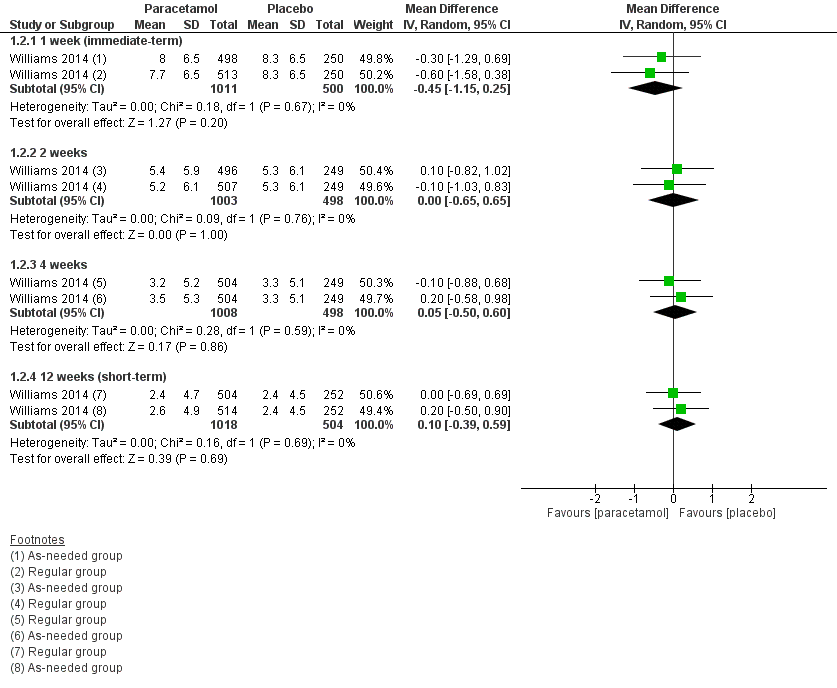
Forest plot of comparison: 1 Acute low back pain ‐ paracetamol versus placebo, outcome: 1.2 Disability
Comparison 1 Acute low back pain ‐ paracetamol versus placebo, Outcome 1 Pain.

Comparison 1 Acute low back pain ‐ paracetamol versus placebo, Outcome 2 Disability.

Comparison 1 Acute low back pain ‐ paracetamol versus placebo, Outcome 3 Quality of life, physical component.
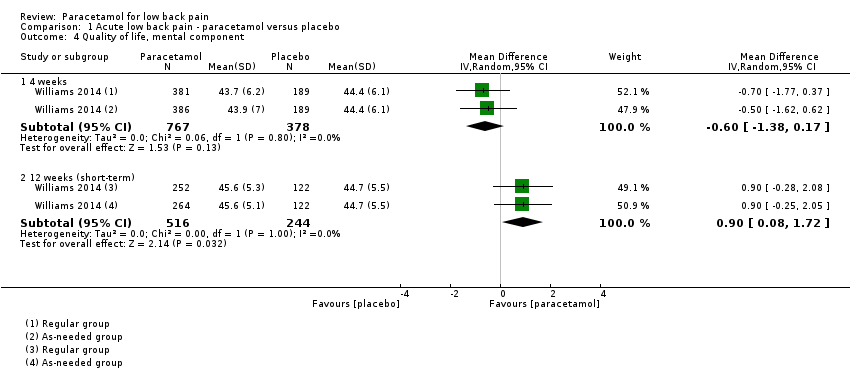
Comparison 1 Acute low back pain ‐ paracetamol versus placebo, Outcome 4 Quality of life, mental component.

Comparison 1 Acute low back pain ‐ paracetamol versus placebo, Outcome 5 Function.

Comparison 1 Acute low back pain ‐ paracetamol versus placebo, Outcome 6 Adverse events.

Comparison 1 Acute low back pain ‐ paracetamol versus placebo, Outcome 7 Global impression of recovery.

Comparison 1 Acute low back pain ‐ paracetamol versus placebo, Outcome 8 Poor sleep quality.

Comparison 1 Acute low back pain ‐ paracetamol versus placebo, Outcome 9 Patient adherence.

Comparison 1 Acute low back pain ‐ paracetamol versus placebo, Outcome 10 Use of rescue medication.
| Paracetamol compared with placebo for acute low back pain | ||||||
| Patient or population: People with acute low back pain Settings: Primary care Intervention: Paracetamol Comparison: Placebo | ||||||
| Outcomes | Illustrative comparative risks* (95% CI) | Relative effect | No of participants | Quality of the evidence | Comments | |
| Assumed risk | Corresponding risk | |||||
| Placebo | Paracetamol | |||||
| Pain 1 week (immediate term) (NRS 0 to 100) | The mean pain in the control group was 36 points | The mean pain in the intervention group was (1.30 lower to 4.28 higher) | ‐ | 1520 | ⊕⊕⊕⊕ | The difference is not statistically |
| Pain 12 weeks (short term) (NRS 0 to 100) | The mean pain in the control group was 13 points | The mean pain in the intervention group was (2.92 lower to 1.92 higher) | ‐ | 1526 | ⊕⊕⊕⊕ | The difference is not statistically |
| Disability 1 week (immediate term) (RMDQ 0 to 24) | The mean disability in the control group was 8.3 points | The mean disability in the intervention group was (1.15 lower to 0.25 higher) | ‐ | 1511 | ⊕⊕⊕⊕ | The difference is not statistically |
| Disability 12 weeks (short term) (RMDQ 0 to 24) | The mean disability in the control group was 2.4 points | The mean disability in the intervention group was (0.39 lower to 0.59 higher) | ‐ | 1522 | ⊕⊕⊕⊕ | The difference is not statistically |
| Any adverse events Up to 12 weeks' follow‐up | 107 per 1000 | 115 per 1000 | RR 1.07 (0.86 to 1.33) | 1624 | ⊕⊕⊕⊕ | The difference is not statistically |
| Serious adverse events Up to 12 weeks' follow‐up | 90 per 1000 | 81 per 1000 | RR 0.90 (0.30 to 2.67) | 1643 | ⊕⊕⊕ | The difference is not statistically |
| *The corresponding risk (and its 95% confidence interval) is based on the assumed risk in the comparison group and the relative effect of the intervention (and its 95% CI). | ||||||
| GRADE Working Group grades of evidence | ||||||
| 1. Downgraded for imprecision. | ||||||
| Outcome or subgroup title | No. of studies | No. of participants | Statistical method | Effect size |
| 1 Pain Show forest plot | 1 | Mean Difference (IV, Random, 95% CI) | Subtotals only | |
| 1.1 1 week (immediate‐term) | 1 | 1520 | Mean Difference (IV, Random, 95% CI) | 1.49 [‐1.30, 4.28] |
| 1.2 2 weeks | 1 | 1505 | Mean Difference (IV, Random, 95% CI) | 1.0 [‐1.70, 3.70] |
| 1.3 4 weeks | 1 | 1516 | Mean Difference (IV, Random, 95% CI) | 0.49 [‐1.99, 2.97] |
| 1.4 12 weeks (short‐term) | 1 | 1526 | Mean Difference (IV, Random, 95% CI) | ‐0.50 [‐2.92, 1.92] |
| 2 Disability Show forest plot | 1 | Mean Difference (IV, Random, 95% CI) | Subtotals only | |
| 2.1 1 week (immediate‐term) | 1 | 1511 | Mean Difference (IV, Random, 95% CI) | ‐0.45 [‐1.15, 0.25] |
| 2.2 2 weeks | 1 | 1501 | Mean Difference (IV, Random, 95% CI) | 0.00 [‐0.65, 0.65] |
| 2.3 4 weeks | 1 | 1506 | Mean Difference (IV, Random, 95% CI) | 0.05 [‐0.50, 0.60] |
| 2.4 12 weeks (short‐term) | 1 | 1522 | Mean Difference (IV, Random, 95% CI) | 0.10 [‐0.39, 0.59] |
| 3 Quality of life, physical component Show forest plot | 1 | Mean Difference (IV, Random, 95% CI) | Subtotals only | |
| 3.1 4 weeks | 1 | 1145 | Mean Difference (IV, Random, 95% CI) | ‐0.79 [‐1.94, 0.36] |
| 3.2 12 weeks (short‐term) | 1 | 760 | Mean Difference (IV, Random, 95% CI) | 0.41 [‐0.91, 1.72] |
| 4 Quality of life, mental component Show forest plot | 1 | Mean Difference (IV, Random, 95% CI) | Subtotals only | |
| 4.1 4 weeks | 1 | 1145 | Mean Difference (IV, Random, 95% CI) | ‐0.60 [‐1.38, 0.17] |
| 4.2 12 weeks (short‐term) | 1 | 760 | Mean Difference (IV, Random, 95% CI) | 0.90 [0.08, 1.72] |
| 5 Function Show forest plot | 1 | Mean Difference (IV, Random, 95% CI) | Subtotals only | |
| 5.1 1 week (immediate‐term) | 1 | 1511 | Mean Difference (IV, Random, 95% CI) | ‐0.05 [‐0.32, 0.22] |
| 5.2 2 weeks | 1 | 1499 | Mean Difference (IV, Random, 95% CI) | ‐0.15 [‐0.42, 0.12] |
| 5.3 4 weeks | 1 | 1502 | Mean Difference (IV, Random, 95% CI) | ‐0.05 [‐0.31, 0.21] |
| 5.4 12 weeks (short‐term) | 1 | 1518 | Mean Difference (IV, Random, 95% CI) | 0.0 [‐0.23, 0.23] |
| 6 Adverse events Show forest plot | 1 | Risk Ratio (M‐H, Random, 95% CI) | Subtotals only | |
| 6.1 Any adverse events (up to 12 weeks) | 1 | 1624 | Risk Ratio (M‐H, Random, 95% CI) | 1.07 [0.86, 1.33] |
| 6.2 Serious adverse events (up to 12 weeks) | 1 | 1643 | Risk Ratio (M‐H, Random, 95% CI) | 0.90 [0.30, 2.67] |
| 7 Global impression of recovery Show forest plot | 1 | Mean Difference (IV, Random, 95% CI) | Subtotals only | |
| 7.1 1 week (immediate‐term) | 1 | 1515 | Mean Difference (IV, Random, 95% CI) | ‐0.05 [‐0.28, 0.18] |
| 7.2 2 weeks | 1 | 1501 | Mean Difference (IV, Random, 95% CI) | ‐0.05 [‐0.28, 0.18] |
| 7.3 4 weeks | 1 | 1511 | Mean Difference (IV, Random, 95% CI) | ‐0.10 [‐0.33, 0.13] |
| 7.4 12 weeks (short‐term) | 1 | 1523 | Mean Difference (IV, Random, 95% CI) | ‐0.05 [‐0.26, 0.17] |
| 8 Poor sleep quality Show forest plot | 1 | Risk Ratio (M‐H, Random, 95% CI) | Subtotals only | |
| 8.1 1 week (immediate‐term) | 1 | 1511 | Risk Ratio (M‐H, Random, 95% CI) | 1.05 [0.87, 1.25] |
| 8.2 2 weeks | 1 | 1500 | Risk Ratio (M‐H, Random, 95% CI) | 1.01 [0.80, 1.28] |
| 8.3 4 weeks | 1 | 1510 | Risk Ratio (M‐H, Random, 95% CI) | 1.11 [0.82, 1.52] |
| 8.4 12 weeks (short‐term) | 1 | 1523 | Risk Ratio (M‐H, Random, 95% CI) | 1.26 [0.90, 1.76] |
| 9 Patient adherence Show forest plot | 1 | Risk Ratio (M‐H, Random, 95% CI) | Subtotals only | |
| 9.1 4 weeks | 1 | 1311 | Risk Ratio (M‐H, Random, 95% CI) | 1.08 [0.96, 1.22] |
| 10 Use of rescue medication Show forest plot | 1 | Risk Ratio (M‐H, Random, 95% CI) | Subtotals only | |
| 10.1 Up to 2 weeks | 1 | 1548 | Risk Ratio (M‐H, Random, 95% CI) | 0.50 [0.16, 1.55] |