| 1 Pain Show forest plot | 1 | | Mean Difference (IV, Random, 95% CI) | Subtotals only |
|
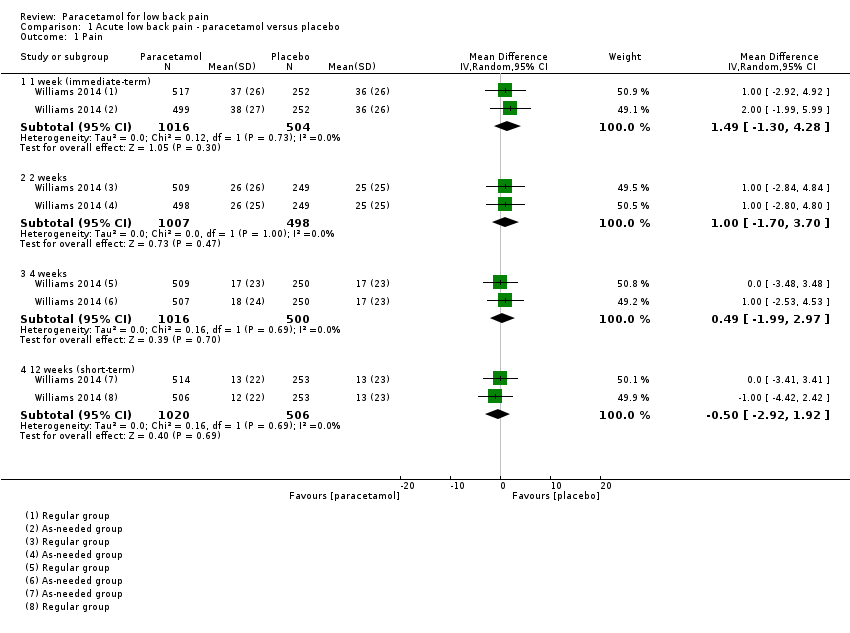
| 1.1 1 week (immediate‐term) | 1 | 1520 | Mean Difference (IV, Random, 95% CI) | 1.49 [‐1.30, 4.28] |
| 1.2 2 weeks | 1 | 1505 | Mean Difference (IV, Random, 95% CI) | 1.0 [‐1.70, 3.70] |
| 1.3 4 weeks | 1 | 1516 | Mean Difference (IV, Random, 95% CI) | 0.49 [‐1.99, 2.97] |
| 1.4 12 weeks (short‐term) | 1 | 1526 | Mean Difference (IV, Random, 95% CI) | ‐0.50 [‐2.92, 1.92] |
| 2 Disability Show forest plot | 1 | | Mean Difference (IV, Random, 95% CI) | Subtotals only |
|
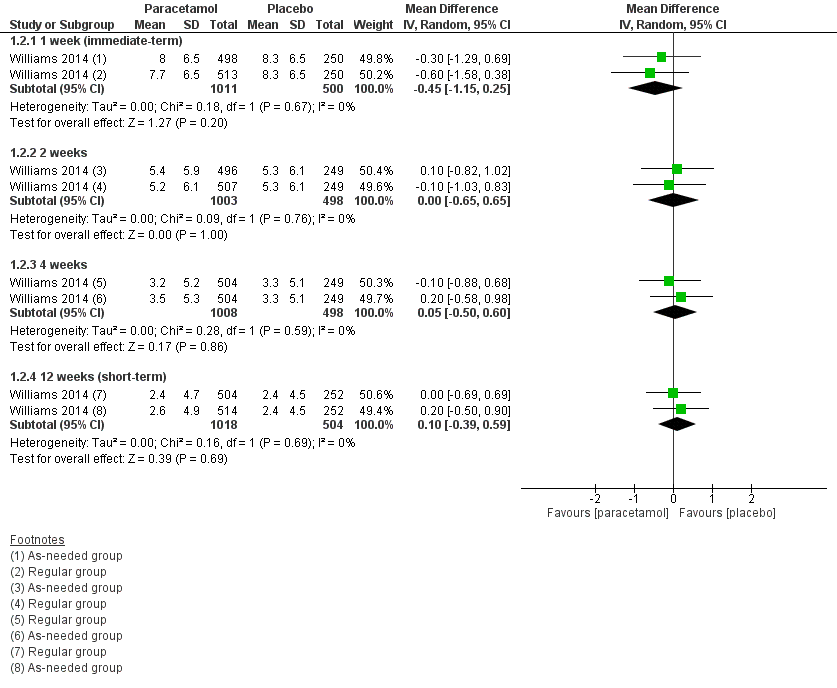
| 2.1 1 week (immediate‐term) | 1 | 1511 | Mean Difference (IV, Random, 95% CI) | ‐0.45 [‐1.15, 0.25] |
| 2.2 2 weeks | 1 | 1501 | Mean Difference (IV, Random, 95% CI) | 0.00 [‐0.65, 0.65] |
| 2.3 4 weeks | 1 | 1506 | Mean Difference (IV, Random, 95% CI) | 0.05 [‐0.50, 0.60] |
| 2.4 12 weeks (short‐term) | 1 | 1522 | Mean Difference (IV, Random, 95% CI) | 0.10 [‐0.39, 0.59] |
| 3 Quality of life, physical component Show forest plot | 1 | | Mean Difference (IV, Random, 95% CI) | Subtotals only |
|
| 3.1 4 weeks | 1 | 1145 | Mean Difference (IV, Random, 95% CI) | ‐0.79 [‐1.94, 0.36] |
| 3.2 12 weeks (short‐term) | 1 | 760 | Mean Difference (IV, Random, 95% CI) | 0.41 [‐0.91, 1.72] |
| 4 Quality of life, mental component Show forest plot | 1 | | Mean Difference (IV, Random, 95% CI) | Subtotals only |
|
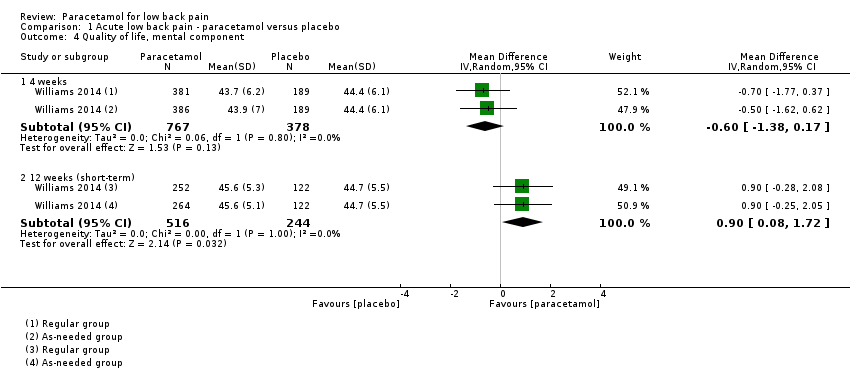
| 4.1 4 weeks | 1 | 1145 | Mean Difference (IV, Random, 95% CI) | ‐0.60 [‐1.38, 0.17] |
| 4.2 12 weeks (short‐term) | 1 | 760 | Mean Difference (IV, Random, 95% CI) | 0.90 [0.08, 1.72] |
| 5 Function Show forest plot | 1 | | Mean Difference (IV, Random, 95% CI) | Subtotals only |
|
| 5.1 1 week (immediate‐term) | 1 | 1511 | Mean Difference (IV, Random, 95% CI) | ‐0.05 [‐0.32, 0.22] |
| 5.2 2 weeks | 1 | 1499 | Mean Difference (IV, Random, 95% CI) | ‐0.15 [‐0.42, 0.12] |
| 5.3 4 weeks | 1 | 1502 | Mean Difference (IV, Random, 95% CI) | ‐0.05 [‐0.31, 0.21] |
| 5.4 12 weeks (short‐term) | 1 | 1518 | Mean Difference (IV, Random, 95% CI) | 0.0 [‐0.23, 0.23] |
| 6 Adverse events Show forest plot | 1 | | Risk Ratio (M‐H, Random, 95% CI) | Subtotals only |
|
| 6.1 Any adverse events (up to 12 weeks) | 1 | 1624 | Risk Ratio (M‐H, Random, 95% CI) | 1.07 [0.86, 1.33] |
| 6.2 Serious adverse events (up to 12 weeks) | 1 | 1643 | Risk Ratio (M‐H, Random, 95% CI) | 0.90 [0.30, 2.67] |
| 7 Global impression of recovery Show forest plot | 1 | | Mean Difference (IV, Random, 95% CI) | Subtotals only |
|
| 7.1 1 week (immediate‐term) | 1 | 1515 | Mean Difference (IV, Random, 95% CI) | ‐0.05 [‐0.28, 0.18] |
| 7.2 2 weeks | 1 | 1501 | Mean Difference (IV, Random, 95% CI) | ‐0.05 [‐0.28, 0.18] |
| 7.3 4 weeks | 1 | 1511 | Mean Difference (IV, Random, 95% CI) | ‐0.10 [‐0.33, 0.13] |
| 7.4 12 weeks (short‐term) | 1 | 1523 | Mean Difference (IV, Random, 95% CI) | ‐0.05 [‐0.26, 0.17] |
| 8 Poor sleep quality Show forest plot | 1 | | Risk Ratio (M‐H, Random, 95% CI) | Subtotals only |
|
| 8.1 1 week (immediate‐term) | 1 | 1511 | Risk Ratio (M‐H, Random, 95% CI) | 1.05 [0.87, 1.25] |
| 8.2 2 weeks | 1 | 1500 | Risk Ratio (M‐H, Random, 95% CI) | 1.01 [0.80, 1.28] |
| 8.3 4 weeks | 1 | 1510 | Risk Ratio (M‐H, Random, 95% CI) | 1.11 [0.82, 1.52] |
| 8.4 12 weeks (short‐term) | 1 | 1523 | Risk Ratio (M‐H, Random, 95% CI) | 1.26 [0.90, 1.76] |
| 9 Patient adherence Show forest plot | 1 | | Risk Ratio (M‐H, Random, 95% CI) | Subtotals only |
|
| 9.1 4 weeks | 1 | 1311 | Risk Ratio (M‐H, Random, 95% CI) | 1.08 [0.96, 1.22] |
| 10 Use of rescue medication Show forest plot | 1 | | Risk Ratio (M‐H, Random, 95% CI) | Subtotals only |
|
| 10.1 Up to 2 weeks | 1 | 1548 | Risk Ratio (M‐H, Random, 95% CI) | 0.50 [0.16, 1.55] |