Ghrelin untuk pengurusan cachexia yang dikaitkan dengan kanser
Abstract
Background
Cancer sufferers are amongst the most malnourished of all the patient groups. Studies have shown that ghrelin, a gut hormone can be a potential therapeutic agent for cachexia (wasting syndrome) associated with cancer. A variety of mechanisms of action of ghrelin in people with cancer cachexia have been proposed. However, safety and efficacy of ghrelin for cancer‐associated cachexia have not been systematically reviewed. The aim of this review was to assess whether ghrelin is associated with better food intake, body composition and survival than other options for adults with cancer cachexia.
Objectives
To assess the efficacy and safety of ghrelin in improving food intake, body composition and survival in people with cachexia associated with cancer.
Search methods
We searched CENTRAL, MEDLINE and Embase without language restrictions up to July 2017. We also searched for ongoing studies in trials registers, performed handsearching, checked bibliographic references of relevant articles and contacted authors and experts in the field to seek potentially relevant research. We applied no restrictions on language, date, or publication status.
Selection criteria
We included randomised controlled (parallel‐group or cross‐over) trials comparing ghrelin (any formulation or route of administration) with placebo or an active comparator in adults (aged 18 years and over) who met any of the international criteria for cancer cachexia.
Data collection and analysis
Two review authors independently assessed studies for eligibility. Two review authors then extracted data and assessed the risk of bias for individual studies using standard Cochrane methodology. For dichotomous variables, we planned to calculate risk ratio with 95% confidence intervals (CI) and for continuous data, we planned to calculate mean differences (MD) with 95% CI. We assessed the evidence using GRADE and created 'Summary of findings' tables.
Main results
We screened 926 individual references and identified three studies that satisfied the inclusion criteria. Fifty‐nine participants (37 men and 22 women) aged between 54 and 78 years were randomised initially, 47 participants completed the treatment. One study had a parallel design and two had a cross‐over design. The studies included people with a variety of cancers and also differed in the dosage, route of administration, frequency and duration of treatment.
One trial, which compared ghrelin with placebo, found that ghrelin improved food intake (very low‐quality evidence) and had no adverse events (very low‐quality evidence). Due to unavailability of data we were unable to report on comparisons for ghrelin versus no treatment or alternative experimental treatment modalities, or ghrelin in combination with other treatments or ghrelin analogues/ghrelin mimetics/ghrelin potentiators. Two studies compared a higher dose of ghrelin with a lower dose of ghrelin, however due to differences in study designs and great diversity in the treatment provided we did not pool the results. In both trials, food intake did not differ between participants on higher‐dose and lower‐dose ghrelin. None of the included studies assessed data on body weight. One study reported higher adverse events with a higher dose as compared to a lower dose of ghrelin.
All studies were at high risk of attrition bias and bias for size of the study. Risk of bias in other domains was unclear or low.
We rated the overall quality of the evidence for primary outcomes (food intake, body weight, adverse events) as very low. We downgraded the quality of the evidence due to lack of data, high or unclear risk of bias of the studies and small study size.
Authors' conclusions
There is insufficient evidence to be able to support or refute the use of ghrelin in people with cancer cachexia. Adequately powered randomised controlled trials focusing on evaluation of safety and efficacy of ghrelin in people with cancer cachexia is warranted.
PICO
Ringkasan bahasa mudah
Ghrelin, hormon lapar untuk pengurusan pesakit kanser dengan kehilangan selera makan dan kesusutan berat
Kesimpulannya
Tiada bukti yang baik untuk menyokong atau menolak cadangan bahawa ghrelin berguna dalam pengurusan pesakit kanser dengan kehilangan selera makan dan penurunan berat. Tiadacukup bukti bagi mengesyorkannya untuk amalan klinikal.
Latar belakang
Enam puluh hingga lapan puluh peratus pesakit kanser mengalami kehilangan selera makan dan kesusutan berat, yang seterusnya dikaitkan dengan penurunan jangka hayat dan kualiti hidup. Ghrelin, hormon lapar dirembeskan oleh perut dan organ lain‐lain. Kajian telah menunjukkan ghrelin boleh diguna dalam rawatan untuk kehilangan selera makan dan kesusutan berat dalam kalangan pesakit kanser. Walau bagaimanapun, keberkesanan dan keselamatan ghrelin dalam kalangan mereka belum dinilai. Dalam ulasan ini kami ingin untuk menilai semua bukti mengenai keberkesanan dan keselamatan ghrelin dalam meningkatkan selera makan dan berat badan dalam kalangan pesakit kanser dengan kehilangan selera makan dan kesusutan berat.
Tarikh carian
Bukti adalah terkini sehingga 20 Julai 2017.
Ciri‐ciri kajian
Kami mendapati tiga kajian yang merekrut sejumlah 59 pesakit kanser (37 lelaki dan 22 wanita) berumur antara 54 hingga 78 tahun. Empat puluh tujuh pesakit kanser telah melengkapkan rawatan. Kajian‐kajian adalah berbeza dalam reka bentuk dan memasukkan orang‐orang dengan pelbagai jenis kanser. Kajian‐kajian juga berbeza dalam dos, laluan suntikan, kekerapan dan tempoh rawatan. Satu kajian membandingkan ghrelin dengan plasebo manakala dua kajian membandingkan dos ghrelin yang berlainan (dos lebih tinggi dengan dos lebih rendah). Hasil yang diminati untuk pesakit kanser dengan kehilangan selera makan dan kesusutan berat, seperti penambahbaikan pengambilan makanan dan berat badan, tidak dilaporkan secukupnya.
Kesemua tiga kajian yang dimasukkan dibiaya oleh agensi kerajaan. Satu kajian menerima geran tambahan daripada syarikat farmaseutikal.
Keputusan utama
Kami tidak mendapati cukup bukti bahawa penggunaan ghrelin menunjukkan perbezaan dalam pengambilan makanan. Kami mendapati tiada bukti bahawa menggunakan ghrelin sahaja atau dalam kombinasi memberi sebarang perbezaan kepada berat badan. Kami tidak dapat mencapai sebarang kesimpulan mengenai kesan sampingannya. Maklumat yang terhad bermakna kami tidak dapat membuat sebarang kesimpulan.
Kualiti bukti
Kami menilai kualiti bukti dari kajian menggunakan empat tahapt: tinggi, sederhana, rendah, atau sangat rendah. Bukti berkualiti tinggi bermakna kami sangat yakin dengan keputusannya. Kualiti bukti yang sangat rendah bermakna kami sangat tidak pasti tentang keputusannya. Bukti dalam ulasan ini adalah berkualiti sangat rendah.
Authors' conclusions
Summary of findings
| Ghrelin compared to placebo for cachexia associated with cancer | ||||||
| Patient or population: people with cachexia associated with cancer Settings: hospital | ||||||
| Outcomes | Anticipated absolute effects* (95% CI) | Relative effect | № of participants | Quality of the evidence | Comments | |
|---|---|---|---|---|---|---|
| Risk with placebo | Risk with ghrelin | |||||
| Food intake | Not known | Not known | Not known | 7 | ⊕⊝⊝⊝ | The study reported, "31% increase in energy intake with ghrelin infusion" Too few data to be meaningful |
| Body weight | No data | No data | No data | No data | ⊕⊝⊝⊝ | Not reported. No data available. No evidence to support or refute the use of ghrelin in people with cancer cachexia |
| Adverse events | Study population | Not estimable | 7 | ⊕⊝⊝⊝ | The study reported, "No side effects were observed" Too few data and number of events too small to be meaningful | |
| 0 per 1000 | 0 per 1000 | |||||
| *The risk in the intervention group (and its 95% confidence interval) is based on the assumed risk in the comparison group and the relative effect of the intervention (and its 95% CI). | ||||||
| GRADE Working Group grades of evidence | ||||||
| 1Downgraded once for study limitations due to high risk of attrition bias and biases confounded by small size. | ||||||
| Ghrelin compared to alternative experimental treatment modality for cachexia associated with cancer | ||||||
| Patient or population: people with cancer cachexia Settings: hospital | ||||||
| Outcomes | Anticipated absolute effects* (95% CI) | Relative effect | № of participants | Quality of the evidence | Comments | |
|---|---|---|---|---|---|---|
| Risk with alternative experimental treatment modality | Risk with ghrelin | |||||
| Food intake | No data | No data | No data | No data | ⊕⊝⊝⊝ | Not reported. No evidence to support or refute the use of ghrelin in people with cancer cachexia. |
| Body weight | No data | No data | No data | No data | ⊕⊝⊝⊝ | Not reported. No evidence to support or refute the use of ghrelin in people with cancer cachexia. |
| Adverse events | No data | No data | No data | No data | ⊕⊝⊝⊝ | Not reported. No evidence to support or refute the use of ghrelin in people with cancer cachexia. |
| *The risk in the intervention group (and its 95% confidence interval) is based on the assumed risk in the comparison group and the relative effect of the intervention (and its 95% CI). | ||||||
| GRADE Working Group grades of evidence | ||||||
| 1In circumstances where there were no data reported for an outcome, we report the level of evidence as 'very low' with no evidence to support or refute the use of ghrelin in people with cancer cachexia. | ||||||
| Ghrelin in combination with other treatments compared to ghrelin treatment alone for cachexia associated with cancer | ||||||
| Patient or population: people with cancer cachexia Settings: hospital | ||||||
| Outcomes | Anticipated absolute effects* (95% CI) | Relative effect | № of participants | Quality of the evidence | Comments | |
|---|---|---|---|---|---|---|
| Risk with ghrelin treatment alone | Risk with ghrelin in combination with other treatments | |||||
| Food intake | No data | No data | No data | No data | ⊕⊝⊝⊝ | Not reported. No evidence to support or refute the use of ghrelin in people with cancer cachexia. |
| Body weight | No data | No data | No data | No data | ⊕⊝⊝⊝ | Not reported. No evidence to support or refute the use of ghrelin in people with cancer cachexia. |
| Adverse events | No data | No data | No data | No data | ⊕⊝⊝⊝ | Not reported. No evidence to support or refute the use of ghrelin in people with cancer cachexia. |
| *The risk in the intervention group (and its 95% confidence interval) is based on the assumed risk in the comparison group and the relative effect of the intervention (and its 95% CI). | ||||||
| GRADE Working Group grades of evidence | ||||||
| 1In circumstances where there were no data reported for an outcome, we report the level of evidence as 'very low' with no evidence to support or refute the use of ghrelin in people with cancer cachexia. | ||||||
| Higher‐dose ghrelin compared to lower‐dose ghrelin for cachexia associated with cancer | ||||||
| Patient or population: people with cancer cachexia Settings: hospital | ||||||
| Outcomes | Anticipated absolute effects* (95% CI) | Relative effect | № of participants | Quality of the evidence | Comments | |
|---|---|---|---|---|---|---|
| Risk with lower‐dose ghrelin | Risk with higher‐dose ghrelin | |||||
| Food intake | See comment | See comment | N/A | 40 | ⊕⊝⊝⊝ | Too few data to be meaningful Because of the differences in study design and diversity in the treatment provided we did not pool results in a meta‐analysis |
| Body weight | No data | No data | No data | No data | ⊕⊝⊝⊝ | Not reported. No evidence to support or refute the use of ghrelin in people with cancer cachexia. |
| Adverse events | Study population | Not estimable | 40 | ⊕⊝⊝⊝ | Too few data to be meaningful | |
| See comment | See comment | |||||
| *The risk in the intervention group (and its 95% confidence interval) is based on the assumed risk in the comparison group and the relative effect of the intervention (and its 95% CI). | ||||||
| GRADE Working Group grades of evidence | ||||||
| 1Downgraded once for study limitations due to high risk of attrition bias and biases confounded by small size. | ||||||
Background
This review is partly based on suggested wording from Cochrane Pain, Palliative and Supportive Care (PaPaS).
Description of the condition
Cancer and its co‐morbidities like cancer cachexia (muscle wasting) have afflicted humans for centuries and still continue to be a major public health problem that profoundly affects more than 1.6 million people each year (National Cancer Institute 2015). People suffering from cancer are amongst the most malnourished of all the patient groups (Ryan 2016). It has been estimated that cachexia affects 60% to 80% of all advanced cancer patients (Baracos 2011) and more than 30% of patients die due to cachexia (von Haehling 2012). Cancer cachexia is commonly associated with poor quality of life (Fearon 2012; Loumaye 2017; Utech 2012).
Cancer cachexia is defined as "a multifactorial syndrome characterised by an ongoing loss of skeletal muscle mass (with or without loss of fat mass) that cannot be fully reversed by conventional nutritional support and leads to progressive functional impairment" (Fearon 2011). Cachexia syndrome can develop progressively, through stages of pre‐cachexia to cachexia to refractory cachexia (Fearon 2011). The incidence of cancer cachexia varies according to tumor type (Teunissen 2007; Tisdale 2009; Sun 2015). The prevalence of cachexia is highest in people with pancreatic cancer (88.9%), followed by gastric cancer (76.5% to 87%) and oesophageal cancer (52.9%) (Sun 2015; Tisdale 2009). The frequency of weight loss is lowest in patients with breast cancer, sarcomas, non‐Hodgkin's lymphoma and acute nonlymphocytic leukaemia (Teunissen 2007; Tisdale 2009). Although certain tumor types are more commonly associated with cachexia, even with the same tumor type there are variations in the extent to which people exhibit cachexia (Tisdale 2009). Cachexia can be a presenting symptom in a majority of people with advanced cancer, mainly those with hepatic, lung, or bone metastasis and primary cancers of the lung, cervix or head and neck (Mendes 2015). Cancer patients with muscle wasting are less able to tolerate chemotherapy, have poor treatment outcomes, and have shorter survival (Crawford 2015).
Extensive research has been carried out to understand the complex pathophysiology of cachexia associated with cancer (Bennani‐Baiti 2008; Mendes 2015; Ohnuma 2017; Penna 2016; Tisdale 2009). However, precise molecular mechanisms of cancer cachexia still remain poorly characterised (Loumaye 2017). The pathogenesis of cancer anorexia is multifactorial. It is suggested to be the result of tumour‐host interactions (Bennani‐Baiti 2008). Anorexia, anaemia, asthenia, inflammation, altered hormonal homeostasis, energy imbalance, perturbations in proinflammatory cytokines, impaired immunity and several cancer‐related metabolic changes (like negative protein balance and increased lipolysis) leading to significant weight loss have been attributed to the pathogenesis of cancer cachexia (Bennani‐Baiti 2008; Mendes 2015; Penna 2010; Stephens 2008). Therapies for cancer, such as chemotherapy, surgery and radiotherapy, also cause anorexia, muscle atrophy and weight loss (Chen 2015; Garcia 2005; Tisdale 2009). Deregulation of control of energy expenditure and hunger/satiety by the hypothalamus promotes cachexia in cancer patients (Mendes 2015). A discrepancy between anabolic and catabolic pathways mediated by chronic inflammation can cause muscle wasting in people with cancer cachexia (Madeddu 2015a). Depletion of adipose tissue as well as skeletal muscle mass with relative preservation of non‐muscle protein compartment can contribute to weight loss in cancer patients (Tisdale 2009). Studies suggest that the tumour cells secrete certain humoral factors that promote central and peripheral‐mediated cancer cachexia (Stewart 2006; Ohnuma 2017). Cachectic factors (like activin and proteolysis‐inducing factor) secreted by tumour cells decrease the synthesis and increase the breakdown of muscle proteins, and thereby induce sarcopenia (Stewart 2006). Excretion of cytokines and lipid‐mobilising factors may contribute to depletion of adipose tissue (Stewart 2006). Inflammation induced by host‐derived and tumor‐derived factors seems to be vital in the development of cancer cachexia (Loumaye 2017). Tumor cells secrete pro‐inflammatory factors that promote cachexia by signalling anorexia, wasting of muscles and atrophy of adipose tissue (Chen 2016; Johns 2013; Loumaye 2017). Release of inflammatory cytokines like TNF‐alpha (cachexin or cachectin), interferon gamma, interleukin‐6 and angiotensin II also have a role in cancer cachexia (Bennani‐Baiti 2008; Johns 2013; Ohnuma 2017; Tisdale 2009).
As cachexia progresses, wasting of skeletal muscles limits mobility and thereby leads to poor quality of life, which in turn pushes cancer patients towards isolation and depression (Stewart 2006; Watanabe 1996; Windsor 1988). Patients as well as family members, especially caregivers and healthcare professionals often suffer from depression as they try to palliate the symptoms (National Cancer Institute 2015; Reid 2012). Although cancer cachexia is associated with increased mortality and poor quality of life, treatment options for the condition are limited (Penna 2016). It has been proposed that multimodal strategies with anabolic focus ensuring sufficient energy and protein intake, pharmacological treatments, and non‐pharmacological therapies like physical training initiated early in the disease may provide benefit to people with cancer cachexia (Aapro 2014; Anderson 2017; Argilés 2017; Lucia 2012; Madeddu 2015a).
Description of the intervention
As cancer cachexia is associated with complex pathophysiological processes, pharmacologic treatment with potential orexigenic, anabolic and anti‐inflammatory effects should be targeted to counter this condition (Madeddu 2015b). Caloric supplementation or appetite stimulants like megestrol acetate, medroxyprogesterone acetate (MPA), cyproheptadine, marijuana, and corticosteroids such as dexamethasone, prednisolone and methylprednisolone have been used for enhancing appetite in people with cancer (Fearon 2011; Tisdale 2009). However, these interventions have limited efficacy. No definitive pharmacological treatment is available to address the relevant components of the cancer cachexia syndrome (Esposito 2015). Studies in animals and humans have shown that ghrelin, a gut hormone can be a potential therapeutic agent for treatment of cachexia associated with cancer (Chen 2015; Hatanaka 2015; Lundholm 2010; Neary 2004; Strasser 2008; Tsubouchi 2014).
Ghrelin, a 28‐amino acid peptide hormone, is an endogenous ligand for growth hormone secretagogue receptor (Khatib 2014f; Kojima 1999). This orexigenic gut hormone is primarily secreted by the endocrine X/A‐like cells of the stomach mucosa and also by intestinal mucosa, kidney, placenta, arcuate nucleus of the hypothalamus, pituitary gland, pancreatic islets, and other tissues (Gualillo 2001; Khatib 2015b; Kojima 1999; Korbonits 2001; Mori 2000; Van der Lely 2004; Volante 2002). It circulates in the blood stream under fasting conditions, indicating that it transmits the hunger signals from periphery to the central nervous system (Kojima 2008). Ghrelin plays an important role in regulation of release of growth hormone and energy homeostasis (Khatib 2014c; Kojima 1999; Kojima 2008). It has the potential to increase body weight and body composition through increased appetite, increased growth hormone (GH) secretion, prevention of muscle catabolism, promotion of gut motility, stimulation of gastric acid secretion, and regulation of metabolism (Chen 2012; Chen 2015; DeBoer 2007; Fujitsuka 2009; Fujitsuka 2011; Garcia 2005; Garcia 2013; Khatib 2014a; Khatib 2014d; Khatib 2014f; Khatib 2014e; Klok 2007; Lundholm 2010; Müller 2015; Neary 2004; Strasser 2008; Tsubouchi 2014; Wren 2001). These diverse actions of ghrelin raise the possibility of its clinical application for conditions like anorexia, cachexia, sarcopenia, gastrointestinal diseases, cardiovascular diseases, renal and pulmonary diseases, neurodegenerative disorders, inflammatory disorders and metabolic syndromes (Colldén 2017; Khatib 2014b; Khatib 2015a). It disturbs the vicious cycle of cachexia through its anabolic, orexigenic, and anti‐inflammatory effects (Müller 2015). Ghrelin regulates metabolism through activation of orexigenic neural circuits (Müller 2015). Studies have found that ghrelin is well‐tolerated and has no reported major adverse events (Akamizu 2010; Hiura 2012; Khatib 2015a; Neary 2004). Ghrelin agonists are being developed and tested for the treatment of anorexia/cachexia (Bai 2017; Currow 2017; Garcia 2015; Northrup 2013; Pietra 2014; Temel 2016; Zhang 2015).
Due to these and numerous other benefits of ghrelin, pharmacological targeting of the endogenous system of ghrelin is considered a promising and valuable approach for treatment of a variety of metabolic complications including cachexia associated with cancer (Colldén 2017; Hatanaka 2015; Ledderose 2011).
How the intervention might work
Although the mechanisms of action of ghrelin have not been fully elucidated, an increase in appetite (Cummings 2006; Wren 2001), decrease in energy expenditure (Garcia 2013; Murphy 1998), promotion of anabolic activity (Chen 2015), decrease in inflammation (Dixit 2004; Tsubouchi 2014), increase in growth hormone (Garcia 2009; Khatib 2014a; Khatib 2014d; Khatib 2014f), control of gastrointestinal motility (Fujino 2003), and effects in adipose tissue (Kos 2009) and skeletal muscle (Porporato 2013; Tsubouchi 2014) have been proposed.
Ghrelin and synthetic ghrelin receptor agonists cause weight gain by increasing food intake and by food intake‐independent mechanisms (Garcia 2007; Garcia 2013; Sugiyama 2012; Tschop 2000). Ghrelin is believed to be the only mammalian hormone that has been shown to increase appetite and food intake when delivered to humans (Neary 2004; Wren 2001). Administration of ghrelin increases appetite rapidly and briefly, principally by increasing appetitive feeding behaviours and number of meals (Cummings 2006; Faulconbridge 2003). Evidence implicates ghrelin in mealtime hunger and meal initiation (Cummings 2006). Circulating levels of ghrelin rise before meals and fall with feeding, attaining adequate concentrations to stimulate appetite and food intake (Cummings 2006). Pre‐prandial surges in ghrelin levels are possibly initiated by sympathetic nervous output while post‐prandial suppression is possibly mediated from post‐ingestive surges in insulin levels (Cummings 2001; Cummings 2006; Tschop 2000). As the growth hormone secretagogue receptors (GHS‐R) are expressed in vagal afferent neurons, the gastric vagus nerve may be involved in the effect of ghrelin on food intake and gastrointestinal motility (Date 2002). Ghrelin increases appetite through afferent vagal fibres to the caudal brainstem or directly to the hypothalamus (Suzuki 2010). Gastric ghrelin signalling via vagal afferents suppresses the activity of the sympathetic nerves and increases the discharge of both the gastric and the vagus efferent nerves (Fujitsuka 2009). Ghrelin has also been shown to promote faster motor activity by activating neuropeptide Y (NPY) neurons in the brain (Fujino 2003). Furthermore, ghrelin modulates taste sensation (Shin 2010) and acts on the stomach to enhance gastric acid secretion (Masuda 2000).
Ghrelin controls mediators involved in the cachectic process (Argilés 2013). Ghrelin promotes weight gain and lean body mass via anti‐inflammatory actions and effects involving orexigenic peptides (DeBoer 2007; Khatib 2014c; Khatib 2015b; Lin 2017). Ghrelin inhibits pro‐inflammatory cytokines such as IL‐1alpha, IL‐1beta, TNF‐alpha, which may cause anorexia (Guney 2007; Lin 2017). Animals treated with ghrelin exhibited decreased expression of IL‐1 receptor‐I transcript in the hypothalamus and brainstem and an increased expression of orexigenic peptides and NPY in the hypothalamus (DeBoer 2007; Tisdale 2009). Ghrelin inhibits the production and prevents the increase of pro‐inflammatory cytokines released by the tumour cells (Chen 2015; Dixit 2004; Tsubouchi 2014). Activation of the ghrelin receptor in the central nervous system releases growth hormone, which regulates insulin‐like growth factor‐1 (IGF‐1) (Khatib 2014a; Khatib 2014f; Velloso 2008). Growth hormone/IGF‐1 axis acts directly on bone, muscle and fat tissue, and also indirectly by producing anti‐cachectic cytokines and muscle‐restricted insulin‐like growth factor‐1 (mIGF‐1) (Fuoco 2015). Administration of ghrelin has been shown to prevent muscle atrophy by down‐regulating inflammation and activating protein kinase B (a protein kinase that plays a key role in apoptosis, cell proliferation, and cell migration), myogenin (a transcription factor involved in myogenesis and repair) and myoD (a protein that plays a major role in regulating muscle differentiation) (Chen 2015). Both acytylated and unacytylated ghrelin block skeletal muscle atrophy in a growth hormone‐independent manner (Porporato 2013). In‐vitro studies have demonstrated that ghrelin may regulate mesenchymal cell development by stimulating myogenesis (Zhang 2007). Cells expressing ghrelin have demonstrated a significant increase in the differentiation of premyocytes into myocytes (Zhang 2007). Short‐term administration of ghrelin at the start of cisplatin‐based chemotherapy has been shown to increase the efficiency of chemotherapy and also minimise adverse events associated with chemotherapy (Hiura 2012).
Ghrelin analogues can be viable treatment modalities for cancer‐associated cachexia. Anamorelin, a first‐in‐class, potent, orally‐active and highly‐specific ghrelin‐receptor agonist increases food intake, body weight, lean body mass and improves quality of life in people with cancer cachexia with good tolerability and no dose‐limiting toxicities (Bai 2017; Currow 2017; Garcia 2009; Garcia 2015; Northrup 2013; Pietra 2014; Temel 2016; Zhang 2015;). Oral administration of rikkunshito, a ghrelin enhancer, increases plasma acyl ghrelin levels in humans, mice, rats and dogs (Fujitsuka 2009; Fujitsuka 2011; Fujitsuka 2014; Takeda 2008, Shin 2010). Administration of RC‐1291, a ghrelin mimetic, has been shown to increase lean body mass in cachectic cancer patients (Garcia 2007).
Why it is important to do this review
Despite high prevalence of cancer cachexia, effective therapies are still limited and no definitive pharmacological treatment is available to address the relevant components of this syndrome (Esposito 2015). There is a strong need for more effective appetite‐stimulatory therapies for people with this condition. Several studies have demonstrated positive and encouraging effects of ghrelin or growth hormone secretagogues (GHS) in people with cancer cachexia (Lundholm 2010; Molfino 2014; Neary 2004; Strasser 2008). However, the safety and efficacy of ghrelin for cancer‐associated cachexia have not been systematically reviewed. There is a need to synthesise the evidence for patients, practitioners and policy makers to decide whether ghrelin can be incorporated in the management of cachexia associated with cancer and, if data permit, to explore the optimal drug programme for this group of patients. Therefore, systematic evaluation of the role of ghrelin in the treatment of cancer cachexia is warranted.
Objectives
To assess the efficacy and safety of ghrelin in improving food intake, body composition and survival in people with cachexia associated with cancer.
Methods
Criteria for considering studies for this review
Types of studies
We planned to include randomised controlled trials (RCTs) with open or blinded assessment of outcomes. We required full journal publication with the exception of extended abstracts of otherwise unpublished clinical trials. We excluded short abstracts (usually meeting reports), non‐randomised studies, studies of experimental pain, studies done on animal models, case reports, and clinical observational studies.
Types of participants
We included cachectic patients of 18 years and over with a histological or clinical diagnosis of cancer, or meeting any of the international criteria for cancer cachexia (Bozzetti 2009; Fearon 2006; Fearon 2011). We included both inpatients and outpatients with any type or stage of cancer irrespective of gender or race. We included patients in any healthcare setting (including hospice, hospital, oncology centre or community).
Types of interventions
We expected studies to vary in terms of form, dose, frequency, route and duration of treatment. We included studies in which ghrelin was administered in any form, at any dose, at any frequency, by any route and for any duration, administered for improving food intake, body composition and survival, compared to placebo or no treatment or any active comparator (such as appetisers, nutritional supplements, ghrelin analogues/ghrelin mimetics, ghrelin potentiators/enhancers, etc.). Studies examining ghrelin offered as a sole intervention or in combination with another intervention were eligible.
We had planned to undertake five comparisons. We added a sixth comparison group in this review: higher‐dose ghrelin versus lower‐dose ghrelin, as we found two studies addressing this. We thought it wiser to include this comparison rather than miss data on an intervention.
-
Ghrelin versus placebo
-
Ghrelin versus no treatment
-
Ghrelin versus alternative experimental treatment modality (like appetisers, nutritional supplements, etc.)
-
Ghrelin in combination with other treatments versus ghrelin treatment alone
-
Ghrelin treatment versus ghrelin analogues/ghrelin mimetics (anamorelin, ipamorelin, eganamorelin, hexarelin, MK‐677, etc.) or ghrelin potentiators/enhancers (rikkunshito)
-
Higher‐dose ghrelin versus lower‐dose ghrelin
Types of outcome measures
Primary outcomes
-
Change in food intake as difference between baseline and the end of treatment. We planned to express this outcome as a dichotomous variable (number of participants who experienced an increase in food intake) or a continuous variable (actual change in food intake).
-
Change in body weight as difference between baseline and at the end of treatment. We planned to express this outcome as a dichotomous variable (number of participants who experienced change in body weight) or a continuous variable (actual change in body weight).
-
Adverse events as the number of participants who suffered an event described as an adverse event by the authors of the studies.
Secondary outcomes
-
Change in survival measured as increase in survival in days. We planned to use hazard ratios for how many times more (or less) likely a participant was to suffer the event at a particular point in time if they received ghrelin rather than the control intervention.
-
Change in body composition (lean body mass, fat mass) as difference between baseline and the end of treatment. We planned to express this outcome as a dichotomous variable (number of participants who experienced change in body weight) or a continuous variable (actual change in body composition).
-
Plasma ghrelin levels as difference between baseline and the end of treatment. We planned to express this outcome as a dichotomous variable (number of participants who experienced increase in plasma ghrelin levels) or a continuous variable (actual change in plasma ghrelin levels).
-
Change in quality of life using any validated scale (CDC 2016).
Reporting of these outcome measures did not form part of the criteria for including studies in a review.
Search methods for identification of studies
Electronic searches
We searched the following databases without language restrictions.
-
The Cochrane Central Register of Controlled Trials (CENTRAL; 2017, issue 6) in the Cochrane Library
-
MEDLINE (via Ovid) searched 1947 to 20 July 2017
-
Embase (via Ovid) searched 1974 to 20 July 2017
We used Medical subject headings (MeSH) or equivalent and text‐word terms. We obtained full‐text translations of all relevant non‐English articles and tailored the searches to individual databases. The search strategies used can be found in Appendix 1.
Searching other resources
We searched the metaRegister of controlled trials (mRCT) (www.controlled-trials.com/mrct), National Cancer Institute (www.cancer.gov/clinicaltrials), clinicaltrials.gov (www.clinicaltrials.gov), and the WHO International Clinical Trials Registry Platform (ICTRP) (apps.who.int/trialsearch/) for ongoing trials in July 2017. We also searched ClinicalStudyResults.org (www.clinicalstudyresults.org) for clinical trials.
In addition, we checked the reference lists of reviews, retrieved articles for additional studies, and performed citation searches on key articles. We contacted study authors where necessary for additional information. We searched the British Association for Cancer Research (BACR), Society on Sarcopenia, Cachexia and Wasting Disorders (SCWD), the American Cancer Society. We contacted experts in the field for unpublished and ongoing trials to identify any additional literature related to the review.
Data collection and analysis
Selection of studies
Two review authors (MNK, SG) independently screened the articles retrieved from the searches using the Rayyan online screening tool (Elmagarmid 2014) and determined eligibility by reading the abstract of each study identified by the search. Review authors eliminated studies that clearly did not satisfy inclusion criteria, and obtained full copies of the remaining studies. Two review authors (ZQS, AG) screened full texts of these studies independently to select relevant studies. We contacted study authors by email, if missing information impaired the study selection, to clarify the necessary information. In the event of disagreement, a third author adjudicated (AS). We did not anonymise the studies in any way before assessment. We applied no language restrictions in the selection of studies. We included a PRISMA flow chart in the full review that shows the status of identified studies (Moher 2009) as recommended in Part 2, Section 11.2.1 of the Cochrane Handbook for Systematic Reviews of Interventions (Schünemann 2011). We included studies in the review irrespective of whether measured outcome data are reported.
Data extraction and management
Two review authors (MNK, SG) independently extracted the data using a standard form and checked for agreement before entry into Review Manager 5 (RevMan 5) (RevMan 2014). We included information about all the primary outcomes. We collated multiple reports of the same study, so that each study rather than each report is the unit of interest in the review. We collected characteristics of the included studies in sufficient detail to populate a table of ‘Characteristics of included studies’.
Assessment of risk of bias in included studies
This section is taken from the PaPaS template for 'reviews'.
Two authors (MNK, PS) independently assessed risk of bias for each study, using the criteria outlined in the Cochrane Handbook for Systematic Reviews of Interventions (Higgins 2011a) and adapted from those used by the Cochrane Pregnancy and Childbirth Group, with any disagreements resolved by discussion. We completed a 'Risk of bias' table for each included study using the 'Risk of bias' tool in RevMan 5 (RevMan 2014).
We assessed the following for each study.
-
Random sequence generation (checking for possible selection bias). We assessed the method used to generate the allocation sequence as: low risk of bias (any truly random process, e.g. random number table, computer random number generator); unclear risk of bias (method used to generate sequence not clearly stated). We excluded studies using a non‐random process (e.g. odd or even date of birth; hospital or clinic record number).
-
Allocation concealment (checking for possible selection bias). The method used to conceal allocation to interventions prior to assignment determines whether intervention allocation could have been foreseen in advance of, or during recruitment, or changed after assignment. We assessed the methods as: low risk of bias (e.g. telephone or central randomisation; consecutively numbered, sealed, opaque envelopes); unclear risk of bias (method not clearly stated).
-
Blinding of participants and personnel (checking for performance bias). We assessed the methods used to blind study participants and personnel about the receipt of the intervention. We assessed the methods as: low risk of bias (study states that it was blinded and describes the method used to achieve blinding); unclear risk of bias (study states that it was blinded but does not provide an adequate information of how it was done); high risk of bias (no blinding or incomplete blinding, and the outcome is likely to be influenced by lack of blinding; or blinding of participants of the study and personnel was attempted, but it is likely that the blinding could have been broken).
-
Blinding of outcome assessment (checking for possible detection bias). We assessed the methods used to blind study participants and outcome assessors from knowledge of which intervention a participant received. We assessed the methods as: low risk of bias (study states that it was blinded and describes the method used to achieve blinding, e.g. identical tablets, matched in appearance and smell); unclear risk of bias (study states that it was blinded but does not provide an adequate description of how blinding was achieved).
-
Incomplete outcome data (checking for possible attrition bias due to the amount, nature and handling of incomplete outcome data). We assessed the methods used to deal with incomplete data as: low risk (< 10% of participants did not complete the study and/or used ‘baseline observation carried forward’ analysis); unclear risk of bias (used 'last observation carried forward' analysis); high risk of bias (used 'completer' analysis).
-
Size of study (checking for possible biases confounded by small size). We assessed studies as being at low risk of bias (≥ 200 participants per treatment arm); unclear risk of bias (50 to 199 participants per treatment arm); high risk of bias (< 50 participants per treatment arm).
-
Selective outcome reporting (checking for reporting bias). We assessed studies as being at low risk of bias (the study protocol is available; or the study protocol is not available but the study reported all expected and pre‐specified outcomes); high risk of bias (the study reported one or more outcomes of interest incompletely); unclear risk of bias (the study provides insufficient information to permit judgement of ‘low risk’ or ‘high risk’).
-
Other bias. We assessed the study as: low risk of bias (the study appears to be free of other sources of bias); unclear risk of bias (there may be a risk of bias, but there is insufficient information to judge whether risk of bias exists; or insufficient evidence that a problem under consideration will introduce bias); or high risk of bias (there is at least one important risk of bias).
Measures of treatment effect
We planned to record number of events and total number of participants in both the arms for dichotomous variables. For continuous variables we planned to record means with standard deviations and total number of participants in both the arms. We planned to summarise each study in our meta‐analysis using risk ratio (RR) or odds ratio (OR) with 95% confidence intervals (CI) for dichotomous variables and mean difference (MD) with 95% CI for continuous variables, then pool these effect estimates in a meta‐analysis. For continuous data we planned to use mean differences (MD) with 95% CI when the results were measured in the same way in different studies. We planned to use standardised mean differences (SMD) when the results obtained were conceptually the same but used different measurement scales. We planned to use a fixed‐effect model or random‐effects model to estimate the overall direction, size and consistency of an effect and obtain the change in standard deviation from CI, standard errors, t values, P values or F values (whichever was available) using the RevMan 5 calculator. If there was not enough information available to calculate the standard deviations for the changes, we planned to impute the values of the same. If the required data were not available, we planned to use a comparison of final measurements. We planned to evaluate the direction and size of the effect as well as looking at the consistency of the effect across the selected studies. We planned to consider clinically meaningful change taking into account the change in weight and appetite with a measurable entity and time span.
Unit of analysis issues
In parallel‐group RCTs, we considered an individual participant as the unit of analysis. When incorporating cross‐over trials into a meta‐analysis, we would have followed the approach suggested by Elbourne (Elbourne 2002). We would have incorporated these trials by taking measurements from experimental intervention periods and measurements from control intervention periods and analysing these as if the trial were a parallel group trial of intervention versus control. If carry‐over was thought to be a problem, we would have included only data from the first period. We would have included the effect estimate of cross‐over trials in meta‐analysis using the generic inverse‐variance method.
Dealing with missing data
If enough studies were available; we would have carried out an intention‐to‐treat analysis. We asked for further information from the authors or manufacturers when published data were missing, incomplete or inconsistent with RCT protocols. We contacted authors by email if studies did not report the outcome measures of interest, did not describe randomisation or intention‐to‐treat analysis or had missing data.
Assessment of heterogeneity
We planned to assess clinical heterogeneity by using the Chi2 test (P value < 0.10 for statistical significance) and use the I2 statistic to quantify heterogeneity. We would have regarded heterogeneity as considerable if I2 was more than 75%; substantial if it was between 50% and 90%; moderate if it was between 30% and 60% and mild if less than 40% (Deeks 2011). If we had identified statistical heterogeneity (I² greater than, or equal to 50%); we would have reported it and explored possible causes by prespecified subgroup analysis, and would have applied a random‐effects model.
Assessment of reporting biases
If there would have been 10 or more included studies; we planned to conduct a funnel plot test for asymmetry to assess for any evidence of reporting bias. Additionally; we had planned to explore the possible sources of asymmetry in a funnel plot.
Data synthesis
We planned to undertake a meta‐analysis only if participants, interventions, comparisons and outcomes were judged to be sufficiently similar to ensure an answer that is clinically meaningful and relevant. For analysis, we planned to use RevMan 2014, the statistical package provided by the Cochrane Collaboration.
If statistical heterogeneity (I² greater than, or equal to 50%) was detected, we would have identified the sources of the heterogeneity and would have performed subsequent meta‐analysis using a random‐effects model. When meta‐analysis seemed inappropriate, we did not pool the results of the included studies, but presented a qualitative description of these studies with supporting tables. We planned to perform a meta‐analysis using a fixed‐effect model if there were sufficient and homogeneous data with consistent or comparable outcomes.
‘Summary of findings' tables
We included 'Summary of findings' (SoF) tables as set out in the PaPaS author guide (AUREF 2012) and recommended in the Cochrane Handbook for Systematic Reviews of Interventions (Schünemann 2011). We have presented the SoF tables under the following comparisons for all of the primary outcomes:
-
Ghrelin versus placebo
-
Ghrelin versus an alternative experimental treatment modality
-
Ghrelin in combination with other treatments versus ghrelin treatment alone
-
Higher‐dose ghrelin versus lower‐dose ghrelin
Two review authors (ZQS, MNQ) assessed the overall quality of the evidence for each of the primary outcome using the GRADE system (GRADEpro GDT 2015) and presented the findings in the 'Summary of findings' tables. In particular, we included key information concerning the quality of evidence. We planned to include the magnitude of effect of the interventions examined, and the sum of available data on the main outcomes.
We decreased the grade rating if there was:
-
A serious (‐1) or very serious (‐2) limitation to study quality;
-
Important inconsistency (‐1);
-
Some (‐1) or major (‐2) uncertainty about directness;
-
Imprecise or sparse data (‐1);
-
High probability of reporting bias (‐1).
We have justified all decisions to downgrade the quality of studies using footnotes.
Subgroup analysis and investigation of heterogeneity
We planned to undertake subgroup analyses for form, dose, duration and route of administration of ghrelin, and for different types of cancer.
Results
Description of studies
Results of the search
The electronic literature searches identified 1484 potential articles. Following the removal of duplicates, we independently examined 926 papers and after initial screening, we removed 892 papers. We then independently assessed the full text of 34 potentially relevant papers. We excluded 31 papers on the basis of different population (participants other than those with cancer cachexia: n = 5, animal models: n = 11), different intervention (intervention other than ghrelin: n = 14) and different study design (n = 1). Reasons for rejecting individual studies are detailed in the 'Characteristics of excluded studies' table. We identified three studies for potential inclusion (Lundholm 2010; Neary 2004; Strasser 2008) but none of the studies could be included in quantitative synthesis (meta‐analysis). We have presented a flow diagram detailing the selection of studies in Figure 1.
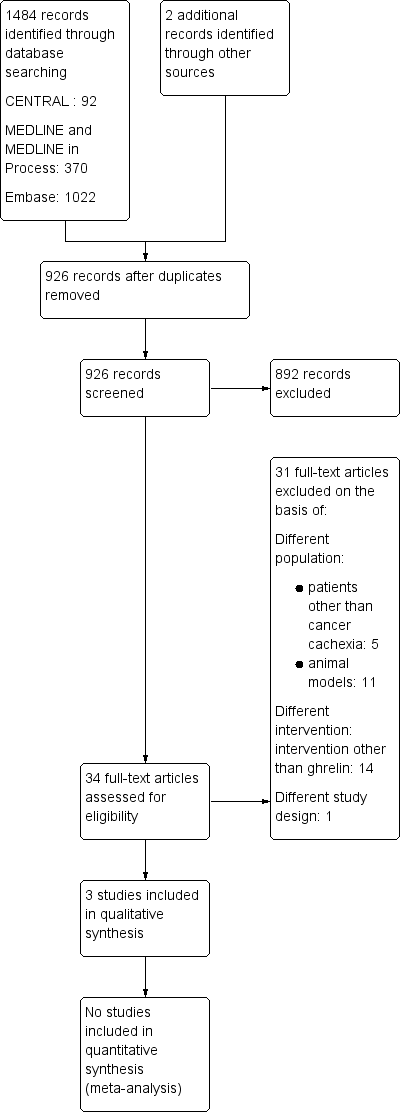
Study flow diagram
Included studies
In total, we identified three studies for inclusion (Lundholm 2010; Neary 2004; Strasser 2008). The included studies were conducted in Sweden (Lundholm 2010), the UK (Neary 2004) and Switzerland (Strasser 2008). All studies were randomised and double‐blind. Neary 2004 and Strasser 2008 were cross‐over clinical trials while Lundholm 2010 was a parallel‐group clinical trial. The cross‐over clinical trials did not report washout between treatment phases. All articles were written in English. Full details can be found in the Characteristics of included studies table.
Participants
The number of participants recruited were 31 in Lundholm 2010, seven in Neary 2004 and 21 in Strasser 2008. One of the seven participants failed to complete a food diary in Neary 2004. The number of participants who completed the study were 22 in Lundholm 2010 and 18 in Strasser 2008. All studies included people with cancer with weight loss and anorexia.
Lundholm 2010 randomised 18 men and 13 women suffering from progressive, weight‐losing gastrointestinal cancer with systemic spread into high‐dose ghrelin group (HDGG) and low‐dose ghrelin group (LDGG). The mean age of the participants in the two groups was 73 ± 2 years in HDGG and 76 ± 2 years in LDGG. The male:female ratio in the study for HDGG was 11 to 6 and for LDGG was 7 to 7. This study excluded participants aged under 40 years, people with diabetes (type I or II), people on steroid treatment, or any other treatment known or assumed to affect tumor host metabolism, as well as people receiving any nutritional support.
Neary 2004 randomised one man and six women with cancer with sustained anorexia and weight loss. Five participants had breast cancer, one participant had colon cancer and one malignant melanoma. All participants had metastasis. Two of the seven participants in Neary 2004 were on chemotherapy. The median age of participants was 54 years. The study excluded people who had undergone surgery or radiotherapy, and were on regular use of systemic steroids or progestins.
Strasser 2008 randomised 17 men and three women with far‐advanced, incurable cancer and involuntary loss of weight and appetite into two groups, a higher‐dose ghrelin group (HDGG) and a lower‐dose ghrelin group (LDGG). The participants had different cancer types including: pancreatic cancer (n = 4), mesothelioma (n = 2), prostate cancer (n = 3), colorectal cancer (n = 4), stomach/oesophageal cancer (n = 2), non‐small‐cell lung carcinoma (n = 3)
, urogenital cancer (n = 1), and cholangiocarcinoma (n = 1). The median age of participants in the two groups was 66 years in LDGG and 70 in HDGG. This study excluded people receiving enteral or parenteral nutrition, who had significant cause of secondary anorexia and who required new systemic antineoplastic treatment for the study period of three weeks.
Intervention
One trial (Neary 2004) compared the effect of ghrelin with placebo while two trials (Lundholm 2010; Strasser 2008) studied the effect of two different doses (higher‐dose with lower‐dose) of ghrelin.
Lundholm 2010 randomised the participants into two groups: HDGG and LDGG. Participants randomised to HDGG received ~10 µg/kg daily and those randomised to LDGG received 0.5 µg/kg daily for eight weeks as once‐daily, subcutaneous injections, 30 to 45 minutes before the main daily meal. The amounts provided corresponded to 13 µg/kg daily (HDGG) or 0.7 µg/kg (LDGG) daily to account for individual body weight based on 56 doses for each group over eight weeks.
In Neary 2004 the participants were given two infusions at least three days apart (range: 3 to 21 days), one day for ghrelin and one day for saline. Participants on chemotherapy received the first infusion at least 17 days after their chemotherapy cycle and then the same number of days after their subsequent chemotherapy cycle. Ghrelin or saline infusion was administered over 90 minutes at the rate of 5 pmoL/kg/minute.
Strasser 2008 conducted a two‐week trial of ghrelin infusion, four to five days after baseline at one of two dose levels HDGG and LDGG, intravenous infusion over 60 minutes, once weekly on days one and eight and placebo on days four and 11 or vice versa, that is, three days apart. The LDGG received 10 pmoL/kg/minute (approximately 2 µg/kg). After observing treatment tolerance in the LDGG participants, the investigators administered the HDGG 40 pmoL/kg/minute (approximately 8 µg/kg). Normal saline was used as placebo.
Comparison
Neary 2004 compared ghrelin with placebo. Two trials (Lundholm 2010; Strasser 2008) compared higher‐dose of ghrelin with lower‐dose of ghrelin.
None of the trials compared ghrelin with no treatment or alternative experimental treatment modality (like appetisers, nutritional supplements, etc.) or ghrelin analogues/ghrelin mimetics (anamorelin, ipamorelin, eganamorelin, hexarelin, MK‐677, etc.) or ghrelin potentiators/enhancers (rikkunshito). None of the included trials compared ghrelin in combination with other treatments versus ghrelin treatment alone.
Outcomes
Primary outcomes
All the included trials assessed food intake and adverse events while none of the trials measured body weights. Lundholm 2010 reported the food intake at baseline and after eight weeks in two groups while Strasser 2008 reported the change in food intake.
Secondary outcomes
None of the included trials reported data on survival. Lundholm 2010 reported baseline and follow‐up (at eight weeks) data on body composition, plasma ghrelin levels and quality of life. Neary 2004 reported data only on plasma ghrelin levels at pre‐breakfast, at the start of infusion, and 60 minutes and 90 minutes after the start of infusion. Strasser 2008 did not assess data on any of our secondary outcomes.
In summary the three trials that met the inclusion criteria recruited 59 participants with cancer cachexia; of whom 47 were able to complete the study. All the trials were double‐blind with two trials of cross‐over design and one trial of parallel‐group design. The median age of participants across the trials ranged from 54 to 78 years. The ratio of men to women recruited in the included studies was 37 to 22. Each of the included participants suffered with various types of cancer (Neary 2004; Strasser 2008), except Lundholm 2010 that exclusively enrolled participants with gastrointestinal cancer. One trial (Neary 2004) compared the effect of ghrelin with placebo while two trials (Lundholm 2010; Strasser 2008) studied the effect of two different doses (higher dose with lower dose) of ghrelin. The doses and duration of ghrelin varied between the included studies. Lundholm 2010 administered ghrelin subcutaneously while Neary 2004 and Strasser 2008 administered ghrelin intravenously.
Excluded studies
We excluded Adachi 2010; Hiura 2012; Takata 2015; Takiguchi 2012; and Yamamoto 2010 because, although the participants suffered from cancer, they were not cachectic patients. One trial registered in a clinical trials registry (NCT00933361) was not an RCT and hence we excluded it.
Risk of bias in included studies
All studies were at high risk of attrition bias and bias for size of the study. Risk of bias in other domains was unclear or low (Figure 2; Figure 3).

Risk of bias graph: review authors' judgements about each risk of bias item presented as percentages across all included studies

Risk of bias summary: review authors' judgements about each risk of bias item for each included study
Allocation
Random sequence generation
All studies were at low risk of selection bias for random sequence generation. Lundholm 2010 and Neary 2004 randomised the participants using a computerised algorithm and statistical package respectively. Strasser 2008 mentioned that a random allocation sequence was produced.
Allocation concealment
Lundholm 2010 stated that participants received ghrelin according to randomisation but the study authors did not adequately provide the method of allocation concealment and so we judged it as unclear risk. Neary 2004 concealed allocation through sealed containers and so we judged it as at low risk. In Strasser 2008 an independent investigator maintained randomisation procedure and opening of sealed envelopes disclosed treatment assignments and hence we judged this study as at low risk.
Blinding
All three included studies were double‐blind. Although Lundholm 2010 stated the study was 'double‐blind' the authors did not clearly describe the method of blinding. Lundholm 2010 did not report on blinding of the outcome assessor. Neary 2004 and Strasser 2008 blinded participants, investigators, and dieticians/clinicians to the type of infusion by producing identical bags containing indistinguishable liquids.
There is unclear risk in Lundholm 2010. Performance bias and detection bias appears unlikely to have occurred in Neary 2004 and Strasser 2008.
Incomplete outcome data
We judged all three studies at high risk of attrition bias because they had substantial attrition (> 10%).
In Neary 2004 one of the seven (14.28%) participants failed to complete a food diary. In Strasser 2008 three of 21 (14.28%) participants and in Lundholm 2010 nine of the 31 (29%) participants failed to complete the study.
Neary 2004 did not specify the reason for attrition. In Strasser 2008 two participants stopped treatment because of malignant bowel obstruction and one participant because of infection. Lundholm 2010 reported that interruption of treatment was either for personal reasons or because of progressive disease. None of the studies mentioned attrition due to the intervention.
Size of study
We judged all three studies (Lundholm 2010; Neary 2004; Strasser 2008) to be confounded by small size due to having fewer than 50 participants per treatment arm so at high risk of bias.
Selective reporting
The protocol of Neary 2004 was not available. Strasser 2008 and Lundholm 2010 had registered protocols (ISRCTN26185223; NCT00681486 respectively).
Neary 2004 did not describe the adjusted analyses, and did not present the first period results clearly in the cross‐over trial. Some outcomes, like food intake and appreciation of food were reported but with insufficient detail for the data to be included in analysis. This study provided insufficient information to permit judgement of 'low risk' or 'high risk' of bias.
Other potential sources of bias
We did not detect any other potential sources of bias in the included studies and hence all studies were at low risk.
Effects of interventions
See: Summary of findings 1 Ghrelin compared to placebo for cachexia associated with cancer; Summary of findings 2 Ghrelin compared to alternative experimental treatment modality for cachexia associated with cancer; Summary of findings 3 Ghrelin in combination with other treatments compared to ghrelin treatment alone for cachexia associated with cancer; Summary of findings 4 Higher‐dose ghrelin compared to lower‐dose ghrelin for cachexia associated with cancer
Comparison 1. Ghrelin versus placebo
One trial (Neary 2004) with seven participants compared ghrelin with placebo (Table 1; Table 2).
| Primary outcome | ||||||
|---|---|---|---|---|---|---|
| Higher‐dose ghrelin group | Lower‐dose ghrelin group | Ghrelin group | Placebo group | Higher‐dose ghrelin group | Lower‐dose ghrelin group | |
| Food intake | Baseline: 32.5 ± 94 (SEM) kcal/kg/day At 8 weeks: 28.2 ± 3.8 (SEM) kcal/kg/day According to 4‐day schedule | Baseline: 24.1 ± 3.0 (SEM) kcal/kg/day At 8 weeks: 25.5 ± 4.5 (SEM) kcal/kg/day According to 4‐day schedule | Mean energy intake: 9270 kJ (95% CI 3249 to 15,290 kJ) As assessed by 24‐h food diary | Mean energy intake: 6854 kJ (95% CI 3634 to 10,070 kJ) As assessed by 24‐h food diary | Nutritrional intake at lunch compared to baseline Ghrelin: 251 kcal Placebo: 230 kcal Nutritrional intake at lunch and rest of the day compared to baseline Ghrelin: 244 kcal Placebo: 156 kcal Monitored daily | Nutritrional intake at lunch compared to baseline Ghrelin: ‐105 kcal Placebo: ‐17 kcal Nutritrional intake at lunch and rest of the day compared to baseline Ghrelin: 145 kcal Placebo: 228 kcal Monitored daily |
| Body weight | Not reported | Not reported | Not reported | Not reported | Not reported | Not reported |
| Adverse events | Nil | Nil | Nil | Nil | Ghrelin: 17 (increased bowel activity: 5; abdominal pain: 5; dry mouth: 3; worsening of pre‐existing neuropathy: 1; asthenia: 1; diarrhoea: 1; nausea: 1) Placebo: 6 (increased bowel activity: 3; dry mouth: 1; dizziness: 1; diarrhoea: 1) | Ghrelin: 7 (increased bowel activity: 3; shortness of breath: 1; sweating: 2; vomiting: 1) Placebo: 12 (increased bowel activity: 5; shortness of breath: 1; nausea: 1; increased stool frequency: 1; apoplectiform deafness: 1; vomiting: 2; constipation: 1) |
SEM: standard error of mean
| Secondary Outcomes | ||||||
|---|---|---|---|---|---|---|
| Higher‐dose ghrelin group | Lower‐dose ghrelin group | Ghrelin group | Placebo group | Higher‐dose ghrelin group | Lower‐dose ghrelin group | |
| Survival | Not reported | Not reported | Not reported | Not reported | Not reported | Not reported |
| Body composition (lean body mass) | Baseline: 44.8 ± 2.9 (SEM) kg At 8 weeks: 47.8 ± 2.9 (SEM) kg Difference over time: 2.24 ± 0.71 (SEM) | Baseline: 44.3 ± 2.2 (SEM) kg At 8 weeks: 45.1 ± 2.8 (SEM) kg Difference over time: 0.86 ± 1.18 (SEM) | Not reported | Not reported | Not reported | Not reported |
| Mean difference 1.38 kg (95% CI ‐1.32 to 4.08) | ||||||
| Body composition (fat mass) | Baseline: 15.1 ± 1.9 (SEM) kg At 8 weeks: 13.5 ± 1.9 (SEM) kg Difference over time: ‐1.3 ± 0.7 (SEM) | Baseline: 16.3 ± 3.0 (SEM) kg At 8 weeks: 12.6 ± 2.4 (SEM) kg Difference over time: ‐3.7 ± 0.8 (SEM) | Not reported | Not reported | Not reported | Not reported |
| Mean difference 2.40 kg (95% CI 0.32 to 4.48 | ||||||
| Plasma ghrelin | Baseline: 563 ± 90 (SEM) ng/L At 8 weeks: 1229 ± 501 (SEM) ng/L | Baseline: 3418 ± 2570 (SEM) ng/L At 8 weeks: 3817 ± 2997 (SEM) ng/L | 0 min (pre‐breakfast): 531 ± 83 (SEM) 90 min (at the start of infusion): 505 ± 90 (SEM) 150 min (60 min after the start of infusion): 1718 ± 169 (SEM) 180 min (90 min after the start of infusion): 1840 ± 221 (SEM) | 0 min (pre‐breakfast): 545 ± 58 (SEM) 90 min (at the start of infusion): 440 ± 59 (SEM) 150 min (60 min after the start of infusion): 509 ± 97 (SEM) 180 min (90 min after the start of infusion): 490 ± 63 (SEM) | Not reported | Not reported |
| Baseline imbalances between the two groups | Mean difference 1209.00 pmoL/L (95% CI 827.08 to 1590.92) | |||||
| Quality of Life | HADS anxiety Baseline: 4.6 ± 1.07 (SEM) At 8 weeks: 5.4 ± 1.6 (SEM) | HADS anxiety Baseline: 8.6 ± 1.6 (SEM) At 8 weeks: 8.8 ± 1.3 (SEM) | Not reported | Not reported | Not reported | Not reported |
| Baseline imbalances between the two groups | ||||||
| HADS depression Baseline: 5.7 ± 0.9 (SEM) At 8 weeks: 6.8 ±1.2 (SEM) | HADS depression Baseline: 7.6 ±1.4 (SEM) At 8 weeks: 9.3 ± 1.9 (SEM) | Not reported | Not reported | Not reported | Not reported | |
| Mean difference ‐2.50 (95% CI ‐6.90 to 1.90) | ||||||
| SF‐36 PCS Baseline: 30 ± 3 (SEM) At 8 weeks: 27 ± 3 (SEM) | SF‐36 PCS Baseline: 35 ± 3 (SEM) At 8 weeks: 30 ± 2 (SEM) | Not reported | Not reported | Not reported | Not reported | |
| Mean difference ‐3.00 (95% CI ‐10.07 to 4.07) | ||||||
| SF‐36 MCS Baseline: 40 ± 3 (SEM) At 8 weeks: 41 ± 3 (SEM) | SF‐36 MCS Baseline: 30 ± 2 (SEM) At 8 weeks: 34 ± 4 (SEM) | Not reported | Not reported | Not reported | Not reported | |
| Baseline imbalances | ||||||
CI: confidence interval
HADS: Hospital Anxiety and Depression Scale
SEM: standard error of mean
SF‐36 MCS: 36‐item Short Form Health Survey Mental Component Scale
SF‐36 PCS: 36‐item Short Form Health Survey Physical Component Scale
We assessed the quality of evidence using GRADE for all primary outcomes in this comparison as very low. We downgraded the evidence for study limitations (due to high risk of attrition bias and biases confounded by small size) and imprecision or due to lack of data. See summary of findings Table 1.
Primary outcomes
1. Food intake
Neary 2004 reported the effect on food intake after intravenous administration of a single dose of 5 pmoL/Kg/minute of ghrelin as assessed by 24‐hour food diary (Table 1). The energy intake at baseline differed amongst the participants. This trial reported a 31% increase in energy intake after administration of ghrelin. Over a day, mean energy intake after ghrelin administration was 9270 kJ (95% CI 3249 to 15,290) as compared to 6854 kJ (95% CI 3634 to 10,070) after saline administration (P = 0.09). The trial also found a 23% increase in perceived pleasantness of the meal (as assessed by visual analogue score) on the day of administration of ghrelin as compared to day of administration of saline. Appetite increased in all participants who received ghrelin.
We downgraded the quality of evidence using GRADE once for study limitations due to high risk of attrition bias and biases confounded by small size. Only seven participants participated in the study and the loss to follow‐up was more than 10%. The evidence was further downgraded twice for imprecision due to sparse data and low participant numbers. These data were insufficient to be meaningful.
2. Body weight
This study did not report the effect of ghrelin on body weight.
We reported the quality of evidence using GRADE for body weight as very low, downgraded three times due to a lack of data.
3. Adverse events
No adverse events were observed in Neary 2004 in either of the intervention groups (Table 1).
We rated the quality of evidence using GRADE for adverse events as very low, downgraded once for study limitations due to high risk of attrition bias and bias confounded by small size, and downgraded twice for imprecision due to sparse data and low event rate.
Secondary outcomes
1. Survival
This study did not report on survival.
2. Body composition
Body composition was not assessed in this study.
3. Plasma ghrelin levels
Neary 2004 assessed plasma ghrelin levels in seven participants before breakfast, at the start of infusion, 60 minutes after the start of infusion and 90 minutes after the start of infusion. They presented the data as mean with standard error of the mean (SEM) in pmoL/litre. We converted the SEM into SD with the help of the RevMan 5 calculator and found that after 60 minutes of infusion, plasma ghrelin was higher in the ghrelin group compared to the placebo group (MD 1209.00 pmoL/L, 95% CI 827.08 to 1590.92; one study; 7 participants). We could not analyse the change in plasma ghrelin levels or number of participants who experienced an increase in plasma ghrelin levels due to insufficient information (Table 2).
4. Quality of life
This study did not assess quality of life.
Comparison 2. Ghrelin versus no treatment
None of the trials compared ghrelin with no treatment
Comparison 3. Ghrelin versus alternative experimental treatment modality
None of the trials compared ghrelin with an alternative experimental treatment modality, like appetisers, nutritional supplements, etc. We judged the quality of the evidence using GRADE to be very low, downgraded three times due to a lack of data. See summary of findings Table 2.
Comparison 4. Ghrelin in combination with other treatments versus ghrelin treatment alone
None of the trials compared ghrelin in combination with other treatments with ghrelin treatment alone.
We judged the quality of the evidence using GRADE to be very low, downgraded three times due to a lack of data. See summary of findings Table 3
Comparison 5. Ghrelin treatment versus ghrelin analogues/ghrelin mimetics
None of the trials compared ghrelin with ghrelin analogues/ghrelin mimetics, like anamorelin, ipamorelin, eganamorelin, hexarelin, MK‐677, etc., or ghrelin potentiators/enhancers like rikkunshito.
Comparison 6. Higher dose of ghrelin versus lower dose of ghrelin
Two trials (Lundholm 2010; Strasser 2008) compared a higher dose of ghrelin with a lower dose of ghrelin. Neither of the studies reported data on body weight and survival. Because of the different study designs (parallel and cross‐over) and great diversity in the treatment provided (dosage, route of administration, frequency and duration of treatment) in the included trials; meta‐analysis seemed inappropriate and we did not pool the results. However, we have presented a narrative summary of each of these studies with supporting tables (Table 1; Table 2).
We assessed the quality of evidence using GRADE for all primary outcomes in this comparison as very low. The evidence was downgraded for study limitations (due to high risk of attrition bias and biases confounded by small size) and imprecision or due to lack of data. See summary of findings Table 4.
Primary outcomes
1. Food intake
In Lundholm 2010 food intake (as assessed according to four‐day record) did not differ between 12 participants on higher‐dose and 10 participants on lower‐dose ghrelin over time. Appetite was higher in participants on higher‐dose ghrelin as compared with participants on lower‐dose ghrelin (Table 1).
In Strasser 2008, there were no differences in nutritional intake compared to baseline when participants received ghrelin or placebo. In 11 participants on higher‐dose ghrelin, nutritional intake at lunch compared to baseline was 251 kcal. In nine participants on lower‐dose ghrelin, nutritional intake at lunch compared to baseline was ‐105 kcal (Table 1).
The quality of evidence was downgraded once for study limitations due to high risk of attrition bias and biases confounded by small size. Forty participants participated in these two studies and each study had more than 10% loss to follow‐up. The evidence was further downgraded twice for imprecision due to sparse data and low participant numbers.
2. Body weight
Neither of the included studies (Lundholm 2010; Strasser 2008) reported the effect of ghrelin on body weight.
We reported the level of evidence for body weight as very low, downgraded three times due to a lack of data.
3. Adverse events
No objective adverse effects were reported with higher‐dose or lower‐dose ghrelin in Lundholm 2010 (Table 1).
Strasser 2008 reported 17 adverse events in 11 participants on upper‐dose and seven adverse events in nine participants on lower‐dose ghrelin. Adverse events observed with higher dose of ghrelin were increased bowel activity (n = 5), abdominal pain (n = 5), dry mouth (n = 3), worsening of pre‐existing neuropathy (n = 1), asthenia (n = 1), diarrhoea (n = 1) and nausea (n = 1). Adverse events observed with lower dose of ghrelin were increased bowel activity (n = 3), shortness of breath (n = 1), sweating (n = 2) and vomiting (n = 1) (Table 1). Although the study reported 13 serious adverse events, only one, transient apoplectiform deafness, was supposedly related to the treatment.
We rated the quality of evidence for adverse events as very low, downgraded once for study limitations due to high risk of attrition bias and biases confounded by small size, and downgraded twice for imprecision due to sparse data and low participant numbers.
Secondary outcomes
1. Survival
Neither of the included studies (Lundholm 2010; Strasser 2008) reported this outcome.
2. Body composition
Lean body mass
Lundholm 2010 reported that difference over time in lean body mass was more with higher‐dose ghrelin (2.24 ± 0.71 (SEM)) compared to lower‐dose ghrelin (0.86 ± 1.18 (SEM)) (Table 2).
Strasser 2008 did not measure lean body mass.
Fat mass
Lundholm 2010 reported that higher‐dose ghrelin reduced the loss of whole‐body fat. There was a total of 31 participants in this trial. Whole‐body fat loss was less pronounced in participants who were receiving higher‐dose ghrelin as compared with lower‐dose ghrelin (P < 0.04). The difference over time in fat mass was ‐1.3 ± 0.7 (SEM) with higher‐dose ghrelin and ‐3.7 ± 0.8 (SEM) with lower‐dose ghrelin (Table 2).
Strasser 2008 did not measure fat mass.
3. Plasma ghrelin levels
In Lundholm 2010, there were significant differences in the baseline plasma ghrelin values 563 ± 90 (SEM) ng/L in higher‐dose ghrelin group and 3418 ± 2570 (SEM) ng/L in lower‐dose ghrelin group. After eight weeks of treatment, plasma ghrelin increased in both the groups 1229 ± 501 (SEM) ng/L in higher‐dose ghrelin group and 3817 ± 2997 (SEM) ng/L in lower‐dose ghrelin group (Table 2).
Strasser 2008 did not measure plasma ghrelin levels.
4. Quality of life
Lundholm 2010 assessed health‐related quality of life using the 36‐item Short Form Health Survey (SF‐36) and the Hospital Anxiety and Depression Scale (HADS) in 31 participants. There were baseline imbalances in HADS anxiety score and SF‐36 Mental component scale between the two groups. Health‐related quality of life did not differ over time between participants in higher‐dose and lower‐dose ghrelin groups. However, participants receiving higher‐dose ghrelin had less anxiety and scored better for mental health at inclusion compared to participants receiving lower‐dose ghrelin (Table 2).
Strasser 2008 did not assess quality of life.
Discussion
Summary of main results
We included three studies reporting data from 47 participants (59 randomised initially), aged 54 to 78 years, comparing ghrelin with placebo, or higher‐dose ghrelin with lower‐dose ghrelin. None of the included studies assessed data on body weight and survival. One trial (Neary 2004), which compared ghrelin with placebo, found that ghrelin improved food intake and had no adverse events. Two studies (Lundholm 2010; Strasser 2008), which compared higher‐dose ghrelin with lower‐dose ghrelin, individually showed that participants on higher‐dose ghrelin had greater improvement in food intake, body composition, plasma ghrelin and quality of life. Reporting of adverse events provided no information. All the included studies were at high risk of attrition bias and other bias due to small size. Risk of bias in other domains were mostly low or unclear.
Due to differences in study designs (parallel and cross‐over) and diversity in the treatment provided (dosage, route of administration, frequency and duration of treatment), we could not undertake meta‐analysis. We are unable to make any judgement about the efficacy or safety of ghrelin for improving food intake, body composition and survival in people with cachexia associated with cancer. We found insufficient evidence that using ghrelin showed changes in food intake. We found no evidence that using ghrelin alone or in combination made any difference to body weight. No conclusions could be reached about adverse events. The limited amount of information means that we cannot draw any conclusions.
The evidence we found was very low quality and the true effect is very likely to be substantially different from that reported. The very low GRADE judgement was based on lack of data, methodological limitations of the included studies, and overall small study size (summary of findings Table 1; summary of findings Table 2; summary of findings Table 3; summary of findings Table 4).
Results of the studies available are insufficient to draw any conclusions regarding safety and efficacy of ghrelin in treating people with cancer cachexia. The evidence is insufficient to support or refute its use.
Overall completeness and applicability of evidence
This review highlights our lack of knowledge about the effectiveness of ghrelin for cancer cachexia. We found three studies that met our inclusion criteria. The three included studies randomised 59 participants and 47 participants completed the study. One cross‐over trial (Neary 2004) compared ghrelin with placebo while two trials, one cross‐over (Strasser 2008) and one parallel trial (Lundholm 2010) compared different doses of ghrelin (higher‐dose versus lower‐dose). We did not find studies that compared ghrelin versus no treatment or alternative experimental treatment modality or ghrelin analogues/ghrelin mimetics/ghrelin potentiators/enhancers; or in combination with other treatments. Outcomes of interest to people with cancer cachexia, such as improvement in food intake, body weight and survival were not adequately reported.
There is a small body of evidence that we were able to include in this review, which limits the conclusions we can draw. We found insufficient evidence that using ghrelin showed improvement in food intake. We found no evidence that using ghrelin alone or in combination made any difference to body weight. There is insufficient evidence to be able to conclude that ghrelin is effective and has no major adverse events in people with cancer cachexia.
Limited data from very few included studies with small sample sizes in this systematic review confirms the need for further large randomised controlled trials with long‐term follow‐up focusing on evaluation of efficacy of ghrelin as well as adverse events associated with use of ghrelin in people with cancer cachexia. We look forward to such trials being available for inclusion in future updates of this review.
Quality of the evidence
The quality of evidence for all our primary outcomes was very low, meaning we have little confidence in the effect estimate and the true effect may be substantially different from the estimate of the effect. In general, the assessment of the quality of the included studies was too limited by deficiencies in terms of quality of methodology and reporting of adequate data, and small study size to allow reasonable conclusions to be drawn. Sample sizes of all included studies were likely to be under‐powered to find a true effect, as they involved fewer than 50 participants.
The quality of evidence for ghrelin versus placebo across all our primary outcomes was very low, due to too few data and due to the fact that the number of events was too small to be meaningful (summary of findings Table 1).
The quality of evidence for ghrelin versus no treatment or alternative experimental treatment modalities or ghrelin in combination with other treatments or ghrelin analogues/ghrelin mimetics/ghrelin potentiators across our primary outcomes was very low, due to no available data (summary of findings Table 2; summary of findings Table 3).
The quality of evidence for higher‐dose ghrelin versus lower‐dose ghrelin for all our primary outcomes was very low, due to high risk of attrition bias and biases confounded by small size, too few data and the number of events too small to be meaningful (summary of findings Table 4).
This review does not provide a reliable indication of the likely effect. As a result, there is no evidence to support or refute the use of ghrelin in people with cancer cachexia.
Potential biases in the review process
We have estimated that the potential bias in the review process is low. The search was as comprehensive as possible. The evaluation of trials for inclusion was done in pairs. None of the authors of this review were involved in any of the included or excluded studies. Furthermore, none have any commercial or any other conflicts of interest regarding ghrelin. We are confident that we have included all relevant published studies. We have attempted to reduce bias in the review process by performing data extraction and assessing study quality independently. However, the possibility remains that we may have missed studies which have not been published.
We undertook the review in line with the recommendations of Cochrane as outlined in the Cochrane Handbook for Systematic Reviews of Interventions (Higgins 2011b)
The authors of this review are from different disciplines with different focuses (e.g. public health, biostatistics, clinical medicine, nutrition). We consider this internal variety of expertise to be a strength of this review and made use of it by duplicating procedures during the entire review process when possible.
Agreements and disagreements with other studies or reviews
This is the first systematic review of ghrelin for the management of cachexia associated with cancer. Numerous studies have tried to summarise the applicability of ghrelin for cancer cachexia but have not have used a systematic approach (Argilés 2013; Garcia 2013; Molfino 2014).
We identified one non Cochrane systematic review (Sever 2016) involving human and animal in vivo studies to assess the safety and efficacy of ghrelin/ghrelin analogues on the risk, presence, or growth of tumours in people with cancer or animal models of cancer, irrespective of the presence or absence of cachexia. The authors could not undertake any meta‐analysis but suggested that the safety profile of ghrelin and ghrelin analogues may be favourable for the treatment of cachexia in people with cancer.

Study flow diagram

Risk of bias graph: review authors' judgements about each risk of bias item presented as percentages across all included studies

Risk of bias summary: review authors' judgements about each risk of bias item for each included study
| Ghrelin compared to placebo for cachexia associated with cancer | ||||||
| Patient or population: people with cachexia associated with cancer Settings: hospital | ||||||
| Outcomes | Anticipated absolute effects* (95% CI) | Relative effect | № of participants | Quality of the evidence | Comments | |
|---|---|---|---|---|---|---|
| Risk with placebo | Risk with ghrelin | |||||
| Food intake | Not known | Not known | Not known | 7 | ⊕⊝⊝⊝ | The study reported, "31% increase in energy intake with ghrelin infusion" Too few data to be meaningful |
| Body weight | No data | No data | No data | No data | ⊕⊝⊝⊝ | Not reported. No data available. No evidence to support or refute the use of ghrelin in people with cancer cachexia |
| Adverse events | Study population | Not estimable | 7 | ⊕⊝⊝⊝ | The study reported, "No side effects were observed" Too few data and number of events too small to be meaningful | |
| 0 per 1000 | 0 per 1000 | |||||
| *The risk in the intervention group (and its 95% confidence interval) is based on the assumed risk in the comparison group and the relative effect of the intervention (and its 95% CI). | ||||||
| GRADE Working Group grades of evidence | ||||||
| 1Downgraded once for study limitations due to high risk of attrition bias and biases confounded by small size. | ||||||
| Ghrelin compared to alternative experimental treatment modality for cachexia associated with cancer | ||||||
| Patient or population: people with cancer cachexia Settings: hospital | ||||||
| Outcomes | Anticipated absolute effects* (95% CI) | Relative effect | № of participants | Quality of the evidence | Comments | |
|---|---|---|---|---|---|---|
| Risk with alternative experimental treatment modality | Risk with ghrelin | |||||
| Food intake | No data | No data | No data | No data | ⊕⊝⊝⊝ | Not reported. No evidence to support or refute the use of ghrelin in people with cancer cachexia. |
| Body weight | No data | No data | No data | No data | ⊕⊝⊝⊝ | Not reported. No evidence to support or refute the use of ghrelin in people with cancer cachexia. |
| Adverse events | No data | No data | No data | No data | ⊕⊝⊝⊝ | Not reported. No evidence to support or refute the use of ghrelin in people with cancer cachexia. |
| *The risk in the intervention group (and its 95% confidence interval) is based on the assumed risk in the comparison group and the relative effect of the intervention (and its 95% CI). | ||||||
| GRADE Working Group grades of evidence | ||||||
| 1In circumstances where there were no data reported for an outcome, we report the level of evidence as 'very low' with no evidence to support or refute the use of ghrelin in people with cancer cachexia. | ||||||
| Ghrelin in combination with other treatments compared to ghrelin treatment alone for cachexia associated with cancer | ||||||
| Patient or population: people with cancer cachexia Settings: hospital | ||||||
| Outcomes | Anticipated absolute effects* (95% CI) | Relative effect | № of participants | Quality of the evidence | Comments | |
|---|---|---|---|---|---|---|
| Risk with ghrelin treatment alone | Risk with ghrelin in combination with other treatments | |||||
| Food intake | No data | No data | No data | No data | ⊕⊝⊝⊝ | Not reported. No evidence to support or refute the use of ghrelin in people with cancer cachexia. |
| Body weight | No data | No data | No data | No data | ⊕⊝⊝⊝ | Not reported. No evidence to support or refute the use of ghrelin in people with cancer cachexia. |
| Adverse events | No data | No data | No data | No data | ⊕⊝⊝⊝ | Not reported. No evidence to support or refute the use of ghrelin in people with cancer cachexia. |
| *The risk in the intervention group (and its 95% confidence interval) is based on the assumed risk in the comparison group and the relative effect of the intervention (and its 95% CI). | ||||||
| GRADE Working Group grades of evidence | ||||||
| 1In circumstances where there were no data reported for an outcome, we report the level of evidence as 'very low' with no evidence to support or refute the use of ghrelin in people with cancer cachexia. | ||||||
| Higher‐dose ghrelin compared to lower‐dose ghrelin for cachexia associated with cancer | ||||||
| Patient or population: people with cancer cachexia Settings: hospital | ||||||
| Outcomes | Anticipated absolute effects* (95% CI) | Relative effect | № of participants | Quality of the evidence | Comments | |
|---|---|---|---|---|---|---|
| Risk with lower‐dose ghrelin | Risk with higher‐dose ghrelin | |||||
| Food intake | See comment | See comment | N/A | 40 | ⊕⊝⊝⊝ | Too few data to be meaningful Because of the differences in study design and diversity in the treatment provided we did not pool results in a meta‐analysis |
| Body weight | No data | No data | No data | No data | ⊕⊝⊝⊝ | Not reported. No evidence to support or refute the use of ghrelin in people with cancer cachexia. |
| Adverse events | Study population | Not estimable | 40 | ⊕⊝⊝⊝ | Too few data to be meaningful | |
| See comment | See comment | |||||
| *The risk in the intervention group (and its 95% confidence interval) is based on the assumed risk in the comparison group and the relative effect of the intervention (and its 95% CI). | ||||||
| GRADE Working Group grades of evidence | ||||||
| 1Downgraded once for study limitations due to high risk of attrition bias and biases confounded by small size. | ||||||
| Primary outcome | ||||||
|---|---|---|---|---|---|---|
| Higher‐dose ghrelin group | Lower‐dose ghrelin group | Ghrelin group | Placebo group | Higher‐dose ghrelin group | Lower‐dose ghrelin group | |
| Food intake | Baseline: 32.5 ± 94 (SEM) kcal/kg/day At 8 weeks: 28.2 ± 3.8 (SEM) kcal/kg/day According to 4‐day schedule | Baseline: 24.1 ± 3.0 (SEM) kcal/kg/day At 8 weeks: 25.5 ± 4.5 (SEM) kcal/kg/day According to 4‐day schedule | Mean energy intake: 9270 kJ (95% CI 3249 to 15,290 kJ) As assessed by 24‐h food diary | Mean energy intake: 6854 kJ (95% CI 3634 to 10,070 kJ) As assessed by 24‐h food diary | Nutritrional intake at lunch compared to baseline Ghrelin: 251 kcal Placebo: 230 kcal Nutritrional intake at lunch and rest of the day compared to baseline Ghrelin: 244 kcal Placebo: 156 kcal Monitored daily | Nutritrional intake at lunch compared to baseline Ghrelin: ‐105 kcal Placebo: ‐17 kcal Nutritrional intake at lunch and rest of the day compared to baseline Ghrelin: 145 kcal Placebo: 228 kcal Monitored daily |
| Body weight | Not reported | Not reported | Not reported | Not reported | Not reported | Not reported |
| Adverse events | Nil | Nil | Nil | Nil | Ghrelin: 17 (increased bowel activity: 5; abdominal pain: 5; dry mouth: 3; worsening of pre‐existing neuropathy: 1; asthenia: 1; diarrhoea: 1; nausea: 1) Placebo: 6 (increased bowel activity: 3; dry mouth: 1; dizziness: 1; diarrhoea: 1) | Ghrelin: 7 (increased bowel activity: 3; shortness of breath: 1; sweating: 2; vomiting: 1) Placebo: 12 (increased bowel activity: 5; shortness of breath: 1; nausea: 1; increased stool frequency: 1; apoplectiform deafness: 1; vomiting: 2; constipation: 1) |
| SEM: standard error of mean | ||||||
| Secondary Outcomes | ||||||
|---|---|---|---|---|---|---|
| Higher‐dose ghrelin group | Lower‐dose ghrelin group | Ghrelin group | Placebo group | Higher‐dose ghrelin group | Lower‐dose ghrelin group | |
| Survival | Not reported | Not reported | Not reported | Not reported | Not reported | Not reported |
| Body composition (lean body mass) | Baseline: 44.8 ± 2.9 (SEM) kg At 8 weeks: 47.8 ± 2.9 (SEM) kg Difference over time: 2.24 ± 0.71 (SEM) | Baseline: 44.3 ± 2.2 (SEM) kg At 8 weeks: 45.1 ± 2.8 (SEM) kg Difference over time: 0.86 ± 1.18 (SEM) | Not reported | Not reported | Not reported | Not reported |
| Mean difference 1.38 kg (95% CI ‐1.32 to 4.08) | ||||||
| Body composition (fat mass) | Baseline: 15.1 ± 1.9 (SEM) kg At 8 weeks: 13.5 ± 1.9 (SEM) kg Difference over time: ‐1.3 ± 0.7 (SEM) | Baseline: 16.3 ± 3.0 (SEM) kg At 8 weeks: 12.6 ± 2.4 (SEM) kg Difference over time: ‐3.7 ± 0.8 (SEM) | Not reported | Not reported | Not reported | Not reported |
| Mean difference 2.40 kg (95% CI 0.32 to 4.48 | ||||||
| Plasma ghrelin | Baseline: 563 ± 90 (SEM) ng/L At 8 weeks: 1229 ± 501 (SEM) ng/L | Baseline: 3418 ± 2570 (SEM) ng/L At 8 weeks: 3817 ± 2997 (SEM) ng/L | 0 min (pre‐breakfast): 531 ± 83 (SEM) 90 min (at the start of infusion): 505 ± 90 (SEM) 150 min (60 min after the start of infusion): 1718 ± 169 (SEM) 180 min (90 min after the start of infusion): 1840 ± 221 (SEM) | 0 min (pre‐breakfast): 545 ± 58 (SEM) 90 min (at the start of infusion): 440 ± 59 (SEM) 150 min (60 min after the start of infusion): 509 ± 97 (SEM) 180 min (90 min after the start of infusion): 490 ± 63 (SEM) | Not reported | Not reported |
| Baseline imbalances between the two groups | Mean difference 1209.00 pmoL/L (95% CI 827.08 to 1590.92) | |||||
| Quality of Life | HADS anxiety Baseline: 4.6 ± 1.07 (SEM) At 8 weeks: 5.4 ± 1.6 (SEM) | HADS anxiety Baseline: 8.6 ± 1.6 (SEM) At 8 weeks: 8.8 ± 1.3 (SEM) | Not reported | Not reported | Not reported | Not reported |
| Baseline imbalances between the two groups | ||||||
| HADS depression Baseline: 5.7 ± 0.9 (SEM) At 8 weeks: 6.8 ±1.2 (SEM) | HADS depression Baseline: 7.6 ±1.4 (SEM) At 8 weeks: 9.3 ± 1.9 (SEM) | Not reported | Not reported | Not reported | Not reported | |
| Mean difference ‐2.50 (95% CI ‐6.90 to 1.90) | ||||||
| SF‐36 PCS Baseline: 30 ± 3 (SEM) At 8 weeks: 27 ± 3 (SEM) | SF‐36 PCS Baseline: 35 ± 3 (SEM) At 8 weeks: 30 ± 2 (SEM) | Not reported | Not reported | Not reported | Not reported | |
| Mean difference ‐3.00 (95% CI ‐10.07 to 4.07) | ||||||
| SF‐36 MCS Baseline: 40 ± 3 (SEM) At 8 weeks: 41 ± 3 (SEM) | SF‐36 MCS Baseline: 30 ± 2 (SEM) At 8 weeks: 34 ± 4 (SEM) | Not reported | Not reported | Not reported | Not reported | |
| Baseline imbalances | ||||||
| CI: confidence interval | ||||||