Ejercicio para embarazadas con diabetes gestacional para mejorar los resultados maternos y fetales
Información
- DOI:
- https://doi.org/10.1002/14651858.CD012202.pub2Copiar DOI

- Base de datos:
-
- Cochrane Database of Systematic Reviews
- Versión publicada:
-
- 22 junio 2017see what's new
- Tipo:
-
- Intervention
- Etapa:
-
- Review
- Grupo Editorial Cochrane:
-
Grupo Cochrane de Embarazo y parto
- Copyright:
-
- Copyright © 2017 The Cochrane Collaboration. Published by John Wiley & Sons, Ltd.
Cifras del artículo
Altmetric:
Citado por:
Autores
Contributions of authors
Dr Julie Brown guarantees this review. Dr Gilles Ceysens and Dr Michel Boulvain prepared the original (Ceysens 2006) review upon which this review is based. For this review, Dr Brown joined the team to provide methodological support to update the review, which was split into two new reviews on: exercise for pregnant women with gestational diabetes, and exercise for pregnant women with pre‐existing diabetes. A new protocol (Ceysens 2016) was developed to inform this review.
Sources of support
Internal sources
-
Liggins Institute, University of Auckland, New Zealand.
Support for infrastructure to develop this protocol and update the review was received from the Liggins Institute, University of Auckland.
External sources
-
National Institute for Health Research (NIHR), UK.
NIHR Cochrane Programme Grant Project: 13/89/05 – Pregnancy and childbirth systematic reviews to support clinical guidelines, UK
Declarations of interest
Dr Gilles Ceysens ‐ none known.
Dr Julie Brown ‐ none known.
Dr Michel Boulvain received research funding from Centre de Recherche Clinique (Advanced researcher grant scheme (2007‐2010)) to study exercise in pregnancy. One of the studies was a randomised controlled trial evaluating the effects of exercise in women with gestational diabetes. This study may be eligible for inclusion in this review ‐ Michel Boulvain will not be involved in any decisions relating to the inclusion of his own study in this review. All tasks relating to that study (assessment for inclusion, risk of bias, data extraction) will be carried out by the other members of the review team who were not directly involved in the trial. In 2012, he was invited to speak at the DIP 2012 Congress on gestational diabetes and was reimbursed for travel and accommodation.
Acknowledgements
We acknowledge the contribution of Dr Rouiller, one of the authors of the original review (Ceysens 2006), who has since died.
We acknowledge the support from the Cochrane Pregnancy and Childbirth editorial team in Liverpool, the Australian and New Zealand Satellite of the Cochrane Pregnancy and Childbirth and the Liggins Institute, University of Auckland, New Zealand.
As part of the pre‐publication editorial process, this review has been commented on by three peers (an editor and two referees who are external to the editorial team) and the Group's Statistical Adviser.
This project was supported by the National Institute for Health Research, via Cochrane Infrastructure and Cochrane Programme Grant funding to Cochrane Pregnancy and Childbirth. The views and opinions expressed therein are those of the authors and do not necessarily reflect those of the Systematic Reviews Programme, NIHR, NHS or the Department of Health.
Version history
| Published | Title | Stage | Authors | Version |
| 2017 Jun 22 | Exercise for pregnant women with gestational diabetes for improving maternal and fetal outcomes | Review | Julie Brown, Gilles Ceysens, Michel Boulvain | |
| 2016 May 17 | Exercise for pregnant women with gestational diabetes for improving maternal and fetal outcomes | Protocol | Gilles Ceysens, Julie Brown, Michel Boulvain | |
Differences between protocol and review
There are some differences between our published protocol (Ceysens 2016) and this full review.
Dr Julie Brown has now taken over the role of contact person and guarantor for this review.
Methods/types of outcomes ‐ we edited the outcome 'Large for gestational age' to include the criterion '(≥ 4 kg)'.
Methods/Assessment of the quality of the body of evidence using the GRADE approach ‐ for consistency, we edited some outcome names to match the list of outcomes in the main methods. This relates to the following outcomes.
Maternal
-
'Hypertensive disorders of pregnancy' has now been edited to 'Hypertensive disorders of pregnancy (as reported by trialists, including pre‐eclampsia, pregnancy‐induced hypertension, eclampsia)'
-
'Perineal trauma' has now been edited to 'Perineal trauma/tearing'
-
'Return to pre‐pregnancy weight' has now been edited to 'Postnatal weight retention or return to pre‐pregnancy weight'
Child (as a fetus, neonatal child or adult)
-
'Perinatal mortality' has been edited to 'Perinatal mortality (stillbirth and neonatal mortality)'
-
'Composite outcome of serious neonatal outcomes' has been edited to 'Mortality and morbidity composite (variously defined by trials, e.g. perinatal or infant death, shoulder dystocia, bone fracture or nerve palsy)'
-
We clarified that 'Diabetes' could be either type 1 or type 2 and could relate to later infant, childhood or for the child as an adult
-
We clarified that 'Adiposity' could relate to the neonate, later during infancy, childhood or for the child as an adult
Methods to be utilised in future updates, as appropriate
Data collection and analysis
Unit of analysis issues
Multiple‐arm studies
We will avoid 'double‐counting' of participants by combining group to create a single pair‐wise comparison, if possible. In this version of the review it was not possible to do this so we split the 'shared' group into two or more groups with smaller sample sizes to include two or more reasonably independent comparisons.
Sensitivity analysis
Planned sensitivity analyses were not carried out because we did not observe substantial heterogeneity in our analysis and did not include cluster‐randomised controlled trials. We will perform planned sensitivity analyses for the review's primary outcomes in future updates, if appropriate.
Subgroup analysis and investigation of heterogeneity
Planned subgroup analyses were not carried out due to insufficient data ‐ these will be performed in future updates, if appropriate.
Keywords
MeSH
Medical Subject Headings (MeSH) Keywords
Medical Subject Headings Check Words
Adult; Female; Humans; Infant; Infant, Newborn; Pregnancy;
PICO
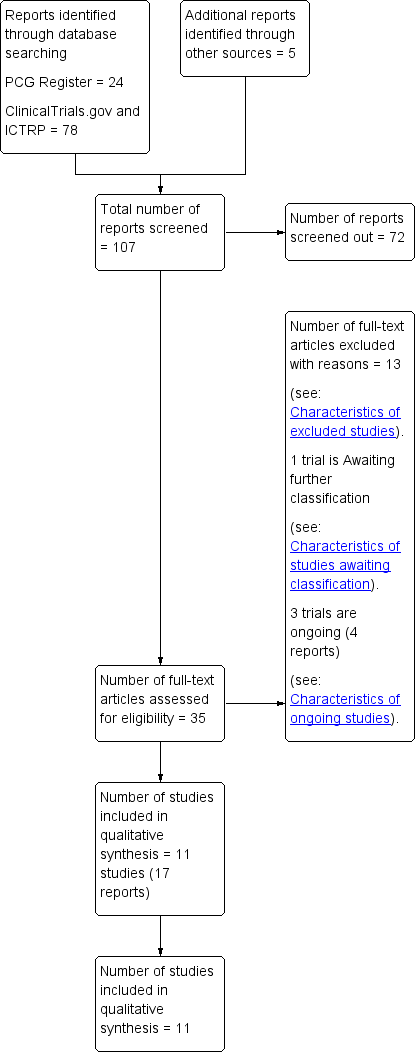
Study flow diagram.

'Risk of bias' graph: review authors' judgements about each risk of bias item presented as percentages across all included studies.
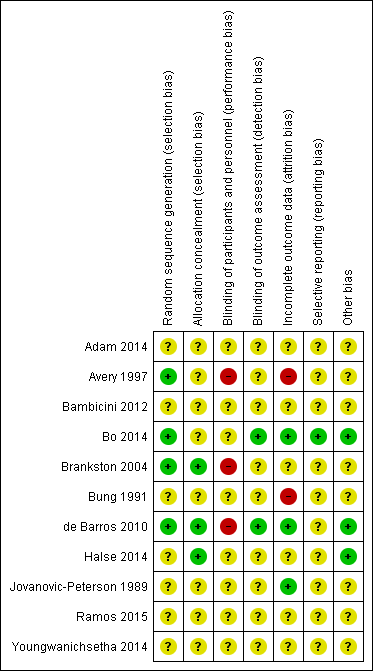
'Risk of bias' summary: review authors' judgements about each risk of bias item for each included study.

Comparison 1 Exercise versus control, Outcome 1 Hypertensive disorders of pregnancy (pre‐eclampsia).
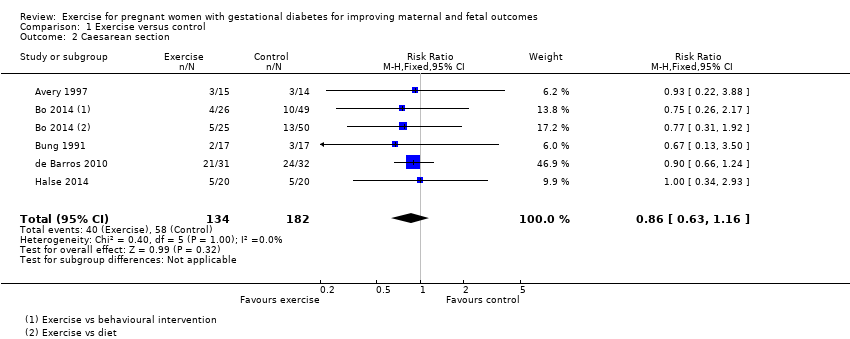
Comparison 1 Exercise versus control, Outcome 2 Caesarean section.

Comparison 1 Exercise versus control, Outcome 3 Perinatal mortality (stillbirth and neonatal mortality).
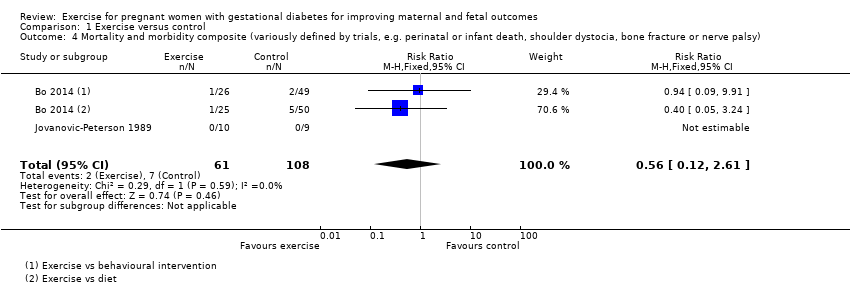
Comparison 1 Exercise versus control, Outcome 4 Mortality and morbidity composite (variously defined by trials, e.g. perinatal or infant death, shoulder dystocia, bone fracture or nerve palsy).
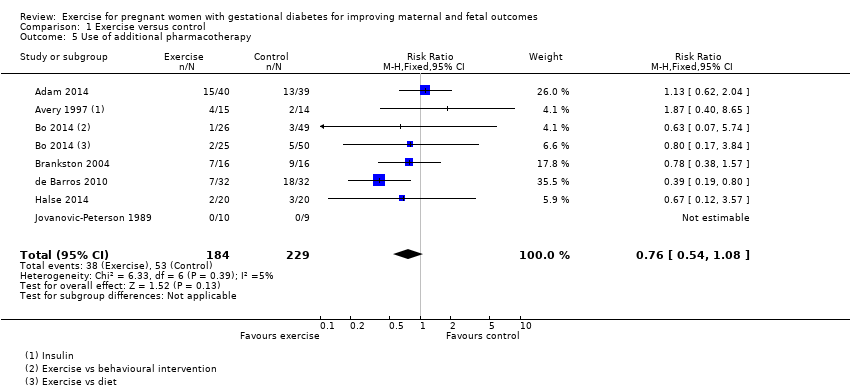
Comparison 1 Exercise versus control, Outcome 5 Use of additional pharmacotherapy.
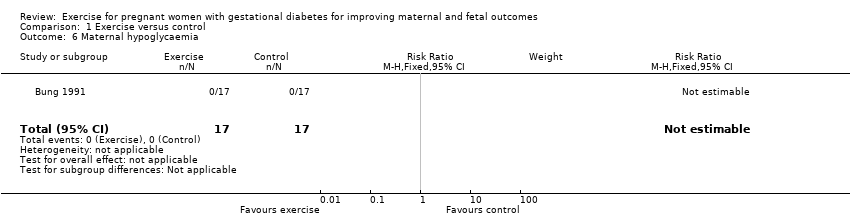
Comparison 1 Exercise versus control, Outcome 6 Maternal hypoglycaemia.

Comparison 1 Exercise versus control, Outcome 7 Glycaemic control end of treatment (Mean).
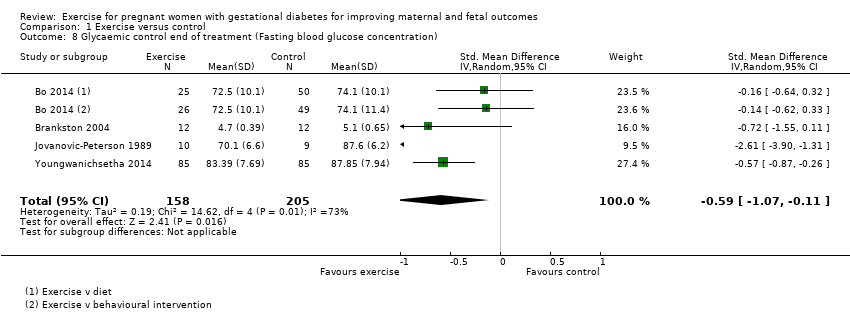
Comparison 1 Exercise versus control, Outcome 8 Glycaemic control end of treatment (Fasting blood glucose concentration).
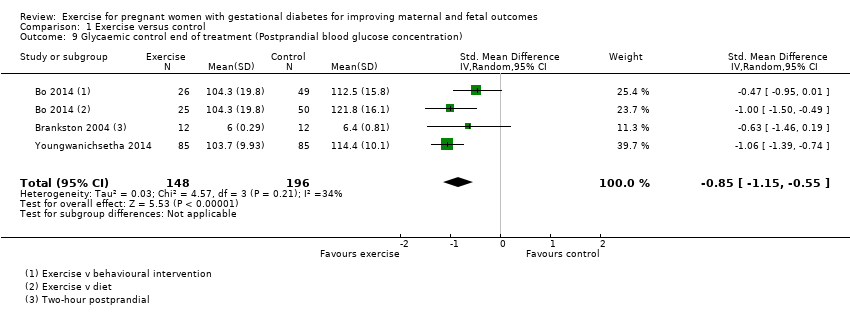
Comparison 1 Exercise versus control, Outcome 9 Glycaemic control end of treatment (Postprandial blood glucose concentration).

Comparison 1 Exercise versus control, Outcome 10 Glycaemic control end of treatment (HbA1c).
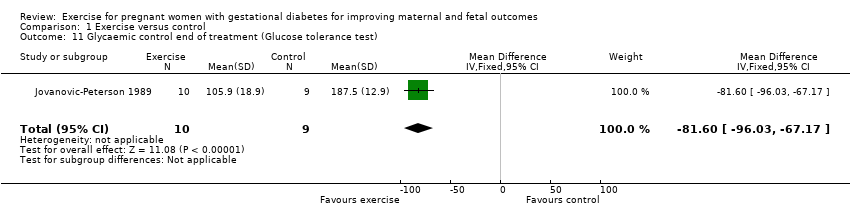
Comparison 1 Exercise versus control, Outcome 11 Glycaemic control end of treatment (Glucose tolerance test).

Comparison 1 Exercise versus control, Outcome 12 Weight gain in pregnancy.

Comparison 1 Exercise versus control, Outcome 13 Weight gain in pregnancy (Excessive).

Comparison 1 Exercise versus control, Outcome 14 Adherence to the intervention.
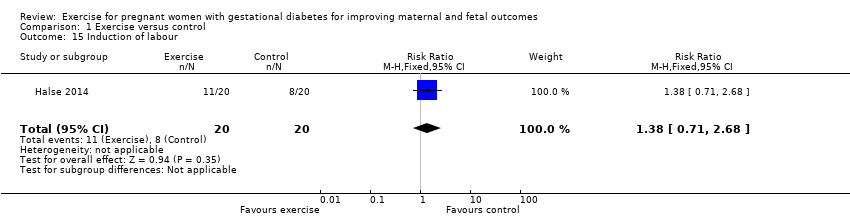
Comparison 1 Exercise versus control, Outcome 15 Induction of labour.
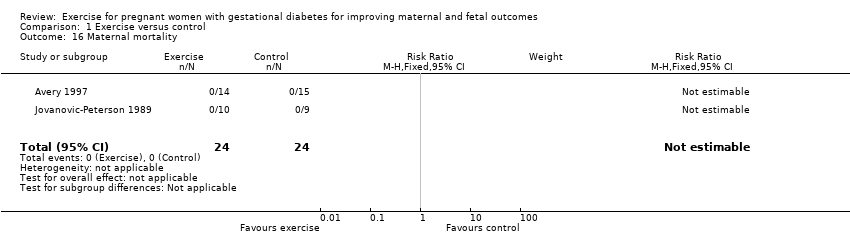
Comparison 1 Exercise versus control, Outcome 16 Maternal mortality.

Comparison 1 Exercise versus control, Outcome 17 Views of the intervention (favourable).
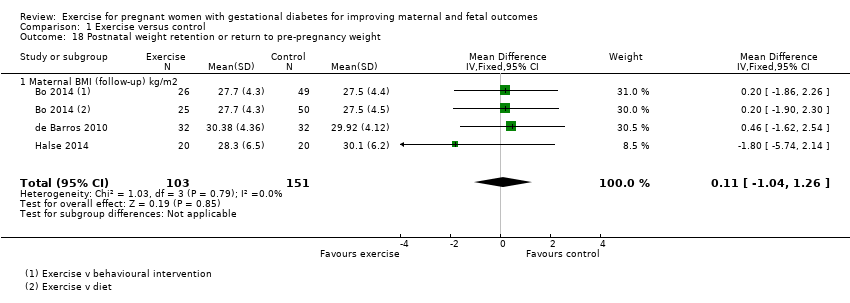
Comparison 1 Exercise versus control, Outcome 18 Postnatal weight retention or return to pre‐pregnancy weight.
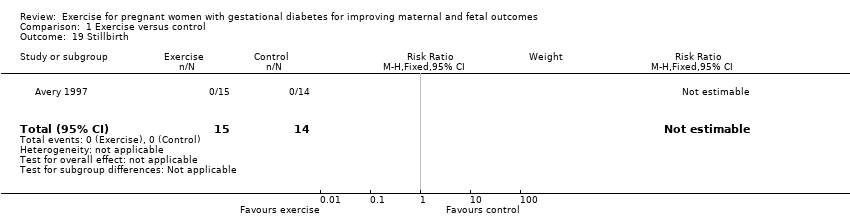
Comparison 1 Exercise versus control, Outcome 19 Stillbirth.

Comparison 1 Exercise versus control, Outcome 20 Macrosomia.

Comparison 1 Exercise versus control, Outcome 21 Gestational age at birth.
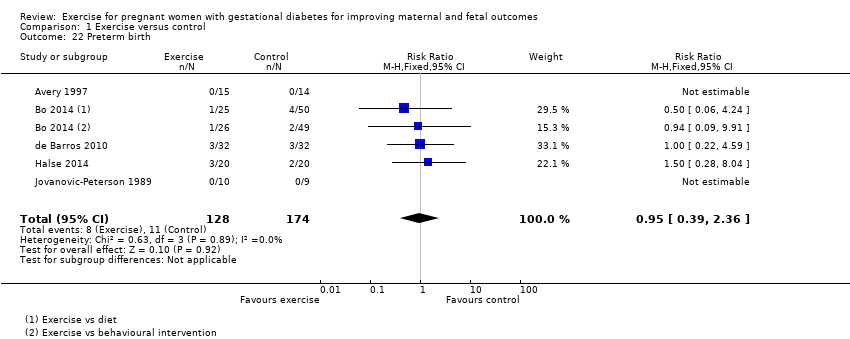
Comparison 1 Exercise versus control, Outcome 22 Preterm birth.

Comparison 1 Exercise versus control, Outcome 23 Five‐minute Apgar < seven.

Comparison 1 Exercise versus control, Outcome 24 Birthweight.

Comparison 1 Exercise versus control, Outcome 25 Length (cm) (at birth).

Comparison 1 Exercise versus control, Outcome 26 Neonatal hypoglycaemia.
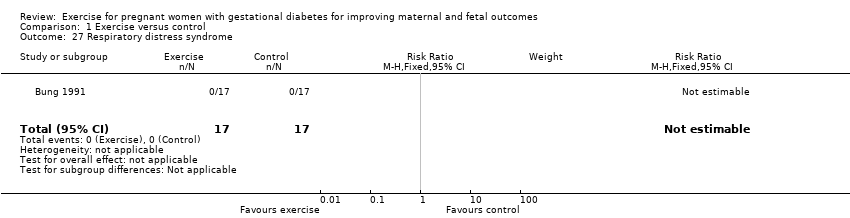
Comparison 1 Exercise versus control, Outcome 27 Respiratory distress syndrome.

Comparison 1 Exercise versus control, Outcome 28 Neonatal jaundice (hyperbilirubinaemia).

Comparison 1 Exercise versus control, Outcome 29 Hypocalcaemia.
| Exercise compared to control for pregnant women with gestational diabetes for improving maternal outcomes | ||||||
| Patient or population: pregnant women with gestational diabetes | ||||||
| Outcomes | Anticipated absolute effects* (95% CI) | Relative effect | № of participants | Quality of the evidence | Comments | |
| Risk with control | Risk with exercise | |||||
| Hypertensive disorders of pregnancy (pre‐eclampsia) | 43 per 1000 | 13 per 1000 | RR 0.31 | 48 | ⊕⊕⊝⊝ | Event rates were very low with 0/25 in the exercise group and 1/23 in the control group. No data were reported for pregnancy‐induced hypertension or eclampsia. |
| Caesarean section | 319 per 1000 | 274 per 1000 | RR 0.86 | 316 | ⊕⊕⊕⊝ | |
| Development of type 2 diabetes ‐ not measured | ‐ | ‐ | ‐ | ‐ | ‐ | This outcome was not measured in any of the included studies in this review. |
| Perineal trauma/tearing ‐ not measured | ‐ | ‐ | ‐ | ‐ | ‐ | This outcome was not measured in any of the included studies in this review. |
| Postnatal weight retention or return to pre‐pregnancy weight (maternal BMI (follow‐up) kg/m2) | The mean maternal BMI (follow‐up) kg/m2 was 0 | MD 0.11 higher | ‐ | 254 | ⊕⊕⊕⊕ | |
| Postnatal depression ‐ not measured | ‐ | ‐ | ‐ | ‐ | ‐ | This outcome was not measured in any of the included studies in this review. |
| Induction of labour | 400 per 1000 | 552 per 1000 | RR 1.38 | 40 | ⊕⊕⊝⊝ | Event rates and sample size were low 11/20 in exercise group and 8/20 in control group. |
| *The risk in the intervention group (and its 95% confidence interval) is based on the assumed risk in the comparison group and the relative effect of the intervention (and its 95% CI). | ||||||
| GRADE Working Group grades of evidence | ||||||
| 1 Lack of clarity for most items related to risk of bias ‐ downgraded one level. 2 Wide confidence intervals crossing the line of no effect and low event rates with a small sample size are suggestive of imprecision ‐ downgraded one level. 3 Imprecision ‐ low event rates and small sample size ‐ downgraded one level. | ||||||
| Exercise compared to control for pregnant women with gestational diabetes for improving maternal and fetal outcomes | ||||||
| Patient or population: pregnant women with gestational diabetes Setting: USA, Italy | ||||||
| Outcomes | Anticipated absolute effects* (95% CI) | Relative effect | № of participants | Quality of the evidence | Comments | |
| Risk with control | Risk with exercise | |||||
| Large‐for‐gestational age ‐ not reported | ‐ | ‐ | ‐ | ‐ | ‐ | None of the included studies in this review reported data for this outcome. |
| Perinatal mortality (stillbirth and neonatal mortality) | 0 per 1000 | 0 per 1000 | not estimable | 19 | ⊕⊕⊝⊝ | There were no events in either the exercise or the control group and the sample size in only 19 infants. |
| Mortality and morbidity composite (variously defined by trials, e.g. perinatal or infant death, shoulder dystocia, bone fracture or nerve palsy) | 65 per 1000 | 36 per 1000 | RR 0.56 | 169 | ⊕⊕⊕⊝ | Event rates and sample size were low with 2/61 in the exercise group and 7/108 in the control group. |
| Neonatal hypoglycaemia | 59 per 1000 | 118 per 1000 | RR 2.00 | 34 | ⊕⊕⊝⊝ | Event rates and sample size were low with 2/17 in the exercise group and 1/17 in the control group. |
| Adiposity ‐ not reported | ‐ | ‐ | ‐ | ‐ | ‐ | None of the included studies in this review reported data for this outcome at any life stage. |
| Diabetes (type 1, type 2) ‐ not reported | ‐ | ‐ | ‐ | ‐ | ‐ | None of the included studies in this review reported data for this outcome at any life stage. |
| Neurosensory disability | ‐ | ‐ | ‐ | ‐ | ‐ | None of the included studies in this review reported data for this outcome. |
| *The risk in the intervention group (and its 95% confidence interval) is based on the assumed risk in the comparison group and the relative effect of the intervention (and its 95% CI). | ||||||
| GRADE Working Group grades of evidence | ||||||
| 1 There is a lack of clarity for most items associated with risk of bias ‐ downgraded one level. 2 Imprecision ‐ There are no events in either group and the sample size is only 19 infants ‐ downgraded one level. 3 Imprecision ‐ wide confidence intervals and low event rates ‐ downgraded one level. | ||||||
| Outcome or subgroup title | No. of studies | No. of participants | Statistical method | Effect size |
| 1 Hypertensive disorders of pregnancy (pre‐eclampsia) Show forest plot | 2 | 48 | Risk Ratio (M‐H, Fixed, 95% CI) | 0.31 [0.01, 7.09] |
| 2 Caesarean section Show forest plot | 5 | 316 | Risk Ratio (M‐H, Fixed, 95% CI) | 0.86 [0.63, 1.16] |
| 3 Perinatal mortality (stillbirth and neonatal mortality) Show forest plot | 1 | 19 | Risk Ratio (M‐H, Fixed, 95% CI) | 0.0 [0.0, 0.0] |
| 4 Mortality and morbidity composite (variously defined by trials, e.g. perinatal or infant death, shoulder dystocia, bone fracture or nerve palsy) Show forest plot | 2 | 169 | Risk Ratio (M‐H, Fixed, 95% CI) | 0.56 [0.12, 2.61] |
| 5 Use of additional pharmacotherapy Show forest plot | 7 | 413 | Risk Ratio (M‐H, Fixed, 95% CI) | 0.76 [0.54, 1.08] |
| 6 Maternal hypoglycaemia Show forest plot | 1 | 34 | Risk Ratio (M‐H, Fixed, 95% CI) | 0.0 [0.0, 0.0] |
| 7 Glycaemic control end of treatment (Mean) Show forest plot | 1 | 34 | Mean Difference (IV, Fixed, 95% CI) | 0.28 [0.04, 0.52] |
| 8 Glycaemic control end of treatment (Fasting blood glucose concentration) Show forest plot | 4 | 363 | Std. Mean Difference (IV, Random, 95% CI) | ‐0.59 [‐1.07, ‐0.11] |
| 9 Glycaemic control end of treatment (Postprandial blood glucose concentration) Show forest plot | 3 | 344 | Std. Mean Difference (IV, Random, 95% CI) | ‐0.85 [‐1.15, ‐0.55] |
| 10 Glycaemic control end of treatment (HbA1c) Show forest plot | 2 | 320 | Mean Difference (IV, Fixed, 95% CI) | ‐0.43 [‐0.51, ‐0.35] |
| 11 Glycaemic control end of treatment (Glucose tolerance test) Show forest plot | 1 | 19 | Mean Difference (IV, Fixed, 95% CI) | ‐81.6 [‐96.03, ‐67.17] |
| 12 Weight gain in pregnancy Show forest plot | 2 | 104 | Mean Difference (IV, Fixed, 95% CI) | ‐0.34 [‐1.25, 0.58] |
| 13 Weight gain in pregnancy (Excessive) Show forest plot | 1 | 79 | Risk Ratio (M‐H, Fixed, 95% CI) | 0.9 [0.47, 1.72] |
| 14 Adherence to the intervention Show forest plot | 1 | 19 | Risk Ratio (M‐H, Fixed, 95% CI) | 1.0 [0.83, 1.21] |
| 15 Induction of labour Show forest plot | 1 | 40 | Risk Ratio (M‐H, Fixed, 95% CI) | 1.38 [0.71, 2.68] |
| 16 Maternal mortality Show forest plot | 2 | 48 | Risk Ratio (M‐H, Fixed, 95% CI) | 0.0 [0.0, 0.0] |
| 17 Views of the intervention (favourable) Show forest plot | 1 | 40 | Mean Difference (IV, Fixed, 95% CI) | 0.0 [0.0, 0.0] |
| 18 Postnatal weight retention or return to pre‐pregnancy weight Show forest plot | 3 | 254 | Mean Difference (IV, Fixed, 95% CI) | 0.11 [‐1.04, 1.26] |
| 18.1 Maternal BMI (follow‐up) kg/m2 | 3 | 254 | Mean Difference (IV, Fixed, 95% CI) | 0.11 [‐1.04, 1.26] |
| 19 Stillbirth Show forest plot | 1 | 29 | Risk Ratio (M‐H, Fixed, 95% CI) | 0.0 [0.0, 0.0] |
| 20 Macrosomia Show forest plot | 5 | 296 | Risk Ratio (M‐H, Fixed, 95% CI) | 0.69 [0.35, 1.35] |
| 21 Gestational age at birth Show forest plot | 4 | 167 | Mean Difference (IV, Fixed, 95% CI) | ‐0.01 [‐0.40, 0.38] |
| 22 Preterm birth Show forest plot | 5 | 302 | Risk Ratio (M‐H, Fixed, 95% CI) | 0.95 [0.39, 2.36] |
| 23 Five‐minute Apgar < seven Show forest plot | 1 | 34 | Risk Ratio (M‐H, Fixed, 95% CI) | 0.33 [0.01, 7.65] |
| 24 Birthweight Show forest plot | 6 | 192 | Mean Difference (IV, Fixed, 95% CI) | ‐61.50 [‐195.21, 72.20] |
| 25 Length (cm) (at birth) Show forest plot | 1 | 34 | Mean Difference (IV, Fixed, 95% CI) | ‐1.70 [‐3.41, 0.01] |
| 26 Neonatal hypoglycaemia Show forest plot | 1 | 34 | Risk Ratio (M‐H, Fixed, 95% CI) | 2.0 [0.20, 20.04] |
| 27 Respiratory distress syndrome Show forest plot | 1 | 34 | Risk Ratio (M‐H, Fixed, 95% CI) | 0.0 [0.0, 0.0] |
| 28 Neonatal jaundice (hyperbilirubinaemia) Show forest plot | 1 | 34 | Risk Ratio (M‐H, Fixed, 95% CI) | 0.33 [0.01, 7.65] |
| 29 Hypocalcaemia Show forest plot | 1 | 34 | Risk Ratio (M‐H, Fixed, 95% CI) | 0.0 [0.0, 0.0] |