| 1 Hypertensive disorders of pregnancy (pre‐eclampsia) Show forest plot | 2 | 48 | Risk Ratio (M‐H, Fixed, 95% CI) | 0.31 [0.01, 7.09] |
|
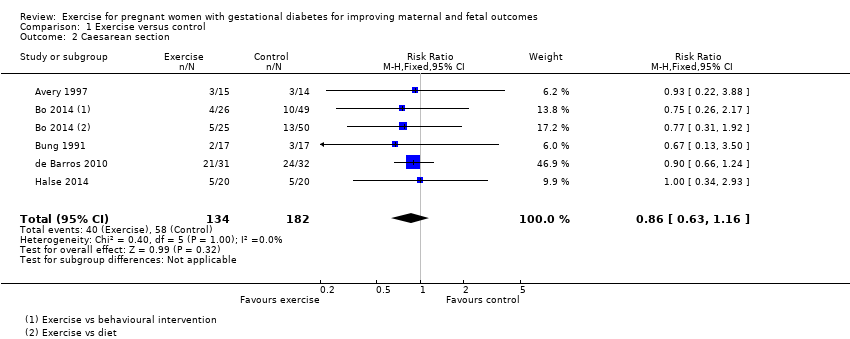
| 2 Caesarean section Show forest plot | 5 | 316 | Risk Ratio (M‐H, Fixed, 95% CI) | 0.86 [0.63, 1.16] |
|
| 3 Perinatal mortality (stillbirth and neonatal mortality) Show forest plot | 1 | 19 | Risk Ratio (M‐H, Fixed, 95% CI) | 0.0 [0.0, 0.0] |
|
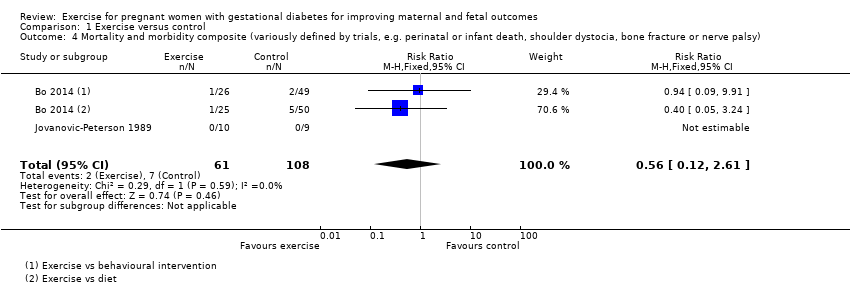
| 4 Mortality and morbidity composite (variously defined by trials, e.g. perinatal or infant death, shoulder dystocia, bone fracture or nerve palsy) Show forest plot | 2 | 169 | Risk Ratio (M‐H, Fixed, 95% CI) | 0.56 [0.12, 2.61] |
|
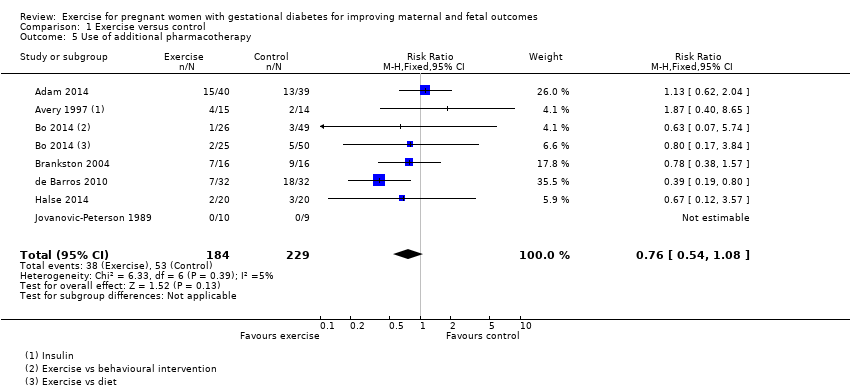
| 5 Use of additional pharmacotherapy Show forest plot | 7 | 413 | Risk Ratio (M‐H, Fixed, 95% CI) | 0.76 [0.54, 1.08] |
|
| 6 Maternal hypoglycaemia Show forest plot | 1 | 34 | Risk Ratio (M‐H, Fixed, 95% CI) | 0.0 [0.0, 0.0] |
|
| 7 Glycaemic control end of treatment (Mean) Show forest plot | 1 | 34 | Mean Difference (IV, Fixed, 95% CI) | 0.28 [0.04, 0.52] |
|
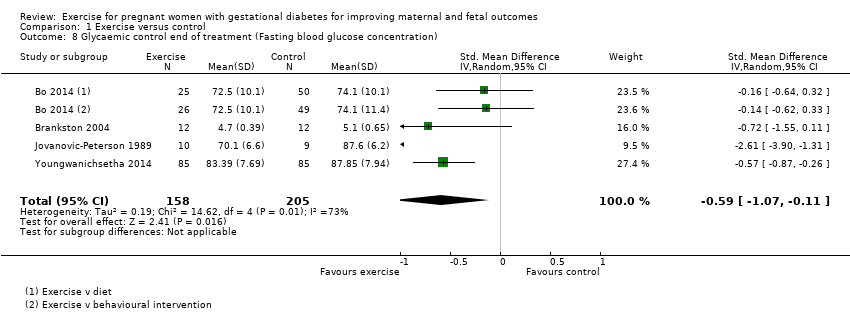
| 8 Glycaemic control end of treatment (Fasting blood glucose concentration) Show forest plot | 4 | 363 | Std. Mean Difference (IV, Random, 95% CI) | ‐0.59 [‐1.07, ‐0.11] |
|
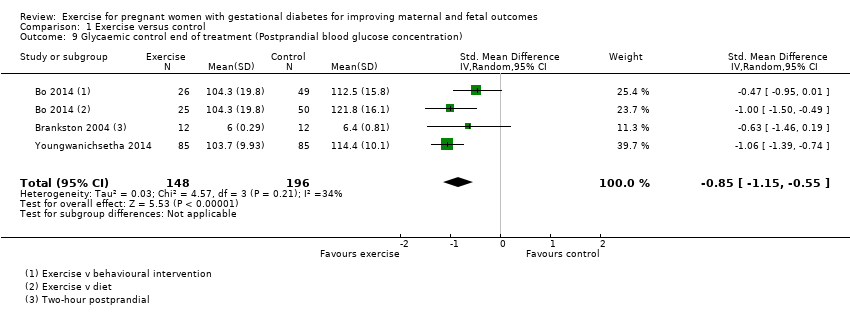
| 9 Glycaemic control end of treatment (Postprandial blood glucose concentration) Show forest plot | 3 | 344 | Std. Mean Difference (IV, Random, 95% CI) | ‐0.85 [‐1.15, ‐0.55] |
|
| 10 Glycaemic control end of treatment (HbA1c) Show forest plot | 2 | 320 | Mean Difference (IV, Fixed, 95% CI) | ‐0.43 [‐0.51, ‐0.35] |
|
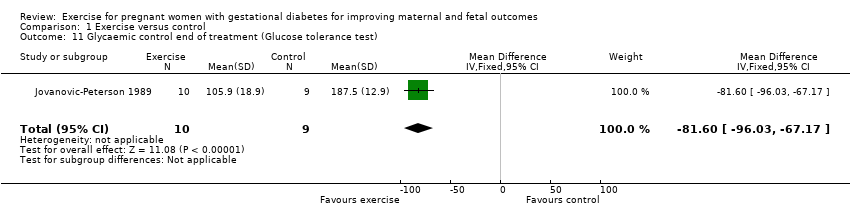
| 11 Glycaemic control end of treatment (Glucose tolerance test) Show forest plot | 1 | 19 | Mean Difference (IV, Fixed, 95% CI) | ‐81.6 [‐96.03, ‐67.17] |
|
| 12 Weight gain in pregnancy Show forest plot | 2 | 104 | Mean Difference (IV, Fixed, 95% CI) | ‐0.34 [‐1.25, 0.58] |
|
| 13 Weight gain in pregnancy (Excessive) Show forest plot | 1 | 79 | Risk Ratio (M‐H, Fixed, 95% CI) | 0.9 [0.47, 1.72] |
|
| 14 Adherence to the intervention Show forest plot | 1 | 19 | Risk Ratio (M‐H, Fixed, 95% CI) | 1.0 [0.83, 1.21] |
|
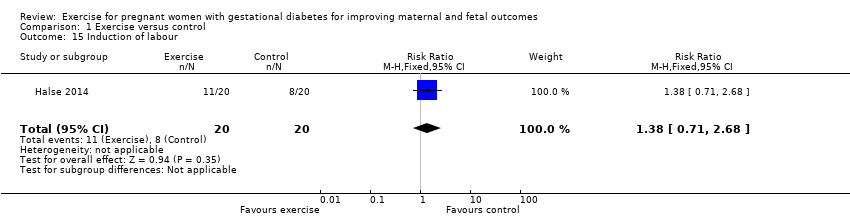
| 15 Induction of labour Show forest plot | 1 | 40 | Risk Ratio (M‐H, Fixed, 95% CI) | 1.38 [0.71, 2.68] |
|
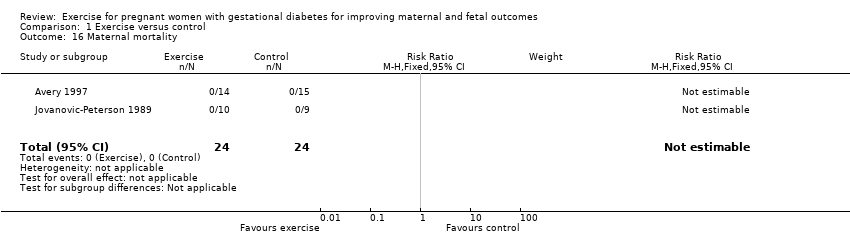
| 16 Maternal mortality Show forest plot | 2 | 48 | Risk Ratio (M‐H, Fixed, 95% CI) | 0.0 [0.0, 0.0] |
|
| 17 Views of the intervention (favourable) Show forest plot | 1 | 40 | Mean Difference (IV, Fixed, 95% CI) | 0.0 [0.0, 0.0] |
|
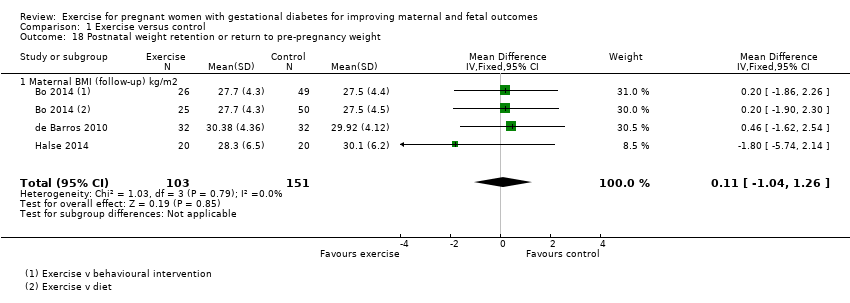
| 18 Postnatal weight retention or return to pre‐pregnancy weight Show forest plot | 3 | 254 | Mean Difference (IV, Fixed, 95% CI) | 0.11 [‐1.04, 1.26] |
|
| 18.1 Maternal BMI (follow‐up) kg/m2 | 3 | 254 | Mean Difference (IV, Fixed, 95% CI) | 0.11 [‐1.04, 1.26] |
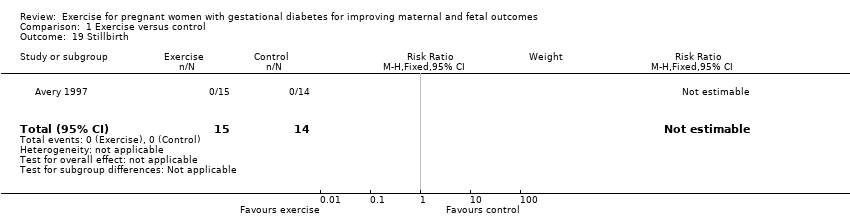
| 19 Stillbirth Show forest plot | 1 | 29 | Risk Ratio (M‐H, Fixed, 95% CI) | 0.0 [0.0, 0.0] |
|
| 20 Macrosomia Show forest plot | 5 | 296 | Risk Ratio (M‐H, Fixed, 95% CI) | 0.69 [0.35, 1.35] |
|
| 21 Gestational age at birth Show forest plot | 4 | 167 | Mean Difference (IV, Fixed, 95% CI) | ‐0.01 [‐0.40, 0.38] |
|
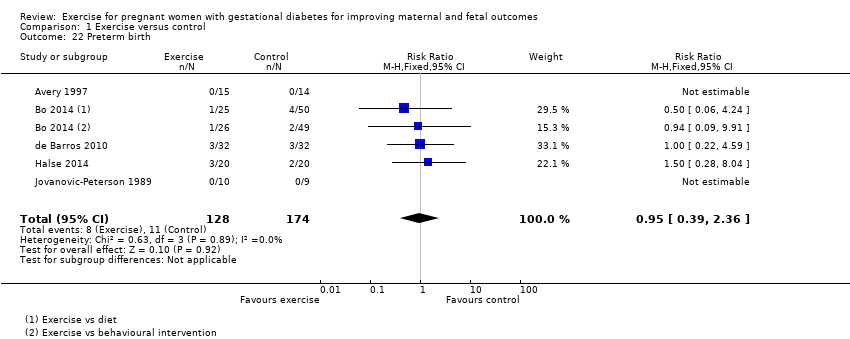
| 22 Preterm birth Show forest plot | 5 | 302 | Risk Ratio (M‐H, Fixed, 95% CI) | 0.95 [0.39, 2.36] |
|
| 23 Five‐minute Apgar < seven Show forest plot | 1 | 34 | Risk Ratio (M‐H, Fixed, 95% CI) | 0.33 [0.01, 7.65] |
|
| 24 Birthweight Show forest plot | 6 | 192 | Mean Difference (IV, Fixed, 95% CI) | ‐61.50 [‐195.21, 72.20] |
|
| 25 Length (cm) (at birth) Show forest plot | 1 | 34 | Mean Difference (IV, Fixed, 95% CI) | ‐1.70 [‐3.41, 0.01] |
|
| 26 Neonatal hypoglycaemia Show forest plot | 1 | 34 | Risk Ratio (M‐H, Fixed, 95% CI) | 2.0 [0.20, 20.04] |
|
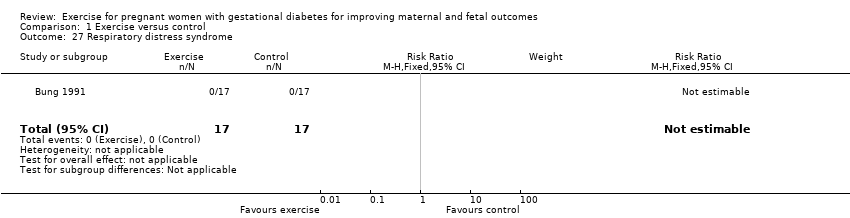
| 27 Respiratory distress syndrome Show forest plot | 1 | 34 | Risk Ratio (M‐H, Fixed, 95% CI) | 0.0 [0.0, 0.0] |
|
| 28 Neonatal jaundice (hyperbilirubinaemia) Show forest plot | 1 | 34 | Risk Ratio (M‐H, Fixed, 95% CI) | 0.33 [0.01, 7.65] |
|
| 29 Hypocalcaemia Show forest plot | 1 | 34 | Risk Ratio (M‐H, Fixed, 95% CI) | 0.0 [0.0, 0.0] |
|