Tratamiento con fármacos modificadores de la enfermedad para los pacientes con un primer episodio clínico indicativo de esclerosis múltiple
Información
- DOI:
- https://doi.org/10.1002/14651858.CD012200.pub2Copiar DOI

- Base de datos:
-
- Cochrane Database of Systematic Reviews
- Versión publicada:
-
- 25 abril 2017see what's new
- Tipo:
-
- Intervention
- Etapa:
-
- Review
- Grupo Editorial Cochrane:
-
Grupo Cochrane de Esclerosis múltiple y enfermedades raras del sistema nervioso central
- Copyright:
-
- Copyright © 2017 The Cochrane Collaboration. Published by John Wiley & Sons, Ltd.
Cifras del artículo
Altmetric:
Citado por:
Autores
Contributions of authors
Concept development ‐ GF, MC, OB, SF, AS
Title registration ‐ GF
Drafting of protocol ‐ GF, IT
Editing of protocol ‐ GF, MC, OB, SF, AS
Data abstraction ‐ GF, CDG, MC, OB, MM, FP, IT, AS, GS
Data analysis ‐ CDG, GS
Drafting the review ‐ GF, CDG, GS
Editing and revising the review ‐ GF, CDG, MC, OB, MM, FP, SF, IT, AS, GS
Sources of support
Internal sources
-
Foundation Neurological Institute Carlo Besta, Milan, Italy.
Support from the Institute to the Editorial Base of Cochrane Multiple Sclerosis and Rare Diseases of the CNS
External sources
-
Cochrane Review Support Programme, UK.
Funding support for this priority review.
-
Grant from the Swiss MS Society, Switzerland.
Cinzia Del Giovane received a grant that supported the review.
Declarations of interest
GF ‐ none. As Co‐ordinating Editor, Dr. Filippini was excluded from the editorial process to ensure separation of the review author from the editorial process. This included all editorial decisions and related activities (e.g. sign‐off for publication).
CDG ‐ received financial support for conducting the review process from a grant financed by Swiss MS Register. This had no bearing on, and did not influence, what has been written in the submitted work.
MC ‐ received personal compensation from Merck, Biogen, Novartis and Sanofi‐Genzyme for serving on advisory boards and for providing expert testimony as well as for travel/ accommodation/meeting expenses. Dr. Clerico's institution received some grants for research projects from Merck.
OB ‐ received salary from Cognizant Technology Solutions for epidemiological consultation for Pharma companies.
MM ‐ speaker honoraria from Merck Serono and Novartis; received financial support for travel/accommodation/meeting expenses from Biogen Idec, Novartis, Genzyme and Teva. This had no bearing on, and did not influence, what has been written in the submitted work.
FP ‐ none
SF ‐ received honoraria for consultancy, educational activities and/or lectures from Allergan, Bayer, Biogen, Genzyme, Merck, Novartis, Sanofi and Teva.
IT ‐ none
AS ‐ none
GS ‐ none
Acknowledgements
We thank Andrea Fittipaldo for developing the search strategy methods, Silvana Simi for assisting with writing the Plain language summary, and the Swiss Multiple Sclerosis Society for financial support for conducting the review.
Version history
| Published | Title | Stage | Authors | Version |
| 2017 Apr 25 | Treatment with disease‐modifying drugs for people with a first clinical attack suggestive of multiple sclerosis | Review | Graziella Filippini, Cinzia Del Giovane, Marinella Clerico, Omid Beiki, Miriam Mattoscio, Federico Piazza, Sten Fredrikson, Irene Tramacere, Antonio Scalfari, Georgia Salanti | |
| 2016 May 19 | Treatment with disease modifying drugs for people with a first clinical attack suggestive of multiple sclerosis | Protocol | Graziella Filippini, Marinella Clerico, Omid Beiki, Miriam Mattoscio, Federico Piazza, Cinzia Del Giovane, Sten Fredrikson, Irene Tramacere, Antonio Scalfari | |
Differences between protocol and review
-
Objectives. We expanded the research questions including:
-
is early treatment efficacious and safe compared to placebo or no treatment?;
-
are there differences in efficacy and safety between the various drugs administered for early treatment?;
-
is early treatment better than delayed treatment?
-
-
Outcomes. We added "time to conversion to clinically definite multiple sclerosis" as a secondary outcome.
-
Assessment of risk of bias in included studies. We evaluated risk of bias of the included open‐label extension studies using Cochrane 'Risk of bias' tool for RCTs (Higgins 2011) and ROBINS‐I tool for NRS (Sterne 2016) for the included cohort studies.
-
Measures of treatment effect. We used odds ratios to estimate treatment effect in pairwise meta‐analyses and network meta‐analyses for included outcomes, and hazard ratios for conversion to clinically definite multiple sclerosis.
-
Dealing with missing data. We used Informative Missingness Odds Ratio model to account for the impact of missing outcome rate (assumed not missing at random) for binary outcomes.
-
Summary of findings table. We added the primary outcome "Withdrawls or drug discontinuation because of adverse events during 24 months of treatment" in 'Summary of findings' table one.
Keywords
MeSH
Medical Subject Headings (MeSH) Keywords
- Adjuvants, Immunologic [adverse effects, *therapeutic use];
- Cladribine [adverse effects, therapeutic use];
- Cohort Studies;
- Crotonates [adverse effects, therapeutic use];
- Disease Progression;
- Glatiramer Acetate [adverse effects, therapeutic use];
- Hydroxybutyrates;
- Immunosuppressive Agents [adverse effects, *therapeutic use];
- Interferon beta‐1a [adverse effects, therapeutic use];
- Multiple Sclerosis [*drug therapy];
- Nitriles;
- Publication Bias;
- Randomized Controlled Trials as Topic;
- Recurrence;
- Time Factors;
- Toluidines [adverse effects, therapeutic use];
Medical Subject Headings Check Words
Humans;
PICO
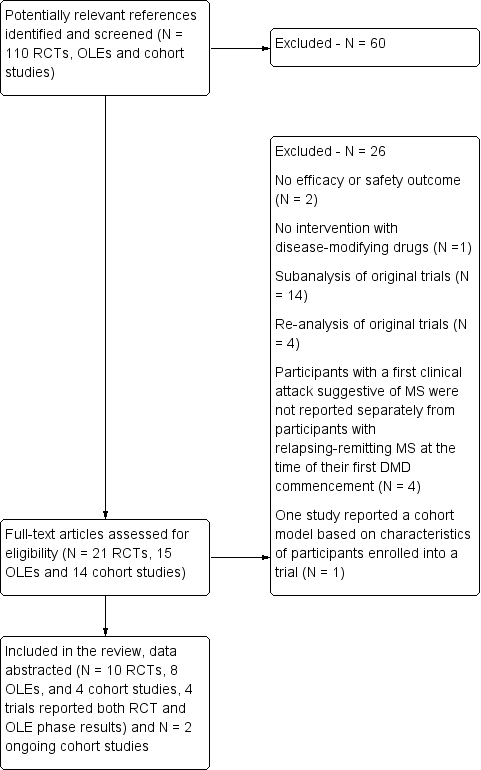
Study flow diagram.
DMD: disease‐modifying drugs; OLEs: open label extension studies; RCTs: randomised controlled trials
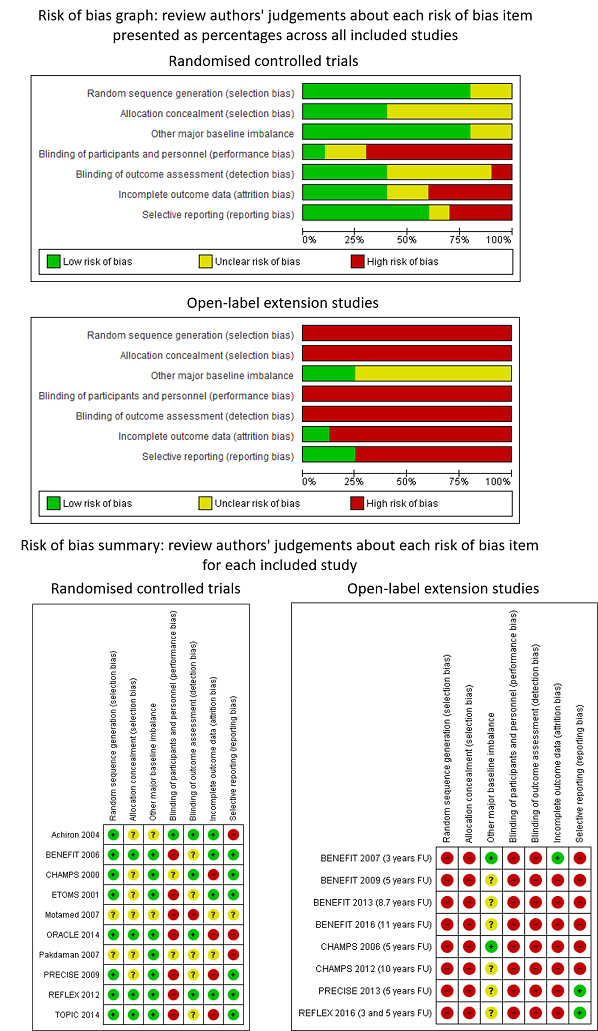
Review authors' judgements about each risk of bias item presented as percentages across all included studies and review authors' judgements about each risk of bias item for each included study

Forest plot of comparison: treatment with disease‐modifying drugs compared with placebo. Random‐effects meta‐analysis results of proportion of participants with disability‐worsening over 24 months in RCT studies. We assumed in both groups that the odds of disability‐worsening in missing participants were 5.95 times the odds in the observed participants with 95% CI from 3 to 7
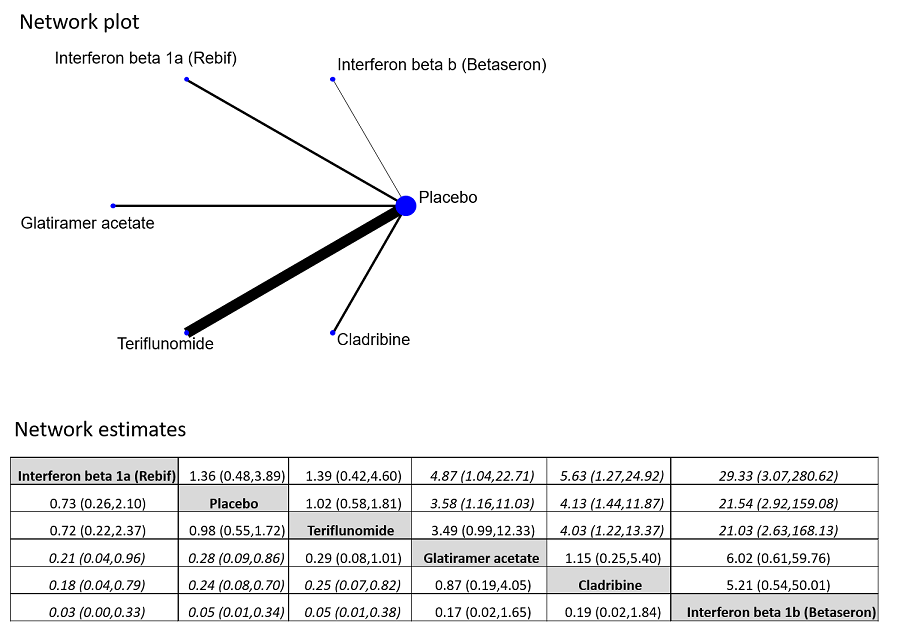
Network plot of comparisons and network meta‐analysis estimates for the proportion of participants who withdrew from the study because of adverse events in RCT studies. The estimate is located at the intersection of the column‐defining treatment and the row‐defining treatment. In the lower triangle the comparisons should be read from left to right, a OR value less than 1 favours the column‐defining treatment. In the upper triangle the comparisons should be read from right to left, a OR value larger 1 favours the row‐defining treatment. Significant results are in italic

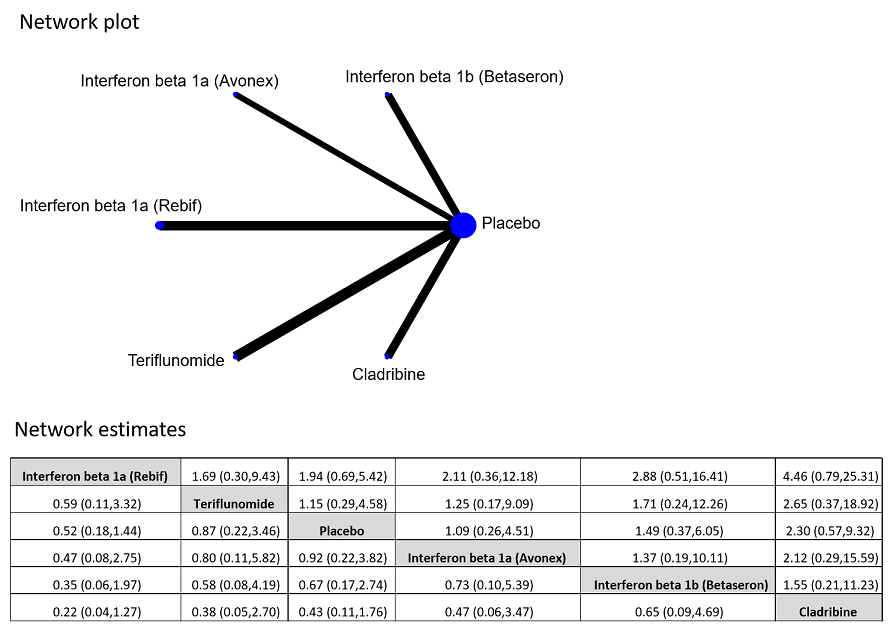
Network plot of comparisons and network meta‐analysis estimates for the time to conversion to CDMS in RCT studies over 24 months. The estimate is located at the intersection of the column‐defining treatment and the row‐defining treatment. In the lower triangle the comparisons should be read from left to right, a HR value less than 1 favours the column‐defining treatment. In the upper triangle the comparisons should be read from right to left, a HR value larger than 1 favours the row‐defining treatment. Significant results are in italic
Network plot of comparisons and network meta‐analysis estimates for the proportion of participants who discontinued treatment and were followed up to the end of the study or who were lost to follow‐up for any reason in RCT studies. The estimate is located at the intersection of the column‐defining treatment and the row‐defining treatment. In the lower triangle the comparisons should be read from left to right, a HR value less than 1 favours the column‐defining treatment. In the upper triangle the comparisons should be read from right to left, a HR value larger 1 favours the row‐defining treatment

Forest plot of comparison: early treatment compared with delayed treatment with disease‐modifying drugs. Random‐effects meta‐analysis results of proportions of participants with disability‐worsening at a maximum of 3 years, 5 years and 10 years of follow‐up in open‐label extension studies. We assumed in both groups that the odds of disability‐worsening in missing participants were 5.95 times the odds in the observed participants with 95% CI from 3 to 7

Forest plot of comparison: Early treatment compared with delayed treatment with disease‐modifying drugs. Random‐effects meta‐analysis results for proportion of participants with relapse over 5 years follow‐up in OLE studies. We assumed in both groups that the odds of relapses in missing participants were 5.95 times the odds in the observed participants with 95% CI from 3 to 7

Comparison 1 Active intervention versus placebo, Outcome 1 Occurrence of at least one serious adverse event over 24 months.

Comparison 1 Active intervention versus placebo, Outcome 2 Occurrence of at least one serious adverse event over 36 months.

Comparison 1 Active intervention versus placebo, Outcome 3 Withdrawing from the study or discontinuing the drug due to adverse events over 24 months.
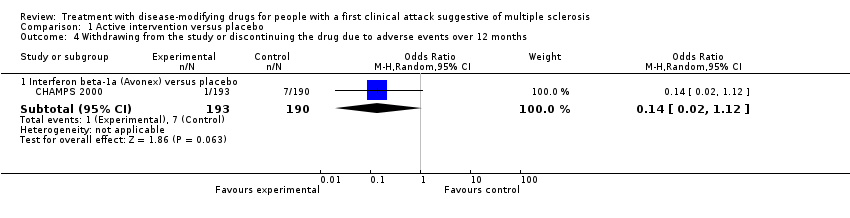
Comparison 1 Active intervention versus placebo, Outcome 4 Withdrawing from the study or discontinuing the drug due to adverse events over 12 months.

Comparison 1 Active intervention versus placebo, Outcome 5 Time to conversion to CDMS over 24 months.

Comparison 1 Active intervention versus placebo, Outcome 6 Time to conversion to CDMS over 12 months.
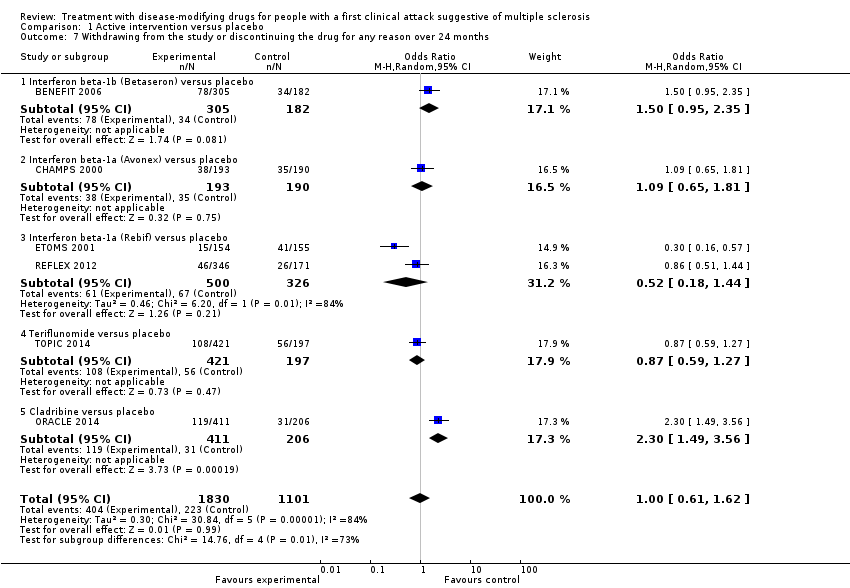
Comparison 1 Active intervention versus placebo, Outcome 7 Withdrawing from the study or discontinuing the drug for any reason over 24 months.

Comparison 1 Active intervention versus placebo, Outcome 8 Withdrawing from the study or discontinuing the drug for any reason over 12 months.

Comparison 2 Early versus delayed treatment, Outcome 1 Time to conversion to CDMS at different follow‐up years.
| Patient: adults with first attack suggestive of MS | |||||||
| Outcomes | Relative effect | Anticipated absolute effects* (95% CI) | Quality of the evidence | What happens | |||
| With placebo | With early disease‐modifying drugs treatment | Difference | |||||
| Disability‐worsening Proportion of participants with disability‐worsening, assessed by EDSS** during 24 months of treatment | OR 0.74 | 34.1% | 27.7% (20.2 to 37.1) | 6.4% fewer (13.9 fewer to 3 more) | ⊕⊝⊝⊝ | The risk of disability‐worsening is less with disease‐modifying drugs than with placebo, but there is a lot of uncertainty in the effect | |
| Relapse Proportion of participants with relapse during 24 months of treatment | OR 0.65 | 41.6% | 31.7% (21.3 to 44.4) | 10.0% fewer (20.3 fewer to 2.8 more) | ⊕⊝⊝⊝ | The risk of relapse is less with disease‐modifying drugs than with placebo, but there is a lot of uncertainty in the effects | |
| Occurrence of at least one serious adverse event Proportion of participants with at least one serious adverse event during 24 months of treatment | OR 0.78 | 8.0% | 6.3% | 1.6% fewer | ⊕⊕⊝⊝ | Compared to placebo, disease‐modifying drugs were associated with less risk of serious adverse events | |
| Withdrawls or drug discontinuation due to adverse events during 24 months of treatment | OR 2.43 | 3.5% | 8.0% | 4.6% more | ⊕⊝⊝⊝ | Compared to placebo interferon beta 1‐b, glatiramer acetate, and cladribine were associated with higher risk of withdrawals due to adverse events | |
| *The risk in the intervention group (and its 95% confidence interval) is based on the assumed risk in the comparison group and the relative effect of the intervention (and its 95% CI). **EDSS: expanded disability status scale | |||||||
| GRADE Working Group grades of evidence | |||||||
| aHigh risk of bias for blinding of participants and outcome assessment and incomplete outcome data. | |||||||
| Patient: adults with first attack suggestive of MS | ||||||
| Outcomes | Relative effect | Anticipated absolute effects* (95% CI) | Quality of the evidence | What happens | ||
| Without early disease‐modifying drug treatment | With early disease‐modifying drug treatment | Difference | ||||
| Disability‐worsening Proportion of participants with disability‐worsening at a maximum of five years' follow‐up (assessed by EDSS**) | OR 0.88 | 40.2% | 37.2% | 3.0% fewer | ⊕⊝⊝⊝ | No significant effect of early treatment compared to delayed treatment during five years' follow‐up; however there is a significant heterogeneity between the studies |
| Relapse Proportion of participants with relapse at a maximum of five years' follow‐up | OR 0.35 | 83.4% | 63.8% | 19.6% fewer | ⊕⊕⊝⊝ | Early treatment reduced the risk of relapses compared to delayed treatment during five years' follow‐up |
| *The risk in the intervention group (and its 95% confidence interval) is based on the assumed risk in the comparison group and the relative effect of the intervention (and its 95% CI). | ||||||
| GRADE Working Group grades of evidence | ||||||
| aHigh risk of bias for allocation concealment, blinding of outcome assessment and incomplete outcome data. | ||||||
| Type of intervention | Route | RCTs N = 10 | OLEs N = 8 | Cohort studies N = 4 |
| Interferon beta‐1b sc (Betaseron®) | sc | 1 | 4 OLEs at a maximum follow‐up of 3, 5, 8.7, and 11 years | 0 |
| Interferon beta‐1a (Avonex®) | im | 2 | 2 OLEs at a maximum follow‐up of 5 and 10 years | 0 |
| Interferon beta‐1a (Rebif®) | sc | 3 | 1 OLE at a maximum follow‐up of 3 and 5 years | 0 |
| Glatiramer acetate sc | sc | 1 | 1 OLE at a maximum follow‐up of 5 years | 0 |
| Cladribine os | os | 1 | 0 | 0 |
| Teriflunomide os | os | 1 | 0 | 0 |
| Immunoglobulins iv | iv | 1 | 0 | 0 |
| disease‐modifying drugs | ‐ | 0 | 0 | follow‐up from 2 to 6 years |
| im: intramuscular; iv: intravenously; OLEs: open‐label extension studies; os: oral; RCTs: randomised controlled studies; sc: subcutaneous | ||||
| Bias | Authors’ judgment | Support for judgement |
| Confounding | Serious | All known important domains were not appropriately controlled for |
| Selection of participants into the study | Low | All participants who would have been eligible for the target trial were likely included in the study and for each participant start of follow up and start of intervention likely coincided |
| Classification of interventions | Low | Intervention status was well defined and intervention definition was based on information collected at the time of intervention |
| Deviations from intended interventions | NI | No information was reported on whether there was deviation from the intended intervention |
| Missing data | Critical | There were critical differences between early, delayed or no treatment in participants with missing data and an appropriate analysis to address missing data was not done |
| Measurement of outcomes | Serious | The outcome measures were subjective and assessed by assessors aware of the intervention received by study participants. This judgment is applicable to all the three outcomes reported in the article |
| Selection of the reported result | Low | There was evidence that reported results corresponded to all intended outcomes and analyses |
| Overall bias | Critical | Study judged to be at critical risk of bias in one domain |
| Bias | Authors’ judgment | Support for judgement |
| Confounding | Moderate | Confounding expected, all known important confounding domains appropriately measured and controlled for, and reliability and validity of measurement of important domains were sufficient, such that we do not expect serious residual confounding |
| Selection of participants into the study | Low | All participants who would have been eligible for the target trial were likely included in the study and for each participant start of follow up and start of intervention likely coincided |
| Classification of interventions | Serious | Intervention status was not well defined |
| Deviations from intended interventions | NI | No information was reported on whether there was deviation from the intended intervention |
| Missing data | Low | Data were reasonably complete |
| Measurement of outcomes | Serious | CDMS was assessed by assessors aware of the intervention received by study participants |
| Selection of the reported result | Low | There was evidence that reported results corresponded to all intended outcomes and analyses |
| Overall bias | Serious | Study judged to be at serious risk of bias in two domains, but not at critical risk of bias in any domain |
| Bias | Authors’ judgment | Support for judgement |
| Confounding | Serious | Important domains were not appropriately controlled for |
| Selection of participants into the study | Critical | Selection into the study was very strongly related to intervention and outcome and this could not be adjusted for in analyses |
| Classification of interventions | Serious | Intervention status was not well defined |
| Deviations from intended interventions | NI | No information was reported on whether there was deviation from the intended intervention |
| Missing data | NI | No information was reported on missing data |
| Measurement of outcomes | Serious | The outcome measures were subjective and they were assessed by assessors aware of the intervention received by study participants. Follow‐up duration not reported |
| Selection of the reported result | Low | There was evidence that reported results corresponded to all intended outcomes and analyses |
| Overall bias | Critical | Study judged to be at critical risk of bias in one domain |
| Bias | Authors’ judgment | Support for judgement |
| Confounding | Serious | Important domains were not appropriately controlled for |
| Selection of participants into the study | Low | All participants who would have been eligible for the target trial were likely included in the study and for each participant start of follow up and start of intervention likely coincided |
| Classification of interventions | Serious | Intervention status was not well defined |
| Deviations from intended interventions | NI | No information was reported on whether there was deviation from the intended intervention |
| Missing data | Serious | Reasons for missing data differed substantially across interventions, and the analysis is unlikely to have removed the risk of bias arising from the missing data |
| Measurement of outcomes | Serious | The outcome measures were subjective and assessed by assessors aware of the intervention received by study participants. This judgment is applicable to all outcomes reported in the article |
| Selection of the reported result | Low | There was evidence that reported results corresponded to all intended outcomes and analyses |
| Overall bias | Serious | Study judged to be at serious risk of bias in four domains, but not at critical risk of bias in any domain |
| ROBINS‐I is a tool to evaluate Risk Of Bias In Non‐randomised Studies ‐ of Interventions (Sterne 2016) | ||
| Study | Did the researchers actively monitor for adverse events or did they simply provide spontaneous reporting of adverse events that arose? | Did the authors define serious adverse events according to an accepted international classification and report the number of serious adverse events? |
| No information | No information | |
| No information | No information | |
| Yes, active monitoring.“Regular visits were scheduled for safety assessments at months 3, 6, 9, 12, 18, and 24”. (page 1243) | No information | |
| No information | No information | |
| No information | No information | |
| No information | No information | |
| No information | No information | |
| No active monitoring. "Each center was instructed to report all adverse events during the first six months of treatment, but thereafter to report only serious adverse events". (page 899) | No information | |
| No information | No information | |
| No information | No information | |
| Yes, active monitoring. "Safety was assessed at 1, 6, 12, 18, 24 months". (page 1577) | Yes to both questions. "Serious adverse events were defined according to the guidelines of the International Conference on Harmonisation". (page 1580) | |
| No information | No information | |
| Yes, active monitoring."Safety assessments were performed at the end of months 1, 2, 3, 9, 15, and 21 by a neurologist". (page 345) | No information | |
| No information | No information | |
| Yes, active monitoring. "Adverse events and laboratory findings were recorded at study visits and at regularly scheduled interim visits" (page 259). "International Conference on Harmonisation of Technical Requirements for Registration of Pharmaceuticals for Human Use". (page 258) | Yes to both questions. "International Conference on Harmonisation of Technical Requirements for Registration of Pharmaceuticals for Human Use". (page 258) | |
| No information | No information | |
| Unclear whether the researchers actively monitored for adverse events or they simply provided spontaneous reporting of adverse events | No information | |
| Unclear whether the researchers actively monitored for adverse events or they simply provided spontaneous reporting of adverse events | No information | |
| Yes, active monitoring. "Active monitoring by personnel was ensured via various testing". (page 34). "Adverse events were coded with the Medical Dictionary for Regulatory Activities (MedDRA) and analysed according to the preferred terms". (page 35) | Yes to both questions."Adverse events were coded with the Medical Dictionary for Regulatory Activities (MedDRA) and analysed according to the preferred terms". (page 35) | |
| Unclear. "Adverse events (adverse events) were monitored at months 25 and 27 and then every 3 months to the study end". (page 2) | No information | |
| No information | No information | |
| Unclear. "Adverse events were reported by study participants or investigators throughout the study; investigators recorded all such events on case report forms". (page 979) | No information |
| Early DMDs treatment (N = 49) | Delayed DMDs treatment (N = 57) | No treatment (N = 52) | |
| EDSS score over 24 months' follow‐up Mean (SD) Median (range) Kruskal–Wallis H‐Test P value <0.001 | 1.2 (0.9) 1.5 (0‐3) | 1.6 (1.2) 1.5 (0‐6) | 0.8 (0.8) 1.0 (0‐3) |
| P value versus no treatment | 0.016 | < 0.001 | NA |
| P value early versus delayed treatment (Wilcoxon matched pair test) | 0.055 | NA | NA |
| Relapses Mean (SD) Median (range) Kruskal–Wallis H‐Test P value < 0.001 | 0.5 (0.8) 0.0 (0‐4) | 1.0 (1.1) 1.0 (0‐4) | 0.2 (0.5) 0.0 (0‐3) |
| P value versus no treatment | 0.059 | < 0.001 | NA |
| P value early versus delayed treatment (Wilcoxon matched pair test) | 0.01 | NA | NA |
| Risk of attaining an EDSS score of 3.0 with early DMDs compared with delayed DMDs treatment. Adjusted hazard ratio: 0.5 (95% CI 0.3 to 0.9) Unadjusted hazard ratio: 1.1 (95% CI 0.7 to 1.9) | |||
| DMDs: disease‐modifying drugs. EDSS: expanded disability status scale; NA: not applicable; SD: standard deviation | |||
| Study | Time until the delayed treatment after randomisation |
| Mean (SD): 1.5 (0.73) years | |
| Median (interquartile range): 30 (24‐35) months | |
| Median (range): 29 (0.5 –38) months | |
| Data not reported |
| Interferon beta‐1b | Intramuscular interferon beta 1‐a (Avonex) | Subcutaneous interferon beta 1‐a (Rebif) | Glatiramer acetate | |
| Participants | 487 | 383 | 517 | 481 |
| Serious adverse events ‐ number of participants | 123 | 65 | 49 | 60 |
| Discontinued treatment for any adverse events | Not reported | Not reported | 20 | 71 |
| Discontinued treatment or were lost to follow‐up for any reason | 204 | Not reported | 146 | 192 |
| Years of follow‐up | 8.7 | 10 | 5 | 5 |
| Outcome or subgroup title | No. of studies | No. of participants | Statistical method | Effect size |
| 1 Occurrence of at least one serious adverse event over 24 months Show forest plot | 7 | 3385 | Odds Ratio (M‐H, Random, 95% CI) | 0.78 [0.60, 1.03] |
| 1.1 Interferon beta‐1b (Betaseron) versus placebo | 1 | 468 | Odds Ratio (M‐H, Random, 95% CI) | 1.00 [0.48, 2.11] |
| 1.2 Interferon beta‐1a (Avonex) versus placebo | 1 | 383 | Odds Ratio (M‐H, Random, 95% CI) | 0.60 [0.28, 1.27] |
| 1.3 Interferon beta‐1a (Rebif) versus placebo | 2 | 823 | Odds Ratio (M‐H, Random, 95% CI) | 0.72 [0.35, 1.46] |
| 1.4 Glatiramer acetate versus placebo | 1 | 481 | Odds Ratio (M‐H, Random, 95% CI) | 0.55 [0.25, 1.17] |
| 1.5 Teriflunomide versus placebo | 1 | 614 | Odds Ratio (M‐H, Random, 95% CI) | 1.06 [0.59, 1.89] |
| 1.6 Cladribine versus placebo | 1 | 616 | Odds Ratio (M‐H, Random, 95% CI) | 0.77 [0.43, 1.37] |
| 2 Occurrence of at least one serious adverse event over 36 months Show forest plot | 1 | Odds Ratio (M‐H, Random, 95% CI) | Subtotals only | |
| 2.1 Interferon beta‐1a (Avonex) versus placebo | 1 | 202 | Odds Ratio (M‐H, Random, 95% CI) | 1.23 [0.44, 3.45] |
| 3 Withdrawing from the study or discontinuing the drug due to adverse events over 24 months Show forest plot | 5 | 2693 | Odds Ratio (M‐H, Random, 95% CI) | 2.43 [0.91, 6.49] |
| 3.1 Interferon beta‐1b (Betaseron) versus placebo | 1 | 468 | Odds Ratio (M‐H, Random, 95% CI) | 21.54 [2.92, 159.08] |
| 3.2 Interferon beta‐1a (Rebif) versus placebo | 1 | 514 | Odds Ratio (M‐H, Random, 95% CI) | 0.73 [0.26, 2.10] |
| 3.3 Glatiramer acetate versus placebo | 1 | 481 | Odds Ratio (M‐H, Random, 95% CI) | 3.58 [1.16, 11.03] |
| 3.4 Teriflunomide versus placebo | 1 | 614 | Odds Ratio (M‐H, Random, 95% CI) | 1.02 [0.58, 1.81] |
| 3.5 Cladribine versus placebo | 1 | 616 | Odds Ratio (M‐H, Random, 95% CI) | 4.13 [1.44, 11.87] |
| 4 Withdrawing from the study or discontinuing the drug due to adverse events over 12 months Show forest plot | 1 | Odds Ratio (M‐H, Random, 95% CI) | Subtotals only | |
| 4.1 Interferon beta‐1a (Avonex) versus placebo | 1 | 383 | Odds Ratio (M‐H, Random, 95% CI) | 0.14 [0.02, 1.12] |
| 5 Time to conversion to CDMS over 24 months Show forest plot | 9 | Hazard Ratio (Random, 95% CI) | 0.53 [0.47, 0.60] | |
| 5.1 Interferon beta‐1b (Betaseron) versus placebo | 1 | Hazard Ratio (Random, 95% CI) | 0.50 [0.36, 0.69] | |
| 5.2 Interferon beta‐1a (Avonex) versus placebo | 1 | Hazard Ratio (Random, 95% CI) | 0.56 [0.38, 0.83] | |
| 5.3 Interferon beta‐1a (Rebif) versus placebo | 2 | Hazard Ratio (Random, 95% CI) | 0.57 [0.43, 0.77] | |
| 5.4 Glatiramer acetate versus placebo | 1 | Hazard Ratio (Random, 95% CI) | 0.55 [0.40, 0.76] | |
| 5.5 Teriflunomide versus placebo | 1 | Hazard Ratio (Random, 95% CI) | 0.57 [0.38, 0.86] | |
| 5.6 Cladribine versus placebo | 1 | Hazard Ratio (Random, 95% CI) | 0.38 [0.25, 0.58] | |
| 5.7 Any DMD vs no treatment | 2 | Hazard Ratio (Random, 95% CI) | 0.48 [0.30, 0.78] | |
| 6 Time to conversion to CDMS over 12 months Show forest plot | 1 | Hazard Ratio (Random, 95% CI) | Subtotals only | |
| 6.1 Immunoglobulins versus placebo | 1 | Hazard Ratio (Random, 95% CI) | 0.36 [0.15, 0.86] | |
| 7 Withdrawing from the study or discontinuing the drug for any reason over 24 months Show forest plot | 6 | 2931 | Odds Ratio (M‐H, Random, 95% CI) | 1.00 [0.61, 1.62] |
| 7.1 Interferon beta‐1b (Betaseron) versus placebo | 1 | 487 | Odds Ratio (M‐H, Random, 95% CI) | 1.50 [0.95, 2.35] |
| 7.2 Interferon beta‐1a (Avonex) versus placebo | 1 | 383 | Odds Ratio (M‐H, Random, 95% CI) | 1.09 [0.65, 1.81] |
| 7.3 Interferon beta‐1a (Rebif) versus placebo | 2 | 826 | Odds Ratio (M‐H, Random, 95% CI) | 0.52 [0.18, 1.44] |
| 7.4 Teriflunomide versus placebo | 1 | 618 | Odds Ratio (M‐H, Random, 95% CI) | 0.87 [0.59, 1.27] |
| 7.5 Cladribine versus placebo | 1 | 617 | Odds Ratio (M‐H, Random, 95% CI) | 2.30 [1.49, 3.56] |
| 8 Withdrawing from the study or discontinuing the drug for any reason over 12 months Show forest plot | 1 | Odds Ratio (M‐H, Random, 95% CI) | Subtotals only | |
| 8.1 Immunoglobulins versus placebo | 1 | 91 | Odds Ratio (M‐H, Random, 95% CI) | 2.15 [0.37, 12.35] |
| Outcome or subgroup title | No. of studies | No. of participants | Statistical method | Effect size |
| 1 Time to conversion to CDMS at different follow‐up years Show forest plot | 10 | Hazard Ratio (Random, 95% CI) | Subtotals only | |
| 1.1 2‐4 years' follow‐up | 5 | Hazard Ratio (Random, 95% CI) | 0.62 [0.48, 0.81] | |
| 1.2 5 years' follow‐up | 4 | Hazard Ratio (Random, 95% CI) | 0.62 [0.53, 0.73] | |
| 1.3 8.7‐10 years' follow‐up | 2 | Hazard Ratio (Random, 95% CI) | 0.65 [0.54, 0.79] | |