Scolaris Content Display Scolaris Content Display

Study flow diagram.
 DMD: disease‐modifying drugs; OLEs: open label extension studies; RCTs: randomised controlled trials
Figuras y tablas -
Figure 1

Study flow diagram.
DMD: disease‐modifying drugs; OLEs: open label extension studies; RCTs: randomised controlled trials

Review authors' judgements about each risk of bias item presented as percentages across all included studies and review authors' judgements about each risk of bias item for each included study
Figuras y tablas -
Figure 2

Review authors' judgements about each risk of bias item presented as percentages across all included studies and review authors' judgements about each risk of bias item for each included study

Forest plot of comparison: treatment with disease‐modifying drugs compared with placebo. Random‐effects meta‐analysis results of proportion of participants with disability‐worsening over 24 months in RCT studies. We assumed in both groups that the odds of disability‐worsening in missing participants were 5.95 times the odds in the observed participants with 95% CI from 3 to 7
Figuras y tablas -
Figure 3

Forest plot of comparison: treatment with disease‐modifying drugs compared with placebo. Random‐effects meta‐analysis results of proportion of participants with disability‐worsening over 24 months in RCT studies. We assumed in both groups that the odds of disability‐worsening in missing participants were 5.95 times the odds in the observed participants with 95% CI from 3 to 7

Network plot of comparisons and network meta‐analysis estimates for the proportion of participants who withdrew from the study because of adverse events in RCT studies. The estimate is located at the intersection of the column‐defining treatment and the row‐defining treatment. In the lower triangle the comparisons should be read from left to right, a OR value less than 1 favours the column‐defining treatment. In the upper triangle the comparisons should be read from right to left, a OR value larger 1 favours the row‐defining treatment. Significant results are in italic
Figuras y tablas -
Figure 4

Network plot of comparisons and network meta‐analysis estimates for the proportion of participants who withdrew from the study because of adverse events in RCT studies. The estimate is located at the intersection of the column‐defining treatment and the row‐defining treatment. In the lower triangle the comparisons should be read from left to right, a OR value less than 1 favours the column‐defining treatment. In the upper triangle the comparisons should be read from right to left, a OR value larger 1 favours the row‐defining treatment. Significant results are in italic

Network plot of comparisons and network meta‐analysis estimates for the time to conversion to CDMS in RCT studies over 24 months. The estimate is located at the intersection of the column‐defining treatment and the row‐defining treatment. In the lower triangle the comparisons should be read from left to right, a HR value less than 1 favours the column‐defining treatment. In the upper triangle the comparisons should be read from right to left, a HR value larger than 1 favours the row‐defining treatment. Significant results are in italic
Figuras y tablas -
Figure 5

Network plot of comparisons and network meta‐analysis estimates for the time to conversion to CDMS in RCT studies over 24 months. The estimate is located at the intersection of the column‐defining treatment and the row‐defining treatment. In the lower triangle the comparisons should be read from left to right, a HR value less than 1 favours the column‐defining treatment. In the upper triangle the comparisons should be read from right to left, a HR value larger than 1 favours the row‐defining treatment. Significant results are in italic

Network plot of comparisons and network meta‐analysis estimates for the proportion of participants who discontinued treatment and were followed up to the end of the study or who were lost to follow‐up for any reason in RCT studies. The estimate is located at the intersection of the column‐defining treatment and the row‐defining treatment. In the lower triangle the comparisons should be read from left to right, a HR value less than 1 favours the column‐defining treatment. In the upper triangle the comparisons should be read from right to left, a HR value larger 1 favours the row‐defining treatment
Figuras y tablas -
Figure 6

Network plot of comparisons and network meta‐analysis estimates for the proportion of participants who discontinued treatment and were followed up to the end of the study or who were lost to follow‐up for any reason in RCT studies. The estimate is located at the intersection of the column‐defining treatment and the row‐defining treatment. In the lower triangle the comparisons should be read from left to right, a HR value less than 1 favours the column‐defining treatment. In the upper triangle the comparisons should be read from right to left, a HR value larger 1 favours the row‐defining treatment

Forest plot of comparison: early treatment compared with delayed treatment with disease‐modifying drugs. Random‐effects meta‐analysis results of proportions of participants with disability‐worsening at a maximum of 3 years, 5 years and 10 years of follow‐up in open‐label extension studies. We assumed in both groups that the odds of disability‐worsening in missing participants were 5.95 times the odds in the observed participants with 95% CI from 3 to 7
Figuras y tablas -
Figure 7

Forest plot of comparison: early treatment compared with delayed treatment with disease‐modifying drugs. Random‐effects meta‐analysis results of proportions of participants with disability‐worsening at a maximum of 3 years, 5 years and 10 years of follow‐up in open‐label extension studies. We assumed in both groups that the odds of disability‐worsening in missing participants were 5.95 times the odds in the observed participants with 95% CI from 3 to 7

Forest plot of comparison: Early treatment compared with delayed treatment with disease‐modifying drugs. Random‐effects meta‐analysis results for proportion of participants with relapse over 5 years follow‐up in OLE studies. We assumed in both groups that the odds of relapses in missing participants were 5.95 times the odds in the observed participants with 95% CI from 3 to 7
Figuras y tablas -
Figure 8

Forest plot of comparison: Early treatment compared with delayed treatment with disease‐modifying drugs. Random‐effects meta‐analysis results for proportion of participants with relapse over 5 years follow‐up in OLE studies. We assumed in both groups that the odds of relapses in missing participants were 5.95 times the odds in the observed participants with 95% CI from 3 to 7

Comparison 1 Active intervention versus placebo, Outcome 1 Occurrence of at least one serious adverse event over 24 months.
Figuras y tablas -
Analysis 1.1

Comparison 1 Active intervention versus placebo, Outcome 1 Occurrence of at least one serious adverse event over 24 months.

Comparison 1 Active intervention versus placebo, Outcome 2 Occurrence of at least one serious adverse event over 36 months.
Figuras y tablas -
Analysis 1.2

Comparison 1 Active intervention versus placebo, Outcome 2 Occurrence of at least one serious adverse event over 36 months.

Comparison 1 Active intervention versus placebo, Outcome 3 Withdrawing from the study or discontinuing the drug due to adverse events over 24 months.
Figuras y tablas -
Analysis 1.3

Comparison 1 Active intervention versus placebo, Outcome 3 Withdrawing from the study or discontinuing the drug due to adverse events over 24 months.

Comparison 1 Active intervention versus placebo, Outcome 4 Withdrawing from the study or discontinuing the drug due to adverse events over 12 months.
Figuras y tablas -
Analysis 1.4

Comparison 1 Active intervention versus placebo, Outcome 4 Withdrawing from the study or discontinuing the drug due to adverse events over 12 months.

Comparison 1 Active intervention versus placebo, Outcome 5 Time to conversion to CDMS over 24 months.
Figuras y tablas -
Analysis 1.5

Comparison 1 Active intervention versus placebo, Outcome 5 Time to conversion to CDMS over 24 months.

Comparison 1 Active intervention versus placebo, Outcome 6 Time to conversion to CDMS over 12 months.
Figuras y tablas -
Analysis 1.6

Comparison 1 Active intervention versus placebo, Outcome 6 Time to conversion to CDMS over 12 months.

Comparison 1 Active intervention versus placebo, Outcome 7 Withdrawing from the study or discontinuing the drug for any reason over 24 months.
Figuras y tablas -
Analysis 1.7

Comparison 1 Active intervention versus placebo, Outcome 7 Withdrawing from the study or discontinuing the drug for any reason over 24 months.

Comparison 1 Active intervention versus placebo, Outcome 8 Withdrawing from the study or discontinuing the drug for any reason over 12 months.
Figuras y tablas -
Analysis 1.8

Comparison 1 Active intervention versus placebo, Outcome 8 Withdrawing from the study or discontinuing the drug for any reason over 12 months.

Comparison 2 Early versus delayed treatment, Outcome 1 Time to conversion to CDMS at different follow‐up years.
Figuras y tablas -
Analysis 2.1

Comparison 2 Early versus delayed treatment, Outcome 1 Time to conversion to CDMS at different follow‐up years.

Summary of findings for the main comparison. Are disease‐modifying drugs for a first attack suggestive of multiple sclerosis (MS) effective and safe compared to placebo?

Patient: adults with first attack suggestive of MS
Setting: MS centres
Intervention: early disease‐modifying drug treatment
Comparison: placebo

Outcomes

Relative effect
(95% CI)

Anticipated absolute effects* (95% CI)

Quality of the evidence
(GRADE)

What happens

With placebo

With early disease‐modifying drugs treatment

Difference

Disability‐worsening

Proportion of participants with disability‐worsening, assessed by EDSS** during 24 months of treatment
Participants: N = 927
(2 RCTs)

OR 0.74
(0.49 to 1.14)

34.1%

27.7%

(20.2 to 37.1)

6.4% fewer (13.9 fewer to 3 more)

⊕⊝⊝⊝
Very lowa,b,c

The risk of disability‐worsening is less with disease‐modifying drugs than with placebo, but there is a lot of uncertainty in the effect

Relapse

Proportion of participants with relapse during 24 months of treatment
Participants: N = 618
(1 RCT)

OR 0.65
(0.38 to 1.12)

41.6%

31.7%

(21.3 to 44.4)

10.0% fewer (20.3 fewer to 2.8 more)

⊕⊝⊝⊝
Very lowa,c,d

The risk of relapse is less with disease‐modifying drugs than with placebo, but there is a lot of uncertainty in the effects

Occurrence of at least one serious adverse event Proportion of participants with at least one serious adverse event during 24 months of treatment
Participants: N = 3385
(7 RCTs)

OR 0.78
(0.60 to 1.03)

8.0%

6.3%
(5.0 to 8.2)

1.6% fewer
(3 fewer to 0.2 more)

⊕⊕⊝⊝
Lowa,e

Compared to placebo, disease‐modifying drugs were associated with less risk of serious adverse events

Withdrawls or drug discontinuation due to adverse events

during 24 months of treatment
Participants: N = 2693
(5 RCTs)

OR 2.43
(0.91 to 6.49)

3.5%

8.0%
(3.2 to 18.9)

4.6% more
(0.3 fewer to 15.4 more)

⊕⊝⊝⊝
Very lowa,f,g

Compared to placebo interferon beta 1‐b, glatiramer acetate, and cladribine were associated with higher risk of withdrawals due to adverse events

*The risk in the intervention group (and its 95% confidence interval) is based on the assumed risk in the comparison group and the relative effect of the intervention (and its 95% CI).

**EDSS: expanded disability status scale
CI: Confidence interval; OR: Odds ratio

GRADE Working Group grades of evidence
High quality: We are very confident that the true effect lies close to that of the estimate of the effect.
Moderate quality: We are moderately confident in the effect estimate: The true effect is likely to be close to the estimate of the effect, but there is a possibility that it is substantially different.
Low quality: Our confidence in the effect estimate is limited: The true effect may be substantially different from the estimate of the effect.
Very low quality: We have very little confidence in the effect estimate: The true effect is likely to be substantially different from the estimate of effect.

aHigh risk of bias for blinding of participants and outcome assessment and incomplete outcome data.
bSurrogate outcome in both studies contributing to this estimate.
cThe confidence interval does not rule out a null effect or benefit.
dOnly one study contributed to this estimate.
eDefinition and methods of monitoring and detecting serious adverse events not reported in most trials.
fHigh heterogeneity (I² = 78%, P = 0.001) not explained; high subgroup differences (I² = 75%, P = 0.003).
gDefinition and methods of monitoring and detecting adverse events not reported in most trials.

Figuras y tablas -
Summary of findings for the main comparison. Are disease‐modifying drugs for a first attack suggestive of multiple sclerosis (MS) effective and safe compared to placebo?
Summary of findings 2. Is early treatment with disease‐modifying drugs more efficacious and safer than delayed treatment?

Patient: adults with first attack suggestive of MS
Setting: MS centres
Intervention: early disease‐modifying drug treatment
Comparison: delayed disease‐modifying drug treatment; after the second attack or diagnosis with clinically definitive MS

Outcomes

Relative effect
(95% CI)

Anticipated absolute effects* (95% CI)

Quality of the evidence
(GRADE)

What happens

Without early disease‐modifying drug treatment

With early disease‐modifying drug treatment

Difference

Disability‐worsening

Proportion of participants with disability‐worsening at a maximum of five years' follow‐up (assessed by EDSS**)
Participants: N = 1868
(4 open‐label extension studies)

OR 0.88
(0.50 to 1.57)

40.2%

37.2%
(25.2 to 51.4)

3.0% fewer
(15 fewer to 11.1 more)

⊕⊝⊝⊝
Very lowa,b,c, d

No significant effect of early treatment compared to delayed treatment during five years' follow‐up; however there is a significant heterogeneity between the studies

Relapse

Proportion of participants with relapse at a maximum of five years' follow‐up
Participants: N = 1485
(3 open‐label extension studies)

OR 0.35
(0.26 to 0.48)

83.4%

63.8%
(56.7 to 70.7)

19.6% fewer
(26.7 fewer to 12.7 fewer)

⊕⊕⊝⊝
Lowa

Early treatment reduced the risk of relapses compared to delayed treatment during five years' follow‐up

*The risk in the intervention group (and its 95% confidence interval) is based on the assumed risk in the comparison group and the relative effect of the intervention (and its 95% CI).
**EDSS: expanded disability status scale
CI: Confidence interval; OR: Odds ratio

GRADE Working Group grades of evidence
High quality: We are very confident that the true effect lies close to that of the estimate of the effect.
Moderate quality: We are moderately confident in the effect estimate: The true effect is likely to be close to the estimate of the effect, but there is a possibility that it is substantially different.
Low quality: Our confidence in the effect estimate is limited: The true effect may be substantially different from the estimate of the effect.
Very low quality: We have very little confidence in the effect estimate: The true effect is likely to be substantially different from the estimate of effect.

aHigh risk of bias for allocation concealment, blinding of outcome assessment and incomplete outcome data.
bSurrogate outcome in two out of four studies contributing to this estimate.
cHigh heterogeneity (I² = 67%, P = 0.03).
dThe confidence interval fails to exclude important benefit or important harms.

Figuras y tablas -
Summary of findings 2. Is early treatment with disease‐modifying drugs more efficacious and safer than delayed treatment?
Table 1. Summary of characteristics of included studies

Type of intervention

Route

RCTs

N = 10

OLEs

N = 8

Cohort studies

N = 4

Interferon beta‐1b sc (Betaseron®)

sc

1

4 OLEs at a maximum follow‐up of 3, 5, 8.7, and 11 years

0

Interferon beta‐1a (Avonex®)

im

2

2 OLEs at a maximum follow‐up of 5 and 10 years

0

Interferon beta‐1a (Rebif®)

sc

3

1 OLE at a maximum follow‐up of 3 and 5 years

0

Glatiramer acetate sc

sc

1

1 OLE at a maximum follow‐up of 5 years

0

Cladribine os

os

1

0

0

Teriflunomide os

os

1

0

0

Immunoglobulins iv

iv

1

0

0

disease‐modifying drugs

0

0

follow‐up from 2 to 6 years

im: intramuscular; iv: intravenously; OLEs: open‐label extension studies; os: oral; RCTs: randomised controlled studies; sc: subcutaneous

Figuras y tablas -
Table 1. Summary of characteristics of included studies
Table 2. Risk of bias in included cohort studies (ROBINS‐I)

ACISS 2010

Bias

Authors’ judgment

Support for judgement

Confounding

Serious

All known important domains were not appropriately controlled for

Selection of participants into the study

Low

All participants who would have been eligible for the target trial were likely included in the study and for each participant start of follow up and start of intervention likely coincided

Classification of interventions

Low

Intervention status was well defined and intervention definition was based on information collected at the time of intervention

Deviations from intended interventions

NI

No information was reported on whether there was deviation from the intended intervention

Missing data

Critical

There were critical differences between early, delayed or no treatment in participants with missing data and an appropriate analysis to address missing data was not done

Measurement of outcomes

Serious

The outcome measures were subjective and assessed by assessors aware of the intervention received by study participants. This judgment is applicable to all the three outcomes reported in the article

Selection of the reported result

Low

There was evidence that reported results corresponded to all intended outcomes and analyses

Overall bias

Critical

Study judged to be at critical risk of bias in one domain

GERONIMUS 2013

Bias

Authors’ judgment

Support for judgement

Confounding

Moderate

Confounding expected, all known important confounding domains appropriately measured and controlled for, and reliability and validity of measurement of important domains were sufficient, such that we do not expect serious residual confounding

Selection of participants into the study

Low

All participants who would have been eligible for the target trial were likely included in the study and for each participant start of follow up and start of intervention likely coincided

Classification of interventions

Serious

Intervention status was not well defined

Deviations from intended interventions

NI

No information was reported on whether there was deviation from the intended intervention

Missing data

Low

Data were reasonably complete

Measurement of outcomes

Serious

CDMS was assessed by assessors aware of the intervention received by study participants

Selection of the reported result

Low

There was evidence that reported results corresponded to all intended outcomes and analyses

Overall bias

Serious

Study judged to be at serious risk of bias in two domains, but not at critical risk of bias in any domain

MSBASIS 2016

Bias

Authors’ judgment

Support for judgement

Confounding

Serious

Important domains were not appropriately controlled for

Selection of participants into the study

Critical

Selection into the study was very strongly related to intervention and outcome and this could not be adjusted for in analyses

Classification of interventions

Serious

Intervention status was not well defined

Deviations from intended interventions

NI

No information was reported on whether there was deviation from the intended intervention

Missing data

NI

No information was reported on missing data

Measurement of outcomes

Serious

The outcome measures were subjective and they were assessed by assessors aware of the intervention received by study participants. Follow‐up duration not reported

Selection of the reported result

Low

There was evidence that reported results corresponded to all intended outcomes and analyses

Overall bias

Critical

Study judged to be at critical risk of bias in one domain

Tintore 2015

Bias

Authors’ judgment

Support for judgement

Confounding

Serious

Important domains were not appropriately controlled for

Selection of participants into the study

Low

All participants who would have been eligible for the target trial were likely included in the study and for each participant start of follow up and start of intervention likely coincided

Classification of interventions

Serious

Intervention status was not well defined

Deviations from intended interventions

NI

No information was reported on whether there was deviation from the intended intervention

Missing data

Serious

Reasons for missing data differed substantially across interventions, and the analysis is unlikely to have removed the risk of bias arising from the missing data

Measurement of outcomes

Serious

The outcome measures were subjective and assessed by assessors aware of the intervention received by study participants. This judgment is applicable to all outcomes reported in the article

Selection of the reported result

Low

There was evidence that reported results corresponded to all intended outcomes and analyses

Overall bias

Serious

Study judged to be at serious risk of bias in four domains, but not at critical risk of bias in any domain

ROBINS‐I is a tool to evaluate Risk Of Bias In Non‐randomised Studies ‐ of Interventions (Sterne 2016)

Figuras y tablas -
Table 2. Risk of bias in included cohort studies (ROBINS‐I)
Table 3. Assessment of adverse events monitoring, definition and reporting of serious adverse events

Study

Did the researchers actively monitor for adverse events or did they simply provide spontaneous reporting of adverse events that arose?

Did the authors define serious adverse events according to an accepted international classification and report the number of serious adverse events?

Achiron 2004

No information

No information

ACISS 2010

No information

No information

BENEFIT 2006

Yes, active monitoring.“Regular visits were scheduled for safety assessments at months 3, 6, 9, 12, 18, and 24”. (page 1243)

No information

BENEFIT 2007 (3 years FU)

No information

No information

BENEFIT 2009 (5 years FU)

No information

No information

BENEFIT 2014 (8.7 years FU)

No information

No information

BENEFIT 2016 (11 years FU)

No information

No information

CHAMPS 2000

No active monitoring. "Each center was instructed to report all adverse events during the first six months of treatment, but thereafter to report only serious adverse events". (page 899)

No information

CHAMPS 2006 (5 years FU)

No information

No information

CHAMPS 2012 (10 years FU)

No information

No information

ETOMS 2001

Yes, active monitoring. "Safety was assessed at 1, 6, 12, 18, 24 months". (page 1577)

Yes to both questions. "Serious adverse events were defined according to the guidelines of the International Conference on Harmonisation". (page 1580)

GERONIMUS 2013

No information

No information

Motamed 2007

Yes, active monitoring."Safety assessments were performed at the end of months 1, 2, 3, 9, 15, and 21 by a neurologist". (page 345)

No information

MSBASIS 2016

No information

No information

ORACLE 2014

Yes, active monitoring. "Adverse events and laboratory findings were recorded at study visits and at regularly scheduled interim visits" (page 259). "International Conference on Harmonisation of Technical Requirements for Registration of Pharmaceuticals for Human Use". (page 258)

Yes to both questions. "International Conference on Harmonisation of Technical Requirements for Registration of Pharmaceuticals for Human Use". (page 258)

Pakdaman 2007

No information

No information

PRECISE 2009

Unclear whether the researchers actively monitored for adverse events or they simply provided spontaneous reporting of adverse events

No information

PRECISE 2013 (5 years FU)

Unclear whether the researchers actively monitored for adverse events or they simply provided spontaneous reporting of adverse events

No information

REFLEX 2012

Yes, active monitoring. "Active monitoring by personnel was ensured via various testing". (page 34). "Adverse events were coded with the Medical Dictionary for Regulatory Activities (MedDRA) and analysed according to the preferred terms". (page 35)

Yes to both questions."Adverse events were coded with the Medical Dictionary for Regulatory Activities (MedDRA) and analysed according to the preferred terms". (page 35)

REFLEX 2016 (3 and 5 years FU)

Unclear. "Adverse events (adverse events) were monitored at months 25 and 27 and then every 3 months to the study end". (page 2)

No information

Tintore 2015

No information

No information

TOPIC 2014

Unclear. "Adverse events were reported by study participants or investigators throughout the study; investigators recorded all such events on case report forms". (page 979)

No information

Figuras y tablas -
Table 3. Assessment of adverse events monitoring, definition and reporting of serious adverse events
Table 4. Outcome data from cohort studies

ACISS 2010

Early DMDs treatment (N = 49)

Delayed DMDs treatment (N = 57)

No treatment

(N = 52)

EDSS score over 24 months' follow‐up

Mean (SD)

Median (range)

Kruskal–Wallis H‐Test P value <0.001

1.2 (0.9)

1.5 (0‐3)

1.6 (1.2)

1.5 (0‐6)

0.8 (0.8)

1.0 (0‐3)

P value versus no treatment

0.016

< 0.001

NA

P value early versus delayed treatment (Wilcoxon matched pair test)

0.055

NA

NA

Relapses

Mean (SD)

Median (range)

Kruskal–Wallis H‐Test P value < 0.001

0.5 (0.8)

0.0 (0‐4)

1.0 (1.1)

1.0 (0‐4)

0.2 (0.5)

0.0 (0‐3)

P value versus no treatment

0.059

< 0.001

NA

P value early versus delayed treatment (Wilcoxon matched pair test)

0.01

NA

NA

Tintore 2015

Risk of attaining an EDSS score of 3.0 with early DMDs compared with delayed DMDs treatment.

Adjusted hazard ratio: 0.5 (95% CI 0.3 to 0.9)

Unadjusted hazard ratio: 1.1 (95% CI 0.7 to 1.9)

DMDs: disease‐modifying drugs. EDSS: expanded disability status scale; NA: not applicable; SD: standard deviation

Figuras y tablas -
Table 4. Outcome data from cohort studies
Table 5. Time until the delayed treatment in open‐label extension studies

Study

Time until the delayed treatment after randomisation

BENEFIT 2006

Mean (SD): 1.5 (0.73) years

CHAMPS 2000

Median (interquartile range): 30 (24‐35) months

PRECISE 2009

Median (range): 29 (0.5 –38) months

REFLEX 2012

Data not reported

Figuras y tablas -
Table 5. Time until the delayed treatment in open‐label extension studies
Table 6. Safety outcome data from open‐label extension studies

Interferon beta‐1b

Intramuscular interferon beta 1‐a (Avonex)

Subcutaneous interferon beta 1‐a (Rebif)

Glatiramer acetate

Participants

487

383

517

481

Serious adverse events ‐ number of participants

123

65

49

60

Discontinued treatment for any adverse events

Not reported

Not reported

20

71

Discontinued treatment or were lost to follow‐up for any reason

204

Not reported

146

192

Years of follow‐up

8.7

10

5

5

Figuras y tablas -
Table 6. Safety outcome data from open‐label extension studies
Comparison 1. Active intervention versus placebo

Outcome or subgroup title

No. of studies

No. of participants

Statistical method

Effect size

1 Occurrence of at least one serious adverse event over 24 months Show forest plot

7

3385

Odds Ratio (M‐H, Random, 95% CI)

0.78 [0.60, 1.03]

1.1 Interferon beta‐1b (Betaseron) versus placebo

1

468

Odds Ratio (M‐H, Random, 95% CI)

1.00 [0.48, 2.11]

1.2 Interferon beta‐1a (Avonex) versus placebo

1

383

Odds Ratio (M‐H, Random, 95% CI)

0.60 [0.28, 1.27]

1.3 Interferon beta‐1a (Rebif) versus placebo

2

823

Odds Ratio (M‐H, Random, 95% CI)

0.72 [0.35, 1.46]

1.4 Glatiramer acetate versus placebo

1

481

Odds Ratio (M‐H, Random, 95% CI)

0.55 [0.25, 1.17]

1.5 Teriflunomide versus placebo

1

614

Odds Ratio (M‐H, Random, 95% CI)

1.06 [0.59, 1.89]

1.6 Cladribine versus placebo

1

616

Odds Ratio (M‐H, Random, 95% CI)

0.77 [0.43, 1.37]

2 Occurrence of at least one serious adverse event over 36 months Show forest plot

1

Odds Ratio (M‐H, Random, 95% CI)

Subtotals only

2.1 Interferon beta‐1a (Avonex) versus placebo

1

202

Odds Ratio (M‐H, Random, 95% CI)

1.23 [0.44, 3.45]

3 Withdrawing from the study or discontinuing the drug due to adverse events over 24 months Show forest plot

5

2693

Odds Ratio (M‐H, Random, 95% CI)

2.43 [0.91, 6.49]

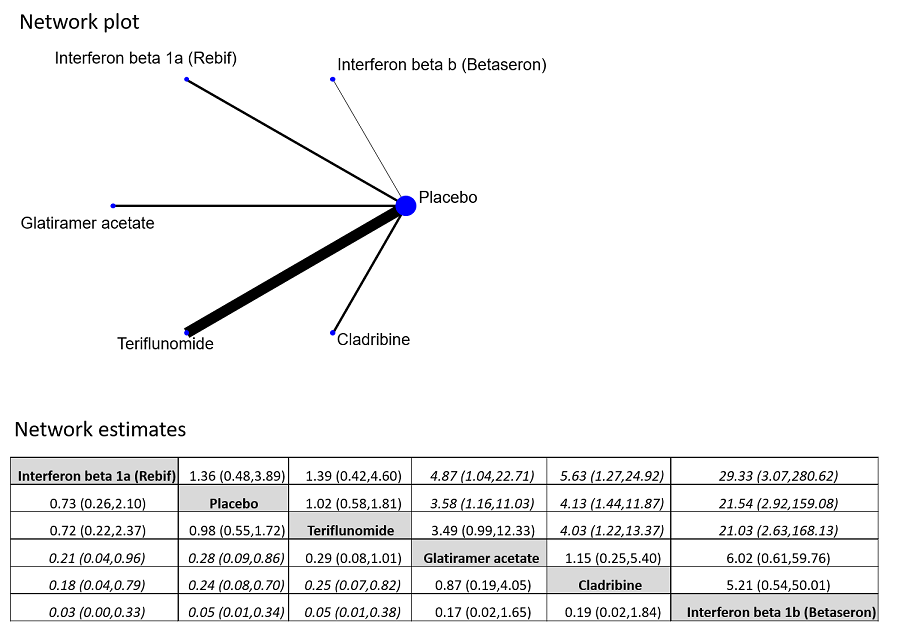
3.1 Interferon beta‐1b (Betaseron) versus placebo

1

468

Odds Ratio (M‐H, Random, 95% CI)

21.54 [2.92, 159.08]

3.2 Interferon beta‐1a (Rebif) versus placebo

1

514

Odds Ratio (M‐H, Random, 95% CI)

0.73 [0.26, 2.10]

3.3 Glatiramer acetate versus placebo

1

481

Odds Ratio (M‐H, Random, 95% CI)

3.58 [1.16, 11.03]

3.4 Teriflunomide versus placebo

1

614

Odds Ratio (M‐H, Random, 95% CI)

1.02 [0.58, 1.81]

3.5 Cladribine versus placebo

1

616

Odds Ratio (M‐H, Random, 95% CI)

4.13 [1.44, 11.87]

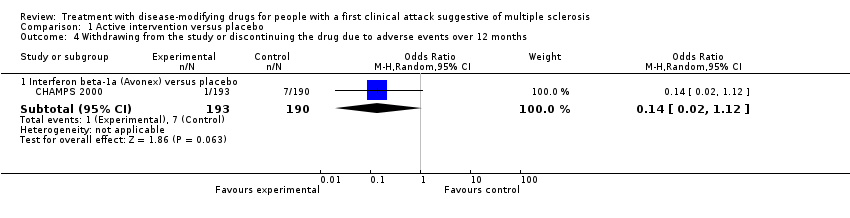
4 Withdrawing from the study or discontinuing the drug due to adverse events over 12 months Show forest plot

1

Odds Ratio (M‐H, Random, 95% CI)

Subtotals only

4.1 Interferon beta‐1a (Avonex) versus placebo

1

383

Odds Ratio (M‐H, Random, 95% CI)

0.14 [0.02, 1.12]

5 Time to conversion to CDMS over 24 months Show forest plot

9

Hazard Ratio (Random, 95% CI)

0.53 [0.47, 0.60]

5.1 Interferon beta‐1b (Betaseron) versus placebo

1

Hazard Ratio (Random, 95% CI)

0.50 [0.36, 0.69]

5.2 Interferon beta‐1a (Avonex) versus placebo

1

Hazard Ratio (Random, 95% CI)

0.56 [0.38, 0.83]

5.3 Interferon beta‐1a (Rebif) versus placebo

2

Hazard Ratio (Random, 95% CI)

0.57 [0.43, 0.77]

5.4 Glatiramer acetate versus placebo

1

Hazard Ratio (Random, 95% CI)

0.55 [0.40, 0.76]

5.5 Teriflunomide versus placebo

1

Hazard Ratio (Random, 95% CI)

0.57 [0.38, 0.86]

5.6 Cladribine versus placebo

1

Hazard Ratio (Random, 95% CI)

0.38 [0.25, 0.58]

5.7 Any DMD vs no treatment

2

Hazard Ratio (Random, 95% CI)

0.48 [0.30, 0.78]

6 Time to conversion to CDMS over 12 months Show forest plot

1

Hazard Ratio (Random, 95% CI)

Subtotals only

6.1 Immunoglobulins versus placebo

1

Hazard Ratio (Random, 95% CI)

0.36 [0.15, 0.86]

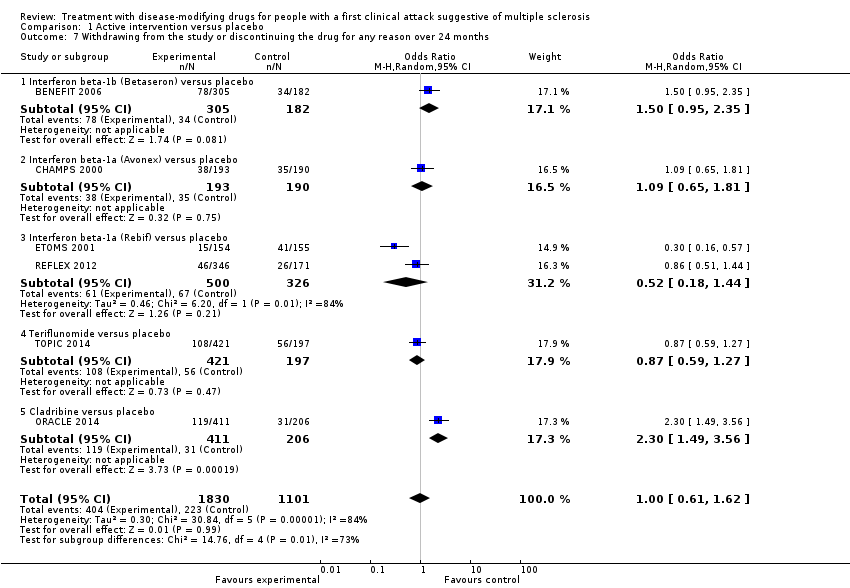
7 Withdrawing from the study or discontinuing the drug for any reason over 24 months Show forest plot

6

2931

Odds Ratio (M‐H, Random, 95% CI)

1.00 [0.61, 1.62]

7.1 Interferon beta‐1b (Betaseron) versus placebo

1

487

Odds Ratio (M‐H, Random, 95% CI)

1.50 [0.95, 2.35]

7.2 Interferon beta‐1a (Avonex) versus placebo

1

383

Odds Ratio (M‐H, Random, 95% CI)

1.09 [0.65, 1.81]

7.3 Interferon beta‐1a (Rebif) versus placebo

2

826

Odds Ratio (M‐H, Random, 95% CI)

0.52 [0.18, 1.44]

7.4 Teriflunomide versus placebo

1

618

Odds Ratio (M‐H, Random, 95% CI)

0.87 [0.59, 1.27]

7.5 Cladribine versus placebo

1

617

Odds Ratio (M‐H, Random, 95% CI)

2.30 [1.49, 3.56]

8 Withdrawing from the study or discontinuing the drug for any reason over 12 months Show forest plot

1

Odds Ratio (M‐H, Random, 95% CI)

Subtotals only

8.1 Immunoglobulins versus placebo

1

91

Odds Ratio (M‐H, Random, 95% CI)

2.15 [0.37, 12.35]

Figuras y tablas -
Comparison 1. Active intervention versus placebo
Comparison 2. Early versus delayed treatment

Outcome or subgroup title

No. of studies

No. of participants

Statistical method

Effect size

1 Time to conversion to CDMS at different follow‐up years Show forest plot

10

Hazard Ratio (Random, 95% CI)

Subtotals only

1.1 2‐4 years' follow‐up

5

Hazard Ratio (Random, 95% CI)

0.62 [0.48, 0.81]

1.2 5 years' follow‐up

4

Hazard Ratio (Random, 95% CI)

0.62 [0.53, 0.73]

1.3 8.7‐10 years' follow‐up

2

Hazard Ratio (Random, 95% CI)

0.65 [0.54, 0.79]

Figuras y tablas -
Comparison 2. Early versus delayed treatment