Intervenciones farmacológicas para la apatía en la enfermedad de Alzheimer
Información
- DOI:
- https://doi.org/10.1002/14651858.CD012197.pub2Copiar DOI

- Base de datos:
-
- Cochrane Database of Systematic Reviews
- Versión publicada:
-
- 04 mayo 2018see what's new
- Tipo:
-
- Intervention
- Etapa:
-
- Review
- Grupo Editorial Cochrane:
-
Grupo Cochrane de Demencia y trastornos cognitivos
- Copyright:
-
- Copyright © 2018 The Cochrane Collaboration. Published by John Wiley & Sons, Ltd.
Cifras del artículo
Altmetric:
Citado por:
Autores
Contributions of authors
Myuri T Ruthirakuhan (MTR) performed protocol development, correspondence, drafting review versions, selection of randomized controlled trials (RCTs), extraction of data; assessing risk of bias, data entry, data analysis, GRADE, interpretation of data/analyses.
Nathan Herrmann (NH) performed supervision and development of the protocol and review versions.
Eleanor H Abraham (EHA) assisted with selection of RCTs, extraction of data, assessing risk of bias, and drafting characteristics of included studies.
Sarah Chan (SC) assisted with selection of RCTs and extraction of data.
Krista L Lanctot (KLL) performed supervision and development of the protocol and review versions.
Sources of support
Internal sources
-
No sources of support supplied
External sources
-
NIHR, UK.
This review was supported by the National Institute for Health Research, via Cochrane Infrastructure funding to the Cochrane Dementia and Cognitive Improvement group. The views and opinions expressed therein are those of the authors and do not necessarily reflect those of the Systematic Reviews Programme, NIHR, NHS or the Department of Health
Declarations of interest
KLL is the executive director of the Medical Outcomes and Research in Economics (MORE®) Research group. She currently receives research funding from AbbVie Laboratories, Novartis Canada, F. Hoffman‐La Roche, and Lundbeck Canada, is funded by grants from the National Institute of Health, the Canadian Institutes of Health Research, Brain Canada, the Alzheimer Society of Canada, the Heart and Stroke Foundation, Weston Brain Institute and the Alzheimer’s Disease Discovery Fund.
NH receives research funding from Lundbeck Canada Inc., Roche, Transition Therapeutics, and holds grants from the National Institute of Health, the Canadian Institutes of Health Research, the Alzheimer Society of Canada, the Alzheimer’s Drug Discovery Foundation, the Heart and Stroke Foundation and the Physicians’ Services Incorporated Foundation. He has received consultation fees from Eli Lilly and AbbVie.
MTR is funded by a CIHR Doctoral Research Award (the Frederick Banting and Charles Best Canada Graduate Scholarships Doctoral Award).
EHA does not have any known conflicts of interest.
SC does not have any known conflicts of interest.
Acknowledgements
We would like to thank the Cochrane Dementia and Cognitive Improvement Group for their non‐author contributions to the study appraisal and search strategy development. We would also like to thank Ruths 2008 and the ADCS group (Tariot 2011) for providing data upon request.
Version history
| Published | Title | Stage | Authors | Version |
| 2018 May 04 | Pharmacological interventions for apathy in Alzheimer's disease | Review | Myuri T Ruthirakuhan, Nathan Herrmann, Eleenor H Abraham, Sarah Chan, Krista L Lanctôt | |
| 2016 May 13 | Pharmacological interventions for apathy in Alzheimer's disease | Protocol | Myuri T Ruthirakuhan, Nathan Herrmann, Eleenor H Abraham, Krista L Lanctôt | |
Differences between protocol and review
In the original protocol, primary and secondary outcome measures were going to be analyzed for all drug comparisons. However, many studies investigated apathy as a secondary outcome measure only, and thus did not directly target this symptom in their investigation. Furthermore, as there were a limited number of studies within each drug comparison, investigating apathy as a secondary outcome measure, meaningful results on safety, overall NPS, cognition, function, clinical deterioration, and dropouts due AEs could not be interpreted. As such, we have created two Objectives for this meta‐analysis. Objectives 1 and 2 investigated the efficacy of pharmacotherapies on apathy in studies which investigated this as a primary or a secondary outcome measure respectively.
Keywords
MeSH
Medical Subject Headings (MeSH) Keywords
- Alanine [analogs & derivatives, therapeutic use];
- Alzheimer Disease [complications, *psychology];
- Antidepressive Agents [therapeutic use];
- Apathy [*drug effects];
- Azepines [therapeutic use];
- Benzhydryl Compounds [therapeutic use];
- Biphenyl Compounds [therapeutic use];
- Central Nervous System Stimulants [adverse effects, *therapeutic use];
- Cholinesterase Inhibitors [therapeutic use];
- Methylphenidate [adverse effects, therapeutic use];
- Modafinil;
- Randomized Controlled Trials as Topic;
- Sulfonamides [therapeutic use];
- Valproic Acid [therapeutic use];
Medical Subject Headings Check Words
Humans;
PICO

2Study flow diagram.

Risk of bias summary: review authors' judgements about each risk of bias item for each included study.

Figure 3 CaptionRisk of bias graph: review authors' judgements about each risk of bias item presented as percentages across all included studies.

Forest plot of comparison: 7 Methylphenidate, outcome: 7.1 Apathy (AES only).

Forest plot of comparison: 7 Methylphenidate, outcome: 7.3 Adverse Events.

Forest plot of comparison: 3 Cholinesterase Inhibitors, outcome: 3.1 Change in apathy from baseline as measured by the NPI‐apathy subscore (subgroup analysis with licensed versus unlicensed ChEIs).

Comparison 1 Methylphenidate, Outcome 1 Change in apathy from baseline as measured by the AES.

Comparison 1 Methylphenidate, Outcome 2 Change in apathy from baseline as measured by the NPI‐apathy subscore.

Comparison 1 Methylphenidate, Outcome 3 Adverse Events.

Comparison 1 Methylphenidate, Outcome 4 Change in NPS from baseline as measured by the NPI.

Comparison 1 Methylphenidate, Outcome 5 Change in cognition from baseline as measured by the MMSE.

Comparison 1 Methylphenidate, Outcome 6 Change in functional permance from baseline as measured by the ADL.

Comparison 1 Methylphenidate, Outcome 7 Change in functional performance from baseline as measured by the IADL.

Comparison 1 Methylphenidate, Outcome 8 Change in global disease severity from baseline as measured by the CGIC and the ADCS‐CGIC.

Comparison 1 Methylphenidate, Outcome 9 Dropouts due to adverse events.

Comparison 2 Modafinil, Outcome 1 Change in apathy from baseline as measured by the FrSBe‐apathy subscale.

Comparison 2 Modafinil, Outcome 2 Change in functional performance from baseline as measured by the ADL‐Q.
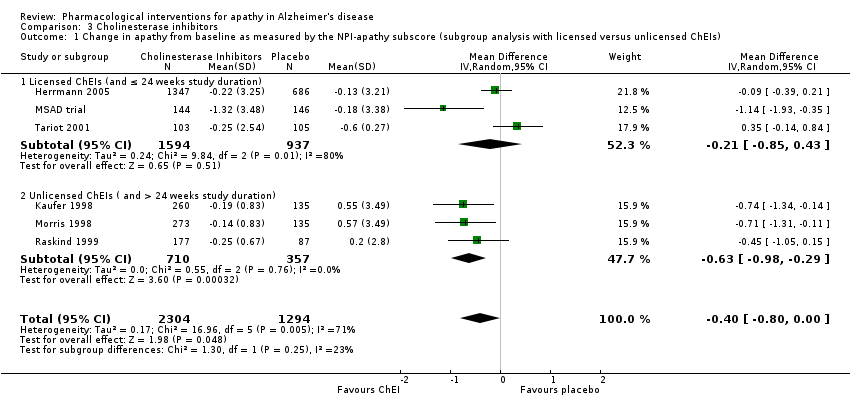
Comparison 3 Cholinesterase inhibitors, Outcome 1 Change in apathy from baseline as measured by the NPI‐apathy subscore (subgroup analysis with licensed versus unlicensed ChEIs).

Comparison 3 Cholinesterase inhibitors, Outcome 2 Change in apathy from baseline as measured by the NPI‐apathy subscore (subgroup analysis with disease severity).

Comparison 4 Discontinuation of cholinesterase inhibitors, Outcome 1 Change in apathy from baseline as measured by the NPI‐apathy subscore.

Comparison 5 Atypical antipsychotics, Outcome 1 Change in apathy from baseline as measured by the NPI‐apathy subscore and the BPRS withdrawn depression factor score.

Comparison 6 Discontinuation of antipsychotics, Outcome 1 Change in apathy from baseline as measured by the NPI‐apathy subscore.

Comparison 7 Antidepressants, Outcome 1 Change in apathy from baseline as measured by the NPI‐apathy subscore.

Comparison 8 Mibampator, Outcome 1 Change in apathy from baseline as measured by the FrSBe‐apathy T score.

Comparison 9 Valproate, Outcome 1 Change in apathy from baseline as measured by the NPI‐apathy subscore and GIP‐apathy subscore.

Comparison 10 Semagacestat, Outcome 1 Change in apathy from baseline as measured by the NPI‐apathy subscore.
| Methylphenidate compared to placebo for apathy in Alzheimer's disease | ||||||
| Patient or population: Apathy in people with mild‐to‐moderate Alzheimer's disease | ||||||
| Outcomes | Anticipated absolute effects* (95% CI) | Relative effect | № of participants | Quality of the evidence | Comments | |
| Risk with placebo | Risk with Methylphenidate | |||||
| Change in apathy (AES score) | The mean change from baseline in apathy was ‐4.2 to 0.6 | MD 4.99 lower | ‐ | 145 | ⊕⊕⊝⊝ | AES: Limited data on clinically meaningful changes |
| Change in apathy (NPI‐apathy subscale score) | The mean change from baseline in apathy ‐2.6 to ‐1.69 | MD 0.08 lower | ‐ | 85 | ⊕⊕⊝⊝ | 1‐ to 2‐point change suggested to be clinically significant in people with a clinically significant apathy (Rosenberg 2013) |
| Adverse events | Study population | RR 1.28 | 145 | ⊕⊕⊝⊝ | ‐ | |
| 534 per 1000 | 684 per 1000 | |||||
| Change in NPS | The mean change from baseline in NPS was ‐2.08 | MD 0.16 higher | ‐ | 25 | ⊕⊕⊝⊝ | 4‐point change suggested to be clinically significant |
| Change in cognition | The mean change from baseline in cognition was ‐1.08 to ‐0.3 | MD 1.79 higher | ‐ | 145 | ⊕⊕⊕⊝ | MMSE: 2‐ to 4‐point change suggested to be clinically significant |
| Change in functional performance assessed with: ADL scale | The mean change from baseline in functional performance was 0.4 | MD 0.50 higher | ‐ | 60 | ⊕⊕⊕⊝ | Limited data on clinically meaningful changes |
| Change in functional performance assessed with: IADL scale | The mean change from baseline in functional performance was ‐0.6 | MD 2.30 higher | ‐ | 60 | ⊕⊕⊕⊝ | Limited data on clinically meaningful changes |
| Change in global disease severity | Study population | RR 0.56 | 85 | ⊕⊕⊕⊝ | ‐ | |
| 116 per 1000 | 65 per 1000 | |||||
| Dropouts | Study population | RR 2.10 | 145 | ⊕⊕⊝⊝ | ‐ | |
| 41 per 1000 | 86 per 1000 | |||||
| *The risk in the intervention group (and its 95% confidence interval) is based on the assumed risk in the comparison group and the relative effect of the intervention (and its 95% CI). AD: Alzheimer's disease; AEs: Adverse Events; MMSE: Mini‐Mental Status Examination; MD: Mean Difference; NPS: Neuropsychiatric Symptom, SMD: Standardized Mean Difference, CI: Confidence interval; RR: Risk ratio; OR: Odds ratio | ||||||
| GRADE Working Group grades of evidence | ||||||
| 1Quality downgraded one level due imprecision (wide 95% confidence interval). | ||||||
| Modafinil compared to placebo for apathy in Alzheimer's disease | ||||||
| Patient or population: Apathy in people with mild‐to‐moderate Alzheimer's disease | ||||||
| Outcomes | Anticipated absolute effects* (95% CI) | Relative effect | № of participants | Quality of the evidence | Comments | |
| Risk with placebo | Risk with Modafinil | |||||
| Change in apathy | The mean change from baseline in apathy was ‐6.82 | MD 0.27 higher | ‐ | 22 | ⊕⊕⊝⊝ | Limited data on clinically meaningful changes on the FrSBe apathy score |
| Adverse Events ‐ reported, but not analyzed in this review | ‐ | ‐ | ‐ | ‐ | ‐ | ‐ |
| Change in NPS ‐ not investigated | ‐ | ‐ | ‐ | ‐ | ‐ | ‐ |
| Change in cognition ‐ not investigated | ‐ | ‐ | ‐ | ‐ | ‐ | ‐ |
| Change in functional performance | The mean change from baseline in functional performance was 0 | MD 0.54 lower | ‐ | 22 | ⊕⊕⊝⊝ | Limited data on clinically meaningful changes |
| Change in global disease severity ‐ not investigated | ‐ | ‐ | ‐ | ‐ | ‐ | ‐ |
| Dropouts ‐ reported, but not analyzed in this review | ‐ | ‐ | ‐ | ‐ | ‐ | ‐ |
| *The risk in the intervention group (and its 95% confidence interval) is based on the assumed risk in the comparison group and the relative effect of the intervention (and its 95% CI). | ||||||
| GRADE Working Group grades of evidence | ||||||
| 1Quality downgraded two levels due to small sample size and imprecision (wide 95% confidence interval). | ||||||
| STUDY DURATION | N OF PARTICIPANTS | Diagnosis | MEAN AGE (YRS) | MEAN MMSE (SD) | MEAN BL NPI‐APATHY (SD) score | COUNTRY | NUMBER OF SITES | TREATMENT GROUPS | |
| METHYLPHENIDATE | |||||||||
| 2 weeks Cross‐over design: 2 treatment phases of 2 weeks with a 1‐week washout between phases | 13 total | Possible or probable AD (NINCDS‐ADRDA), and apathy (NPI‐apathy subscale ≥ 1) | 77.9 (7.8) | 19.9 (4.7) | 5.9 (3) | Canada | 3 | Group 1: Methylphenidate (10 mg twice a day) | |
| 6 weeks | 60 participants | Possible or probable AD (NINCDS‐ADRDA), and clinically significant apathy for at least 4 weeks | 76 (8) | 20 (5) | Group 1: 7 (2) | USA, Canada | 3 | Group 1: Methylphenidate (target: 20 mg daily) | |
| 12 weeks | 60 participants | Dementia of the AD type (DSM‐IV‐TR), and presence of apathy (AES > 40) | 76.6 (7.9) | 23.8 (2.5) | Not reported | USA | 1 | Group 1: Methylphenidate (target: 20 mg daily) | |
| MODAFINIL | |||||||||
| 8 weeks | Group 1: 11 | Possible or probable AD (NINCDS‐ADRDA criteria) and clinically significant apathy (FrSBe Tscore ≥ 65) | Group 1: 75.3 (8.3) | Not disclosed | Not reported | USA | 1 | Group 1: Modafinil (200 mg daily) | |
| CHOLINESTERASE INHIBITORS | |||||||||
| 24 weeks | Group 1: 103 Group 2: 105 | Possible or probable AD with cerebrovascular disease (but not vascular dementia) (NINCDS‐ADRDA criteria) | Group 1: 85.4 | Group 1: 14.4 (5.4) | Not reported | USA | 27 | Group 1: Donepezil ‐ 5 mg/day for 28 days. 10 mg/day after 28 days based on tolerability. | |
| 24 weeks | Group 1: 144 | AD (DSM‐IV and NINCDS‐ADRDA criteria) | 73.6 | Group 1: 11.7 (0.35) | Group 1: | Canada, Australia, France | 32 | Group 1: Donepezil ‐ 5 mg/day for 28 days. 10 mg/day after 28 days based on tolerability. | |
| Range: 3 ‐ 6 months (12 ‐ 24 weeks) | Group 1: 1347 | Probable AD (NINCDS‐ADRDA criteria) | 76 | 18 | Group 1: | USA, Canada, Great Britain, South Africa, Australia, and New Zealand | Multicenter, but number not disclosed | Group 1: Galantamine | |
| 26 weeks | Group 1: 273 | Probable AD (NINCDS‐ADRDA criteria) | Not reported | Not reported | Not reported | USA | 25 | Group 1: Metrifonate (2 weeks – 2.0 mg/kg, followed by 0.65 mg/kg) | |
| 26 weeks | Group 1: 273 | Probable AD (NINCDS‐ADRDA criteria) | Group 1: 73.5 (8.1) | Group 1: 18.8 (5) | Not reported | USA | 24 | Group 1: Metrifonate (2 weeks – 2.0 mg/kg, followed by 0.65 mg/kg) | |
| 26 weeks | Group 1: 177 | Probable AD (NINCDS‐ADRDA criteria) mild‐moderate AD | Group 1: 74.6 (8.3) | Group 1: 18.7 (4.76) | Not reported | USA (additional sites are not disclosed) | Multicenter, but number not disclosed | Group 1: | |
| CHOLINESTERASE DISCONTINUATION | |||||||||
| 8 weeks | Group 1: 21 | Probable AD (NINCDS‐ADRDA criteria) | 89.3 | Group 1: 8.1(5.2) | Group 1: | Canada | 2 | Group 1: Donepezil, | |
| ATYPICAL ANTIPSYCHOTICS | |||||||||
| 10 weeks | Group 1: 132 | Possible or probable AD (NINCDS‐ADRDA criteria and DSM‐IV‐TR), and clinically significant psychotic symptoms | 76.6 (10.4) | 13.7 (5.1) | Group 1: 3.2 (3.9) | Europe, Australia, Israel, Lebanon, and South Africa | 61 | Group 1: 7.5 mg OLZ | |
| Up to 36 weeks (12 weeks of treatment) data available | Group 1: 100 | Dementia of the AD type (DSM‐IV) or probable AD (NINCDS‐ADRDA) and daily delusions, hallucinations, agitation, or aggression over 4 weeks prior to study entry | 77.9 (7.5) | Group 1: 15 (5.4) | Not reported | USA | 42 | Group 1: OLZ | |
| ANTIPSYCHOTIC DISCONTUATION | |||||||||
| 4 weeks | Group 1: 28 | Dementia diagnosis according to ICD‐10 | 83.4 (6.9) | Not provided | Group 1: | Norway | 9 | Group 1: Antipsychotics (haloperidol, risperidone, or olanzapine) | |
| ANTIDEPRESSANTS | |||||||||
| 4 weeks: Cross‐over design: 2 treatment phases of 4 weeks with a 1‐week washout between phases | 22 total | Primary degenerative dementia (DSM‐IV) and probable AD (NINCDS‐ADRDA), and significant behavioral problems (NPI ≥ 8) | 82 (6) | 4.1 (4.7) | Group 1: | Canada | 3 | Group 1: Sertraline (100 mg daily) | |
| 9 weeks | Group 1: 94 | Probable AD (NINCDS‐ADRDA), and significant behavioral problems (NPI ≥ 8), and clinically significant agitation on the NPI > 3 | Group 1: 78 (9) | Group 1: 17 (6.2) | Group 1: | USA | 6 | Group 1: Citalopram (30 mg daily) | |
| MIBAMPATOR | |||||||||
| 12 weeks | Group 1: 63 | Probable AD (NINCDS‐ADRDA) (DSM‐IV‐TR), and clinically significant agitation/aggression | Group 1: 77.2 (8.2) | Group 1: 16.0 (6.1) Group 2: 18 (5.3) | Not reported | USA | Multicenter, but number not disclosed | Group 1: Mibampator (target dose: 3 mg daily) | |
| VALPROATE | |||||||||
| 6 weeks: Cross‐over design: 2 treatment phases of 6 weeks with a 2‐week washout between phases | Group 1: 14 | Probable AD (NINCDS‐ADRDA), primary degenerative dementia (DSM‐IV) | 85.6 (4.5) | 4.5 (4.6) | Group 1: 2.4 (3.8) | Canada | 2 | Group 1: Valproate (mean dose: 1134.6 (400.1) mg daily) | |
| 3 weeks: Cross‐over design: 2 treatment phases of 3 weeks with a 1‐week washout between phases | Group 1: 42 | Senile dementia (NINCDS‐ADRDA)(DSM‐IV) | 80.4 (6.8) | 11.4 (5) | Not reported | Netherlands | 1 | Group 1: Valproate (2 x 240 mg) | |
| 24 months (+ 2‐month single‐blind placebo phase) | Group 1: 153 | Possible or probable AD (NINCDS‐ADRDA) | Group 1: 74.9 | Group 1: 16.9 (3.0) | Group 1: | USA | 46 | Group 1: Valproate (flexible‐dose) (mean modal dose: 250 mg daily) | |
| SEMAGACESTAT | |||||||||
| 76 weeks | Group 1: 463 | Mild‐moderate AD (NINCDS‐ADRDA) | Group 1: 72.7 (7.9) | Group 1: 20.9 (3.5) | Not reported | USA | 91 | Group 1: LY100 | |
| AD: Alzheimer's disease, BL: baseline, DSM: Diagnostic and Statistical Manual of Mental Disoders, FrSBe: Frontal Systems Behavior Scale, ICD: International Classification of Diseases, LY: LY450319 (Eli Lillyand Company study drug), NINCDS‐ADRDA: National Institute of Neurological and Communicative disorders and the Alzheimer's Disease and Related Disorders Association, NPI: Neuropsychiatric Inventory, OLZ: olanzapine, QUE: quetiapine, RIS: risperidone, SD: standard deviation. | |||||||||
| Study | Apathy | AE reported | NPS | Cognition | Function | Global Change | Dropouts due to AEs reported |
| METHYLPHENIDATE | |||||||
| AES‐Informant | Yes | NPI‐total | MMSE | N/A | CGI‐C | Yes | |
| AES‐Informant | Yes | NPI‐total (not reported) | MMSE | N/A | ADCS‐CGIC | Yes | |
| AES‐Clinician | Yes | N/A | MMSE | ADL | N/A | Yes | |
| MODAFINIL | |||||||
| FrSBe‐apathy subscale | Yes | N/A | N/A | ADLQ | N/A | Yes | |
| CHOLINESTERASE INHIBITORS | |||||||
| NPI‐apathy subscale | These outcomes were not investigated for this drug comparison | ||||||
| NPI‐apathy subscale | |||||||
| NPI‐apathy subscale | |||||||
| NPI‐apathy subscale | |||||||
| NPI‐apathy subscale | |||||||
| NPI‐apathy subscale | |||||||
| CHOLINESTERASE DISCONTINUATION | |||||||
| NPI‐apathy subscale | These outcomes were not investigated for this drug comparison. | ||||||
| ATYPICAL ANTIPSYCHOTICS | |||||||
| NPI‐apathy subscale | These outcomes were not investigated for this drug comparison | ||||||
| BPRS‐withdrawn depression factor score | |||||||
| ANTIPSYCHOTIC DISCONTINUATION | |||||||
| NPI‐apathy subscale | These outcomes were not investigated for this drug comparison | ||||||
| ANTIDEPRESSANTS | |||||||
| NPI‐apathy subscale | These outcomes were not investigated for this drug comparison | ||||||
| NPI‐apathy subscale | |||||||
| MIBAMPATOR | |||||||
| FrSBe‐apathy T score | These outcomes were not investigated for this drug comparison | ||||||
| VALPROATE | |||||||
| NPI‐apathy subscale | These outcomes were not investigated for this drug comparison | ||||||
| GIP‐apathetic behavior subscore | These outcomes were not investigated for this drug comparison | ||||||
| NPI‐apathy subscale | These outcomes were not investigated for this drug comparison | ||||||
| SEMAGACESTAT | |||||||
| NPI‐apathy | These outcomes were not investigated for this drug comparison | ||||||
| ADCS‐CGIC: Alzheimer's Diserase Cooperative Study ‐ Clinical Global Impression of Change, ADL: Activities of Daily Living scale, ADLQ: Lawton and Brody Fucntional Assessment, AES: Apathy Evaluation Scale, CGI‐C: Clinical Global Impression of Change, FrSBe: Frontal Systems Behavior Scale, GIP: The Behavior Observation Scale for Intramural Psychogeriatric Patients, IADL: Instrumental Activities of Daily Living Scale, MMSE: Mini‐Mental State Examination, NPI: Neuropsychiatric Inventory. | |||||||
| Outcome or subgroup title | No. of studies | No. of participants | Statistical method | Effect size |
| 1 Change in apathy from baseline as measured by the AES Show forest plot | 3 | 145 | Mean Difference (IV, Random, 95% CI) | ‐4.99 [‐9.55, ‐0.43] |
| 1.1 < 12 weeks | 2 | 85 | Mean Difference (IV, Random, 95% CI) | ‐2.62 [‐4.80, ‐0.44] |
| 1.2 ≥ 12 weeks | 1 | 60 | Mean Difference (IV, Random, 95% CI) | ‐9.90 [‐13.50, ‐6.30] |
| 2 Change in apathy from baseline as measured by the NPI‐apathy subscore Show forest plot | 2 | 85 | Mean Difference (IV, Random, 95% CI) | ‐0.08 [‐3.85, 3.69] |
| 3 Adverse Events Show forest plot | 3 | 145 | Risk Ratio (M‐H, Random, 95% CI) | 1.28 [0.67, 2.42] |
| 3.1 < 12 weeks | 2 | 85 | Risk Ratio (M‐H, Random, 95% CI) | 1.28 [0.44, 3.72] |
| 3.2 ≥ 12 weeks | 1 | 60 | Risk Ratio (M‐H, Random, 95% CI) | 1.44 [0.73, 2.86] |
| 4 Change in NPS from baseline as measured by the NPI Show forest plot | 1 | 25 | Mean Difference (IV, Fixed, 95% CI) | 0.16 [‐7.89, 8.21] |
| 5 Change in cognition from baseline as measured by the MMSE Show forest plot | 3 | 145 | Mean Difference (IV, Fixed, 95% CI) | 1.98 [1.06, 2.91] |
| 5.1 < 12 weeks study duration | 2 | 85 | Mean Difference (IV, Fixed, 95% CI) | 1.00 [‐0.49, 2.49] |
| 5.2 ≥ 12 weeks study duration | 1 | 60 | Mean Difference (IV, Fixed, 95% CI) | 2.6 [1.43, 3.77] |
| 6 Change in functional permance from baseline as measured by the ADL Show forest plot | 1 | 60 | Mean Difference (IV, Fixed, 95% CI) | 0.5 [‐0.39, 1.39] |
| 7 Change in functional performance from baseline as measured by the IADL Show forest plot | 1 | 60 | Mean Difference (IV, Fixed, 95% CI) | 2.3 [0.74, 3.86] |
| 8 Change in global disease severity from baseline as measured by the CGIC and the ADCS‐CGIC Show forest plot | 2 | 85 | Risk Ratio (M‐H, Fixed, 95% CI) | 0.58 [0.16, 2.11] |
| 9 Dropouts due to adverse events Show forest plot | 3 | 145 | Risk Ratio (M‐H, Fixed, 95% CI) | 2.18 [0.64, 7.45] |
| Outcome or subgroup title | No. of studies | No. of participants | Statistical method | Effect size |
| 1 Change in apathy from baseline as measured by the FrSBe‐apathy subscale Show forest plot | 1 | 22 | Mean Difference (IV, Fixed, 95% CI) | 0.27 [‐3.51, 4.05] |
| 2 Change in functional performance from baseline as measured by the ADL‐Q Show forest plot | 1 | 22 | Mean Difference (IV, Fixed, 95% CI) | ‐0.54 [‐1.40, 0.32] |
| Outcome or subgroup title | No. of studies | No. of participants | Statistical method | Effect size |
| 1 Change in apathy from baseline as measured by the NPI‐apathy subscore (subgroup analysis with licensed versus unlicensed ChEIs) Show forest plot | 6 | 3598 | Mean Difference (IV, Random, 95% CI) | ‐0.40 [‐0.80, ‐0.00] |
| 1.1 Licensed ChEIs (and ≤ 24 weeks study duration) | 3 | 2531 | Mean Difference (IV, Random, 95% CI) | ‐0.21 [‐0.85, 0.43] |
| 1.2 Unlicensed ChEIs ( and > 24 weeks study duration) | 3 | 1067 | Mean Difference (IV, Random, 95% CI) | ‐0.63 [‐0.98, ‐0.29] |
| 2 Change in apathy from baseline as measured by the NPI‐apathy subscore (subgroup analysis with disease severity) Show forest plot | 6 | 3598 | Mean Difference (IV, Random, 95% CI) | ‐0.40 [‐0.80, ‐0.00] |
| 2.1 Moderate AD (MMSE ≥ 18) | 4 | 3100 | Mean Difference (IV, Random, 95% CI) | ‐0.43 [‐0.79, ‐0.07] |
| 2.2 Severe AD (MMSE < 18) | 2 | 498 | Mean Difference (IV, Random, 95% CI) | ‐0.36 [‐1.82, 1.10] |
| Outcome or subgroup title | No. of studies | No. of participants | Statistical method | Effect size |
| 1 Change in apathy from baseline as measured by the NPI‐apathy subscore Show forest plot | 1 | 40 | Mean Difference (IV, Fixed, 95% CI) | 1.11 [‐0.88, 3.10] |
| Outcome or subgroup title | No. of studies | No. of participants | Statistical method | Effect size |
| 1 Change in apathy from baseline as measured by the NPI‐apathy subscore and the BPRS withdrawn depression factor score Show forest plot | 2 | 1070 | Std. Mean Difference (IV, Fixed, 95% CI) | 0.14 [0.00, 0.28] |
| Outcome or subgroup title | No. of studies | No. of participants | Statistical method | Effect size |
| 1 Change in apathy from baseline as measured by the NPI‐apathy subscore Show forest plot | 1 | 55 | Mean Difference (IV, Fixed, 95% CI) | ‐0.24 [‐0.51, 0.03] |
| Outcome or subgroup title | No. of studies | No. of participants | Statistical method | Effect size |
| 1 Change in apathy from baseline as measured by the NPI‐apathy subscore Show forest plot | 2 | 126 | Mean Difference (IV, Fixed, 95% CI) | ‐1.24 [‐1.44, ‐1.04] |
| Outcome or subgroup title | No. of studies | No. of participants | Statistical method | Effect size |
| 1 Change in apathy from baseline as measured by the FrSBe‐apathy T score Show forest plot | 1 | 132 | Mean Difference (IV, Fixed, 95% CI) | ‐1.2 [‐1.94, ‐0.46] |
| Outcome or subgroup title | No. of studies | No. of participants | Statistical method | Effect size |
| 1 Change in apathy from baseline as measured by the NPI‐apathy subscore and GIP‐apathy subscore Show forest plot | 3 | 257 | Std. Mean Difference (IV, Fixed, 95% CI) | 0.02 [‐0.23, 0.26] |
| Outcome or subgroup title | No. of studies | No. of participants | Statistical method | Effect size |
| 1 Change in apathy from baseline as measured by the NPI‐apathy subscore Show forest plot | 1 | 939 | Mean Difference (IV, Fixed, 95% CI) | 0.20 [0.15, 0.25] |