Intervenciones farmacológicas para la apatía en la enfermedad de Alzheimer
Resumen
Antecedentes
A pesar de la alta prevalencia de la apatía en la enfermedad de Alzheimer (EA), y sus efectos perjudiciales, actualmente no hay ningún tratamiento comprobado para tratar este síntoma. Recientemente, se han investigado varios tratamientos farmacológicos como tratamientos potenciales para la apatía en la EA.
Objetivos
Objetivo 1: Evaluar la seguridad y la eficacia de las farmacoterapias para el tratamiento de la apatía en la enfermedad de Alzheimer (EA).
Objetivo 2: Evaluar el efecto sobre la apatía de las farmacoterapias investigadas para otros resultados primarios en el tratamiento de la EA.
Métodos de búsqueda
Se hicieron búsquedas en el registro especializado del Grupo Cochrane de Demencia y Trastornos Cognitivos (Specialized Register of the Cochrane Dementia and Cognitive Improvement Group, ALOIS), MEDLINE, Embase, CINAHL, PsycINFO, LILACS, ClinicalTrials.gov y en el World Health Organization (WHO) portal, ICTRP el 17 mayo 2017.
Criterios de selección
Los estudios aptos fueron los ensayos aleatorios, doble ciego, controlados con placebo (ECA) que investigaban la apatía como un resultado primario o secundario en pacientes con EA.
Obtención y análisis de los datos
Tres autores de la revisión extrajeron los datos. Se evaluaron los riesgos de sesgo de los estudios incluidos utilizando los métodos Cochrane y la calidad general de la evidencia para cada resultado utilizando los métodos GRADE. Se calculó la diferencia de medias (DM), la diferencia de medias estandarizada (DME) o el cociente de riesgos (CR) con intervalos de confianza del 95% en una base de intención de tratar para todas las medidas de resultado relevantes.
Resultados principales
Se incluyeron 21 estudios con un total de 6384 participantes en los análisis cuantitativos. El riesgo de sesgo es muy bajo a moderado. Todos los estudios informaron métodos apropiados de asignación al azar y cegamiento. La mayoría de los estudios informaron métodos apropiados de ocultación de la asignación. Cuatro estudios, tres con metilfenidato y uno con modafinilo, tuvieron el objetivo primario de mejorar la apatía. En dichos estudios, todos los participantes presentaban apatía clínicamente significativa al inicio. El metilfenidato puede mejorar la apatía en comparación con placebo. Este hallazgo estaba presente cuando se evaluó la apatía mediante la escala de evaluación de la apatía (AES), que fue utilizada por los tres estudios que investigaron el metilfenidato: DM ‐4,99; IC del 95%: ‐9,55 a ‐0,43; n = 145; tres estudios, evidencia de baja calidad, pero no al evaluar con la subescala de apatía del Neuropsychiatric Inventory (NPI), que fue usado por dos de los tres estudios que investigaban el metilfenidato: DM ‐0,08; IC del 95%: ‐3,85 a 3,69; n = 85, dos estudios, evidencia de baja calidad. Además de tener beneficios potenciales para la apatía, el metilfenidato probablemente también mejora levemente la cognición (DM 1,98; IC del 95%: 1,06 a 2,91; n= 145; tres estudios, evidencia de calidad moderada) y probablemente mejora las actividades cotidianas instrumentales (DM 2,30; IC del 95%: 0,74 a 3,86; p = 0,004; n = 60; un estudio, evidencia de calidad moderada), en comparación con placebo. Puede no haber ninguna diferencia entre el metilfenidato y el placebo en el riesgo de desarrollo de un evento adverso: CR 1,28; IC del 95%: 0,67 a 2,42; n = 145, tres estudios, evidencia de baja calidad. Hubo evidencia insuficiente de un estudio muy pequeño del modafinilo para determinar el efecto del modafinilo sobre la apatía evaluada con la subescala de apatía FrSBe: DM 0,27; IC del 95%: ‐3,51 a 4,05; n = 22, un estudio, evidencia de baja calidad. En todos los otros estudios incluidos, la apatía fue un resultado secundario y los participantes no fueron seleccionados sobre la base de la apatía clínicamente significativa al inicio. La evidencia sobre la apatía proveniente de estos estudios se consideró indirecta y asociada con sesgo de publicación. La evidencia fue de calidad baja o muy baja en cuanto a los inhibidores de la colinesterasa (ICE) (seis estudios), la interrupción de los ICE (un estudio), los antipsicóticos (dos estudios), la interrupción de los antipsicóticos (un estudio), los antidepresivos (dos estudios), el mibampator (un estudio), el valproato (tres estudios) y el semagacestat (un estudio).
Conclusiones de los autores
El metilfenidato puede demostrar un beneficio para la apatía y puede tener beneficios leves para la cognición y el rendimiento funcional en los pacientes con EA, aunque este resultado se asocia con evidencia de baja calidad. El metanálisis es limitado por el número pequeño de estudios dentro de cada clase de fármaco, el riesgo de sesgo, el sesgo de publicación, la imprecisión y la inconsistencia entre los estudios. Debe impulsarse la realización de estudios adicionales dirigidos a los pacientes con EA y apatía clínicamente significativa que investiguen la apatía como una medida de resultado primaria y que presenten una duración mayor y un tamaño de la muestra más grande. Este hecho podría aumentar la calidad de la evidencia para el metilfenidato y podría confirmar si es una farmacoterapia efectiva para la apatía en la EA.
PICO
Resumen en términos sencillos
Farmacoterapias para la apatía en la enfermedad de Alzheimer
Pregunta de la revisión
Se deseaba saber si hay fármacos que son seguros y efectivos para reducir la apatía en los pacientes con enfermedad de Alzheimer.
Antecedentes
La apatía es un estado de interés reducido, falta de iniciativa y actividad reducida. Es un síntoma muy común de la enfermedad de Alzheimer. A menudo es persistente y se sabe que está vinculado a una disminución en la calidad de vida, un deterioro más rápido y más carga para los cuidadores. Los tratamientos efectivos de la apatía podrían mejorar la calidad de vida para los pacientes con enfermedad de Alzheimer y sus familias.
Lo realizado
Se realizaron búsquedas de ensayos controlados aleatorios (ECA) hasta mayo de 2017 que habían comparado cualquier medicación con un placebo (pastilla de simulacro) y medido el efecto sobre la apatía en pacientes con enfermedad de Alzheimer. El interés se centró sólo en los ensayos en los cuales se había decidido al azar si los pacientes que participaban recibían el fármaco de interés o el placebo; este procedimiento se realizó para asegurar que la comparación fuera lo más justa posible.
Datos encontrados
Se encontraron 21 ECA que incluían a más de 6300 pacientes con enfermedad de Alzheimer. Cuatro ensayos de dos fármacos diferentes (metilfenidato y modafinilo) se habían realizado específicamente para estudiar la apatía, de manera que se sabía que todos los pacientes que participaron presentaban apatía significativa antes de comenzar el ensayo. Los otros 17 ensayos tenían otros objetivos primarios, aunque informaron algunos datos sobre la apatía. Los ensayos en general fueron bien diseñados y realizados. A partir de tres ensayos con metilfenidato, se encontró que puede mejorar la apatía, aunque este hecho dependió de cómo se midió la apatía. Los pacientes que recibieron metilfenidato también presentaron resultados algo mejores que los que recibieron placebo en las escalas que midieron la cognición (pensamientos, recuerdos, etc.) y algunas actividades diarias, aunque no estuvo claro si estos efectos fueron suficientemente grandes para ser importantes en la práctica. No se encontró evidencia de que haya causado más efectos secundarios que el placebo. La calidad de esta evidencia fue baja o moderada, de manera que no es posible tener seguridad sobre si otros estudios similares no tendrían diferentes resultados. Hubo sólo un ensayo muy pequeño con modafinilo y no hubo evidencia de que fuera efectivo para la apatía. Los otros 17 ensayos estudiaron diversos fármacos e incluyeron a pacientes que, para empezar, no necesariamente eran significativamente apáticos. Por lo tanto, se creyó que eran sólo indirectamente relevantes a la pregunta de la revisión. También es sumamente probable que otros ensayos de los mismos fármacos hayan medido la apatía pero que no hayan publicado los resultados, de manera que hubo preocupación en cuanto al posible sesgo de publicación (que los estudios encontrados podrían haber sido un subgrupo sesgado). Por lo tanto, se creyó que la calidad de la evidencia para todos estos otros fármacos fue baja o muy baja, lo cual significa que es posible tener una confianza limitada o escasa en los resultados.
Conclusiones
La evidencia actual indica que el metilfenidato puede ser útil para tratar la apatía en la enfermedad de Alzheimer. Sin embargo, deben realizarse más ensayos dirigidos específicamente a la apatía para mejorar la calidad general de la evidencia.
Conclusiones de los autores
Summary of findings
| Methylphenidate compared to placebo for apathy in Alzheimer's disease | ||||||
| Patient or population: Apathy in people with mild‐to‐moderate Alzheimer's disease | ||||||
| Outcomes | Anticipated absolute effects* (95% CI) | Relative effect | № of participants | Quality of the evidence | Comments | |
| Risk with placebo | Risk with Methylphenidate | |||||
| Change in apathy (AES score) | The mean change from baseline in apathy was ‐4.2 to 0.6 | MD 4.99 lower | ‐ | 145 | ⊕⊕⊝⊝ | AES: Limited data on clinically meaningful changes |
| Change in apathy (NPI‐apathy subscale score) | The mean change from baseline in apathy ‐2.6 to ‐1.69 | MD 0.08 lower | ‐ | 85 | ⊕⊕⊝⊝ | 1‐ to 2‐point change suggested to be clinically significant in people with a clinically significant apathy (Rosenberg 2013) |
| Adverse events | Study population | RR 1.28 | 145 | ⊕⊕⊝⊝ | ‐ | |
| 534 per 1000 | 684 per 1000 | |||||
| Change in NPS | The mean change from baseline in NPS was ‐2.08 | MD 0.16 higher | ‐ | 25 | ⊕⊕⊝⊝ | 4‐point change suggested to be clinically significant |
| Change in cognition | The mean change from baseline in cognition was ‐1.08 to ‐0.3 | MD 1.79 higher | ‐ | 145 | ⊕⊕⊕⊝ | MMSE: 2‐ to 4‐point change suggested to be clinically significant |
| Change in functional performance assessed with: ADL scale | The mean change from baseline in functional performance was 0.4 | MD 0.50 higher | ‐ | 60 | ⊕⊕⊕⊝ | Limited data on clinically meaningful changes |
| Change in functional performance assessed with: IADL scale | The mean change from baseline in functional performance was ‐0.6 | MD 2.30 higher | ‐ | 60 | ⊕⊕⊕⊝ | Limited data on clinically meaningful changes |
| Change in global disease severity | Study population | RR 0.56 | 85 | ⊕⊕⊕⊝ | ‐ | |
| 116 per 1000 | 65 per 1000 | |||||
| Dropouts | Study population | RR 2.10 | 145 | ⊕⊕⊝⊝ | ‐ | |
| 41 per 1000 | 86 per 1000 | |||||
| *The risk in the intervention group (and its 95% confidence interval) is based on the assumed risk in the comparison group and the relative effect of the intervention (and its 95% CI). AD: Alzheimer's disease; AEs: Adverse Events; MMSE: Mini‐Mental Status Examination; MD: Mean Difference; NPS: Neuropsychiatric Symptom, SMD: Standardized Mean Difference, CI: Confidence interval; RR: Risk ratio; OR: Odds ratio | ||||||
| GRADE Working Group grades of evidence | ||||||
| 1Quality downgraded one level due imprecision (wide 95% confidence interval). | ||||||
| Modafinil compared to placebo for apathy in Alzheimer's disease | ||||||
| Patient or population: Apathy in people with mild‐to‐moderate Alzheimer's disease | ||||||
| Outcomes | Anticipated absolute effects* (95% CI) | Relative effect | № of participants | Quality of the evidence | Comments | |
| Risk with placebo | Risk with Modafinil | |||||
| Change in apathy | The mean change from baseline in apathy was ‐6.82 | MD 0.27 higher | ‐ | 22 | ⊕⊕⊝⊝ | Limited data on clinically meaningful changes on the FrSBe apathy score |
| Adverse Events ‐ reported, but not analyzed in this review | ‐ | ‐ | ‐ | ‐ | ‐ | ‐ |
| Change in NPS ‐ not investigated | ‐ | ‐ | ‐ | ‐ | ‐ | ‐ |
| Change in cognition ‐ not investigated | ‐ | ‐ | ‐ | ‐ | ‐ | ‐ |
| Change in functional performance | The mean change from baseline in functional performance was 0 | MD 0.54 lower | ‐ | 22 | ⊕⊕⊝⊝ | Limited data on clinically meaningful changes |
| Change in global disease severity ‐ not investigated | ‐ | ‐ | ‐ | ‐ | ‐ | ‐ |
| Dropouts ‐ reported, but not analyzed in this review | ‐ | ‐ | ‐ | ‐ | ‐ | ‐ |
| *The risk in the intervention group (and its 95% confidence interval) is based on the assumed risk in the comparison group and the relative effect of the intervention (and its 95% CI). | ||||||
| GRADE Working Group grades of evidence | ||||||
| 1Quality downgraded two levels due to small sample size and imprecision (wide 95% confidence interval). | ||||||
Antecedentes
Descripción de la afección
La evidencia actual indica que la prevalencia de la enfermedad de Alzheimer (EA), una enfermedad neurodegenerativa debilitante, está aumentando entre la población que está envejeciendo. El World Alzheimer Report calcula que para 2015; 47 000 000 de pacientes en todo el mundo estarían viviendo con demencia debido a la EA, y que estas cifras se duplicarán cada 20 años, a 74 700 000 de pacientes en 2030 y 131 000 000 de pacientes en 2050 (World Alzheimer Report 2015). La patología de la EA a menudo ocurre junto con la patología vascular (EA mixta) (Schneider 2007; Attems 2014). La EA y la EA mixta comparten síntomas cognitivos y conductuales (Kapasi 2016). Con objeto de realizar esta revisión sistemática, por lo tanto, usaremos “EA” al hacer referencia a los individuos diagnosticados con EA y EA mixta.
El daño neuronal y la muerte en el cerebro de un paciente con demencia dan lugar a cambios progresivos en la cognición, la función y el comportamiento, que repercuten de forma negativa en su capacidad de realizar las actividades cotidianas y aumentan la dependencia de otros. El tratamiento de la EA es una prioridad social y de asistencia sanitaria debido a que aumenta el costo de la atención y la carga en los cuidadores. Los gobiernos de los países como el Reino Unido, los EE.UU., Canadá, Noruega, Francia y Corea del Sur han elaborado y puesto en práctica planes nacionales estratégicos para considerar los cambios en los que incurrirá la sociedad a medida que aumenta la prevalencia de la EA (Prince 2013).
El tratamiento de los síntomas asociados con la EA es un aspecto importante de la mejoría de la calidad de vida de los pacientes con EA y sus cuidadores. Uno de dichos síntomas es la apatía que, según los criterios de diagnóstico esbozados por Robert 2009; se define como un trastorno de la motivación que incluye una reducción en el comportamiento orientado a un objetivo, la actividad cognitiva y las emociones orientadas a un objetivo, así como deficiencias funcionales identificables. La apatía se asocia con una mayor carga para los cuidadores, debido a que los individuos diagnosticados con apatía requieren más apoyo para iniciar y completar las actividades incluso cuando todavía pueden ser capaces de llevarlas a cabo ellos mismos. La presencia de apatía aumenta con la mayor gravedad de la enfermedad, y se asocia con un mayor déficit cognitivo y funcional (Tagariello 2009; Kales 2015). Como tal, la apatía ha sido una meta de interés emergente para las intervenciones farmacológicas.
La apatía y la depresión comparten algunas características clínicas, como disminución del interés, retardo psicomotor, fatiga/hipersomnio y falta de apreciación, aunque la depresión se caracteriza por síntomas de disforia, ideación suicida, autocrítica, sentimientos de culpa, pesimismo y desesperanza, que están ausentes en la apatía (Marin 1994). Ha habido variabilidad entre los estudios en los cálculos de la prevalencia de la apatía en los individuos diagnosticados con demencia (Landes 2001). Esta variabilidad puede deberse en parte a la inclusión de los síntomas de apatía en las herramientas de evaluación de la depresión, como el Hamilton Rating Scale of Depression (HAM‐D). Sin embargo, en un estudio que administró el Neuropsychiatric Inventory (NPI), una escala conductual que contiene una subescala de depresión (sin ítems relacionados con la apatía), y una subescala de apatía (sin ítems relacionados con la depresión), no hubo ninguna correlación entre la apatía y la depresión en la demencia (Levy 1998). Varios estudios de neuroimagen apoyan la independencia biológica y fenomenológica de la apatía y la depresión. Estos estudios informan que las relaciones estructurales con los síntomas de apatía son funcionales y anatómicamente diferenciadas de las relaciones estructurales con la depresión (Starkstein 2009; Kang 2012).
Descripción de la intervención
Los tratamientos para la apatía incluyen intervenciones tanto conductuales como farmacológicas, dirigidas a los cambios psicosociales y a los cambios neuroquímicos y neuropatológicos en la EA, respectivamente (Landes 2001; Gitlin 2012).
En comparación con los que no presentan apatía significativa, los cerebros de los individuos apáticos con EA muestran algunas alteraciones patológicas mayores, como una mayor pérdida neuronal (Förstl 1993), ovillos neurofibrilares (Tekin 2001) e hiperintensidades de la sustancia blanca (Starkstein 1997) en los lóbulos frontales y los circuitos asociados entre las estructuras frontales y subtalámicas (Landes 2001). Los sistemas de neurotransmisión colinérgica (Kaufer 1998a), dopaminérgica (DA) (Roccaforte 1990; Debette 2002; Padala 2007), serotoninérgica (Hoehn‐Saric 1990; Marin 1995; Barnhart 2004), ácido gamma‐aminobutírico (GABA)‐érgica (Lanctôt 2007a) y noradrenérgica se han investigado como metas potenciales de la intervención farmacológica, debido a que cada sistema puede asociarse potencialmente con las manifestaciones de la apatía en los pacientes con EA.
Los tratamientos farmacológicos actuales usados en el tratamiento sintomático de la apatía en los individuos con EA incluyen, aunque no están limitados a, lo siguiente:
-
Estimulantes del SNC.
-
Antidepresivos.
-
Antipsicóticos atípicos.
-
Apomorfina.
-
Amantadina.
-
Inhibidores de la colinesterasa.
-
Agonistas DA.
De qué manera podría funcionar la intervención
La evidencia de los estudios farmacológicos, post mortem y de imagenología indican que la apatía en los individuos con EA puede estar relacionada con anomalías en los sistemas de neurotransmisión colinérgica, DA, serotoninérgica, GABA‐érgica y noradrenérgica (Lanctôt 2001; Garcia‐Alloza 2005; Lanctôt 2007a; Lanctôt 2007b).
La hipótesis colinérgica de la EA indica que la degeneración de las neuronas colinérgicas en el preencéfalo basal, y la interrupción asociada a la neurotransmisión colinérgica en la corteza cerebral, contribuyen enormemente al deterioro cognitivo experimentado por los individuos con EA (Bartus 1982). La deficiencia colinérgica también puede limitar la neurotransmisión entre los aferentes del sistema límbico y los aferentes neocorticales y en consecuencia contribuye al desarrollo de apatía en los individuos con demencia causada por la EA. El tratamiento con inhibidores de la acetilcolinesterasa, como el metrifonato (Kaufer 1998b; Raskind 1999; Cummings 2001) y la tacrina (Kaufer 1998a), ha mostrado beneficios para la apatía, y aporta evidencia para involucrar una deficiencia colinérgica en la manifestación de la apatía. Sin embargo, hay estudios múltiples que indican que las deficiencias en otros sistemas de neurotransmisión también están involucradas (Hoehn‐Saric 1990; Herrmann 2004a; Lanari 2006; Lanctôt 2007a; Lanctôt 2007b).
Muchos estudios han identificado cambios en el sistema DA en los individuos con demencia (Allard 1990; Storga 1996; David 2008). En los individuos con EA específicamente, hay una reducción de la neurotransmisión DA entre los ganglios basales, la corteza anterior y la frontal (Lanctôt 2007b). Debido a que estos circuitos neurales comprenden el sistema de recompensa cerebral, el cual se correlaciona altamente con la apatía en los individuos sin deterioro cognitivo, se ha propuesto que la interrupción de la neurotransmisión DA puede contribuir al desarrollo y a la gravedad de la apatía en los individuos con demencia (Bressan 2005; Mitchell 2011).
También se ha estudiado la función del sistema serotoninérgico en los síntomas neurosiquiátricos (SNS). La hipótesis de la serotonina de los SNS postula que la deficiencia de la serotonina aumenta la probabilidad del desarrollo de SNS, en particular la depresión y la agresión (Vartiainen 1995; De Boer 2005; Albert 2013). Por el contrario, debido a que los inhibidores selectivos de la recaptación serotoninérgica (ISRS), comúnmente usados en el tratamiento de la depresión, han estado vinculados al aumento de la apatía en los ensayos clínicos, el aumento de la neurotransmisión serotoninérgica ha sido implicado en la manifestación de la apatía en la demencia (Hoehn‐Saric 1990; Marin 1995; Barnhart 2004). Los ISRS influyen en el sistema DA a través de los mecanismos inhibitorios que involucran los receptores de 5‐HT2C (Walsh 1997) y los mecanismos estimuladores que involucran los receptores de 5‐HT1B y 5‐HT3 (De Deurwaerdère 1998). Se ha formulado la hipótesis de que los tratamientos farmacológicos dirigidos a equilibrar los sistemas de neurotransmisión de serotonina‐dopamina pueden reducir la apatía en los pacientes con demencia (Abe 1975; De Boer 2005; Albert 2013).
Los estudios post mortem y de neuroimagen indican que hay una pérdida de neuronas GABA‐érgicas y noradrenérgicas (NA) en los individuos con demencia (Abe 1975; Rossor 1982; Ellison 1986; Lowe 1988). Se ha formulado la hipótesis de que el GABA y la NA son cotransmisores con la serotonina, las alteraciones patológicas al sistema serotoninérgico son acompañadas por cambios en los sistemas GABA‐érgicos y noradrenérgicos, y que los mismos pueden desempeñar una función en la manifestación de los SNS en la demencia (Rossor 1982). Lanctôt 2007a halló que las concentraciones mayores de GABA en plasma estaban vinculadas con la apatía en la EA. Los cambios noradrenérgicos no han estado vinculados específicamente a este síntoma (Herrmann 2004b).
Por qué es importante realizar esta revisión
Se ha calculado que un 97% de los individuos con demencia experimenta uno o más SNS en el curso del deterioro cognitivo, y la apatía tiene una alta prevalencia, que alcanza un 71% (Steinberg 2008). Debido a que la apatía se ha asociado con una reducción en la calidad de vida y un aumento del deterioro funcional, una carga para los cuidadores, costos de atención y un riesgo de institucionalización, es importante tratar dicho SNS (Boyle 2003; Hurt 2008; Vialta‐Franch 2013)
Las intervenciones conductuales, que por lo general incluyen a los cuidadores, pueden ser una opción de tratamiento segura debido a que no están acompañadas de efectos adversos que pueden asociarse con las intervenciones farmacológicas. Tienen un impacto beneficioso sobre la frecuencia y la gravedad de los SNS en términos generales, y en las reacciones negativas de los cuidadores hacia los SNS (Overshott 2004; Brodaty 2012). Sin embargo, las intervenciones conductuales administradas por los cuidadores no han sido bien investigadas en los individuos apáticos con EA.
Actualmente, hay recomendaciones farmacológicas para el tratamiento de los deterioros cognitivos y funcionales y los SNS en los individuos con EA (Herrmann 2013). Sin embargo, no hay ninguna recomendación farmacológica formal específicamente acerca del tratamiento de la apatía en la EA. Ha habido unos pocos estudios farmacológicos en los cuales el tratamiento de la apatía ha sido el objetivo primario del estudio. También ha habido muchos estudios, que incluían varias clases diferentes de fármacos, en los cuales las medidas de resultado primarias han sido la cognición u otros síntomas no cognitivos, pero que informaron la apatía como una medida de resultado secundaria. Se han realizado afirmaciones en cuanto a la eficacia contra la apatía sobre la base de esta segunda clase de estudio (Berman 2012). Como resultado, se necesita una revisión sistemática, que considere la naturaleza y la calidad de la evidencia, para determinar la seguridad, la tolerabilidad y la eficacia de las opciones farmacológicas actuales para el tratamiento de la apatía y para identificar los fármacos más prometedores a los cuales dirigirse en la investigación futura.
Objetivos
Objetivo 1: Evaluar la seguridad y la eficacia de las farmacoterapias para el tratamiento de la apatía en la enfermedad de Alzheimer (EA).
Objetivo 2: Evaluar el efecto sobre la apatía de las farmacoterapias investigadas para otros resultados primarios en el tratamiento de la EA.
Métodos
Criterios de inclusión de estudios para esta revisión
Tipos de estudios
Se incluyeron todos los ensayos controlados aleatorios (ECA) con placebo, de grupos paralelos y cruzados que investigaban los fármacos para tratar la apatía en la EA o la EA mixta, o ambas. La apatía fue un resultado primario (Objetivo 1) o secundario (Objetivo 2) en los estudios incluidos.
También se incluyeron ECA paralelos y cruzados que comparaban dos o más fármacos para tratar la apatía en pacientes con EA o EA mixta.
Tipos de participantes
Se incluyó a participantes que cumplían con los criterios de diagnóstico estandarizados para la EA o la EA mixta (p.ej. el Diagnostic and Statistical Manual of Mental Disorders [IV, IV Text Revision, 5] [APA 2013], el National Institute of Neurological and Communicative Disorders and Stroke/Alzheimer’s Disease and Related Disorders Association [NINCDS‐ADRDA] [McKhann 1984], el National Institute on Aging/Alzheimer’s Association [NIA/AA] [McKhann 2011] y la International Classification of Diseases and Related Health Problems 10th Revision [ICD‐10] (WHO 1992)).
Se extrajo información sobre las puntuaciones iniciales de la apatía para determinar si las poblaciones de estudio presentaban apatía clínicamente significativa. Sin embargo el anterior no fue un criterio de inclusión para este metanálisis. Aunque algunos autores informaron sobre la apatía clínicamente significativa mediante la Apathy Evaluation Scale (AES), la Frontal Systems Behaviour Scale (FrSBe) Tscore, o la opinión clínica, se consideró que los estudios incluían a participantes con apatía clínicamente significativa cuando la subpuntuación media de apatía en el NPI era mayor que tres al inicio (Mulin 2011).
Tipos de intervenciones
Se incluyó cualquier intervención farmacológica. No se aplicó ninguna restricción a la duración del tratamiento o a la dosificación de la medicación.
Tipos de medida de resultado
Para el Objetivo 1 – evaluación de la eficacia y la seguridad de los fármacos investigados específicamente para el tratamiento de la apatía en la EA – se incluyeron los siguientes resultados en la revisión:
Resultados primarios
-
Apatía medida con una escala que mide específicamente la apatía, ya sea exclusivamente o como uno de sus componentes. Las escalas incluyen, aunque no están limitadas a, la Apathy Evaluation Scale (AES), el componente de apatía de la escala Clinical Global Impressions of Change (CGI‐C apathy), la subescala de apatía del Neuropsychiatric Inventory (NPI), la Lille Apathy Rating Scale (LARS), el componente FrSBe–Apathy, la Nurses’ Observation Scale for Inpatient Evaluation (NOSIE), la Brief Psychiatric Rating Scale (BPRS) y la Sandoz Clinical Assessment‐Geriatric Scale (SCAG).
-
Efectos adversos.
Resultados secundarios
-
Síntomas neurosiquiátricos diferentes de la apatía.
-
Cognición.
-
Rendimiento funcional.
-
Cambios en la gravedad global de la enfermedad (CGI‐C).
-
Abandonos debido a los eventos adversos.
Para el Objetivo 2; cuando se consideraron los estudios que informaban sobre la apatía como una medida de resultado secundaria, se evaluó el efecto sobre la apatía solamente. Este hecho se debió a que es probable que estos estudios formen sólo un subconjunto pequeño y no representativo de estudios que investigan los otros resultados. Se los consideró una fuente útil de información preliminar acerca de los efectos posibles sobre la apatía, aunque una base de datos no apropiada para calcular los efectos sobre la seguridad o los resultados secundarios.
Métodos de búsqueda para la identificación de los estudios
Búsquedas electrónicas
We searched ALOIS (www.medicine.ox.ac.uk/alois), the Cochrane Dementia and Cognitive Improvement Group Specialized Register, on 15 June 2016 and 05 May 2017. We used the following search terms: apathy, apathetic, BPSD.
The Information Specialist maintains ALOIS, which contains dementia and cognitive improvement studies identified from the following sources:
-
Monthly searches of a number of major healthcare databases: MEDLINE, Embase, CINAHL, PsycINFO and LILACS.
-
Monthly searches of a number of trial registers: the metaRegister of Controlled Trials; the Umin Japan Trial Register; the World Health Organization (WHO) International Clinical Trials Registry Platform (ICTRP) (which covers ClinicalTrials.gov, ISRCTN, the Chinese Clinical Trials Register, the German Clinical Trials Register, the Iranian Registry of Clinical Trials, the Netherlands National Trials Register and others).
-
Quarterly searches of the Cochrane Central Register of Controlled Trials (CENTRAL) (the Cochrane Library).
-
Six searches a month of a number of grey literature sources: ISI Web of Knowledge with Conference Proceedings; Index to Theses; and Australasian Digital Theses.
We did not limit the search by language or date of publication. If we found articles in languages other than English, we ensured that these articles were translated and screened for potential inclusion.
We performed separate searches of many of the above‐named sources to ensure that we retrieved the most up‐to‐date results. The search strategy that we used for the retrieval of trial reports from MEDLINE is in Appendix 1.
Búsqueda de otros recursos
We performed electronic searches only.
Obtención y análisis de los datos
Selección de los estudios
Three review authors independently screened the citations identified from the literature search by title and abstract. We identified potentially relevant articles and obtained the full‐text articles for assessment. Three review authors independently assessed these articles according to the previously‐mentioned criteria. We resolved any disagreements by discussion, and involved a third review author if necessary, until we reached consensus. We contacted the study authors for further information when necessary. We identified duplicate citations through author names, institution name or participant data.
For articles which investigated apathy as a primary outcome measure (Objective 1), we contacted the study authors for further information on our primary and secondary outcome measures when necessary. For articles which investigated apathy as a secondary outcome measure (Objective 2), we contacted the study authors for further information about the change in apathy, when necessary.
Extracción y manejo de los datos
Three review authors independently extracted the data using a data extraction form. We obtained missing data from the study authors when possible. One review author entered the data into Review Manager 5 (RevMan) (Review Manager 2014), and the other review authors checked for accuracy. We resolved any discrepancies by consensus.
Evaluación del riesgo de sesgo de los estudios incluidos
Two review authors independently assessed the risks of bias in accordance with the Cochrane 'Risk of bias' assessment tool for assessing quality and risk of bias (Higgins 2011). We compared 'Risk of bias' ratings, and resolved discrepancies through discussion with co‐authors. The tool encourages consideration of how the sequence was generated, how allocation was concealed, the integrity of blinding (participants, raters and personnel), the completeness of outcome data, selective reporting and other potential sources of biases (e.g. carry‐over bias in cross‐over trials, recruitment bias in cluster‐RCTs or bias due to early stopping in specific situations). Where the included study provided inadequate details of randomization and other characteristics of the trials, we contacted the study authors to obtain further information.
We assessed the risk of bias in each domain and categorized it into one of the following.
-
Low risk of bias: plausible bias that is unlikely to seriously alter the results.
-
High risk of bias: plausible bias that seriously weakens confidence in the results.
-
Unclear risk of bias: plausible bias that raises some doubts about the results.
Medidas del efecto del tratamiento
We analyzed the longer ordinal scales in meta‐analyses as continuous data. We converted shorter ordinal scales into dichotomous data by combining adjacent categories into two groups and defining one of the grouped categories as the event.
For continuous data, the measure of treatment effect was the mean difference (MD) with the 95% confidence interval (CI) if the pooled trials used the same rating scale or test, or the standardized mean difference (SMD) with a 95% CI if the trials used different scales to measure the same outcome.
For dichotomous data, the measure of treatment effect was the relative risk (RR) and its 95% CI.
In order to interpret findings, we used the GRADE approach (Guyatt 2008) to assess the overall quality of evidence for all outcomes with pooled data, rating each one as either high, moderate, low or very low quality. The GRADE ratings take into account risk of bias, imprecision, inconsistency, publication bias and indirectness, and express the degree of confidence one can have that the effect estimate is close to the true effect.
Cuestiones relativas a la unidad de análisis
Carry‐over effects are a concern associated with cross‐over trials. If a study reported significant carry‐over effects, we used only data from the first phase of a cross‐over study. If a study reported no carry‐over effects, then we included data (paired data if possible) from both treatment phases.
Manejo de los datos faltantes
In the event of missing information, we requested unreported data from the author(s) of the original study. We preferred intention‐to‐treat (ITT) data when available. In the case of missing data for non‐completers, we recorded any imputation methods used by the study authors and considered the use of sensitivity analyses to assess the impact on the results of different methods of dealing with missing data.
Evaluación de la heterogeneidad
Clinical heterogeneity
We considered separately studies that were related by drug group. Within each group of studies, we noted the obvious sources of heterogeneity and considered these in the analyses.
Statistical heterogeneity
Visual inspection
We inspected graphs to assess the possibility of statistical heterogeneity.
Use of the I2 statistic
We used the I2 statistic to identify heterogeneity across the included studies. If the I2 statistic value was greater than 40%, we took this value to represent significant heterogeneity.
Evaluación de los sesgos de notificación
We performed a comprehensive search and included trial registries to minimize the risk of reporting bias, which may arise when publication is influenced by the nature and direction of results (Egger 1997).
Síntesis de los datos
We used a fixed‐effect model for analyses with sufficient homogeneity. If there was significant heterogeneity, we used a random‐effects model. If possible, we conducted analyses in accordance with the principles of ITT.
Análisis de subgrupos e investigación de la heterogeneidad
Data permitting, we conducted subgroup analyses for each drug group to examine the effect of the following:
-
Treatment duration.
-
Disease severity and diagnostic group (i.e. AD or mixed dementia).
If there were high levels of heterogeneity, we explored the plausible causes of heterogeneity. If we identified statistical heterogeneity, we used the strategies recommended by the Cochrane Handbook for Systematic Reviews of Inteventions, Section 9.5.3 and completed a random‐effects meta‐analysis to incorporate heterogeneity among studies (Deeks 2011).
Análisis de sensibilidad
In order to address the robustness of our results to potential risks of bias, we repeated the previous analyses, excluding studies at high risk of bias. We identified issues suitable for sensitivity analysis during the review process.
Data presentation: 'Summary of findings' tables
We used the GRADE approach to assess the quality of evidence behind each estimate of treatment effect (Schünemann 2011). For each comparison, we presented key findings, including a summary of the amount of data and the magnitude of the effect size. For comparisons in Objective 1, we presented the overall quality of the evidence in a 'Summary of findings' table, created using GRADEpro software (www.gradepro.org). We preselected the following outcomes.
-
Apathy.
-
Adverse effects.
-
Overall behavioral symptoms.
-
Cognition.
-
Function.
-
Clinical global impression.
-
Dropouts due to AEs.
As described above, apathy was the only outcome measure evaluated for those studies assessing apathy as a secondary outcome measure (Objective 2). We did not produce ‘Summary of findings’ tables for Objective 2 comparisons. However, we described the quality of evidence, using the GRADE approach, along with the results.
Results
Description of studies
Results of the search
Our search of the database and other electronic sources yielded 5295 references and 675 references, respectively. After de‐duplication and first‐assess removal of non‐relevant references by Anna Noel‐Storr (Information Specialist of the CDCIG), MR and EHA, or MR and SC independently assessed the remaining 1566 references for relevance. Of these, we ruled out 1504 references as they either did not investigate apathy as a primary or secondary outcome measure, did not investigate the efficacy of a pharmacological agent, did not conduct a double‐blind, randomized, placebo‐controlled trial, and/or did not include people with AD. This left 62 full‐text articles for assessment by MR, EHA and SC independently. These articles reported on apathy as a primary outcome measure, or used a scale such as the NPI to evaluate apathy as a secondary outcome measure. We contacted authors when data were not sufficiently reported for extraction for this review. We received further information from Ruths 2008 and Tariot 2011.
Forty‐one studies which investigated apathy as a secondary outcome measure did not publish or provide upon request sufficient data on apathy; we therefore excluded them from this review. Of the 21 studies included in this meta‐analysis, four investigated apathy as a primary outcome (Objective 1), and 17 studies investigated apathy as a secondary outcome (Objective 2).
See Figure 1 for the study flow diagram.
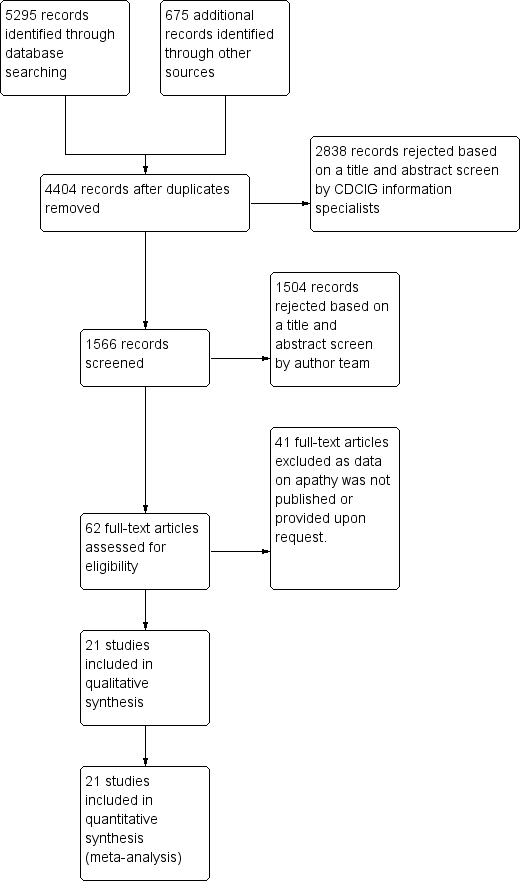
2Study flow diagram.
Included studies
The characteristics of the 21 included studies in this review are summarized in the Characteristics of included studies table.
Twenty‐one studies met our inclusion criteria for this meta‐analysis. We provide further information on study and participant characteristics in Table 1. All of the trials included in this meta‐analysis were randomized, double‐blind and placebo‐controlled. All but three studies (Sival 2002; Frakey 2012; Padala 2017) were multicenter trials. All studies included people with possible or probable AD according to standardized criteria (NINCDS‐ADRDA, DSM‐IV‐TR, or ICD‐10).
| STUDY DURATION | N OF PARTICIPANTS | Diagnosis | MEAN AGE (YRS) | MEAN MMSE (SD) | MEAN BL NPI‐APATHY (SD) score | COUNTRY | NUMBER OF SITES | TREATMENT GROUPS | |
| METHYLPHENIDATE | |||||||||
| 2 weeks Cross‐over design: 2 treatment phases of 2 weeks with a 1‐week washout between phases | 13 total | Possible or probable AD (NINCDS‐ADRDA), and apathy (NPI‐apathy subscale ≥ 1) | 77.9 (7.8) | 19.9 (4.7) | 5.9 (3) | Canada | 3 | Group 1: Methylphenidate (10 mg twice a day) | |
| 6 weeks | 60 participants | Possible or probable AD (NINCDS‐ADRDA), and clinically significant apathy for at least 4 weeks | 76 (8) | 20 (5) | Group 1: 7 (2) | USA, Canada | 3 | Group 1: Methylphenidate (target: 20 mg daily) | |
| 12 weeks | 60 participants | Dementia of the AD type (DSM‐IV‐TR), and presence of apathy (AES > 40) | 76.6 (7.9) | 23.8 (2.5) | Not reported | USA | 1 | Group 1: Methylphenidate (target: 20 mg daily) | |
| MODAFINIL | |||||||||
| 8 weeks | Group 1: 11 | Possible or probable AD (NINCDS‐ADRDA criteria) and clinically significant apathy (FrSBe Tscore ≥ 65) | Group 1: 75.3 (8.3) | Not disclosed | Not reported | USA | 1 | Group 1: Modafinil (200 mg daily) | |
| CHOLINESTERASE INHIBITORS | |||||||||
| 24 weeks | Group 1: 103 Group 2: 105 | Possible or probable AD with cerebrovascular disease (but not vascular dementia) (NINCDS‐ADRDA criteria) | Group 1: 85.4 | Group 1: 14.4 (5.4) | Not reported | USA | 27 | Group 1: Donepezil ‐ 5 mg/day for 28 days. 10 mg/day after 28 days based on tolerability. | |
| 24 weeks | Group 1: 144 | AD (DSM‐IV and NINCDS‐ADRDA criteria) | 73.6 | Group 1: 11.7 (0.35) | Group 1: | Canada, Australia, France | 32 | Group 1: Donepezil ‐ 5 mg/day for 28 days. 10 mg/day after 28 days based on tolerability. | |
| Range: 3 ‐ 6 months (12 ‐ 24 weeks) | Group 1: 1347 | Probable AD (NINCDS‐ADRDA criteria) | 76 | 18 | Group 1: | USA, Canada, Great Britain, South Africa, Australia, and New Zealand | Multicenter, but number not disclosed | Group 1: Galantamine | |
| 26 weeks | Group 1: 273 | Probable AD (NINCDS‐ADRDA criteria) | Not reported | Not reported | Not reported | USA | 25 | Group 1: Metrifonate (2 weeks – 2.0 mg/kg, followed by 0.65 mg/kg) | |
| 26 weeks | Group 1: 273 | Probable AD (NINCDS‐ADRDA criteria) | Group 1: 73.5 (8.1) | Group 1: 18.8 (5) | Not reported | USA | 24 | Group 1: Metrifonate (2 weeks – 2.0 mg/kg, followed by 0.65 mg/kg) | |
| 26 weeks | Group 1: 177 | Probable AD (NINCDS‐ADRDA criteria) mild‐moderate AD | Group 1: 74.6 (8.3) | Group 1: 18.7 (4.76) | Not reported | USA (additional sites are not disclosed) | Multicenter, but number not disclosed | Group 1: | |
| CHOLINESTERASE DISCONTINUATION | |||||||||
| 8 weeks | Group 1: 21 | Probable AD (NINCDS‐ADRDA criteria) | 89.3 | Group 1: 8.1(5.2) | Group 1: | Canada | 2 | Group 1: Donepezil, | |
| ATYPICAL ANTIPSYCHOTICS | |||||||||
| 10 weeks | Group 1: 132 | Possible or probable AD (NINCDS‐ADRDA criteria and DSM‐IV‐TR), and clinically significant psychotic symptoms | 76.6 (10.4) | 13.7 (5.1) | Group 1: 3.2 (3.9) | Europe, Australia, Israel, Lebanon, and South Africa | 61 | Group 1: 7.5 mg OLZ | |
| Up to 36 weeks (12 weeks of treatment) data available | Group 1: 100 | Dementia of the AD type (DSM‐IV) or probable AD (NINCDS‐ADRDA) and daily delusions, hallucinations, agitation, or aggression over 4 weeks prior to study entry | 77.9 (7.5) | Group 1: 15 (5.4) | Not reported | USA | 42 | Group 1: OLZ | |
| ANTIPSYCHOTIC DISCONTUATION | |||||||||
| 4 weeks | Group 1: 28 | Dementia diagnosis according to ICD‐10 | 83.4 (6.9) | Not provided | Group 1: | Norway | 9 | Group 1: Antipsychotics (haloperidol, risperidone, or olanzapine) | |
| ANTIDEPRESSANTS | |||||||||
| 4 weeks: Cross‐over design: 2 treatment phases of 4 weeks with a 1‐week washout between phases | 22 total | Primary degenerative dementia (DSM‐IV) and probable AD (NINCDS‐ADRDA), and significant behavioral problems (NPI ≥ 8) | 82 (6) | 4.1 (4.7) | Group 1: | Canada | 3 | Group 1: Sertraline (100 mg daily) | |
| 9 weeks | Group 1: 94 | Probable AD (NINCDS‐ADRDA), and significant behavioral problems (NPI ≥ 8), and clinically significant agitation on the NPI > 3 | Group 1: 78 (9) | Group 1: 17 (6.2) | Group 1: | USA | 6 | Group 1: Citalopram (30 mg daily) | |
| MIBAMPATOR | |||||||||
| 12 weeks | Group 1: 63 | Probable AD (NINCDS‐ADRDA) (DSM‐IV‐TR), and clinically significant agitation/aggression | Group 1: 77.2 (8.2) | Group 1: 16.0 (6.1) Group 2: 18 (5.3) | Not reported | USA | Multicenter, but number not disclosed | Group 1: Mibampator (target dose: 3 mg daily) | |
| VALPROATE | |||||||||
| 6 weeks: Cross‐over design: 2 treatment phases of 6 weeks with a 2‐week washout between phases | Group 1: 14 | Probable AD (NINCDS‐ADRDA), primary degenerative dementia (DSM‐IV) | 85.6 (4.5) | 4.5 (4.6) | Group 1: 2.4 (3.8) | Canada | 2 | Group 1: Valproate (mean dose: 1134.6 (400.1) mg daily) | |
| 3 weeks: Cross‐over design: 2 treatment phases of 3 weeks with a 1‐week washout between phases | Group 1: 42 | Senile dementia (NINCDS‐ADRDA)(DSM‐IV) | 80.4 (6.8) | 11.4 (5) | Not reported | Netherlands | 1 | Group 1: Valproate (2 x 240 mg) | |
| 24 months (+ 2‐month single‐blind placebo phase) | Group 1: 153 | Possible or probable AD (NINCDS‐ADRDA) | Group 1: 74.9 | Group 1: 16.9 (3.0) | Group 1: | USA | 46 | Group 1: Valproate (flexible‐dose) (mean modal dose: 250 mg daily) | |
| SEMAGACESTAT | |||||||||
| 76 weeks | Group 1: 463 | Mild‐moderate AD (NINCDS‐ADRDA) | Group 1: 72.7 (7.9) | Group 1: 20.9 (3.5) | Not reported | USA | 91 | Group 1: LY100 | |
AD: Alzheimer's disease, BL: baseline, DSM: Diagnostic and Statistical Manual of Mental Disoders, FrSBe: Frontal Systems Behavior Scale, ICD: International Classification of Diseases, LY: LY450319 (Eli Lillyand Company study drug), NINCDS‐ADRDA: National Institute of Neurological and Communicative disorders and the Alzheimer's Disease and Related Disorders Association, NPI: Neuropsychiatric Inventory, OLZ: olanzapine, QUE: quetiapine, RIS: risperidone, SD: standard deviation.
Objective 1:
Four studies investigated the effect of a pharmacological treatment on apathy as a primary outcome measure. The drugs studied were methylphenidate and modafinil, both compared to placebo. We treat modafinil and methylphenidate separately in this review and meta‐analysis. Although both are CNS stimulants, their mechanisms of action differ. Modafinil activates glutamatergic circuits while inhibiting GABA neurotransmission (Gerrard 2007). Among other actions, methylphenidate blocks dopamine uptake in central adrenergic neurons by blocking dopaminergic transporter and carrier proteins (Volkow 2002).
Methylphenidate
Three placebo‐controlled studies have investigated the efficacy of methylphenidate for the treatment of apathy in people with AD (Herrmann 2008; Rosenberg 2013; Padala 2017). These studies had similar eligibility criteria, with participants having mild‐to‐moderate AD and clinically significant apathy at baseline. In all three studies, the daily target dose of methylphenidate was 20 mg.
Herrmann 2008 conducted a cross‐over study with two two‐week treatment phases and a one‐week placebo washout between treatment phases. The authors reported no treatment order or carry‐over effects. We extracted paired data from this study. We did not consider the cross‐over design to be a source of bias.
Rosenberg 2013 and Padala 2017 both used a parallel‐group design and investigated the efficacy and safety of methylphenidate in the treatment of apathy over six and 12 weeks respectively.
Modafinil
Frakey 2012 also investigated the effect of modafinil on apathy in people with mild‐to‐moderate AD and clinically significant apathy at baseline (FrSBe apathy Tscore ≥ 65). As Frakey 2012 provided the baseline and final standard deviation (SD) values, we imputed the change SD using methodology provided in the Cochrane Handbook (Section 16.1.3.2).
Objective 2:
Seventeen studies reported the effect of a pharmacotherapy on apathy as a secondary outcome measure. The drugs studied were cholinesterase inhibitors (ChEIs), atypical antipsychotics, antidepressants, mibampator, valproate and semagacestat, versus placebo. Two placebo‐controlled discontinuation studies with ChEIs and antipsychotics also investigated apathy as a secondary outcome measure. Clinically significant apathy was not an inclusion criterion in any of the studies.
Cholinesterase inhibitors
Six studies investigating ChEIs met the inclusion criteria for this review. Two studies (Tariot 2001; MSAD trial) included participants with moderate‐to‐severe AD. Herrmann 2005; Kaufer 1998; Morris 1998; and Raskind 1999 included participants with mild‐to‐moderate AD. Although none of the studies actively recruited participants with clinically significant apathy (considered as an NPI apathy subscore ≥ 3), baseline apathy in the MSAD trial was clinically significant in both treatment groups. In the remaining studies, neither treatment group had clinically significant apathy at baseline.
Tariot 2001, the MSAD trial and Herrmann 2005 included currently approved ChEIs for the treatment of AD (donepezil, galantamine and rivastigmine).
Tariot 2001 and the MSAD trial investigated the efficacy and safety of donepezil (target dose: 5 ‐ 10 mg/daily) over 24 weeks. Both papers reported change scores as least square mean (LSM) change. We considered this to be a potential source of selective reporting bias, as covariates were included in a linear regression which computed adjusted mean change values. We computed the SD values from the provided standard error (SE) values for LSM change using methods provided in the Cochrane Handbook (Section 7.7.3.2).
Herrmann 2005 reported the effect of galantamine on neuropsychiatric symptoms (NPS) in a post hoc analysis of pooled data from three large trials (Tariot 2000; Rockwood 2001; data file from Janssen‐Ortho) which had study durations of three, five and six months, respectively. We included data from this post hoc analysis because each trial met inclusion criteria for this meta‐analysis, and because we were unable to obtain sufficient data from the primary papers. Herrmann 2005 conducted an ITT analysis on the pooled data obtained from the last observation on each participant.
Kaufer 1998, Morris 1998, and Raskind 1999 all investigated the efficacy and safety of metrifonate in AD. Metrifonate is an irreversible organophosphate acetylcholinesterase inhibitor which was not approved for the symptomatic management of AD. All three papers reported LSM change scores which used covariates to create an adjusted mean change score. Again, we considered this to be a potential source of selective reporting bias. We were able to compute SD change values from Raskind 1999 using reported SE change values. However, as neither Kaufer 1998 nor Morris 1998 reported SE or SD change values, we used SD values computed from Raskind 1999 for both these studies, as all studies had participants with similar AD severity, and the same study duration and dosing regimen.
ChEI discontinuation
Herrmann 2016 investigated the efficacy and safety of ChEI discontinuation in people with moderate to severe AD. Continuing treatment with a ChEI was compared to ChEI discontinuation (placebo substitution), and so we included the results of this study in the meta‐analysis. However, this evidence is indirect in terms of our review questions, as all participants were receiving long‐term ChEI treatment (more than a year) prior to study enrollment, and it is unclear how this may influence our findings. Although Herrmann 2016 did not actively recruit participants with clinically significant apathy, those who were randomized to continue ChEI use had clinically significant apathy (NPI‐apathy subscale score ≥ 3) compared to placebo. However, the difference between groups was not statistically significant.
Atypical antipsychotics
We identified 16 RCTs that evaluate the efficacy of atypical antipsychotics for aggression and psychosis in people with AD (Ballard 2006). However, only two of these studies met our inclusion criteria and reported sufficient data on apathy, or provided data upon request, for this meta‐analysis (De Deyn 2004; Sultzer 2008).
De Deyn 2004 investigated the efficacy of olanzapine versus placebo in treating NPS over 10 weeks. As participants in this study were randomized into one of five groups (1, 2.5, 5 or 7.5 mg of olanzapine, or placebo), we have combined results from those randomized to olanzapine to prevent a unit‐of‐analysis error due to multiple comparisons (Cochrane Handbook section 16.5.4). The method used for combining groups was provided in the Cochrane Handbook (Section 7.7.3.8). As well as meeting standardized criteria for AD, all participants also had clinically significant psychotic symptoms.
Sultzer 2008 investigated the efficacy of atypical antipsychotics (olanzapine, quetiapine and risperidone) versus placebo in treating NPS for up to 36 weeks (phase 1 of the study). In phase 2 of the study, participants could be randomized to a different medication at the clinician’s discretion. Mean change scores were reported over the first 12 weeks of phase 1 of the study, and so we used these results in the meta‐analysis. Participants were randomized to one of four groups (olanzapine, quetiapine, risperidone or placebo). In order to prevent a unit‐of‐analysis error due to multiple comparisons, we combined results from participants receiving all three atypical antipsychotics. In addition to meeting standardized criteria for AD, all participants also had clinically significant psychotic symptoms or agitation/aggression over the four weeks prior to study entry.
Neither study actively recruited people with clinically significant apathy. However, in De Deyn 2004 each treatment group had clinically significant apathy at baseline. As Sultzer 2008 did not provide baseline scores on apathy, we were unable to determine whether participants enrolled in this study had clinically significant apathy.
Antipsychotic discontinuation
We identified nine clinical trials which investigated the efficacy and safety of antipsychotic discontinuation in people with AD, but we were able to include only one study which met our inclusion criteria and provided data on apathy upon request (Ruths 2008).
Ruths 2008 investigated the efficacy of antipsychotic discontinuation in people with AD who had been receiving haloperidol, risperidone or olanzapine (range: 3 to 62 months). Neither treatment group had clinically significant apathy at baseline.
Antidepressants
We identified 12 trials comparing antidepressants with placebo in people with AD. However, only two studies met our inclusion criteria and yielded extractable data (CitAD trial) or provided data upon request (Lanctôt 2002).
Lanctôt 2002 investigated the effect of sertraline on NPS in people with severe AD and clinically significant NPS (NPI ≥ 8). This cross‐over study consisted of two four‐week treatment phases separated by a one‐week placebo washout. Neither treatment group had clinically significant apathy at baseline. As the authors reported that treatment order did not have an effect on treatment response, we did not consider the cross‐over design to be a source of bias. Lanctôt 2002 published results in treatment responders only, but data on all participants were provided upon request.
CitAD trial investigated the effect of citalopram on agitation in people with AD and clinically significant agitation over nine weeks. As CitAD trial provided median and interquartile range (IQR) values for NPI‐apathy subscores and NPI‐total scores, we used methods described in the Cochrane Handbook (Section 7.7.3.5) to validate use of the median to estimate mean values, and to convert IQR to SD values. For mini‐mental state examination (MMSE) and Alzheimer's Disease Cooperative Study Activities of Daily Living (ADCS‐ADL) scores, SD values were provided at baseline, while SE values were provided at study endpoint. We calculated the SD from SE values using methods provided in the Cochrane Handbook (Section 7.7.3.2), and derived change SD values also using methods provided in the Cochrane Handbook (Section 16.1.3.2).
The presence of clinically significant apathy was not an inclusion criterion for either study. However, participants in CitAD trial had clinically significant apathy (NPI‐apathy subscore ≥ 3) at baseline.
Mibampator
Trzepacz 2013 investigated the efficacy of mibampator (LY451396) on agitation/aggression in people with AD over 12 weeks. Trzepacz 2013 reported the LSM change score and SD for overall behavior using the FrSBe total Tscore. Apathy was assessed using the FrSBe apathy T‐subscore. We extrapolated the LSM change score for apathy from a graph. However, as SD change scores for apathy were not provided in the paper, we inferred these values from the FrSBe total change Tscore results. As LSM change scores use covariates to create an adjusted mean change score, we considered this as a potential source of selective reporting bias. Since Trzepacz 2013 did not provide baseline apathy scores, we were unable to determine whether study participants had clinically significant apathy.
Valproate
We identified three studies investigating valproate which met the inclusion criteria for this meta‐analysis (Sival 2002; Herrmann 2007; Tariot 2011). These studies had similar eligibility criteria, with participants having moderate AD and clinically significant agitation/aggression. Tariot 2011 also included participants with clinically significant psychosis. In all three studies, the primary outcome measure was the efficacy of valproate on agitation/aggression (and/or psychosis in Tariot 2011).
Herrmann 2007 was a cross‐over study with two six‐week treatment phases separated by a two‐week placebo washout period. Data from this study were provided upon request. Though Herrmann 2007 did not actively recruit people with clinically significant apathy, those randomized to receive placebo had clinically significant apathy (NPI‐apathy subscale score ≥ 3) compared to those receiving valproate. However, the difference between groups was not statistically significant.
Sival 2002 was also a cross‐over study with two three‐week treatment phases separated by a one‐week placebo washout period. We were unable to confirm whether participants enrolled in this study had clinically significant apathy at baseline.
Although treatment order and carry‐over effects were investigated by Sival 2002 and Herrmann 2007, both papers reported the absence of these effects. As such, we did not consider the cross‐over design to be a source of bias. We extracted paired data from both studies.
Tariot 2011 investigated the efficacy of valproate as a prophylactic treatment for emerging agitation or psychosis in people with moderate AD over 24 months, followed by a two‐month period of single‐blind placebo treatment. Neither treatment group had clinically significant apathy. Data from this study were provided by the Alzheimer's Disease Cooperative Study (ADCS) group upon request.
Semagecestat
Rosenberg 2016 investigated the efficacy of semagecestat for the treatment of AD over 76 weeks. Participants in this study were randomized to one of three groups (100 or 140 mg of semagacestat, or placebo). We combined results from those randomized to both semagacestat groups using the method provided in the Cochrane Handbook (Section 7.7.3.8) in order to prevent a unit‐of‐analysis error due to multiple comparisons (Cochrane Handbook Section 16.5.4). We used methods described in the Cochrane Handbook (Section 7.7.3.2) to calculate SD values for the MMSE and ADCS‐ADL scores from the 95% confidence intervals reported by the authors.
We were unable to confirm whether participants enrolled in this study had clinically significant apathy, as neither Doody 2013 nor Rosenberg 2016, who published the original findings of the study, provided baseline apathy scores.
Interventions
We present relevant details about treatment groups and doses of medication used in each study in Table 1.
Outcomes
All trials included in this meta‐analysis examined apathy as a primary or secondary outcome measure. We summarize the details of outcomes measured and reported in each trial in Table 2. A number of scales were used to measure each outcome.
| Study | Apathy | AE reported | NPS | Cognition | Function | Global Change | Dropouts due to AEs reported |
| METHYLPHENIDATE | |||||||
| AES‐Informant | Yes | NPI‐total | MMSE | N/A | CGI‐C | Yes | |
| AES‐Informant | Yes | NPI‐total (not reported) | MMSE | N/A | ADCS‐CGIC | Yes | |
| AES‐Clinician | Yes | N/A | MMSE | ADL | N/A | Yes | |
| MODAFINIL | |||||||
| FrSBe‐apathy subscale | Yes | N/A | N/A | ADLQ | N/A | Yes | |
| CHOLINESTERASE INHIBITORS | |||||||
| NPI‐apathy subscale | These outcomes were not investigated for this drug comparison | ||||||
| NPI‐apathy subscale | |||||||
| NPI‐apathy subscale | |||||||
| NPI‐apathy subscale | |||||||
| NPI‐apathy subscale | |||||||
| NPI‐apathy subscale | |||||||
| CHOLINESTERASE DISCONTINUATION | |||||||
| NPI‐apathy subscale | These outcomes were not investigated for this drug comparison. | ||||||
| ATYPICAL ANTIPSYCHOTICS | |||||||
| NPI‐apathy subscale | These outcomes were not investigated for this drug comparison | ||||||
| BPRS‐withdrawn depression factor score | |||||||
| ANTIPSYCHOTIC DISCONTINUATION | |||||||
| NPI‐apathy subscale | These outcomes were not investigated for this drug comparison | ||||||
| ANTIDEPRESSANTS | |||||||
| NPI‐apathy subscale | These outcomes were not investigated for this drug comparison | ||||||
| NPI‐apathy subscale | |||||||
| MIBAMPATOR | |||||||
| FrSBe‐apathy T score | These outcomes were not investigated for this drug comparison | ||||||
| VALPROATE | |||||||
| NPI‐apathy subscale | These outcomes were not investigated for this drug comparison | ||||||
| GIP‐apathetic behavior subscore | These outcomes were not investigated for this drug comparison | ||||||
| NPI‐apathy subscale | These outcomes were not investigated for this drug comparison | ||||||
| SEMAGACESTAT | |||||||
| NPI‐apathy | These outcomes were not investigated for this drug comparison | ||||||
ADCS‐CGIC: Alzheimer's Diserase Cooperative Study ‐ Clinical Global Impression of Change, ADL: Activities of Daily Living scale, ADLQ: Lawton and Brody Fucntional Assessment, AES: Apathy Evaluation Scale, CGI‐C: Clinical Global Impression of Change, FrSBe: Frontal Systems Behavior Scale, GIP: The Behavior Observation Scale for Intramural Psychogeriatric Patients, IADL: Instrumental Activities of Daily Living Scale, MMSE: Mini‐Mental State Examination, NPI: Neuropsychiatric Inventory.
Primary efficacy and safety outcomes:
1) Apathy
NPI‐apathy subscale: Apathy is a subscale item on the NPI scale. The apathy score is calculated as the product of frequency and severity of apathy symptoms, with a range of 0 to 12. Higher scores indicate more frequent and/or severe symptoms (Cummings 1994).
AES‐Informant (AES‐I) and AES‐Clinician (AES‐C): This is an 18‐item informant (AES‐I) or clinician (AES‐C)‐rated scale which measures apathy severity as defined by simultaneous deficits in the overt behavioral, cognitive and emotional constructs of goal‐directed behavior. The higher the score, the greater the apathy severity (Marin 1991).
BPRS Withdrawn depression factor score: The Withdrawn Depression component of the BPRS consists of emotional withdrawal, depressed mood, motor retardation, and blunted affect (Overall 1962). This component of the BPRS has been shown to be fairly associated with scores on the NPI‐apathy subscale (Politis 2004).
FrSBE apathy: Apathy is a subscale item on the FrSBE, which measures three frontal systems behavioral syndromes: apathy, disinhibition, and executive dysfunction. The higher the score, the greater the severity of apathy (Grace 2011).
Behavior Rating Scale for Psychogeratric Inpatients (GIP): Apathy is one of four components of the 82‐item GIP scale. Higher scores indicate greater severity of apathy (Diesfeldt 2013).
2) Adverse events
As a number of drug classes were included in this meta‐analysis, we chose to use the number of participants who experienced one or more adverse events (AEs) as an indication of safety. This outcome was reported by all studies which reported safety outcomes.
Secondary outcomes:
3) NPS
NPI: The NPI is a widely‐used assessment of 12 behavioral symptoms in dementia, including: delusions, hallucinations, agitation/aggression, apathy, depression, euphoria, aberrant motor behavior, irritability, disinhibition, anxiety, sleeping and eating. The frequency and severity of these symptoms are judged on a four‐point and three‐point scale, respectively (Cummings 1994).
4) Cognition
MMSE: This scale measures global cognition, and assesses orientation to time and place, immediate recall, short‐term verbal memory, calculation, language, and construct ability. The MMSE is scored out of 30, with lower scores indicating greater cognitive impairment (Folstein 1975).
5) Function
IADL scale/ADL‐Q: Although termed differently by Frakey 2012 and Padala 2017, the scale used was the same between both studies. This questionnaire measures functional abilities in elderly people necessary for independent living. Scores range from 0 to 28, with lower scores indicating greater functional impairment (Lawton 1969).
ADL scale: This questionnaire assesses independence in performing basic tasks such as bathing, dressing, and feeding. Scores range from 0 to 24, with lower scores indicating greater functional impairment (Katz 1963).
6) Global change
CGIC and ADCS‐CGIC: This scale quantifies disease severity and clinical change (worsening, no change, or improvement), based on information about the person’s medical history, cognition, behavior, and function (Schneider 1997).
7) Dropouts due to AEs
In clinical trials with AD participants, attrition is a common problem attributed to loss to follow‐up, lack of efficacy, violation of study protocol, and the presence of AEs. As we are concerned with tolerability, we report on the number of dropouts due to an AE.
Excluded studies
Double‐blind, placebo‐controlled RCTs which we exclude from this meta‐analysis are presented in the Characteristics of excluded studies. We did not exclude any RCTs which investigated and reported on the efficacy of a pharmacological intervention on apathy as a primary or secondary outcome measure in people with mild, moderate, or severe AD.
Risk of bias in included studies
All studies included in this meta‐analysis were described as double‐blind, randomized, placebo‐controlled trials. We present details concerning the risks of bias of individual studies in the Characteristics of included studies tables; Figure 2; and Figure 3.
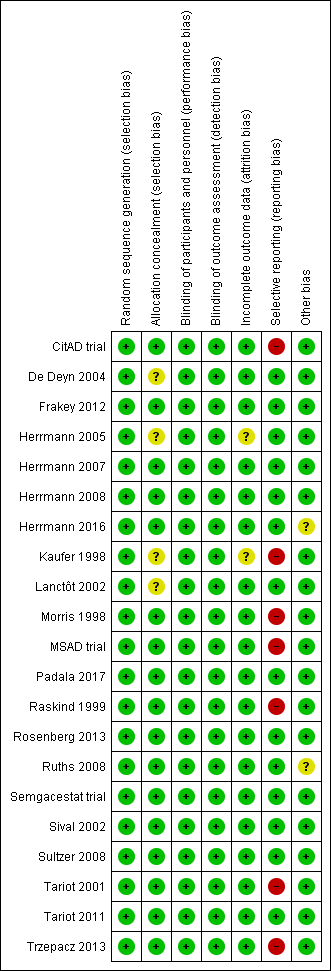
Risk of bias summary: review authors' judgements about each risk of bias item for each included study.
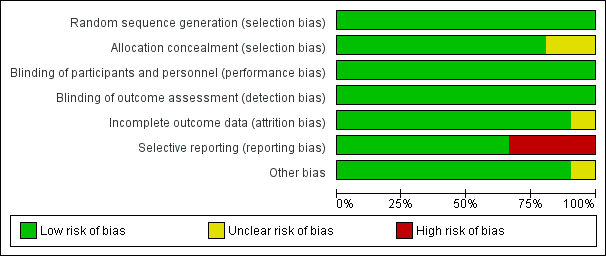
Figure 3 CaptionRisk of bias graph: review authors' judgements about each risk of bias item presented as percentages across all included studies.
Allocation
Most trials provided an adequate description of treatment allocation, but for some trials we were unable to obtain or locate this information. In these cases, we indicated unclear bias. These trials included the following: Kaufer 1998; Lanctôt 2002; De Deyn 2004; Herrmann 2005; Padala 2017.
Incomplete outcome data
All trials except Kaufer 1998 and Herrmann 2005 adequately described attrition rates in text, or included a figure detailing participant flow, or both. As mentioned previously, Herrmann 2005 investigated the efficacy of galantamine in a pooled post hoc analysis of three placebo‐controlled RCTs. Two of the studies included participant flow diagrams, and described study discontinuations in detail (Tariot 2000; Rockwood 2001). In Rockwood 2001, discontinuations due to AEs were more common in participants who were randomized to galantamine than placebo. However, the authors used ITT analyses, and last observation carried forward (LOCF) analysis as appropriate. Tariot 2000 reported that discontinuations due to AEs were similar between participants randomized to galantamine compared to placebo. We considered that these two studies had a low risk of attrition bias. However, as Herrmann 2005 was not able to confirm whether this also applied to data obtained from Janssen‐Ortho, this was a potential source of bias.
In Kaufer 1998, authors mention that reported data included LOCF analysis in an ITT population. However, as no further details on attrition were provided, we included this as a potential source of bias.
Selective reporting
As mentioned previously in the Description of studies, we had concerns with selective reporting, specifically in studies comparing ChEI, citalopram and semagacestat versus placebo. In Kaufer 1998, Morris 1998, Raskind 1999, and the MSAD trial, change scores were reported as LSM values. As LSM values use covariates to generate an adjusted mean change score, this is a possible source of selective reporting bias.
Raskind 1999 and the MSAD trial both reported SE values of LSM change scores. We were able to compute SD values from the SE values provided. However, as Kaufer 1998 and Morris 1998 did not report SE or SD values, we used the SD values we had computed from Raskind 1999, as there were similarities across all three studies in AD severity of participants, study duration, and dosing regimen. Again, we considered this to be a possible source of selective reporting bias.
CitAD trial reported median values for continuous outcome measures. This is a source of selective reporting bias, as CitAD trial also reported that the data for these measures were not normally distributed, and may not be an accurate representation of the raw mean values.
Rosenberg 2016 reported on our primary efficacy outcome of apathy, and NPS.
Effects of interventions
See: Summary of findings for the main comparison Methylphenidate compared to placebo for apathy in Alzheimer's disease; Summary of findings 2 Modafinil compared to placebo for apathy in Alzheimer's disease
Objective 1:
Comparison of methylphenidate with placebo
See: summary of findings Table for the main comparison.
Primary efficacy and safety outcomes:
1. Apathy
Three included studies investigated and reported on the efficacy of methylphenidate for the treatment of apathy as a primary outcome measure (Herrmann 2008; Rosenberg 2013; Padala 2017). All studies used the AES to assess apathy. Herrmann 2008 and Rosenberg 2013 also used the NPI‐apathy subscale. We conducted separate analyses using results from the AES scale, and results from the NPI‐apathy subscale.
Apathy assessed by the AES:
Based on findings obtained from the AES, we found that methylphenidate may improve apathy compared to placebo (mean difference (MD) ‐4.99, 95% confidence interval (CI) ‐9.55 to ‐0.43, P = 0.03, n = 145, 3 studies, I2 = 83%). However, there was uncertainty associated with this result, which we considered to be of low quality, because of serious concerns with inconsistency due to substantial heterogeneity, and imprecision due to a wide 95% confidence interval.
We conducted an exploratory subgroup analysis in studies with a trial duration of less than 12 weeks, and studies with a trial duration of 12 weeks or more. We had not prespecified this trial duration cut‐off, but chose this duration based on visual inspection of the forest plot which suggested that Padala 2017 had a greater change in apathy scores than Herrmann 2008 and Rosenberg 2013, despite having similar participant characteristics and dosing (Table 1). In studies lasting less than 12 weeks, methylphenidate may improve apathy compared to placebo (MD ‐2.62, 95% CI ‐4.80 to ‐0.44, P = 0.02, n = 85, 2 studies, I2 = 0%). In Padala 2017, the only study with a trial duration longer than 12 weeks, methylphenidate may also improve apathy compared to placebo (MD ‐9.90, 95% CI ‐13.50 to ‐6.30, P < 0.001, n = 60, 1 study). Within each subgroup, there was uncertainty associated with the results, which we considered to be of low quality because of serious concerns with indirectness due to nongeneralizability of results, and to imprecision.
We noted significant differences between subgroups (Chi2(1) = 11.49, P < 0.001, I2 = 91.3%). Trial duration is one possible explanation for the difference identified between subgroups. See Analysis 1.1; Figure 4.
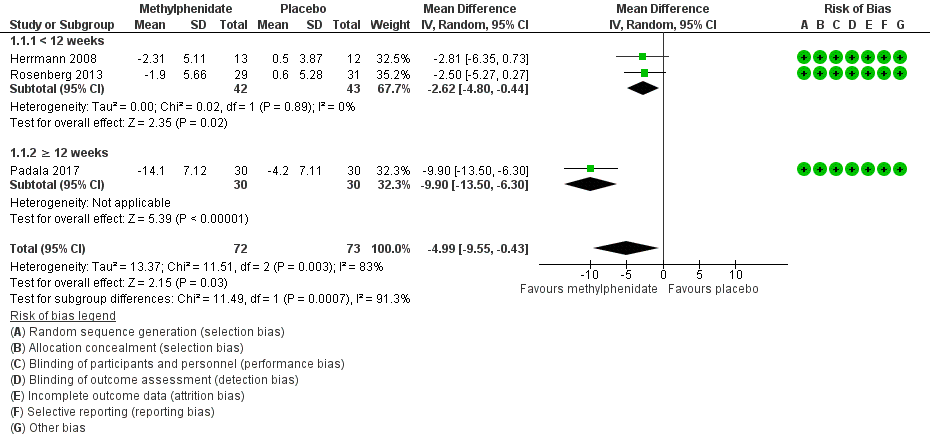
Forest plot of comparison: 7 Methylphenidate, outcome: 7.1 Apathy (AES only).
We could not conduct a subgroup analysis by disease severity, as all three studies enrolled participants with similar AD severity.
Apathy assessed by the NPI‐apathy subscale:
Based on findings obtained from the NPI‐apathy subscale, we found that methylphenidate may have no effect on apathy (MD ‐0.08, 95% CI ‐3.85 to 3.69, P = 0.97, n = 85, 2 studies I2 = 84%). There was uncertainty associated with this result, which we considered to be of low quality because of serious concerns with inconsistency due to substantial heterogeneity, and to imprecision due to a wide 95% confidence interval which may have contributed to an overall null effect. See Analysis 1.2.
As we included only two studies in this meta‐analysis, we did not conduct additional subgroup analyses.
2. Adverse events
Although Rosenberg 2013 reported that there were trends towards increased anxiety and weight loss (> 2%) in those allocated to methylphenidate, there was little or no difference between treatment groups in the risk of developing an AE (RR 1.28, 95% CI 0.67 to 2.42, P = 0.45, n = 145, 3 studies, I2 = 62%). There was uncertainty associated with this result, which we considered to be of low quality due to serious concerns with inconsistency and imprecision.
An exploratory subgroup analysis demonstrated that there was probably little or no difference between treatment groups in the risk of developing an AE in trials with a duration of less than 12 weeks (RR 1.28, 95% CI 0.44 to 3.72, P = 0.65, n = 85, 2 studies, I2 = 38%), or in trials of 12 weeks or longer (RR 1.44, 95% CI 0.73 to 2.86, P = 0.29, n = 60, 1 study). Within each subgroup, there was uncertainty associated with the results, which we considered to be of low quality because of serious concerns with indirectness due to nongeneralizability of results, and to imprecision.
There were no significant differences noted between subgroups (Chi2(1) = 0.03, P = 0.85, I2 = 0%). See Analysis 1.3; Figure 5.
We did not conduct a subgroup analysis based on disease severity, as all three studies enrolled participants with similar AD severity.
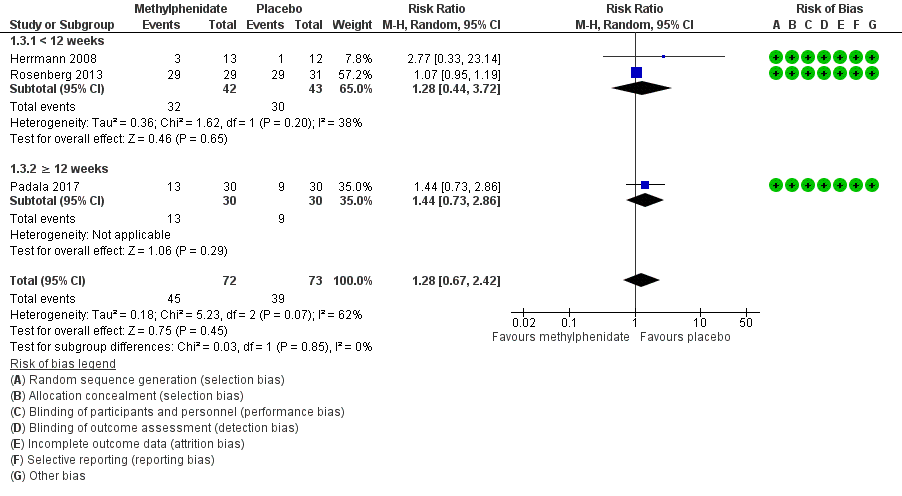
Forest plot of comparison: 7 Methylphenidate, outcome: 7.3 Adverse Events.
Secondary outcomes:
3. Neuropsychiatric symptoms
Only one study investigated and reported on the change in NPS over study duration (Herrmann 2008). There may be little or no difference between treatment groups in the change in NPI total score over two weeks (MD 0.16, 95% CI ‐7.89 to 8.21, P = 0.97, n = 25, 1 study). There was uncertainty associated with this result, which we considered to be of low quality because of serious concerns with imprecision, as there was a wide 95% confidence interval, which may have contributed to the overall null effect, in a single study with a small sample size. See Analysis 1.4.
4. Cognition
All studies assessed change in cognition using the MMSE. Compared to placebo, methylphenidate probably improves cognition slightly, although this difference may not be large enough to be of clinical importance (MD 1.98, 95% CI 1.06 to 2.91, P < 0.0001, n = 145, 3 studies, I2 = 37%). We considered this evidence to be of moderate quality, because of serious concerns with imprecision due to a wide 95% confidence interval.
An exploratory subgroup analysis in studies by trial duration demonstrated that there was probably little or no difference between treatment groups on change in cognition over time in trials with a duration of less than 12 weeks (MD 1.00, 95% CI ‐0.49 to 2.49, P = 0.19, n = 85, 2 studies, I2 = 0%). In Padala 2017, the only study with a trial duration longer than 12 weeks, methylphenidate probably improves cognition compared to placebo (MD 2.60, 95% CI 1.43 to 3.77, P < 0.001, n = 60, 1 study). We rated the evidence for both subgroup analyses as of moderate quality, because of serious concerns with imprecision due to a wide 95% confidence interval.
We found no significant differences between subgroups (Chi2(1) = 2.74, P = 0.10, I2= 63.5%).See Analysis 1.5.
We did not conduct a subgroup analysis based on disease severity, as all three studies enrolled participants with similar AD severity.
5. Functional performance
Only one study reported on the change in functional performance using the ADL and IADL (Padala 2017). There was no evidence of a difference between methylphenidate and placebo ADLs over 12 weeks: MD 0.50, 95% CI ‐0.39 to 1.39, P = 0.27, n = 60 patients, 1 study. See Analysis 1.6. However, compared to placebo, methylphenidate probably improves IADLs over 12 weeks: MD 2.30, 95% CI 0.74 to 3.86, P = 0.004, n = 60 patients, 1 study. There was some uncertainty associated with both findings, which we considered to be of moderate quality, as only one study with a small sample size was included in these comparisons. See Analysis 1.7.
6. Global disease severity
Two studies reported on global disease severity, measured with the CGI. This was expressed in both studies as the number of participants who experienced clinical deterioration over the course of the study (Herrmann 2008; Rosenberg 2013). There was probably little or no difference between treatment groups in the number who experienced clinical deterioration (RR 0.58, 95% CI 0.16 to 2.11, P = 0.40, n = 85, 2 studies I2 = 0%). We considered this evidence to be of moderate quality, because of serious concerns with imprecision due to a wide 95% confidence interval. See Analysis 1.8.
7. Dropouts due to AEs
There may be little or no difference between treatment groups in the number of dropouts due to an AE (RR 2.18, 95% CI 0.64 to 7.45, P = 0.21, n = 145, 3 studies, I2 = 0%). There was low certainty associated with this result, which we considered to be of low quality due to serious concerns about imprecision. See Analysis 1.9.
Comparison of modafinil with placebo
See: summary of findings Table 2. Only one very small study (n = 23 randomized, 1 participant excluded from analysis due to AE related dropout) investigated and reported on the efficacy of modafinil for the treatment of apathy as a primary outcome measure (Frakey 2012). In all of the following outcomes, there were no concerns with risk of bias, inconsistency or indirectness. However, we had very serious concerns with imprecision due to the small sample size and wide 95% confidence intervals. As such we rated the quality of evidence for all of the outcomes as low.
Primary efficacy and safety outcomes:
1. Apathy
Apathy was assessed using the FrSBE apathy subscale. Tscores are converted from raw scores which range from 14 to 70, and there is very limited information available on what constitutes a clinically important difference in score. There was no evidence of a difference between treatment groups in the change in apathy over eight weeks (MD 0.27, 95% CI ‐3.51 to 4.05, P = 0.89, n = 22, 1 study). See Analysis 2.1.
2. Adverse events
We did not conduct an analysis for this outcome, as there was only one adverse event reported in the modafinil treatment group and none reported in the placebo group.
Secondary outcomes:
3. Neuropsychiatric symptoms
This outcome was not reported by Frakey 2012.
4. Cognition
This outcome was not investigated by Frakey 2012.
5. Functional performance
There was no evidence of a difference between modafinil and placebo in change in functional status over eight weeks (MD ‐0.54, 95% CI ‐1.40 to 0.32, P = 0.22, n = 22, 1 study). See Analysis 2.2.
6. Global disease severity
This outcome was not investigated by Frakey 2012.
7. Dropouts due to AEs
There was one dropout from the modafinil treatment group due to an increase in motor tics, and no dropouts from the placebo arm. We did not conduct an analysis for this outcome, as only one individual in the study experienced an AE.
Objective 2:
Included studies of ChEIs, antipsychotics, mibampator and semagacestat were supported by pharmaceutical industry sponsors. Additionally, although a large number of studies with antipsychotics, antipsychotic discontinuation, and antidepressants in AD have been conducted, many of which collected data on NPS including apathy, only a few studies reported this or provided data upon request. We therefore downgraded the overall quality of the evidence due to serious concern about the effect of publication bias. Publication bias was not a concern with studies included in the ChEI comparison, as these trials included a large number of participants, and were less likely to remain unpublished or ignored. Furthermore, these trials may provide a more precise estimate of the treatment effect, whether positive or negative.
We also downgraded the overall quality of the evidence due to serious concerns with indirectness, as none of the studies contributing to Objective 2 comparisons actively recruited participants with clinically significant apathy.
The evidence provided in this section must therefore be considered of low quality at best.
Comparison of cholinesterase inhibitors (ChEIs) with placebo
We included six studies investigating ChEIs for cognition in people with AD, that also included apathy as a secondary outcome measure in this meta‐analysis. All six studies used the NPI‐apathy subscale to assess apathy.
ChEIs may slightly improve apathy compared to placebo (MD ‐0.40, 95% CI ‐0.80 to ‐0.00, P = 0.05, n = 3598, 6 studies, I2= 71%). We considered the available evidence to be of low quality. We downgraded the evidence due to serious concerns with indirectness, inconsistency and selective reporting of adjusted mean values, but upgraded one level due to the large sample size (Kaufer 1998; Morris 1998; Raskind 1999; Tariot 2001; MSAD trial; Herrmann 2005). However, the clinical importance of these findings is uncertain, as apathy was not a primary outcome measure of these studies.
We conducted subgroup analyses of studies using currently‐approved ChEIs (donepezil, galantamine or rivastigmine), all of which had a duration 24 weeks or less, and studies using metrifonate which all lasted more than 24 weeks. Currently‐approved ChEIs may have little or no effect on apathy compared to placebo (MD ‐0.21, 95% CI ‐0.85 to 0.43, P = 0.29, n = 2531, 3 studies, I2 = 80%). However, metrifonate may improve apathy compared to placebo (MD ‐0.63, 95% CI ‐0.98 to ‐0.29, P > 0.001, n = 1067, 3 studies, I2 = 0%). Again, we rated the quality of the evidence as low due to serious concerns with indirectness, and selective reporting of adjusted mean value. There were no significant differences between subgroups (Chi2(1) = 1.30, P = 0.25, I2 = 23.2%). See Analysis 3.1; Figure 6.
We also conducted subgroup analyses of studies in which participants had moderate or severe AD. In those with moderate AD, ChEIs may slightly improve apathy compared to placebo (MD ‐0.43, 95% CI ‐0.79 to ‐0.07, P = 0.02, n = 3100, 4 studies, I2 = 50%). In participants with severe AD, ChEIs may also slightly improve apathy compared to placebo (MD ‐0.36, 95% CI ‐1.82 to 1.10, P = 0.63, n = 498, 2 studies, I2 = 90%); however this finding was not statistically significant. As mentioned previously, we rated the quality of the evidence as low due to serious concerns with indirectness of the study population, and selective reporting of adjusted mean values. There was no significant difference between subgroups (Chi2(1) = 0.01, P = 0.93, I2 = 0%). See Analysis 3.2.
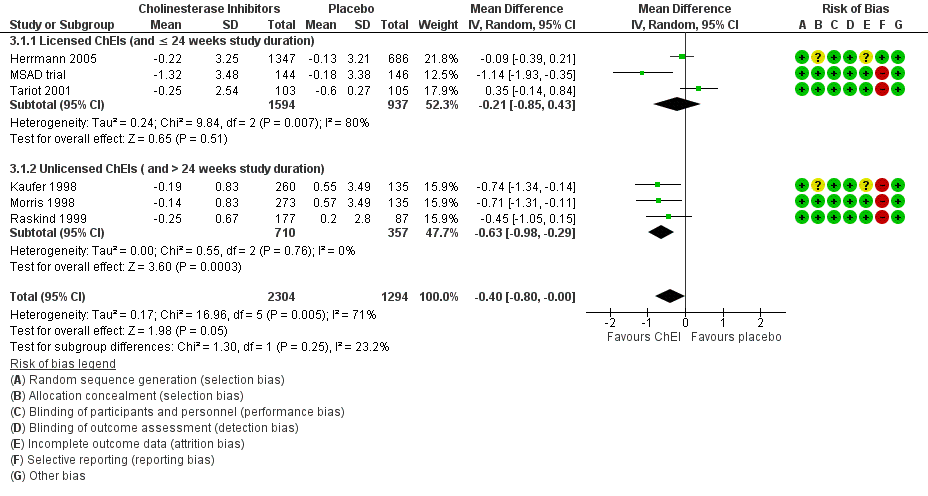
Forest plot of comparison: 3 Cholinesterase Inhibitors, outcome: 3.1 Change in apathy from baseline as measured by the NPI‐apathy subscore (subgroup analysis with licensed versus unlicensed ChEIs).
Comparison of ChEI with ChEI discontinuation (placebo)
Only one study investigating the discontinuation of ChEIs met the inclusion criteria for this meta‐analysis (Herrmann 2016). All participants in this trial were long‐term ChEI users (more than two years), and were considered eligible for this trial if they no longer demonstrated any clinical benefit from their ChEI.
Although not statistically significant, discontinuing ChEIs may slightly improve apathy compared to continued ChEI use, based on the NPI‐apathy subscale (MD 1.11, 95% ‐0.88 to 3.10, P = 0.28, n = 40, 1 study). There was some uncertainty associated with this result, which we considered to be of low quality because of serious concerns with imprecision due to the small sample size and wide 95% confidence interval, and indirectness of results.See Analysis 4.1.
Comparison of antipsychotics with placebo
All studies in this meta‐analysis that investigated antipsychotics were conducted in people with clinically significant agitation and aggression. We did not perform subgroup analyses by trial duration and disease severity, as only two studies met the inclusion criteria for this particular meta‐analysis.
De Deyn 2004 assessed apathy using the NPI‐apathy subscale, while Sultzer 2008 assessed apathy using the BPRS withdrawn depression factor score. Antipsychotic use may slightly worsen apathy compared to placebo (standardized mean difference (SMD 0.14, 95% CI ‐0.00 to 0.28, P = 0.05, n = 1070, 2 studies, I2 = 15%). There is some uncertainty associated with this result, which we considered to be of low quality due to serious concerns with indirectness and publication bias. See Analysis 5.1.
Comparison of antipsychotics with antipsychotic discontinuation (placebo)
Only one study which investigated the discontinuation of antipsychotics met the inclusion criteria for this meta‐analysis (Ruths 2008).
Continued antipsychotic use may slightly improve apathy on the NPI‐apathy subscale compared to antipsychotic discontinuation (placebo): MD ‐0.24, 95% CI ‐0.51 to 0.03, P = 0.08, n = 55, 1 study. There was uncertainty associated with this result, which we considered to be of low quality due to serious concerns with indirectness and publication bias. Additionally, the clinical importance of these findings is uncertain, as apathy was not a primary outcome measure of these studies. See Analysis 6.1.
Comparison of antidepressants with placebo
Two studies with antidepressants met the inclusion criteria for this meta‐analysis (Lanctôt 2002; CitAD trial). All participants had clinically significant NPS (Lanctôt 2002) or agitation (CitAD trial) at baseline. Apathy was assessed with the NPI‐apathy subscale.
We are uncertain whether antidepressants improved apathy compared to placebo over the duration of treatment (MD ‐1.24, 95% ‐1.44 to ‐1.04, P < 0.00001, n = 126, 2 studies, I2 = 3%). There was uncertainty associated with this result, which we considered to be of very low quality due to selective reporting (the NPI‐subscores in the CitAD trial were not normally distributed, and the reported medians were used as an estimate of the sample mean), indirectness of results, and publication bias. See Analysis 7.1.
Comparison of mibampator with placebo
Only one study investigated and reported on the efficacy of mibampator for the treatment of apathy (Trzepacz 2013).
We are uncertain whether mibampator improved apathy, assessed with the FrSBe‐apathy Tscore compared to placebo over the duration of treatment (MD ‐1.20, 95% ‐1.94 to ‐0.46, P = 0.001, n = 132, 1 study). There was uncertainty associated with this result, which we considered to be of very low quality due to selective reporting of adjusted mean values, indirectness of results, and publication bias. See Analysis 8.1.
Comparison of valproate with placebo
Three studies investigated and reported on the efficacy of valproate for the treatment of apathy (Sival 2002; Herrmann 2007; Tariot 2011).
There may be little or no difference between treatment groups in the change in apathy over the duration of treatment (SMD 0.02, 95% CI ‐0.23 to 0.26, P = 0.88, n = 257, 3 studies, I2 = 0%). There was uncertainty associated with this result, which we considered to be of low quality due to indirectness and imprecision. See Analysis 9.1.
Comparison of semagacestat with placebo
Only one paper (Rosenberg 2016) reported on the efficacy of semagacestat for the treatment of apathy in a secondary analysis of a previously published trial (Semgacestat trial).
Semagacestat may slightly worsen apathy assessed with the NPI subscale compared to placebo over the duration of treatment (MD 0.20, 95% CI 0.15 to 0.25, P < 0.001, n = 939, 1 study), but the effect is probably too small to be of clinical significance. There was some uncertainty associated with this result, which we considered to be of low quality as there were concerns with indirectness of results and publication bias. See Analysis 10.1.
Discusión
Resumen de los resultados principales
Los resultados de este metanálisis mostraron los siguientes resultados principales:
-
El metilfenidato puede mejorar la apatía comparado con placebo, basado en las puntuaciones del cambio en la AES en los pacientes con EA y apatía clínicamente significativa al inicio. Sin embargo, este resultado no fue apoyado por los resultados de las puntuaciones del cambio en las subescalas de la apatía en el NPI. Aunque esta inconsistencia puede atribuirse a las diferencias entre las escalas, otra diferencia es que el análisis con datos de los eventos adversos incluyó tres estudios y 145 participantes (Herrmann 2008; Rosenberg 2013; Padala 2017), mientras que el análisis con datos de la subescala de apatía del NPI incluyó sólo dos estudios con 85 participantes (Herrmann 2008; Padala 2017). El análisis de subgrupos con datos de los eventos adversos indica que el tamaño del efecto fue más grande en un estudio de 12 semanas que en los estudios de seis y ocho semanas, aunque este resultado podría deberse a razones diferentes a la duración del ensayo. En particular, hubo incertidumbre con estos resultados, debido a que se asociaron con evidencia de baja calidad. El metilfenidato también puede mejorar la cognición y la función. Ambos hallazgos se asociaron con evidencia de calidad moderada, aunque la diferencia en la cognición fue pequeña y como resultado puede no ser clínicamente significativa. No hubo diferencias significativas entre los grupos de tratamiento en el riesgo de desarrollar un evento adverso.
-
En los pacientes con EA y apatía clínicamente significativa al inicio, la evidencia de baja calidad de un estudio muy pequeño sugirió que no hubo ningún efecto del modafinilo en la apatía.
Todos los otros estudios incluidos midieron la apatía como un resultado secundario. Los participantes de estos estudios no necesariamente presentaban apatía clínicamente significativa al inicio.
-
El uso de ICE puede mejorar levemente la apatía en comparación con placebo, aunque hay algunas dudas asociadas con este resultado debido a la baja calidad de la evidencia. Además, la importancia clínica de este resultado es incierta, debido a que la apatía no fue una medida de resultado primaria, y el tamaño del efecto fue pequeño. Se mantuvo la importancia y la heterogeneidad se redujo en los estudios con metrifonato solamente. Estos hallazgos no se repitieron en los estudios más recientes con los ICE actualmente aprobados. Los estudios con metrifonato tuvieron una duración mayor del estudio (más de 24 semanas) y se realizaron sólo en pacientes con EA leve a moderada. Sin embargo, debido a que las diferencias entre subgrupos no fueron significativas, no fue posible confirmar el efecto del tipo de ICE (ICE aprobado versus metrifonato) o la duración del ensayo sobre la eficacia de la intervención con ICE en la apatía. En un análisis de subgrupos de la gravedad de la enfermedad, se encontraron efectos de un tamaño similar en los pacientes con EA moderada y grave. Sin embargo, hay incertidumbre asociada con este resultado, debido a la baja calidad de la evidencia.
-
Los antipsicóticos atípicos y el semagacestat pueden empeorar la apatía en comparación con placebo. Basado en los hallazgos de un ensayo de interrupción de antipsicóticos, el uso continuo de antipsicóticos puede mejorar levemente la apatía en comparación con la interrupción de los antipsicóticos. La importancia clínica de este resultado es incierta, debido a que la apatía no fue una medida de resultado primaria, y el tamaño del efecto fue pequeño. Los hallazgos de un ensayo de interrupción de los ICE indicaron que la interrupción de los ICE puede mejorar levemente la apatía en comparación con la continuación de los ICE. Estos hallazgos estuvieron limitados por una baja calidad de evidencia.
-
El valproato demostró poca o ninguna diferencia en la apatía. Sin embargo, estos resultados fueron apoyados por evidencia de baja calidad.
-
La evidencia relacionada con los hallazgos sobre los antidepresivos y el mibampator fue de muy baja calidad, debido al informe selectivo, la imposibilidad para generalizar los resultados y el sesgo de publicación. Por lo tanto no existe seguridad sobre si estas intervenciones tienen un efecto sobre la apatía.
Compleción y aplicabilidad general de las pruebas
Al realizar un metanálisis fue posible combinar los hallazgos de múltiples ensayos clínicos para evaluar la eficacia de varias intervenciones farmacológicas para el tratamiento de la apatía en la EA. Cuando se evalúa la aplicabilidad de esta revisión al contexto clínico, se deben considerar las medidas de resultado, las características de los participantes y la duración del tratamiento.
Los estudios con modafinilo y metilfenidato fueron directamente aplicables a la pregunta de la revisión. Reclutaron a participantes con apatía clínicamente significativa, e incluyeron la apatía como una medida de resultado primaria, que fue probablemente elegida antes de diseñar los ensayos respectivos. Como tal, estos ensayos pueden tener un riesgo reducido de errores de positivos falsos que son resultado del análisis estadístico de muchos resultados y pueden tener un riesgo reducido de errores de falsos negativos al sentar las bases para un cálculo del tamaño de la muestra para un estudio con el poder estadístico suficiente (Andrade 2015). Para el metilfenidato, se encontraron algunos datos sobre todas las medidas de resultado. Para el modafinilo, no se encontraron datos sobre la cognición, los SNS generales ni la gravedad de la enfermedad global.
Todos los otros estudios incluidos investigaron la apatía como una medida de resultado secundaria. Aunque este hecho puede aumentar el riesgo de errores de falsos positivos y falsos negativos, los resultados de estos estudios todavía son de interés debido a la ausencia actual de fármacos aprobados para el tratamiento de la apatía en la EA. Sin embargo, para estas intervenciones, los análisis deben considerarse exploratorios. A partir de estos estudios, se buscaron los datos sobre la apatía solamente. Además de un diagnóstico estandarizado de EA, los estudios con antipsicóticos, antidepresivos y mibampator también tuvieron SNS clínicamente significativos como parte de los criterios de inclusión; en diferentes estudios los mismos fueron la carga general de SNS, la agitación/agresión o la psicosis. La apatía es uno de los SNS observados con mayor frecuencia en los pacientes con EA leve. En los estadios avanzados de la EA, la psicosis, la agitación y la agresión también se vuelven más prevalentes, aunque la apatía persiste. En una revisión sistemática de 59 estudios, se informó que la apatía fue el único SNS con alta prevalencia inicial, persistencia e incidencia en todo el curso de la demencia (Van der Linde 2016). En consecuencia, los resultados de estos estudios todavía pueden ser aplicables, a pesar de que los participantes presenten SNS diferentes de la apatía. Algunos aunque no todos los estudios del Objetivo 2 informaron las puntuaciones de la apatía al inicio en sus participantes y en varios de los mismos la apatía estuvo a niveles generalmente considerados como clínicamente significativos.
Cinco comparaciones contuvieron más de un estudio y en las mismas varió la duración de los estudios. Los tres estudios del metilfenidato variaron de dos a 12 semanas. En los estudios con ICE, la duración de los mismos varió de 12 a 26 semanas. En los estudios con antipsicóticos atípicos, la duración de los mismos varió de cuatro a 36 semanas. En los estudios con antidepresivos, la duración de los mismos varió de cuatro a nueve semanas. Los estudios con valproato variaron en cuanto a la duración desde tres semanas a 24 meses. Se había esperado explorar el efecto de la duración del tratamiento, aunque en la práctica los datos ofrecieron poca oportunidad de hacerlo debido a los números pequeños de estudios y participantes.
Para esta revisión, la apatía fue el único resultado evaluado en el Objetivo 2. Sin embargo, las revisiones sistemáticas publicadas de los ECA con ICE (Birks 2006), interrupción de los ICE (O’Regan 2015), antipsicóticos atípicos (Ballard 2006), interrupción de antipsicóticos (Declercq 2013), antidepresivos (Seitz 2011) y valproato (Lonergan 2009) pueden proporcionar una apreciación con respecto a la seguridad y la eficacia en los pacientes con EA y apatía.
Calidad de la evidencia
Todos los estudios incluidos se realizaron e informaron de manera adecuada, por lo que hubo pocas preocupaciones graves acerca de los riesgos de sesgo. Cuatro estudios se consideraron en alto riesgo de sesgo de informe selectivo debido a que informaron sólo las puntuaciones medias ajustadas y no brutas.
Para el Objetivo 1; la calidad general de la evidencia fue baja para el resultado primario de la eficacia y baja o moderada para los eventos adversos y los resultados secundarios. Este hecho se debió en gran parte a la imprecisión; hubo pocos estudios y fueron pequeños. También hubo inconsistencia entre los tres estudios del metilfenidato en cuanto al efecto sobre la apatía.
Para el Objetivo 2; la naturaleza y la calidad de la evidencia significaron que los resultados deben considerarse sólo exploratorios. Muchos participantes de estos estudios fueron incluidos debido a los niveles altos de SNS diferentes de la apatía, o no tenían ningún problema conductual particular. En consecuencia, estos estudios consideraron la pregunta de la revisión de forma indirecta. Además, fue posible obtener datos sobre la apatía sólo a partir de una minoría de los ensayos de los fármacos en la EA que la habían medido, lo cual planteó inquietudes en cuanto al sesgo de publicación. También se consideró que algunos de los resultados fueron afectados por la imprecisión, la inconsistencia o el riesgo de sesgo de informe selectivo.
Sesgos potenciales en el proceso de revisión
Diez de los 21 estudios que se incluyeron en el metanálisis eran estudios farmacéuticos patrocinados por la industria. La anterior puede ser una fuente de sesgo de publicación, debido a que se ha informado que el financiamiento de la industria farmacéutica se asocia con resultados que son favorables para el patrocinador (Lexchin 2003; Bhandari 2004; Heres 2006). La industria farmacéutica puede no publicar los estudios negativos con la misma frecuencia que los estudios positivos. El sesgo de publicación no necesariamente está limitado a los ensayos patrocinados por la industria, debido a que los investigadores académicos también pueden tener una mayor probabilidad de publicar los resultados positivos, que tienen mayor probabilidad de ser aceptados por los redactores, examinados por los compañeros y citados más a menudo. Los registros de ensayos clínicos procuran aumentar la transparencia y el acceso a la información acerca de los ensayos clínicos. Aunque los registros de ensayos clínicos han estado disponibles desde 1997; los cuerpos gubernamentales y las organizaciones internacionales han estado presionando para el registro y la estandarización de los registros de ensayos clínicos desde 2005. Desde 2008 la Declaration of Helsinki revisada ha declarado que cada ensayo clínico debe registrarse en una base de datos públicamente accesible antes del reclutamiento del primer participante (General Assembly of the World Medical Association). Sin embargo sólo 10 de los 21 estudios incluidos en este metanálisis se publicaron en o después de 2008.
Se estableció contacto con los autores de los 41 estudios adicionales que cumplieron con los criterios de inclusión de investigar la apatía como una medida de resultado primaria o secundaria debido a que no proporcionaron datos sobre el resultado primario de la apatía en un formato extraíble. Sin embargo, debido a que no se recibió una respuesta, o debido a que los datos ya no estaban disponibles para los autores, dichos estudios se excluyeron del metanálisis.
La subescala de apatía del NPI y la AES son dos de las escalas usadas más ampliamente en la investigación relacionada con la apatía en la EA. En esta revisión, 16 estudios usaron la subescala de apatía del NPI, cuatro estudios usaron la AES, dos usaron la FrSBe Tscore de apatía, un estudio usó la puntuación del factor de depresión y retraimiento de la BPRS y uno la subpuntuación del comportamiento apático de GIP. Debido a que se utilizaron diferentes escalas para evaluar la apatía en los estudios incluidos en esta revisión, la heterogeneidad de los resultados es una inquietud. Sin embargo, no hay ninguna escala de referencia ampliamente aceptada para la evaluación de la apatía y todavía existe una falta de consenso acerca de la definición y los criterios de diagnóstico para la apatía (Cummings 2015). Por lo tanto es importante que la investigación futura se centre en la validación de las escalas y los criterios de diagnóstico para la apatía en la EA. Este hecho proporcionaría recomendaciones definitivas para los ensayos clínicos futuros en cuanto a cómo dirigirse de forma apropiada a los receptores de las intervenciones farmacológicas y cómo evaluar la apatía, lo cual reduciría la heterogeneidad entre los estudios.
Acuerdos y desacuerdos con otros estudios o revisiones
Los resultados de este metanálisis se agregan al grupo de evidencia actual sobre las intervenciones farmacológicas para la apatía, debido a que los informes anteriores han sido no concluyentes en cuanto al esclarecimiento de si el metilfenidato es efectivo y seguro en el tratamiento de la apatía en los pacientes con EA.
En un metanálisis realizado por Sepehry 2017 los autores investigaron el tratamiento farmacológico para la apatía en la EA. Se incluyeron quince estudios, y 11 se analizaron de forma cuantitativa. Los agentes farmacológicos incluyeron ICE, memantina y psicoestimulantes (modafinilo y metilfenidato). Dicha revisión no encontró efectos considerables del fármaco sobre el placebo en la apatía. Sin embargo, los autores revelaron que a falta de estadísticas descriptivas (valores de la media y la DE), generaron tamaños del efecto mediante los valores de p y los tamaños de la muestra. Cuando no se informaron los valores de p, los autores supusieron un alfa de 0,06 para los análisis. Este método de imputación de datos probablemente podría haber sesgado los hallazgos de sus resultados debido a un alto riesgo de informe selectivo.
Una revisión integral por Harrison 2016 evaluó la evidencia de las farmacoterapias para la apatía a partir de estudios realizados desde 2013. Sin embargo, debido a que no requirieron que los ensayos fuesen controlados con placebo, ni trataron la apatía como una medida de resultado primaria o secundaria, ni se consideró la EA como un diagnóstico estandarizado, sus hallazgos no fueron compatibles con los de esta revisión. En lo que se refiere a los ICE, Harrison 2016 informó que los hallazgos anteriores acerca de los reforzadores cognitivos (ICE y memantina) no se repitieron en estudios más recientes. Este resultado fue similar al de esta revisión, debido a que se encontró un beneficio en los ensayos más antiguos que investigaron el metrifonato, pero no con los ensayos más recientes con los ICE aprobados actualmente. Además, aunque los resultados con los antidepresivos fueron contradictorios, se encontraron beneficios con la agomelatina en un ECA no controlado con placebo (Callegari 2016). Sus hallazgos con metilfenidato fueron no concluyentes, aunque sólo incluyeron un estudio (Rosenberg 2013). Se informó sobre la eficacia del metilfenidato en la apatía en tres ensayos. Sin embargo, como no se encontró evidencia de alta calidad, se sugiere que los estudios adicionales que investiguen la eficacia del metilfenidato en la apatía en pacientes con EA aumentarían la calidad de la evidencia y fortalecerían este resultado.

2Study flow diagram.

Risk of bias summary: review authors' judgements about each risk of bias item for each included study.

Figure 3 CaptionRisk of bias graph: review authors' judgements about each risk of bias item presented as percentages across all included studies.

Forest plot of comparison: 7 Methylphenidate, outcome: 7.1 Apathy (AES only).

Forest plot of comparison: 7 Methylphenidate, outcome: 7.3 Adverse Events.

Forest plot of comparison: 3 Cholinesterase Inhibitors, outcome: 3.1 Change in apathy from baseline as measured by the NPI‐apathy subscore (subgroup analysis with licensed versus unlicensed ChEIs).

Comparison 1 Methylphenidate, Outcome 1 Change in apathy from baseline as measured by the AES.

Comparison 1 Methylphenidate, Outcome 2 Change in apathy from baseline as measured by the NPI‐apathy subscore.

Comparison 1 Methylphenidate, Outcome 3 Adverse Events.

Comparison 1 Methylphenidate, Outcome 4 Change in NPS from baseline as measured by the NPI.

Comparison 1 Methylphenidate, Outcome 5 Change in cognition from baseline as measured by the MMSE.

Comparison 1 Methylphenidate, Outcome 6 Change in functional permance from baseline as measured by the ADL.

Comparison 1 Methylphenidate, Outcome 7 Change in functional performance from baseline as measured by the IADL.

Comparison 1 Methylphenidate, Outcome 8 Change in global disease severity from baseline as measured by the CGIC and the ADCS‐CGIC.

Comparison 1 Methylphenidate, Outcome 9 Dropouts due to adverse events.

Comparison 2 Modafinil, Outcome 1 Change in apathy from baseline as measured by the FrSBe‐apathy subscale.

Comparison 2 Modafinil, Outcome 2 Change in functional performance from baseline as measured by the ADL‐Q.
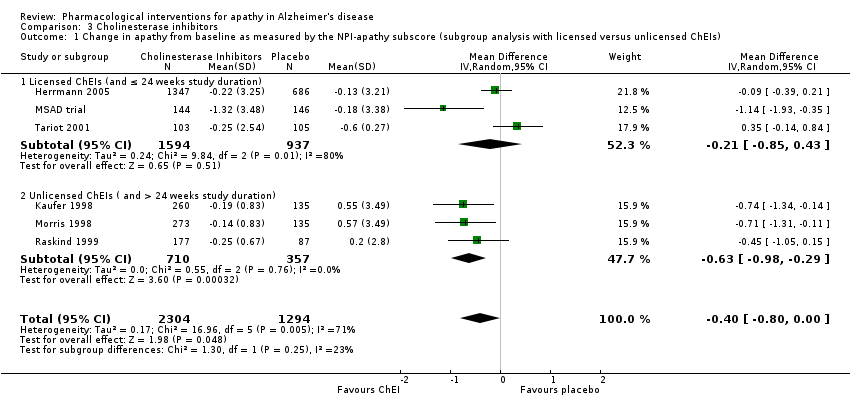
Comparison 3 Cholinesterase inhibitors, Outcome 1 Change in apathy from baseline as measured by the NPI‐apathy subscore (subgroup analysis with licensed versus unlicensed ChEIs).

Comparison 3 Cholinesterase inhibitors, Outcome 2 Change in apathy from baseline as measured by the NPI‐apathy subscore (subgroup analysis with disease severity).

Comparison 4 Discontinuation of cholinesterase inhibitors, Outcome 1 Change in apathy from baseline as measured by the NPI‐apathy subscore.

Comparison 5 Atypical antipsychotics, Outcome 1 Change in apathy from baseline as measured by the NPI‐apathy subscore and the BPRS withdrawn depression factor score.

Comparison 6 Discontinuation of antipsychotics, Outcome 1 Change in apathy from baseline as measured by the NPI‐apathy subscore.

Comparison 7 Antidepressants, Outcome 1 Change in apathy from baseline as measured by the NPI‐apathy subscore.

Comparison 8 Mibampator, Outcome 1 Change in apathy from baseline as measured by the FrSBe‐apathy T score.

Comparison 9 Valproate, Outcome 1 Change in apathy from baseline as measured by the NPI‐apathy subscore and GIP‐apathy subscore.

Comparison 10 Semagacestat, Outcome 1 Change in apathy from baseline as measured by the NPI‐apathy subscore.
| Methylphenidate compared to placebo for apathy in Alzheimer's disease | ||||||
| Patient or population: Apathy in people with mild‐to‐moderate Alzheimer's disease | ||||||
| Outcomes | Anticipated absolute effects* (95% CI) | Relative effect | № of participants | Quality of the evidence | Comments | |
| Risk with placebo | Risk with Methylphenidate | |||||
| Change in apathy (AES score) | The mean change from baseline in apathy was ‐4.2 to 0.6 | MD 4.99 lower | ‐ | 145 | ⊕⊕⊝⊝ | AES: Limited data on clinically meaningful changes |
| Change in apathy (NPI‐apathy subscale score) | The mean change from baseline in apathy ‐2.6 to ‐1.69 | MD 0.08 lower | ‐ | 85 | ⊕⊕⊝⊝ | 1‐ to 2‐point change suggested to be clinically significant in people with a clinically significant apathy (Rosenberg 2013) |
| Adverse events | Study population | RR 1.28 | 145 | ⊕⊕⊝⊝ | ‐ | |
| 534 per 1000 | 684 per 1000 | |||||
| Change in NPS | The mean change from baseline in NPS was ‐2.08 | MD 0.16 higher | ‐ | 25 | ⊕⊕⊝⊝ | 4‐point change suggested to be clinically significant |
| Change in cognition | The mean change from baseline in cognition was ‐1.08 to ‐0.3 | MD 1.79 higher | ‐ | 145 | ⊕⊕⊕⊝ | MMSE: 2‐ to 4‐point change suggested to be clinically significant |
| Change in functional performance assessed with: ADL scale | The mean change from baseline in functional performance was 0.4 | MD 0.50 higher | ‐ | 60 | ⊕⊕⊕⊝ | Limited data on clinically meaningful changes |
| Change in functional performance assessed with: IADL scale | The mean change from baseline in functional performance was ‐0.6 | MD 2.30 higher | ‐ | 60 | ⊕⊕⊕⊝ | Limited data on clinically meaningful changes |
| Change in global disease severity | Study population | RR 0.56 | 85 | ⊕⊕⊕⊝ | ‐ | |
| 116 per 1000 | 65 per 1000 | |||||
| Dropouts | Study population | RR 2.10 | 145 | ⊕⊕⊝⊝ | ‐ | |
| 41 per 1000 | 86 per 1000 | |||||
| *The risk in the intervention group (and its 95% confidence interval) is based on the assumed risk in the comparison group and the relative effect of the intervention (and its 95% CI). AD: Alzheimer's disease; AEs: Adverse Events; MMSE: Mini‐Mental Status Examination; MD: Mean Difference; NPS: Neuropsychiatric Symptom, SMD: Standardized Mean Difference, CI: Confidence interval; RR: Risk ratio; OR: Odds ratio | ||||||
| GRADE Working Group grades of evidence | ||||||
| 1Quality downgraded one level due imprecision (wide 95% confidence interval). | ||||||
| Modafinil compared to placebo for apathy in Alzheimer's disease | ||||||
| Patient or population: Apathy in people with mild‐to‐moderate Alzheimer's disease | ||||||
| Outcomes | Anticipated absolute effects* (95% CI) | Relative effect | № of participants | Quality of the evidence | Comments | |
| Risk with placebo | Risk with Modafinil | |||||
| Change in apathy | The mean change from baseline in apathy was ‐6.82 | MD 0.27 higher | ‐ | 22 | ⊕⊕⊝⊝ | Limited data on clinically meaningful changes on the FrSBe apathy score |
| Adverse Events ‐ reported, but not analyzed in this review | ‐ | ‐ | ‐ | ‐ | ‐ | ‐ |
| Change in NPS ‐ not investigated | ‐ | ‐ | ‐ | ‐ | ‐ | ‐ |
| Change in cognition ‐ not investigated | ‐ | ‐ | ‐ | ‐ | ‐ | ‐ |
| Change in functional performance | The mean change from baseline in functional performance was 0 | MD 0.54 lower | ‐ | 22 | ⊕⊕⊝⊝ | Limited data on clinically meaningful changes |
| Change in global disease severity ‐ not investigated | ‐ | ‐ | ‐ | ‐ | ‐ | ‐ |
| Dropouts ‐ reported, but not analyzed in this review | ‐ | ‐ | ‐ | ‐ | ‐ | ‐ |
| *The risk in the intervention group (and its 95% confidence interval) is based on the assumed risk in the comparison group and the relative effect of the intervention (and its 95% CI). | ||||||
| GRADE Working Group grades of evidence | ||||||
| 1Quality downgraded two levels due to small sample size and imprecision (wide 95% confidence interval). | ||||||
| STUDY DURATION | N OF PARTICIPANTS | Diagnosis | MEAN AGE (YRS) | MEAN MMSE (SD) | MEAN BL NPI‐APATHY (SD) score | COUNTRY | NUMBER OF SITES | TREATMENT GROUPS | |
| METHYLPHENIDATE | |||||||||
| 2 weeks Cross‐over design: 2 treatment phases of 2 weeks with a 1‐week washout between phases | 13 total | Possible or probable AD (NINCDS‐ADRDA), and apathy (NPI‐apathy subscale ≥ 1) | 77.9 (7.8) | 19.9 (4.7) | 5.9 (3) | Canada | 3 | Group 1: Methylphenidate (10 mg twice a day) | |
| 6 weeks | 60 participants | Possible or probable AD (NINCDS‐ADRDA), and clinically significant apathy for at least 4 weeks | 76 (8) | 20 (5) | Group 1: 7 (2) | USA, Canada | 3 | Group 1: Methylphenidate (target: 20 mg daily) | |
| 12 weeks | 60 participants | Dementia of the AD type (DSM‐IV‐TR), and presence of apathy (AES > 40) | 76.6 (7.9) | 23.8 (2.5) | Not reported | USA | 1 | Group 1: Methylphenidate (target: 20 mg daily) | |
| MODAFINIL | |||||||||
| 8 weeks | Group 1: 11 | Possible or probable AD (NINCDS‐ADRDA criteria) and clinically significant apathy (FrSBe Tscore ≥ 65) | Group 1: 75.3 (8.3) | Not disclosed | Not reported | USA | 1 | Group 1: Modafinil (200 mg daily) | |
| CHOLINESTERASE INHIBITORS | |||||||||
| 24 weeks | Group 1: 103 Group 2: 105 | Possible or probable AD with cerebrovascular disease (but not vascular dementia) (NINCDS‐ADRDA criteria) | Group 1: 85.4 | Group 1: 14.4 (5.4) | Not reported | USA | 27 | Group 1: Donepezil ‐ 5 mg/day for 28 days. 10 mg/day after 28 days based on tolerability. | |
| 24 weeks | Group 1: 144 | AD (DSM‐IV and NINCDS‐ADRDA criteria) | 73.6 | Group 1: 11.7 (0.35) | Group 1: | Canada, Australia, France | 32 | Group 1: Donepezil ‐ 5 mg/day for 28 days. 10 mg/day after 28 days based on tolerability. | |
| Range: 3 ‐ 6 months (12 ‐ 24 weeks) | Group 1: 1347 | Probable AD (NINCDS‐ADRDA criteria) | 76 | 18 | Group 1: | USA, Canada, Great Britain, South Africa, Australia, and New Zealand | Multicenter, but number not disclosed | Group 1: Galantamine | |
| 26 weeks | Group 1: 273 | Probable AD (NINCDS‐ADRDA criteria) | Not reported | Not reported | Not reported | USA | 25 | Group 1: Metrifonate (2 weeks – 2.0 mg/kg, followed by 0.65 mg/kg) | |
| 26 weeks | Group 1: 273 | Probable AD (NINCDS‐ADRDA criteria) | Group 1: 73.5 (8.1) | Group 1: 18.8 (5) | Not reported | USA | 24 | Group 1: Metrifonate (2 weeks – 2.0 mg/kg, followed by 0.65 mg/kg) | |
| 26 weeks | Group 1: 177 | Probable AD (NINCDS‐ADRDA criteria) mild‐moderate AD | Group 1: 74.6 (8.3) | Group 1: 18.7 (4.76) | Not reported | USA (additional sites are not disclosed) | Multicenter, but number not disclosed | Group 1: | |
| CHOLINESTERASE DISCONTINUATION | |||||||||
| 8 weeks | Group 1: 21 | Probable AD (NINCDS‐ADRDA criteria) | 89.3 | Group 1: 8.1(5.2) | Group 1: | Canada | 2 | Group 1: Donepezil, | |
| ATYPICAL ANTIPSYCHOTICS | |||||||||
| 10 weeks | Group 1: 132 | Possible or probable AD (NINCDS‐ADRDA criteria and DSM‐IV‐TR), and clinically significant psychotic symptoms | 76.6 (10.4) | 13.7 (5.1) | Group 1: 3.2 (3.9) | Europe, Australia, Israel, Lebanon, and South Africa | 61 | Group 1: 7.5 mg OLZ | |
| Up to 36 weeks (12 weeks of treatment) data available | Group 1: 100 | Dementia of the AD type (DSM‐IV) or probable AD (NINCDS‐ADRDA) and daily delusions, hallucinations, agitation, or aggression over 4 weeks prior to study entry | 77.9 (7.5) | Group 1: 15 (5.4) | Not reported | USA | 42 | Group 1: OLZ | |
| ANTIPSYCHOTIC DISCONTUATION | |||||||||
| 4 weeks | Group 1: 28 | Dementia diagnosis according to ICD‐10 | 83.4 (6.9) | Not provided | Group 1: | Norway | 9 | Group 1: Antipsychotics (haloperidol, risperidone, or olanzapine) | |
| ANTIDEPRESSANTS | |||||||||
| 4 weeks: Cross‐over design: 2 treatment phases of 4 weeks with a 1‐week washout between phases | 22 total | Primary degenerative dementia (DSM‐IV) and probable AD (NINCDS‐ADRDA), and significant behavioral problems (NPI ≥ 8) | 82 (6) | 4.1 (4.7) | Group 1: | Canada | 3 | Group 1: Sertraline (100 mg daily) | |
| 9 weeks | Group 1: 94 | Probable AD (NINCDS‐ADRDA), and significant behavioral problems (NPI ≥ 8), and clinically significant agitation on the NPI > 3 | Group 1: 78 (9) | Group 1: 17 (6.2) | Group 1: | USA | 6 | Group 1: Citalopram (30 mg daily) | |
| MIBAMPATOR | |||||||||
| 12 weeks | Group 1: 63 | Probable AD (NINCDS‐ADRDA) (DSM‐IV‐TR), and clinically significant agitation/aggression | Group 1: 77.2 (8.2) | Group 1: 16.0 (6.1) Group 2: 18 (5.3) | Not reported | USA | Multicenter, but number not disclosed | Group 1: Mibampator (target dose: 3 mg daily) | |
| VALPROATE | |||||||||
| 6 weeks: Cross‐over design: 2 treatment phases of 6 weeks with a 2‐week washout between phases | Group 1: 14 | Probable AD (NINCDS‐ADRDA), primary degenerative dementia (DSM‐IV) | 85.6 (4.5) | 4.5 (4.6) | Group 1: 2.4 (3.8) | Canada | 2 | Group 1: Valproate (mean dose: 1134.6 (400.1) mg daily) | |
| 3 weeks: Cross‐over design: 2 treatment phases of 3 weeks with a 1‐week washout between phases | Group 1: 42 | Senile dementia (NINCDS‐ADRDA)(DSM‐IV) | 80.4 (6.8) | 11.4 (5) | Not reported | Netherlands | 1 | Group 1: Valproate (2 x 240 mg) | |
| 24 months (+ 2‐month single‐blind placebo phase) | Group 1: 153 | Possible or probable AD (NINCDS‐ADRDA) | Group 1: 74.9 | Group 1: 16.9 (3.0) | Group 1: | USA | 46 | Group 1: Valproate (flexible‐dose) (mean modal dose: 250 mg daily) | |
| SEMAGACESTAT | |||||||||
| 76 weeks | Group 1: 463 | Mild‐moderate AD (NINCDS‐ADRDA) | Group 1: 72.7 (7.9) | Group 1: 20.9 (3.5) | Not reported | USA | 91 | Group 1: LY100 | |
| AD: Alzheimer's disease, BL: baseline, DSM: Diagnostic and Statistical Manual of Mental Disoders, FrSBe: Frontal Systems Behavior Scale, ICD: International Classification of Diseases, LY: LY450319 (Eli Lillyand Company study drug), NINCDS‐ADRDA: National Institute of Neurological and Communicative disorders and the Alzheimer's Disease and Related Disorders Association, NPI: Neuropsychiatric Inventory, OLZ: olanzapine, QUE: quetiapine, RIS: risperidone, SD: standard deviation. | |||||||||
| Study | Apathy | AE reported | NPS | Cognition | Function | Global Change | Dropouts due to AEs reported |
| METHYLPHENIDATE | |||||||
| AES‐Informant | Yes | NPI‐total | MMSE | N/A | CGI‐C | Yes | |
| AES‐Informant | Yes | NPI‐total (not reported) | MMSE | N/A | ADCS‐CGIC | Yes | |
| AES‐Clinician | Yes | N/A | MMSE | ADL | N/A | Yes | |
| MODAFINIL | |||||||
| FrSBe‐apathy subscale | Yes | N/A | N/A | ADLQ | N/A | Yes | |
| CHOLINESTERASE INHIBITORS | |||||||
| NPI‐apathy subscale | These outcomes were not investigated for this drug comparison | ||||||
| NPI‐apathy subscale | |||||||
| NPI‐apathy subscale | |||||||
| NPI‐apathy subscale | |||||||
| NPI‐apathy subscale | |||||||
| NPI‐apathy subscale | |||||||
| CHOLINESTERASE DISCONTINUATION | |||||||
| NPI‐apathy subscale | These outcomes were not investigated for this drug comparison. | ||||||
| ATYPICAL ANTIPSYCHOTICS | |||||||
| NPI‐apathy subscale | These outcomes were not investigated for this drug comparison | ||||||
| BPRS‐withdrawn depression factor score | |||||||
| ANTIPSYCHOTIC DISCONTINUATION | |||||||
| NPI‐apathy subscale | These outcomes were not investigated for this drug comparison | ||||||
| ANTIDEPRESSANTS | |||||||
| NPI‐apathy subscale | These outcomes were not investigated for this drug comparison | ||||||
| NPI‐apathy subscale | |||||||
| MIBAMPATOR | |||||||
| FrSBe‐apathy T score | These outcomes were not investigated for this drug comparison | ||||||
| VALPROATE | |||||||
| NPI‐apathy subscale | These outcomes were not investigated for this drug comparison | ||||||
| GIP‐apathetic behavior subscore | These outcomes were not investigated for this drug comparison | ||||||
| NPI‐apathy subscale | These outcomes were not investigated for this drug comparison | ||||||
| SEMAGACESTAT | |||||||
| NPI‐apathy | These outcomes were not investigated for this drug comparison | ||||||
| ADCS‐CGIC: Alzheimer's Diserase Cooperative Study ‐ Clinical Global Impression of Change, ADL: Activities of Daily Living scale, ADLQ: Lawton and Brody Fucntional Assessment, AES: Apathy Evaluation Scale, CGI‐C: Clinical Global Impression of Change, FrSBe: Frontal Systems Behavior Scale, GIP: The Behavior Observation Scale for Intramural Psychogeriatric Patients, IADL: Instrumental Activities of Daily Living Scale, MMSE: Mini‐Mental State Examination, NPI: Neuropsychiatric Inventory. | |||||||
| Outcome or subgroup title | No. of studies | No. of participants | Statistical method | Effect size |
| 1 Change in apathy from baseline as measured by the AES Show forest plot | 3 | 145 | Mean Difference (IV, Random, 95% CI) | ‐4.99 [‐9.55, ‐0.43] |
| 1.1 < 12 weeks | 2 | 85 | Mean Difference (IV, Random, 95% CI) | ‐2.62 [‐4.80, ‐0.44] |
| 1.2 ≥ 12 weeks | 1 | 60 | Mean Difference (IV, Random, 95% CI) | ‐9.90 [‐13.50, ‐6.30] |
| 2 Change in apathy from baseline as measured by the NPI‐apathy subscore Show forest plot | 2 | 85 | Mean Difference (IV, Random, 95% CI) | ‐0.08 [‐3.85, 3.69] |
| 3 Adverse Events Show forest plot | 3 | 145 | Risk Ratio (M‐H, Random, 95% CI) | 1.28 [0.67, 2.42] |
| 3.1 < 12 weeks | 2 | 85 | Risk Ratio (M‐H, Random, 95% CI) | 1.28 [0.44, 3.72] |
| 3.2 ≥ 12 weeks | 1 | 60 | Risk Ratio (M‐H, Random, 95% CI) | 1.44 [0.73, 2.86] |
| 4 Change in NPS from baseline as measured by the NPI Show forest plot | 1 | 25 | Mean Difference (IV, Fixed, 95% CI) | 0.16 [‐7.89, 8.21] |
| 5 Change in cognition from baseline as measured by the MMSE Show forest plot | 3 | 145 | Mean Difference (IV, Fixed, 95% CI) | 1.98 [1.06, 2.91] |
| 5.1 < 12 weeks study duration | 2 | 85 | Mean Difference (IV, Fixed, 95% CI) | 1.00 [‐0.49, 2.49] |
| 5.2 ≥ 12 weeks study duration | 1 | 60 | Mean Difference (IV, Fixed, 95% CI) | 2.6 [1.43, 3.77] |
| 6 Change in functional permance from baseline as measured by the ADL Show forest plot | 1 | 60 | Mean Difference (IV, Fixed, 95% CI) | 0.5 [‐0.39, 1.39] |
| 7 Change in functional performance from baseline as measured by the IADL Show forest plot | 1 | 60 | Mean Difference (IV, Fixed, 95% CI) | 2.3 [0.74, 3.86] |
| 8 Change in global disease severity from baseline as measured by the CGIC and the ADCS‐CGIC Show forest plot | 2 | 85 | Risk Ratio (M‐H, Fixed, 95% CI) | 0.58 [0.16, 2.11] |
| 9 Dropouts due to adverse events Show forest plot | 3 | 145 | Risk Ratio (M‐H, Fixed, 95% CI) | 2.18 [0.64, 7.45] |
| Outcome or subgroup title | No. of studies | No. of participants | Statistical method | Effect size |
| 1 Change in apathy from baseline as measured by the FrSBe‐apathy subscale Show forest plot | 1 | 22 | Mean Difference (IV, Fixed, 95% CI) | 0.27 [‐3.51, 4.05] |
| 2 Change in functional performance from baseline as measured by the ADL‐Q Show forest plot | 1 | 22 | Mean Difference (IV, Fixed, 95% CI) | ‐0.54 [‐1.40, 0.32] |
| Outcome or subgroup title | No. of studies | No. of participants | Statistical method | Effect size |
| 1 Change in apathy from baseline as measured by the NPI‐apathy subscore (subgroup analysis with licensed versus unlicensed ChEIs) Show forest plot | 6 | 3598 | Mean Difference (IV, Random, 95% CI) | ‐0.40 [‐0.80, ‐0.00] |
| 1.1 Licensed ChEIs (and ≤ 24 weeks study duration) | 3 | 2531 | Mean Difference (IV, Random, 95% CI) | ‐0.21 [‐0.85, 0.43] |
| 1.2 Unlicensed ChEIs ( and > 24 weeks study duration) | 3 | 1067 | Mean Difference (IV, Random, 95% CI) | ‐0.63 [‐0.98, ‐0.29] |
| 2 Change in apathy from baseline as measured by the NPI‐apathy subscore (subgroup analysis with disease severity) Show forest plot | 6 | 3598 | Mean Difference (IV, Random, 95% CI) | ‐0.40 [‐0.80, ‐0.00] |
| 2.1 Moderate AD (MMSE ≥ 18) | 4 | 3100 | Mean Difference (IV, Random, 95% CI) | ‐0.43 [‐0.79, ‐0.07] |
| 2.2 Severe AD (MMSE < 18) | 2 | 498 | Mean Difference (IV, Random, 95% CI) | ‐0.36 [‐1.82, 1.10] |
| Outcome or subgroup title | No. of studies | No. of participants | Statistical method | Effect size |
| 1 Change in apathy from baseline as measured by the NPI‐apathy subscore Show forest plot | 1 | 40 | Mean Difference (IV, Fixed, 95% CI) | 1.11 [‐0.88, 3.10] |
| Outcome or subgroup title | No. of studies | No. of participants | Statistical method | Effect size |
| 1 Change in apathy from baseline as measured by the NPI‐apathy subscore and the BPRS withdrawn depression factor score Show forest plot | 2 | 1070 | Std. Mean Difference (IV, Fixed, 95% CI) | 0.14 [0.00, 0.28] |
| Outcome or subgroup title | No. of studies | No. of participants | Statistical method | Effect size |
| 1 Change in apathy from baseline as measured by the NPI‐apathy subscore Show forest plot | 1 | 55 | Mean Difference (IV, Fixed, 95% CI) | ‐0.24 [‐0.51, 0.03] |
| Outcome or subgroup title | No. of studies | No. of participants | Statistical method | Effect size |
| 1 Change in apathy from baseline as measured by the NPI‐apathy subscore Show forest plot | 2 | 126 | Mean Difference (IV, Fixed, 95% CI) | ‐1.24 [‐1.44, ‐1.04] |
| Outcome or subgroup title | No. of studies | No. of participants | Statistical method | Effect size |
| 1 Change in apathy from baseline as measured by the FrSBe‐apathy T score Show forest plot | 1 | 132 | Mean Difference (IV, Fixed, 95% CI) | ‐1.2 [‐1.94, ‐0.46] |
| Outcome or subgroup title | No. of studies | No. of participants | Statistical method | Effect size |
| 1 Change in apathy from baseline as measured by the NPI‐apathy subscore and GIP‐apathy subscore Show forest plot | 3 | 257 | Std. Mean Difference (IV, Fixed, 95% CI) | 0.02 [‐0.23, 0.26] |
| Outcome or subgroup title | No. of studies | No. of participants | Statistical method | Effect size |
| 1 Change in apathy from baseline as measured by the NPI‐apathy subscore Show forest plot | 1 | 939 | Mean Difference (IV, Fixed, 95% CI) | 0.20 [0.15, 0.25] |