Medikamentöse Interventionen gegen Apathie bei Alzheimer
Zusammenfassung
Hintergrund
Trotz der hohen Prävalenz von Apathie bei Alzheimer und ihren schädlichen Auswirkungen gibt es momentan keine gesicherten Therapien, um dieses Symptom zu behandeln. Kürzlich wurden einige medikamentöse Therapien als mögliche Behandlungen gegen Apathie bei Alzheimer untersucht.
Ziele
1. Ziel: Die Bewertung der Sicherheit und Wirkung von Arzneimitteltherapien zur Behandlung von Apathie bei Alzheimer.
2. Ziel: Die Bewertung der Auswirkung von Arzneimitteltherapien auf Apathie, die bezüglich anderer primärer Endpunkte bei Alzheimer untersucht wurden.
Literatursuche
Wir durchsuchen das spezialisierte Register der Cochrane Dementia and Cognitive Improvement Group (ALOIS), MEDLINE, Embase, CINAHL, PsycINFO, LILACS, ClinicalTrials.gov und das Portal der Weltgesundheitsorganisation (WHO), ICTRP am 17. Mai 2017.
Auswahlkriterien
Einschlussfähige Studien waren doppelt verblindete, randomisierte Placebo‐kontrollierte Studien (RCTs), die Apathie als primären oder sekundären Endpunkt bei Menschen mit Alzheimer untersuchten.
Datenerhebung und ‐analyse
Drei Review‐Autoren extrahierten Daten. Wir bewerteten das Risiko für Bias der eingeschlossenen Studien anhand von Cochrane Methoden und die gesamte Qualität der Evidenz für jeden Endpunkt mit dem GRADE‐Ansatz. Wir berechneten Mittelwertdifferenzen (MD), standardisierte Mittelwertdifferenzen (SMD) oder Risiko‐Verhältnisse (RR) mit 95%‐Konfidenzintervallen auf einer intention‐to‐treat‐Basis für alle relevanten Endpunkte.
Wesentliche Ergebnisse
Wir schlossen 21 Studien mit insgesamt 6.384 Teilnehmern in die quantitative Analyse ein. Das Risiko für Bias ist sehr niedrig bis moderat. Alle Studien berichteten angemessene Methoden für die Randomisierung und Verblindung. Die meisten Studien berichteten angemessene Methoden für die verdeckte Gruppenzuteilung. Vier Studien, drei zu Methylphenidat und eine zu Modafinil, hatten als Hauptziel die Verbesserung von Apathie. In diesen Studien hatten alle Teilnehmer von Anfang an eine klinisch signifikante Apathie. Methylphenidat könnte Apathie im Vergleich zu Placebo verbessern. Dieses Ergebnis trat auf, wenn Apathie anhand der Apathy Evaluation Scale (AES) gemessen wurde, die von allen drei Studien zu Methylphenidat verwendet wurde: MD ‐4,99, 95 % KI ‐9,55 bis ‐0,43, n = 145, 3 Studien, Evidenz von niedriger Qualität. Es trat aber nicht auf, wenn sie anhand der Neuropsychiatric Inventory (NPI)‐Apathie Subskala gemessen wurde, die von zwei der drei Studien zu Methylphenidat verwendet wurde: MD ‐0,08, 95 % KI ‐3,85 bis 3,69, n = 85, 2 Studien, Evidenz von niedriger Qualität. Neben möglichem Nutzen für Apathie verbessert Methylphenidat, verglichen mit Placebo, wahrscheinlich auch etwas die Kognition (MD 1,98, 95 % KI 1,06 bis 2,91, n = 145, 3 Studien, Evidenz von moderater Qualität) und instrumentelle Aktivitäten des täglichen Lebens (MD 2,30, 95 % KI 0,74 bis 3,86, P = 0,004, n = 60, 1 Studie, Evidenz von moderater Qualität). Möglicherweise besteht kein Unterschied zwischen Methylphenidat und Placebo beim Risiko, dass ein unerwünschtes Ereignis auftritt: RR 1,28, 95 % KI 0,67 bis 2,42, n = 145, 3 Studien, Evidenz von niedriger Qualität. Es gab ungenügende Evidenz aus einer sehr kleinen Studie zu Modafinil, um dessen Wirkung auf Apathie zu bestimmen. Die Studie verwendete die FrSBe‐Apathie‐Subskala: MD 0,27, 95 % KI ‐3,51 bis 4,05, n = 22, 1 Studie, Evidenz von niedriger Qualität. In den restlichen eingeschlossenen Studien war Apathie ein sekundärer Endpunkt und die Teilnehmer wurden nicht anhand klinisch signifikanter Apathie ausgewählt. Wir bewerteten die Evidenz zu Apathie aus diesen Studien als indirekt und mit Publikationsbias verbunden. Es gab Evidenz von niedriger oder sehr niedriger Qualität zu Cholinesterase‐Inhibitoren (6 Studien), Absetzen von Cholinesterase‐Inhibitoren (1 Studie), Neuroleptika (2 Studien), Absetzen von Neuroleptika (1 Studie), Antidepressiva (2 Studien), Mibampator (1 Studie), Valproate (3 Studien) und Semagacestat (1 Studie).
Schlussfolgerungen der Autoren
Methylphenidat zeigt möglicherweise einen Nutzen bei Apathie und könnte einen geringfügigen Nutzen für Kognition und Funktionalität bei Menschen mit Alzheimer haben. Dieses Ergebnis basiert jedoch auf Evidenz von niedriger Qualität. Unsere Meta‐Analyse ist eingeschränkt durch die kleine Anzahl an Studien zu den einzelnen Arzneistoffklassen, Risiko für Bias, Publikationsbias, unzureichende Präzision und Inkonsistenz zwischen den Studien. Zusätzliche Studien sollten geplant werden, die gezielt Alzheimer‐Patienten mit klinisch signifikanter Apathie betrachten und Apathie als primären Endpunkt untersuchen. Diese Studien sollten länger andauern und größere Stichproben betrachten. Dies könnte die Qualität der Evidenz für Methylphenidat verbessern und möglicherweise bestätigen, ob Methylphenidat eine wirksame Arzneimitteltherapie gegen Apathie bei Alzheimer darstellt.
PICO
Laienverständliche Zusammenfassung
Medikamentöse Behandlungen gegen Apathie bei Alzheimer
Fragestellung
Wir wollten wissen, ob es sichere und wirksame Medikamente gibt, um Apathie bei Menschen mit Alzheimer zu mindern.
Hintergrund
Apathie ist ein Zustand mit vermindertem Interesse, fehlender Initiative und verminderter Aktivität. Sie ist ein sehr häufig auftretendes Symptom von Alzheimer. Sie ist oftmals andauernd und es ist bekannt, dass sie in Verbindung mit einer niedrigeren Lebensqualität, schnelleren Verschlechterung und höherer Belastung der Betreuer steht. Wirksame Behandlungen gegen Apathie könnten die Lebensqualität der Menschen mit Alzheimer und die ihrer Familien verbessern.
Was wir getan haben
Wir suchten bis Mai 2017 nach randomisierten kontrollierten Studien (RCTs), die jegliches Medikament mit einem Placebo (Scheinbehandlung) verglichen und die Wirkung auf Apathie bei Menschen mit Alzheimer gemessen haben. Wir waren nur an Studien interessiert, in denen durch zufällige Verfahren entschieden wurde, ob die Teilnehmenden das betreffende Medikament oder Placebo erhielten. Damit sollte sichergestellt werden, dass der Vergleich so fair wie möglich war.
Ergebnisse
Wir fanden 21 RCTs mit mehr als 6.300 Menschen mit Alzheimer. Vier Studien mit zwei unterschiedlichen Medikamenten (Methylphenidat und Modafinil) wurden speziell durchgeführt, um Apathie zu untersuchen. Daher war bei allen Teilnehmenden bekannt, dass sie erheblich apathisch waren, bevor die Studie begann. Die restlichen 17 Studien hatten andere Hauptziele, berichteten aber einige Daten zu Apathie. Die Studien wurden im Allgemeinen methodisch gut konzipiert und durchgeführt. Mit den drei Studien zu Methylphenidat fanden wir heraus, dass Methylphenidat Apathie verbessern könnte ‐ dies hing aber davon ab, wie Apathie gemessen wurde. Menschen, die Methylphenidat einnahmen, schnitten im Vergleich zu jenen, die Placebo bekamen außerdem etwas besser bei Skalen zu Kognition (Denken, Erinnern, usw.) und einigen alltäglichen Aktivitäten ab. Allerdings war nicht klar, ob diese Wirkungen groß genug waren, um praxisrelevant zu sein. Wir fanden keine Evidenz dafür, dass Methylphenidat mehr Nebenwirkungen auslöste als Placebo. Die Qualität der Evidenz war niedrig oder moderat, daher können wir uns nicht sicher sein, ob andere ähnliche Studien nicht andere Ergebnisse erzielen würden. Zu Modafinil gab es lediglich eine sehr kleine Studie und es gab keine Evidenz dafür, dass Modafinil wirksam gegen Apathie war. Die verbleibenden 17 Studien untersuchten eine Vielfalt an Medikamenten und schlossen Menschen ein, die nicht unbedingt erheblich apathisch waren. Wir dachten daher, dass sie nur indirekt relevant für unsere Fragestellung sind. Es ist außerdem höchstwahrscheinlich, dass andere Studien mit den gleichen Medikamenten Apathie gemessen haben, die Ergebnisse aber nicht veröffentlichten. Daher waren wir besorgt über einen möglichen Publikationsbias (dass die Studien, die wir gefunden haben, eine verzerrte Teilmenge sein könnten). Deshalb schätzten wir die Qualität der Evidenz für alle anderen Medikamente als niedrig oder sehr niedrig ein. Das bedeutet, dass wir ein eingeschränktes oder geringes Vertrauen in die Ergebnisse haben.
Schlussfolgerungen
Die aktuelle Evidenz legt nahe, dass Methylphenidat möglicherweise nützlich zur Behandlung von Apathie bei Alzheimer ist. Allerdings sollten mehr Studien durchgeführt werden, die gezielt Apathie untersuchen, um die gesamte Qualität der Evidenz zu verbessern.
Authors' conclusions
Summary of findings
| Methylphenidate compared to placebo for apathy in Alzheimer's disease | ||||||
| Patient or population: Apathy in people with mild‐to‐moderate Alzheimer's disease | ||||||
| Outcomes | Anticipated absolute effects* (95% CI) | Relative effect | № of participants | Quality of the evidence | Comments | |
| Risk with placebo | Risk with Methylphenidate | |||||
| Change in apathy (AES score) | The mean change from baseline in apathy was ‐4.2 to 0.6 | MD 4.99 lower | ‐ | 145 | ⊕⊕⊝⊝ | AES: Limited data on clinically meaningful changes |
| Change in apathy (NPI‐apathy subscale score) | The mean change from baseline in apathy ‐2.6 to ‐1.69 | MD 0.08 lower | ‐ | 85 | ⊕⊕⊝⊝ | 1‐ to 2‐point change suggested to be clinically significant in people with a clinically significant apathy (Rosenberg 2013) |
| Adverse events | Study population | RR 1.28 | 145 | ⊕⊕⊝⊝ | ‐ | |
| 534 per 1000 | 684 per 1000 | |||||
| Change in NPS | The mean change from baseline in NPS was ‐2.08 | MD 0.16 higher | ‐ | 25 | ⊕⊕⊝⊝ | 4‐point change suggested to be clinically significant |
| Change in cognition | The mean change from baseline in cognition was ‐1.08 to ‐0.3 | MD 1.79 higher | ‐ | 145 | ⊕⊕⊕⊝ | MMSE: 2‐ to 4‐point change suggested to be clinically significant |
| Change in functional performance assessed with: ADL scale | The mean change from baseline in functional performance was 0.4 | MD 0.50 higher | ‐ | 60 | ⊕⊕⊕⊝ | Limited data on clinically meaningful changes |
| Change in functional performance assessed with: IADL scale | The mean change from baseline in functional performance was ‐0.6 | MD 2.30 higher | ‐ | 60 | ⊕⊕⊕⊝ | Limited data on clinically meaningful changes |
| Change in global disease severity | Study population | RR 0.56 | 85 | ⊕⊕⊕⊝ | ‐ | |
| 116 per 1000 | 65 per 1000 | |||||
| Dropouts | Study population | RR 2.10 | 145 | ⊕⊕⊝⊝ | ‐ | |
| 41 per 1000 | 86 per 1000 | |||||
| *The risk in the intervention group (and its 95% confidence interval) is based on the assumed risk in the comparison group and the relative effect of the intervention (and its 95% CI). AD: Alzheimer's disease; AEs: Adverse Events; MMSE: Mini‐Mental Status Examination; MD: Mean Difference; NPS: Neuropsychiatric Symptom, SMD: Standardized Mean Difference, CI: Confidence interval; RR: Risk ratio; OR: Odds ratio | ||||||
| GRADE Working Group grades of evidence | ||||||
| 1Quality downgraded one level due imprecision (wide 95% confidence interval). | ||||||
| Modafinil compared to placebo for apathy in Alzheimer's disease | ||||||
| Patient or population: Apathy in people with mild‐to‐moderate Alzheimer's disease | ||||||
| Outcomes | Anticipated absolute effects* (95% CI) | Relative effect | № of participants | Quality of the evidence | Comments | |
| Risk with placebo | Risk with Modafinil | |||||
| Change in apathy | The mean change from baseline in apathy was ‐6.82 | MD 0.27 higher | ‐ | 22 | ⊕⊕⊝⊝ | Limited data on clinically meaningful changes on the FrSBe apathy score |
| Adverse Events ‐ reported, but not analyzed in this review | ‐ | ‐ | ‐ | ‐ | ‐ | ‐ |
| Change in NPS ‐ not investigated | ‐ | ‐ | ‐ | ‐ | ‐ | ‐ |
| Change in cognition ‐ not investigated | ‐ | ‐ | ‐ | ‐ | ‐ | ‐ |
| Change in functional performance | The mean change from baseline in functional performance was 0 | MD 0.54 lower | ‐ | 22 | ⊕⊕⊝⊝ | Limited data on clinically meaningful changes |
| Change in global disease severity ‐ not investigated | ‐ | ‐ | ‐ | ‐ | ‐ | ‐ |
| Dropouts ‐ reported, but not analyzed in this review | ‐ | ‐ | ‐ | ‐ | ‐ | ‐ |
| *The risk in the intervention group (and its 95% confidence interval) is based on the assumed risk in the comparison group and the relative effect of the intervention (and its 95% CI). | ||||||
| GRADE Working Group grades of evidence | ||||||
| 1Quality downgraded two levels due to small sample size and imprecision (wide 95% confidence interval). | ||||||
Background
Description of the condition
Current evidence suggests that Alzheimer’s disease (AD), a debilitating neurodegenerative disease, is increasing in prevalence amongst the ageing population. The World Alzheimer Report estimates that by 2015 47 million people worldwide would be living with dementia due to AD, and that this will double every 20 years, to 74.7 million people in 2030 and 131 million people in 2050 (World Alzheimer Report 2015). AD pathology often occurs together with vascular pathology (mixed AD) (Schneider 2007; Attems 2014). AD and mixed AD share cognitive and behavioral symptoms (Kapasi 2016). For the purposes of this systematic review, we will therefore use ‘AD’ when we refer to individuals diagnosed with AD or mixed AD.
Neuronal damage and death in the brain of a person with dementia lead to progressive changes in cognition, function and behavior, which negatively impact his or her ability to perform everyday activities of daily living and increase dependence on others. Treating AD is a healthcare and societal priority as the cost of care and the burden on caregivers increases. The governments of countries such as the UK, the USA, Canada, Norway, France and South Korea have developed and implemented national strategic plans to address the changes society will incur as AD prevalence increases (Prince 2013).
Treatment of the symptoms associated with AD is an important aspect of improving the quality of life of people living with AD and their caregivers. One such symptom is apathy which, according to diagnostic criteria outlined by Robert 2009, is defined as a disorder of motivation which includes reduced goal‐directed behavior, goal‐directed cognitive activity and emotions, as well as identifiable functional impairments. Apathy is associated with greater caregiver burden, as individuals diagnosed with apathy require more support to initiate and complete activities even when they may still be capable of doing so themselves. The presence of apathy increases with increasing disease severity, and is associated with increased cognitive and functional deficits (Tagariello 2009; Kales 2015). As such, apathy has been an emerging target of interest for pharmacological interventions.
Apathy and depression share some clinical features, such as diminished interest, psychomotor retardation, fatigue/hypersomnia and lack of insight, although depression is characterized by symptoms of dysphoria, suicidal ideation, self‐criticism, guilty feelings, pessimism and hopelessness which are absent in apathy (Marin 1994). There has been interstudy variability in estimates of the prevalence of apathy in individuals diagnosed with dementia (Landes 2001). This variability may be due in part to the inclusion of apathy symptoms on assessment tools of depression, such as the Hamilton Rating Scale of Depression (HAM‐D). However, in a study that administered the Neuropsychiatric Inventory (NPI), a behavioral scale which contains a depression subscale (with no apathy‐related items), and an apathy subscale (with no depression‐related items), there was no correlation between apathy and depression in dementia (Levy 1998). Several neuroimaging studies support the biological and phenomenological independence of apathy and depression. These studies report that structural relationships with apathy symptoms are functionally and anatomically distinct from structural relationships with depression (Starkstein 2009; Kang 2012).
Description of the intervention
Treatments for apathy include both behavioral and pharmacological interventions, which target psychosocial changes and neurochemical and neuropathological changes in AD, respectively (Landes 2001; Gitlin 2012).
Compared to those without significant apathy, the brains of apathetic individuals with AD show some increased pathological changes, such as increased neuronal loss (Förstl 1993), neurofibrillary tangles (Tekin 2001) and white matter hyperintensities (Starkstein 1997) in the frontal lobes and the associated circuits between frontal and subthalamic structures (Landes 2001). The cholinergic (Kaufer 1998a), dopaminergic (DA) (Roccaforte 1990; Debette 2002; Padala 2007), serotonergic (Hoehn‐Saric 1990; Marin 1995; Barnhart 2004), gamma‐aminobutyric acid (GABA)‐ergic (Lanctôt 2007a) and noradrenergic neurotransmitter systems have been investigated as potential targets for drug intervention, since each system may potentially be associated with the manifestations of apathy in people with AD.
Current pharmacological treatments used in the symptomatic management of apathy in individuals with AD include, but are not limited to, the following:
-
CNS stimulants.
-
Antidepressants.
-
Atypical antipsychotics.
-
Apomorphine.
-
Amantadine.
-
Cholinesterase inhibitors.
-
DA agonists.
How the intervention might work
Evidence from pharmacological, post mortem and imaging studies suggests that apathy in individuals with AD may be related to abnormalities of cholinergic, DA, serotoninergic, GABA‐ergic and noradrenergic neurotransmitter systems (Lanctôt 2001; Garcia‐Alloza 2005; Lanctôt 2007a; Lanctôt 2007b).
The cholinergic hypothesis of AD suggests that the degeneration of cholinergic neurons in the basal forebrain, and the associated disruption to cholinergic neurotransmission in the cerebral cortex, contribute greatly to the cognitive impairment experienced by individuals with AD (Bartus 1982). Cholinergic deficiency may also limit the neurotransmission between limbic system afferents and neocortical afferents, and hence contributes to the development of apathy in individuals with dementia due to AD. Treatment with acetylcholinesterase inhibitors, such as metrifonate (Kaufer 1998b; Raskind 1999; Cummings 2001) and tacrine (Kaufer 1998a), has shown benefits for apathy, and provides evidence for the involvement of a cholinergic deficiency in the manifestation of apathy. However, multiple studies suggest that deficiencies in other neurotransmitter systems are also involved (Hoehn‐Saric 1990; Herrmann 2004a; Lanari 2006; Lanctôt 2007a; Lanctôt 2007b).
Many studies have identified changes to the DA system in individuals with dementia (Allard 1990; Storga 1996; David 2008). In individuals with AD specifically, there is a reduction in DA neurotransmission between the basal ganglia, anterior cingulate and frontal cortex (Lanctôt 2007b). As these neural circuits comprise the brain reward system, which is highly correlated with apathy in individuals without cognitive impairment, it has been proposed that disruption to DA neurotransmission may contribute to the development and severity of apathy in individuals with dementia (Bressan 2005; Mitchell 2011).
The role of the serotonergic system in neuropsychiatric symptoms (NPS) has also been studied. The serotonin hypothesis of NPS postulates that a serotonin deficiency increases the likelihood of developing NPS, particularly depression and aggression (Vartiainen 1995; De Boer 2005; Albert 2013). In contrast, since selective serotonergic reuptake inhibitors (SSRIs), commonly used in the treatment of depression, have been linked to increased apathy in clinical trials, increased serotonergic neurotransmission has been implicated in the manifestation of apathy in dementia (Hoehn‐Saric 1990; Marin 1995; Barnhart 2004). SSRIs influence the DA system through inhibitory mechanisms that involve 5‐HT2C receptors (Walsh 1997), and stimulatory mechanisms that involve 5‐HT1B and 5‐HT3 receptors (De Deurwaerdère 1998). It has been hypothesized that pharmacological treatments aimed at balancing the serotonin‐dopamine neurotransmitter systems may reduce apathy in those with dementia (Abe 1975; De Boer 2005; Albert 2013).
Post mortem and neuroimaging studies indicate that there is a loss of GABA‐ergic and noradrenergic (NA) neurons in individuals with dementia (Abe 1975; Rossor 1982; Ellison 1986; Lowe 1988). It has been hypothesized that since GABA and NA are co‐transmitters with serotonin, pathological changes to the serotonergic system are accompanied by changes to the GABA‐ergic and noradrenergic systems, and that these may play a role in the manifestation of NPS in dementia (Rossor 1982). Lanctôt 2007a found that higher plasma GABA concentrations were linked to apathy in AD. Noradrenergic changes have not been specifically linked to this symptom (Herrmann 2004b).
Why it is important to do this review
It has been estimated that 97% of individuals with dementia experience one or more NPS over the course of their cognitive impairment, with apathy having a high prevalence of 71% (Steinberg 2008). As apathy has been associated with reduced quality of life and increased functional impairment, caregiver burden, cost of care and risk of institutionalization, it is an important NPS to treat (Boyle 2003; Hurt 2008; Vialta‐Franch 2013)
Behavioral interventions, usually involving caregivers, may be a safe treatment option as they are not accompanied by the adverse effects that can be associated with pharmacological interventions. They have a beneficial impact on the frequency and severity of NPS overall, and on caregivers’ negative reactions towards NPS (Overshott 2004; Brodaty 2012). However, caregiver‐delivered behavioral interventions have not been well investigated in apathetic individuals with AD.
Currently, there are pharmacological recommendations for the management of cognitive and functional impairments and NPS in individuals with AD (Herrmann 2013). However, there are no formal pharmacological recommendations specifically about the treatment of apathy in AD. There have been a few pharmacological studies in which treating apathy has been the primary objective of the study. There have also been many studies, involving several different classes of drugs, in which the primary outcome measures have been cognition or other non‐cognitive symptoms, but which have reported on apathy as a secondary outcome measure. Claims for efficacy against apathy have been made on the basis of this second class of study (Berman 2012). As a result, a systematic review is required, which considers the nature and quality of the evidence, to determine the safety, tolerability and efficacy of current pharmacological options for the treatment of apathy and to identify the most promising drugs to target for future investigation.
Objectives
Objective 1: To assess the safety and efficacy of pharmacotherapies for the treatment of apathy in Alzheimer's disease (AD).
Objective 2: To assess the effect on apathy of pharmacotherapies investigated for other primary outcomes in the treatment of AD.
Methods
Criteria for considering studies for this review
Types of studies
We included all placebo‐controlled, parallel and cross‐over randomized controlled trials (RCTs) that investigated medications to treat apathy in AD or mixed AD, or both. Apathy was a primary (Objective 1) or secondary (Objective 2) outcome in the included studies.
We also included parallel and cross‐over RCTs that compared two or more medications for treating apathy in people with AD or mixed AD.
Types of participants
We included participants who met standardized diagnostic criteria for AD or mixed AD (e.g. the Diagnostic and Statistical Manual of Mental Disorders (IV, IV Text Revision, 5) (APA 2013), the National Institute of Neurological and Communicative Disorders and Stroke/Alzheimer’s Disease and Related Disorders Association (NINCDS‐ADRDA) (McKhann 1984), the National Institute on Aging/Alzheimer’s Association (NIA/AA) (McKhann 2011) and the International Classification of Diseases and Related Health Problems 10th Revision (ICD‐10) (WHO 1992)).
We extracted information on baseline scores of apathy in order to determine if study populations had clinically significant apathy. However this was not an inclusion criterion for this meta‐analysis. Although some authors reported on clinically significant apathy using the Apathy Evaluation Scale (AES), Frontal Systems Behaviour Scale (FrSBe) Tscore, or clinical judgement, we classified studies as including participants with clinically significant apathy when the mean NPI‐apathy subscore was more than three at baseline (Mulin 2011).
Types of interventions
We included any pharmacological interventions. We applied no restrictions to duration of treatment or to medication dosage.
Types of outcome measures
For Objective 1 – the assessment of efficacy and safety of drugs being investigated specifically for the treatment of apathy in AD – we included the following outcomes in the review:
Primary outcomes
-
Apathy measured by a scale which specifically measures apathy, either exclusively or as one of its components. The scales include, but are not limited to, the Apathy Evaluation Scale (AES), the apathy component of the Clinical Global Impressions of Change scale (CGI‐C apathy), the Neuropsychiatric Inventory (NPI) apathy subscale, the Lille Apathy Rating Scale (LARS), the FrSBe–Apathy component, the Nurses’ Observation Scale for Inpatient Evaluation (NOSIE), the Brief Psychiatric Rating Scale (BPRS) and the Sandoz Clinical Assessment‐Geriatric Scale (SCAG).
-
Adverse effects.
Secondary outcomes
-
Neuropsychiatric symptoms other than apathy.
-
Cognition.
-
Functional performance.
-
Changes in global disease severity (CGI‐C).
-
Dropouts due to adverse events (AEs).
For Objective 2, when we considered studies reporting apathy as a secondary outcome measure, we evaluated the effect on apathy only. This was because these studies are likely to form only a small and unrepresentative subset of studies investigating the other outcomes. We considered them a useful source of preliminary information about possible effects on apathy, but an unsuitable dataset to estimate effects on safety or our secondary outcomes.
Search methods for identification of studies
Electronic searches
We searched ALOIS (www.medicine.ox.ac.uk/alois), the Cochrane Dementia and Cognitive Improvement Group Specialized Register, on 15 June 2016 and 05 May 2017. We used the following search terms: apathy, apathetic, BPSD.
The Information Specialist maintains ALOIS, which contains dementia and cognitive improvement studies identified from the following sources:
-
Monthly searches of a number of major healthcare databases: MEDLINE, Embase, CINAHL, PsycINFO and LILACS.
-
Monthly searches of a number of trial registers: the metaRegister of Controlled Trials; the Umin Japan Trial Register; the World Health Organization (WHO) International Clinical Trials Registry Platform (ICTRP) (which covers ClinicalTrials.gov, ISRCTN, the Chinese Clinical Trials Register, the German Clinical Trials Register, the Iranian Registry of Clinical Trials, the Netherlands National Trials Register and others).
-
Quarterly searches of the Cochrane Central Register of Controlled Trials (CENTRAL) (the Cochrane Library).
-
Six searches a month of a number of grey literature sources: ISI Web of Knowledge with Conference Proceedings; Index to Theses; and Australasian Digital Theses.
We did not limit the search by language or date of publication. If we found articles in languages other than English, we ensured that these articles were translated and screened for potential inclusion.
We performed separate searches of many of the above‐named sources to ensure that we retrieved the most up‐to‐date results. The search strategy that we used for the retrieval of trial reports from MEDLINE is in Appendix 1.
Searching other resources
We performed electronic searches only.
Data collection and analysis
Selection of studies
Three review authors independently screened the citations identified from the literature search by title and abstract. We identified potentially relevant articles and obtained the full‐text articles for assessment. Three review authors independently assessed these articles according to the previously‐mentioned criteria. We resolved any disagreements by discussion, and involved a third review author if necessary, until we reached consensus. We contacted the study authors for further information when necessary. We identified duplicate citations through author names, institution name or participant data.
For articles which investigated apathy as a primary outcome measure (Objective 1), we contacted the study authors for further information on our primary and secondary outcome measures when necessary. For articles which investigated apathy as a secondary outcome measure (Objective 2), we contacted the study authors for further information about the change in apathy, when necessary.
Data extraction and management
Three review authors independently extracted the data using a data extraction form. We obtained missing data from the study authors when possible. One review author entered the data into Review Manager 5 (RevMan) (Review Manager 2014), and the other review authors checked for accuracy. We resolved any discrepancies by consensus.
Assessment of risk of bias in included studies
Two review authors independently assessed the risks of bias in accordance with the Cochrane 'Risk of bias' assessment tool for assessing quality and risk of bias (Higgins 2011). We compared 'Risk of bias' ratings, and resolved discrepancies through discussion with co‐authors. The tool encourages consideration of how the sequence was generated, how allocation was concealed, the integrity of blinding (participants, raters and personnel), the completeness of outcome data, selective reporting and other potential sources of biases (e.g. carry‐over bias in cross‐over trials, recruitment bias in cluster‐RCTs or bias due to early stopping in specific situations). Where the included study provided inadequate details of randomization and other characteristics of the trials, we contacted the study authors to obtain further information.
We assessed the risk of bias in each domain and categorized it into one of the following.
-
Low risk of bias: plausible bias that is unlikely to seriously alter the results.
-
High risk of bias: plausible bias that seriously weakens confidence in the results.
-
Unclear risk of bias: plausible bias that raises some doubts about the results.
Measures of treatment effect
We analyzed the longer ordinal scales in meta‐analyses as continuous data. We converted shorter ordinal scales into dichotomous data by combining adjacent categories into two groups and defining one of the grouped categories as the event.
For continuous data, the measure of treatment effect was the mean difference (MD) with the 95% confidence interval (CI) if the pooled trials used the same rating scale or test, or the standardized mean difference (SMD) with a 95% CI if the trials used different scales to measure the same outcome.
For dichotomous data, the measure of treatment effect was the relative risk (RR) and its 95% CI.
In order to interpret findings, we used the GRADE approach (Guyatt 2008) to assess the overall quality of evidence for all outcomes with pooled data, rating each one as either high, moderate, low or very low quality. The GRADE ratings take into account risk of bias, imprecision, inconsistency, publication bias and indirectness, and express the degree of confidence one can have that the effect estimate is close to the true effect.
Unit of analysis issues
Carry‐over effects are a concern associated with cross‐over trials. If a study reported significant carry‐over effects, we used only data from the first phase of a cross‐over study. If a study reported no carry‐over effects, then we included data (paired data if possible) from both treatment phases.
Dealing with missing data
In the event of missing information, we requested unreported data from the author(s) of the original study. We preferred intention‐to‐treat (ITT) data when available. In the case of missing data for non‐completers, we recorded any imputation methods used by the study authors and considered the use of sensitivity analyses to assess the impact on the results of different methods of dealing with missing data.
Assessment of heterogeneity
Clinical heterogeneity
We considered separately studies that were related by drug group. Within each group of studies, we noted the obvious sources of heterogeneity and considered these in the analyses.
Statistical heterogeneity
Visual inspection
We inspected graphs to assess the possibility of statistical heterogeneity.
Use of the I2 statistic
We used the I2 statistic to identify heterogeneity across the included studies. If the I2 statistic value was greater than 40%, we took this value to represent significant heterogeneity.
Assessment of reporting biases
We performed a comprehensive search and included trial registries to minimize the risk of reporting bias, which may arise when publication is influenced by the nature and direction of results (Egger 1997).
Data synthesis
We used a fixed‐effect model for analyses with sufficient homogeneity. If there was significant heterogeneity, we used a random‐effects model. If possible, we conducted analyses in accordance with the principles of ITT.
Subgroup analysis and investigation of heterogeneity
Data permitting, we conducted subgroup analyses for each drug group to examine the effect of the following:
-
Treatment duration.
-
Disease severity and diagnostic group (i.e. AD or mixed dementia).
If there were high levels of heterogeneity, we explored the plausible causes of heterogeneity. If we identified statistical heterogeneity, we used the strategies recommended by the Cochrane Handbook for Systematic Reviews of Inteventions, Section 9.5.3 and completed a random‐effects meta‐analysis to incorporate heterogeneity among studies (Deeks 2011).
Sensitivity analysis
In order to address the robustness of our results to potential risks of bias, we repeated the previous analyses, excluding studies at high risk of bias. We identified issues suitable for sensitivity analysis during the review process.
Data presentation: 'Summary of findings' tables
We used the GRADE approach to assess the quality of evidence behind each estimate of treatment effect (Schünemann 2011). For each comparison, we presented key findings, including a summary of the amount of data and the magnitude of the effect size. For comparisons in Objective 1, we presented the overall quality of the evidence in a 'Summary of findings' table, created using GRADEpro software (www.gradepro.org). We preselected the following outcomes.
-
Apathy.
-
Adverse effects.
-
Overall behavioral symptoms.
-
Cognition.
-
Function.
-
Clinical global impression.
-
Dropouts due to AEs.
As described above, apathy was the only outcome measure evaluated for those studies assessing apathy as a secondary outcome measure (Objective 2). We did not produce ‘Summary of findings’ tables for Objective 2 comparisons. However, we described the quality of evidence, using the GRADE approach, along with the results.
Results
Description of studies
Results of the search
Our search of the database and other electronic sources yielded 5295 references and 675 references, respectively. After de‐duplication and first‐assess removal of non‐relevant references by Anna Noel‐Storr (Information Specialist of the CDCIG), MR and EHA, or MR and SC independently assessed the remaining 1566 references for relevance. Of these, we ruled out 1504 references as they either did not investigate apathy as a primary or secondary outcome measure, did not investigate the efficacy of a pharmacological agent, did not conduct a double‐blind, randomized, placebo‐controlled trial, and/or did not include people with AD. This left 62 full‐text articles for assessment by MR, EHA and SC independently. These articles reported on apathy as a primary outcome measure, or used a scale such as the NPI to evaluate apathy as a secondary outcome measure. We contacted authors when data were not sufficiently reported for extraction for this review. We received further information from Ruths 2008 and Tariot 2011.
Forty‐one studies which investigated apathy as a secondary outcome measure did not publish or provide upon request sufficient data on apathy; we therefore excluded them from this review. Of the 21 studies included in this meta‐analysis, four investigated apathy as a primary outcome (Objective 1), and 17 studies investigated apathy as a secondary outcome (Objective 2).
See Figure 1 for the study flow diagram.
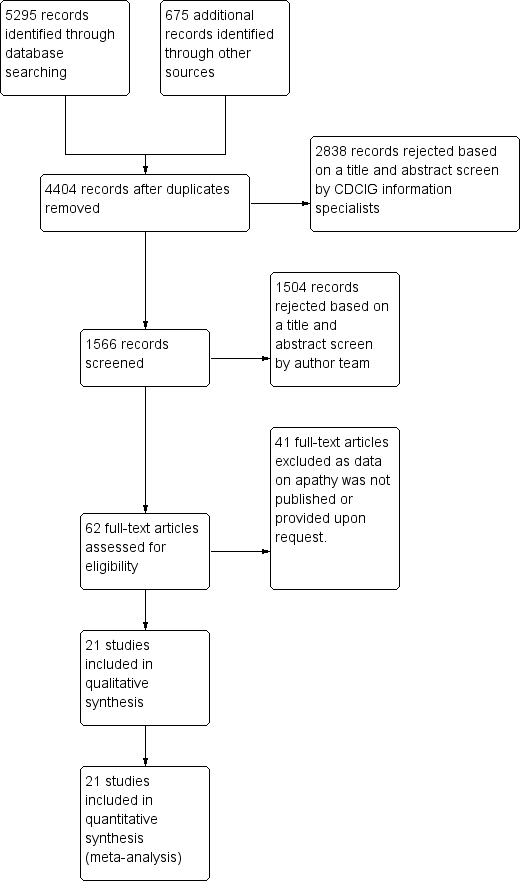
2Study flow diagram.
Included studies
The characteristics of the 21 included studies in this review are summarized in the Characteristics of included studies table.
Twenty‐one studies met our inclusion criteria for this meta‐analysis. We provide further information on study and participant characteristics in Table 1. All of the trials included in this meta‐analysis were randomized, double‐blind and placebo‐controlled. All but three studies (Sival 2002; Frakey 2012; Padala 2017) were multicenter trials. All studies included people with possible or probable AD according to standardized criteria (NINCDS‐ADRDA, DSM‐IV‐TR, or ICD‐10).
| STUDY DURATION | N OF PARTICIPANTS | Diagnosis | MEAN AGE (YRS) | MEAN MMSE (SD) | MEAN BL NPI‐APATHY (SD) score | COUNTRY | NUMBER OF SITES | TREATMENT GROUPS | |
| METHYLPHENIDATE | |||||||||
| 2 weeks Cross‐over design: 2 treatment phases of 2 weeks with a 1‐week washout between phases | 13 total | Possible or probable AD (NINCDS‐ADRDA), and apathy (NPI‐apathy subscale ≥ 1) | 77.9 (7.8) | 19.9 (4.7) | 5.9 (3) | Canada | 3 | Group 1: Methylphenidate (10 mg twice a day) | |
| 6 weeks | 60 participants | Possible or probable AD (NINCDS‐ADRDA), and clinically significant apathy for at least 4 weeks | 76 (8) | 20 (5) | Group 1: 7 (2) | USA, Canada | 3 | Group 1: Methylphenidate (target: 20 mg daily) | |
| 12 weeks | 60 participants | Dementia of the AD type (DSM‐IV‐TR), and presence of apathy (AES > 40) | 76.6 (7.9) | 23.8 (2.5) | Not reported | USA | 1 | Group 1: Methylphenidate (target: 20 mg daily) | |
| MODAFINIL | |||||||||
| 8 weeks | Group 1: 11 | Possible or probable AD (NINCDS‐ADRDA criteria) and clinically significant apathy (FrSBe Tscore ≥ 65) | Group 1: 75.3 (8.3) | Not disclosed | Not reported | USA | 1 | Group 1: Modafinil (200 mg daily) | |
| CHOLINESTERASE INHIBITORS | |||||||||
| 24 weeks | Group 1: 103 Group 2: 105 | Possible or probable AD with cerebrovascular disease (but not vascular dementia) (NINCDS‐ADRDA criteria) | Group 1: 85.4 | Group 1: 14.4 (5.4) | Not reported | USA | 27 | Group 1: Donepezil ‐ 5 mg/day for 28 days. 10 mg/day after 28 days based on tolerability. | |
| 24 weeks | Group 1: 144 | AD (DSM‐IV and NINCDS‐ADRDA criteria) | 73.6 | Group 1: 11.7 (0.35) | Group 1: | Canada, Australia, France | 32 | Group 1: Donepezil ‐ 5 mg/day for 28 days. 10 mg/day after 28 days based on tolerability. | |
| Range: 3 ‐ 6 months (12 ‐ 24 weeks) | Group 1: 1347 | Probable AD (NINCDS‐ADRDA criteria) | 76 | 18 | Group 1: | USA, Canada, Great Britain, South Africa, Australia, and New Zealand | Multicenter, but number not disclosed | Group 1: Galantamine | |
| 26 weeks | Group 1: 273 | Probable AD (NINCDS‐ADRDA criteria) | Not reported | Not reported | Not reported | USA | 25 | Group 1: Metrifonate (2 weeks – 2.0 mg/kg, followed by 0.65 mg/kg) | |
| 26 weeks | Group 1: 273 | Probable AD (NINCDS‐ADRDA criteria) | Group 1: 73.5 (8.1) | Group 1: 18.8 (5) | Not reported | USA | 24 | Group 1: Metrifonate (2 weeks – 2.0 mg/kg, followed by 0.65 mg/kg) | |
| 26 weeks | Group 1: 177 | Probable AD (NINCDS‐ADRDA criteria) mild‐moderate AD | Group 1: 74.6 (8.3) | Group 1: 18.7 (4.76) | Not reported | USA (additional sites are not disclosed) | Multicenter, but number not disclosed | Group 1: | |
| CHOLINESTERASE DISCONTINUATION | |||||||||
| 8 weeks | Group 1: 21 | Probable AD (NINCDS‐ADRDA criteria) | 89.3 | Group 1: 8.1(5.2) | Group 1: | Canada | 2 | Group 1: Donepezil, | |
| ATYPICAL ANTIPSYCHOTICS | |||||||||
| 10 weeks | Group 1: 132 | Possible or probable AD (NINCDS‐ADRDA criteria and DSM‐IV‐TR), and clinically significant psychotic symptoms | 76.6 (10.4) | 13.7 (5.1) | Group 1: 3.2 (3.9) | Europe, Australia, Israel, Lebanon, and South Africa | 61 | Group 1: 7.5 mg OLZ | |
| Up to 36 weeks (12 weeks of treatment) data available | Group 1: 100 | Dementia of the AD type (DSM‐IV) or probable AD (NINCDS‐ADRDA) and daily delusions, hallucinations, agitation, or aggression over 4 weeks prior to study entry | 77.9 (7.5) | Group 1: 15 (5.4) | Not reported | USA | 42 | Group 1: OLZ | |
| ANTIPSYCHOTIC DISCONTUATION | |||||||||
| 4 weeks | Group 1: 28 | Dementia diagnosis according to ICD‐10 | 83.4 (6.9) | Not provided | Group 1: | Norway | 9 | Group 1: Antipsychotics (haloperidol, risperidone, or olanzapine) | |
| ANTIDEPRESSANTS | |||||||||
| 4 weeks: Cross‐over design: 2 treatment phases of 4 weeks with a 1‐week washout between phases | 22 total | Primary degenerative dementia (DSM‐IV) and probable AD (NINCDS‐ADRDA), and significant behavioral problems (NPI ≥ 8) | 82 (6) | 4.1 (4.7) | Group 1: | Canada | 3 | Group 1: Sertraline (100 mg daily) | |
| 9 weeks | Group 1: 94 | Probable AD (NINCDS‐ADRDA), and significant behavioral problems (NPI ≥ 8), and clinically significant agitation on the NPI > 3 | Group 1: 78 (9) | Group 1: 17 (6.2) | Group 1: | USA | 6 | Group 1: Citalopram (30 mg daily) | |
| MIBAMPATOR | |||||||||
| 12 weeks | Group 1: 63 | Probable AD (NINCDS‐ADRDA) (DSM‐IV‐TR), and clinically significant agitation/aggression | Group 1: 77.2 (8.2) | Group 1: 16.0 (6.1) Group 2: 18 (5.3) | Not reported | USA | Multicenter, but number not disclosed | Group 1: Mibampator (target dose: 3 mg daily) | |
| VALPROATE | |||||||||
| 6 weeks: Cross‐over design: 2 treatment phases of 6 weeks with a 2‐week washout between phases | Group 1: 14 | Probable AD (NINCDS‐ADRDA), primary degenerative dementia (DSM‐IV) | 85.6 (4.5) | 4.5 (4.6) | Group 1: 2.4 (3.8) | Canada | 2 | Group 1: Valproate (mean dose: 1134.6 (400.1) mg daily) | |
| 3 weeks: Cross‐over design: 2 treatment phases of 3 weeks with a 1‐week washout between phases | Group 1: 42 | Senile dementia (NINCDS‐ADRDA)(DSM‐IV) | 80.4 (6.8) | 11.4 (5) | Not reported | Netherlands | 1 | Group 1: Valproate (2 x 240 mg) | |
| 24 months (+ 2‐month single‐blind placebo phase) | Group 1: 153 | Possible or probable AD (NINCDS‐ADRDA) | Group 1: 74.9 | Group 1: 16.9 (3.0) | Group 1: | USA | 46 | Group 1: Valproate (flexible‐dose) (mean modal dose: 250 mg daily) | |
| SEMAGACESTAT | |||||||||
| 76 weeks | Group 1: 463 | Mild‐moderate AD (NINCDS‐ADRDA) | Group 1: 72.7 (7.9) | Group 1: 20.9 (3.5) | Not reported | USA | 91 | Group 1: LY100 | |
AD: Alzheimer's disease, BL: baseline, DSM: Diagnostic and Statistical Manual of Mental Disoders, FrSBe: Frontal Systems Behavior Scale, ICD: International Classification of Diseases, LY: LY450319 (Eli Lillyand Company study drug), NINCDS‐ADRDA: National Institute of Neurological and Communicative disorders and the Alzheimer's Disease and Related Disorders Association, NPI: Neuropsychiatric Inventory, OLZ: olanzapine, QUE: quetiapine, RIS: risperidone, SD: standard deviation.
Objective 1:
Four studies investigated the effect of a pharmacological treatment on apathy as a primary outcome measure. The drugs studied were methylphenidate and modafinil, both compared to placebo. We treat modafinil and methylphenidate separately in this review and meta‐analysis. Although both are CNS stimulants, their mechanisms of action differ. Modafinil activates glutamatergic circuits while inhibiting GABA neurotransmission (Gerrard 2007). Among other actions, methylphenidate blocks dopamine uptake in central adrenergic neurons by blocking dopaminergic transporter and carrier proteins (Volkow 2002).
Methylphenidate
Three placebo‐controlled studies have investigated the efficacy of methylphenidate for the treatment of apathy in people with AD (Herrmann 2008; Rosenberg 2013; Padala 2017). These studies had similar eligibility criteria, with participants having mild‐to‐moderate AD and clinically significant apathy at baseline. In all three studies, the daily target dose of methylphenidate was 20 mg.
Herrmann 2008 conducted a cross‐over study with two two‐week treatment phases and a one‐week placebo washout between treatment phases. The authors reported no treatment order or carry‐over effects. We extracted paired data from this study. We did not consider the cross‐over design to be a source of bias.
Rosenberg 2013 and Padala 2017 both used a parallel‐group design and investigated the efficacy and safety of methylphenidate in the treatment of apathy over six and 12 weeks respectively.
Modafinil
Frakey 2012 also investigated the effect of modafinil on apathy in people with mild‐to‐moderate AD and clinically significant apathy at baseline (FrSBe apathy Tscore ≥ 65). As Frakey 2012 provided the baseline and final standard deviation (SD) values, we imputed the change SD using methodology provided in the Cochrane Handbook (Section 16.1.3.2).
Objective 2:
Seventeen studies reported the effect of a pharmacotherapy on apathy as a secondary outcome measure. The drugs studied were cholinesterase inhibitors (ChEIs), atypical antipsychotics, antidepressants, mibampator, valproate and semagacestat, versus placebo. Two placebo‐controlled discontinuation studies with ChEIs and antipsychotics also investigated apathy as a secondary outcome measure. Clinically significant apathy was not an inclusion criterion in any of the studies.
Cholinesterase inhibitors
Six studies investigating ChEIs met the inclusion criteria for this review. Two studies (Tariot 2001; MSAD trial) included participants with moderate‐to‐severe AD. Herrmann 2005; Kaufer 1998; Morris 1998; and Raskind 1999 included participants with mild‐to‐moderate AD. Although none of the studies actively recruited participants with clinically significant apathy (considered as an NPI apathy subscore ≥ 3), baseline apathy in the MSAD trial was clinically significant in both treatment groups. In the remaining studies, neither treatment group had clinically significant apathy at baseline.
Tariot 2001, the MSAD trial and Herrmann 2005 included currently approved ChEIs for the treatment of AD (donepezil, galantamine and rivastigmine).
Tariot 2001 and the MSAD trial investigated the efficacy and safety of donepezil (target dose: 5 ‐ 10 mg/daily) over 24 weeks. Both papers reported change scores as least square mean (LSM) change. We considered this to be a potential source of selective reporting bias, as covariates were included in a linear regression which computed adjusted mean change values. We computed the SD values from the provided standard error (SE) values for LSM change using methods provided in the Cochrane Handbook (Section 7.7.3.2).
Herrmann 2005 reported the effect of galantamine on neuropsychiatric symptoms (NPS) in a post hoc analysis of pooled data from three large trials (Tariot 2000; Rockwood 2001; data file from Janssen‐Ortho) which had study durations of three, five and six months, respectively. We included data from this post hoc analysis because each trial met inclusion criteria for this meta‐analysis, and because we were unable to obtain sufficient data from the primary papers. Herrmann 2005 conducted an ITT analysis on the pooled data obtained from the last observation on each participant.
Kaufer 1998, Morris 1998, and Raskind 1999 all investigated the efficacy and safety of metrifonate in AD. Metrifonate is an irreversible organophosphate acetylcholinesterase inhibitor which was not approved for the symptomatic management of AD. All three papers reported LSM change scores which used covariates to create an adjusted mean change score. Again, we considered this to be a potential source of selective reporting bias. We were able to compute SD change values from Raskind 1999 using reported SE change values. However, as neither Kaufer 1998 nor Morris 1998 reported SE or SD change values, we used SD values computed from Raskind 1999 for both these studies, as all studies had participants with similar AD severity, and the same study duration and dosing regimen.
ChEI discontinuation
Herrmann 2016 investigated the efficacy and safety of ChEI discontinuation in people with moderate to severe AD. Continuing treatment with a ChEI was compared to ChEI discontinuation (placebo substitution), and so we included the results of this study in the meta‐analysis. However, this evidence is indirect in terms of our review questions, as all participants were receiving long‐term ChEI treatment (more than a year) prior to study enrollment, and it is unclear how this may influence our findings. Although Herrmann 2016 did not actively recruit participants with clinically significant apathy, those who were randomized to continue ChEI use had clinically significant apathy (NPI‐apathy subscale score ≥ 3) compared to placebo. However, the difference between groups was not statistically significant.
Atypical antipsychotics
We identified 16 RCTs that evaluate the efficacy of atypical antipsychotics for aggression and psychosis in people with AD (Ballard 2006). However, only two of these studies met our inclusion criteria and reported sufficient data on apathy, or provided data upon request, for this meta‐analysis (De Deyn 2004; Sultzer 2008).
De Deyn 2004 investigated the efficacy of olanzapine versus placebo in treating NPS over 10 weeks. As participants in this study were randomized into one of five groups (1, 2.5, 5 or 7.5 mg of olanzapine, or placebo), we have combined results from those randomized to olanzapine to prevent a unit‐of‐analysis error due to multiple comparisons (Cochrane Handbook section 16.5.4). The method used for combining groups was provided in the Cochrane Handbook (Section 7.7.3.8). As well as meeting standardized criteria for AD, all participants also had clinically significant psychotic symptoms.
Sultzer 2008 investigated the efficacy of atypical antipsychotics (olanzapine, quetiapine and risperidone) versus placebo in treating NPS for up to 36 weeks (phase 1 of the study). In phase 2 of the study, participants could be randomized to a different medication at the clinician’s discretion. Mean change scores were reported over the first 12 weeks of phase 1 of the study, and so we used these results in the meta‐analysis. Participants were randomized to one of four groups (olanzapine, quetiapine, risperidone or placebo). In order to prevent a unit‐of‐analysis error due to multiple comparisons, we combined results from participants receiving all three atypical antipsychotics. In addition to meeting standardized criteria for AD, all participants also had clinically significant psychotic symptoms or agitation/aggression over the four weeks prior to study entry.
Neither study actively recruited people with clinically significant apathy. However, in De Deyn 2004 each treatment group had clinically significant apathy at baseline. As Sultzer 2008 did not provide baseline scores on apathy, we were unable to determine whether participants enrolled in this study had clinically significant apathy.
Antipsychotic discontinuation
We identified nine clinical trials which investigated the efficacy and safety of antipsychotic discontinuation in people with AD, but we were able to include only one study which met our inclusion criteria and provided data on apathy upon request (Ruths 2008).
Ruths 2008 investigated the efficacy of antipsychotic discontinuation in people with AD who had been receiving haloperidol, risperidone or olanzapine (range: 3 to 62 months). Neither treatment group had clinically significant apathy at baseline.
Antidepressants
We identified 12 trials comparing antidepressants with placebo in people with AD. However, only two studies met our inclusion criteria and yielded extractable data (CitAD trial) or provided data upon request (Lanctôt 2002).
Lanctôt 2002 investigated the effect of sertraline on NPS in people with severe AD and clinically significant NPS (NPI ≥ 8). This cross‐over study consisted of two four‐week treatment phases separated by a one‐week placebo washout. Neither treatment group had clinically significant apathy at baseline. As the authors reported that treatment order did not have an effect on treatment response, we did not consider the cross‐over design to be a source of bias. Lanctôt 2002 published results in treatment responders only, but data on all participants were provided upon request.
CitAD trial investigated the effect of citalopram on agitation in people with AD and clinically significant agitation over nine weeks. As CitAD trial provided median and interquartile range (IQR) values for NPI‐apathy subscores and NPI‐total scores, we used methods described in the Cochrane Handbook (Section 7.7.3.5) to validate use of the median to estimate mean values, and to convert IQR to SD values. For mini‐mental state examination (MMSE) and Alzheimer's Disease Cooperative Study Activities of Daily Living (ADCS‐ADL) scores, SD values were provided at baseline, while SE values were provided at study endpoint. We calculated the SD from SE values using methods provided in the Cochrane Handbook (Section 7.7.3.2), and derived change SD values also using methods provided in the Cochrane Handbook (Section 16.1.3.2).
The presence of clinically significant apathy was not an inclusion criterion for either study. However, participants in CitAD trial had clinically significant apathy (NPI‐apathy subscore ≥ 3) at baseline.
Mibampator
Trzepacz 2013 investigated the efficacy of mibampator (LY451396) on agitation/aggression in people with AD over 12 weeks. Trzepacz 2013 reported the LSM change score and SD for overall behavior using the FrSBe total Tscore. Apathy was assessed using the FrSBe apathy T‐subscore. We extrapolated the LSM change score for apathy from a graph. However, as SD change scores for apathy were not provided in the paper, we inferred these values from the FrSBe total change Tscore results. As LSM change scores use covariates to create an adjusted mean change score, we considered this as a potential source of selective reporting bias. Since Trzepacz 2013 did not provide baseline apathy scores, we were unable to determine whether study participants had clinically significant apathy.
Valproate
We identified three studies investigating valproate which met the inclusion criteria for this meta‐analysis (Sival 2002; Herrmann 2007; Tariot 2011). These studies had similar eligibility criteria, with participants having moderate AD and clinically significant agitation/aggression. Tariot 2011 also included participants with clinically significant psychosis. In all three studies, the primary outcome measure was the efficacy of valproate on agitation/aggression (and/or psychosis in Tariot 2011).
Herrmann 2007 was a cross‐over study with two six‐week treatment phases separated by a two‐week placebo washout period. Data from this study were provided upon request. Though Herrmann 2007 did not actively recruit people with clinically significant apathy, those randomized to receive placebo had clinically significant apathy (NPI‐apathy subscale score ≥ 3) compared to those receiving valproate. However, the difference between groups was not statistically significant.
Sival 2002 was also a cross‐over study with two three‐week treatment phases separated by a one‐week placebo washout period. We were unable to confirm whether participants enrolled in this study had clinically significant apathy at baseline.
Although treatment order and carry‐over effects were investigated by Sival 2002 and Herrmann 2007, both papers reported the absence of these effects. As such, we did not consider the cross‐over design to be a source of bias. We extracted paired data from both studies.
Tariot 2011 investigated the efficacy of valproate as a prophylactic treatment for emerging agitation or psychosis in people with moderate AD over 24 months, followed by a two‐month period of single‐blind placebo treatment. Neither treatment group had clinically significant apathy. Data from this study were provided by the Alzheimer's Disease Cooperative Study (ADCS) group upon request.
Semagecestat
Rosenberg 2016 investigated the efficacy of semagecestat for the treatment of AD over 76 weeks. Participants in this study were randomized to one of three groups (100 or 140 mg of semagacestat, or placebo). We combined results from those randomized to both semagacestat groups using the method provided in the Cochrane Handbook (Section 7.7.3.8) in order to prevent a unit‐of‐analysis error due to multiple comparisons (Cochrane Handbook Section 16.5.4). We used methods described in the Cochrane Handbook (Section 7.7.3.2) to calculate SD values for the MMSE and ADCS‐ADL scores from the 95% confidence intervals reported by the authors.
We were unable to confirm whether participants enrolled in this study had clinically significant apathy, as neither Doody 2013 nor Rosenberg 2016, who published the original findings of the study, provided baseline apathy scores.
Interventions
We present relevant details about treatment groups and doses of medication used in each study in Table 1.
Outcomes
All trials included in this meta‐analysis examined apathy as a primary or secondary outcome measure. We summarize the details of outcomes measured and reported in each trial in Table 2. A number of scales were used to measure each outcome.
| Study | Apathy | AE reported | NPS | Cognition | Function | Global Change | Dropouts due to AEs reported |
| METHYLPHENIDATE | |||||||
| AES‐Informant | Yes | NPI‐total | MMSE | N/A | CGI‐C | Yes | |
| AES‐Informant | Yes | NPI‐total (not reported) | MMSE | N/A | ADCS‐CGIC | Yes | |
| AES‐Clinician | Yes | N/A | MMSE | ADL | N/A | Yes | |
| MODAFINIL | |||||||
| FrSBe‐apathy subscale | Yes | N/A | N/A | ADLQ | N/A | Yes | |
| CHOLINESTERASE INHIBITORS | |||||||
| NPI‐apathy subscale | These outcomes were not investigated for this drug comparison | ||||||
| NPI‐apathy subscale | |||||||
| NPI‐apathy subscale | |||||||
| NPI‐apathy subscale | |||||||
| NPI‐apathy subscale | |||||||
| NPI‐apathy subscale | |||||||
| CHOLINESTERASE DISCONTINUATION | |||||||
| NPI‐apathy subscale | These outcomes were not investigated for this drug comparison. | ||||||
| ATYPICAL ANTIPSYCHOTICS | |||||||
| NPI‐apathy subscale | These outcomes were not investigated for this drug comparison | ||||||
| BPRS‐withdrawn depression factor score | |||||||
| ANTIPSYCHOTIC DISCONTINUATION | |||||||
| NPI‐apathy subscale | These outcomes were not investigated for this drug comparison | ||||||
| ANTIDEPRESSANTS | |||||||
| NPI‐apathy subscale | These outcomes were not investigated for this drug comparison | ||||||
| NPI‐apathy subscale | |||||||
| MIBAMPATOR | |||||||
| FrSBe‐apathy T score | These outcomes were not investigated for this drug comparison | ||||||
| VALPROATE | |||||||
| NPI‐apathy subscale | These outcomes were not investigated for this drug comparison | ||||||
| GIP‐apathetic behavior subscore | These outcomes were not investigated for this drug comparison | ||||||
| NPI‐apathy subscale | These outcomes were not investigated for this drug comparison | ||||||
| SEMAGACESTAT | |||||||
| NPI‐apathy | These outcomes were not investigated for this drug comparison | ||||||
ADCS‐CGIC: Alzheimer's Diserase Cooperative Study ‐ Clinical Global Impression of Change, ADL: Activities of Daily Living scale, ADLQ: Lawton and Brody Fucntional Assessment, AES: Apathy Evaluation Scale, CGI‐C: Clinical Global Impression of Change, FrSBe: Frontal Systems Behavior Scale, GIP: The Behavior Observation Scale for Intramural Psychogeriatric Patients, IADL: Instrumental Activities of Daily Living Scale, MMSE: Mini‐Mental State Examination, NPI: Neuropsychiatric Inventory.
Primary efficacy and safety outcomes:
1) Apathy
NPI‐apathy subscale: Apathy is a subscale item on the NPI scale. The apathy score is calculated as the product of frequency and severity of apathy symptoms, with a range of 0 to 12. Higher scores indicate more frequent and/or severe symptoms (Cummings 1994).
AES‐Informant (AES‐I) and AES‐Clinician (AES‐C): This is an 18‐item informant (AES‐I) or clinician (AES‐C)‐rated scale which measures apathy severity as defined by simultaneous deficits in the overt behavioral, cognitive and emotional constructs of goal‐directed behavior. The higher the score, the greater the apathy severity (Marin 1991).
BPRS Withdrawn depression factor score: The Withdrawn Depression component of the BPRS consists of emotional withdrawal, depressed mood, motor retardation, and blunted affect (Overall 1962). This component of the BPRS has been shown to be fairly associated with scores on the NPI‐apathy subscale (Politis 2004).
FrSBE apathy: Apathy is a subscale item on the FrSBE, which measures three frontal systems behavioral syndromes: apathy, disinhibition, and executive dysfunction. The higher the score, the greater the severity of apathy (Grace 2011).
Behavior Rating Scale for Psychogeratric Inpatients (GIP): Apathy is one of four components of the 82‐item GIP scale. Higher scores indicate greater severity of apathy (Diesfeldt 2013).
2) Adverse events
As a number of drug classes were included in this meta‐analysis, we chose to use the number of participants who experienced one or more adverse events (AEs) as an indication of safety. This outcome was reported by all studies which reported safety outcomes.
Secondary outcomes:
3) NPS
NPI: The NPI is a widely‐used assessment of 12 behavioral symptoms in dementia, including: delusions, hallucinations, agitation/aggression, apathy, depression, euphoria, aberrant motor behavior, irritability, disinhibition, anxiety, sleeping and eating. The frequency and severity of these symptoms are judged on a four‐point and three‐point scale, respectively (Cummings 1994).
4) Cognition
MMSE: This scale measures global cognition, and assesses orientation to time and place, immediate recall, short‐term verbal memory, calculation, language, and construct ability. The MMSE is scored out of 30, with lower scores indicating greater cognitive impairment (Folstein 1975).
5) Function
IADL scale/ADL‐Q: Although termed differently by Frakey 2012 and Padala 2017, the scale used was the same between both studies. This questionnaire measures functional abilities in elderly people necessary for independent living. Scores range from 0 to 28, with lower scores indicating greater functional impairment (Lawton 1969).
ADL scale: This questionnaire assesses independence in performing basic tasks such as bathing, dressing, and feeding. Scores range from 0 to 24, with lower scores indicating greater functional impairment (Katz 1963).
6) Global change
CGIC and ADCS‐CGIC: This scale quantifies disease severity and clinical change (worsening, no change, or improvement), based on information about the person’s medical history, cognition, behavior, and function (Schneider 1997).
7) Dropouts due to AEs
In clinical trials with AD participants, attrition is a common problem attributed to loss to follow‐up, lack of efficacy, violation of study protocol, and the presence of AEs. As we are concerned with tolerability, we report on the number of dropouts due to an AE.
Excluded studies
Double‐blind, placebo‐controlled RCTs which we exclude from this meta‐analysis are presented in the Characteristics of excluded studies. We did not exclude any RCTs which investigated and reported on the efficacy of a pharmacological intervention on apathy as a primary or secondary outcome measure in people with mild, moderate, or severe AD.
Risk of bias in included studies
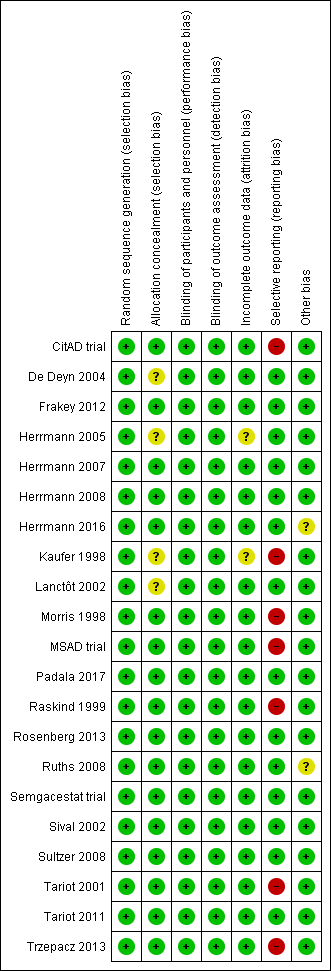
All studies included in this meta‐analysis were described as double‐blind, randomized, placebo‐controlled trials. We present details concerning the risks of bias of individual studies in the Characteristics of included studies tables; Figure 2; and Figure 3.
Risk of bias summary: review authors' judgements about each risk of bias item for each included study.
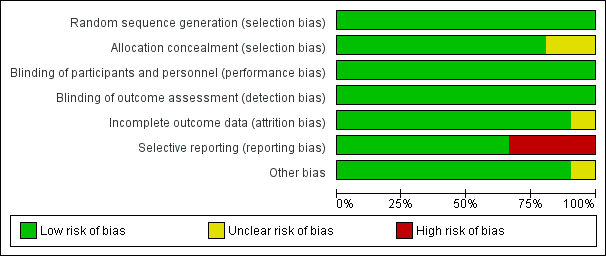
Figure 3 CaptionRisk of bias graph: review authors' judgements about each risk of bias item presented as percentages across all included studies.
Allocation
Most trials provided an adequate description of treatment allocation, but for some trials we were unable to obtain or locate this information. In these cases, we indicated unclear bias. These trials included the following: Kaufer 1998; Lanctôt 2002; De Deyn 2004; Herrmann 2005; Padala 2017.
Incomplete outcome data
All trials except Kaufer 1998 and Herrmann 2005 adequately described attrition rates in text, or included a figure detailing participant flow, or both. As mentioned previously, Herrmann 2005 investigated the efficacy of galantamine in a pooled post hoc analysis of three placebo‐controlled RCTs. Two of the studies included participant flow diagrams, and described study discontinuations in detail (Tariot 2000; Rockwood 2001). In Rockwood 2001, discontinuations due to AEs were more common in participants who were randomized to galantamine than placebo. However, the authors used ITT analyses, and last observation carried forward (LOCF) analysis as appropriate. Tariot 2000 reported that discontinuations due to AEs were similar between participants randomized to galantamine compared to placebo. We considered that these two studies had a low risk of attrition bias. However, as Herrmann 2005 was not able to confirm whether this also applied to data obtained from Janssen‐Ortho, this was a potential source of bias.
In Kaufer 1998, authors mention that reported data included LOCF analysis in an ITT population. However, as no further details on attrition were provided, we included this as a potential source of bias.
Selective reporting
As mentioned previously in the Description of studies, we had concerns with selective reporting, specifically in studies comparing ChEI, citalopram and semagacestat versus placebo. In Kaufer 1998, Morris 1998, Raskind 1999, and the MSAD trial, change scores were reported as LSM values. As LSM values use covariates to generate an adjusted mean change score, this is a possible source of selective reporting bias.
Raskind 1999 and the MSAD trial both reported SE values of LSM change scores. We were able to compute SD values from the SE values provided. However, as Kaufer 1998 and Morris 1998 did not report SE or SD values, we used the SD values we had computed from Raskind 1999, as there were similarities across all three studies in AD severity of participants, study duration, and dosing regimen. Again, we considered this to be a possible source of selective reporting bias.
CitAD trial reported median values for continuous outcome measures. This is a source of selective reporting bias, as CitAD trial also reported that the data for these measures were not normally distributed, and may not be an accurate representation of the raw mean values.
Rosenberg 2016 reported on our primary efficacy outcome of apathy, and NPS.
Effects of interventions
See: Summary of findings for the main comparison Methylphenidate compared to placebo for apathy in Alzheimer's disease; Summary of findings 2 Modafinil compared to placebo for apathy in Alzheimer's disease
Objective 1:
Comparison of methylphenidate with placebo
See: summary of findings Table for the main comparison.
Primary efficacy and safety outcomes:
1. Apathy
Three included studies investigated and reported on the efficacy of methylphenidate for the treatment of apathy as a primary outcome measure (Herrmann 2008; Rosenberg 2013; Padala 2017). All studies used the AES to assess apathy. Herrmann 2008 and Rosenberg 2013 also used the NPI‐apathy subscale. We conducted separate analyses using results from the AES scale, and results from the NPI‐apathy subscale.
Apathy assessed by the AES:
Based on findings obtained from the AES, we found that methylphenidate may improve apathy compared to placebo (mean difference (MD) ‐4.99, 95% confidence interval (CI) ‐9.55 to ‐0.43, P = 0.03, n = 145, 3 studies, I2 = 83%). However, there was uncertainty associated with this result, which we considered to be of low quality, because of serious concerns with inconsistency due to substantial heterogeneity, and imprecision due to a wide 95% confidence interval.
We conducted an exploratory subgroup analysis in studies with a trial duration of less than 12 weeks, and studies with a trial duration of 12 weeks or more. We had not prespecified this trial duration cut‐off, but chose this duration based on visual inspection of the forest plot which suggested that Padala 2017 had a greater change in apathy scores than Herrmann 2008 and Rosenberg 2013, despite having similar participant characteristics and dosing (Table 1). In studies lasting less than 12 weeks, methylphenidate may improve apathy compared to placebo (MD ‐2.62, 95% CI ‐4.80 to ‐0.44, P = 0.02, n = 85, 2 studies, I2 = 0%). In Padala 2017, the only study with a trial duration longer than 12 weeks, methylphenidate may also improve apathy compared to placebo (MD ‐9.90, 95% CI ‐13.50 to ‐6.30, P < 0.001, n = 60, 1 study). Within each subgroup, there was uncertainty associated with the results, which we considered to be of low quality because of serious concerns with indirectness due to nongeneralizability of results, and to imprecision.
We noted significant differences between subgroups (Chi2(1) = 11.49, P < 0.001, I2 = 91.3%). Trial duration is one possible explanation for the difference identified between subgroups. See Analysis 1.1; Figure 4.
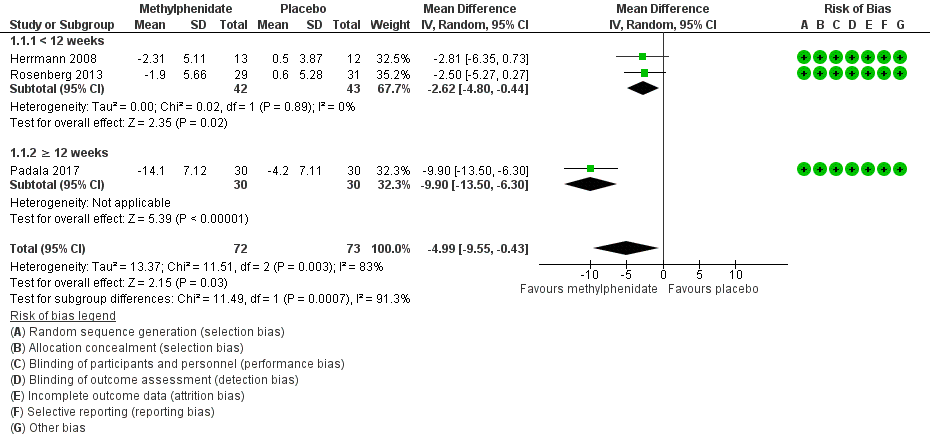
Forest plot of comparison: 7 Methylphenidate, outcome: 7.1 Apathy (AES only).
We could not conduct a subgroup analysis by disease severity, as all three studies enrolled participants with similar AD severity.
Apathy assessed by the NPI‐apathy subscale:
Based on findings obtained from the NPI‐apathy subscale, we found that methylphenidate may have no effect on apathy (MD ‐0.08, 95% CI ‐3.85 to 3.69, P = 0.97, n = 85, 2 studies I2 = 84%). There was uncertainty associated with this result, which we considered to be of low quality because of serious concerns with inconsistency due to substantial heterogeneity, and to imprecision due to a wide 95% confidence interval which may have contributed to an overall null effect. See Analysis 1.2.
As we included only two studies in this meta‐analysis, we did not conduct additional subgroup analyses.
2. Adverse events
Although Rosenberg 2013 reported that there were trends towards increased anxiety and weight loss (> 2%) in those allocated to methylphenidate, there was little or no difference between treatment groups in the risk of developing an AE (RR 1.28, 95% CI 0.67 to 2.42, P = 0.45, n = 145, 3 studies, I2 = 62%). There was uncertainty associated with this result, which we considered to be of low quality due to serious concerns with inconsistency and imprecision.
An exploratory subgroup analysis demonstrated that there was probably little or no difference between treatment groups in the risk of developing an AE in trials with a duration of less than 12 weeks (RR 1.28, 95% CI 0.44 to 3.72, P = 0.65, n = 85, 2 studies, I2 = 38%), or in trials of 12 weeks or longer (RR 1.44, 95% CI 0.73 to 2.86, P = 0.29, n = 60, 1 study). Within each subgroup, there was uncertainty associated with the results, which we considered to be of low quality because of serious concerns with indirectness due to nongeneralizability of results, and to imprecision.
There were no significant differences noted between subgroups (Chi2(1) = 0.03, P = 0.85, I2 = 0%). See Analysis 1.3; Figure 5.
We did not conduct a subgroup analysis based on disease severity, as all three studies enrolled participants with similar AD severity.
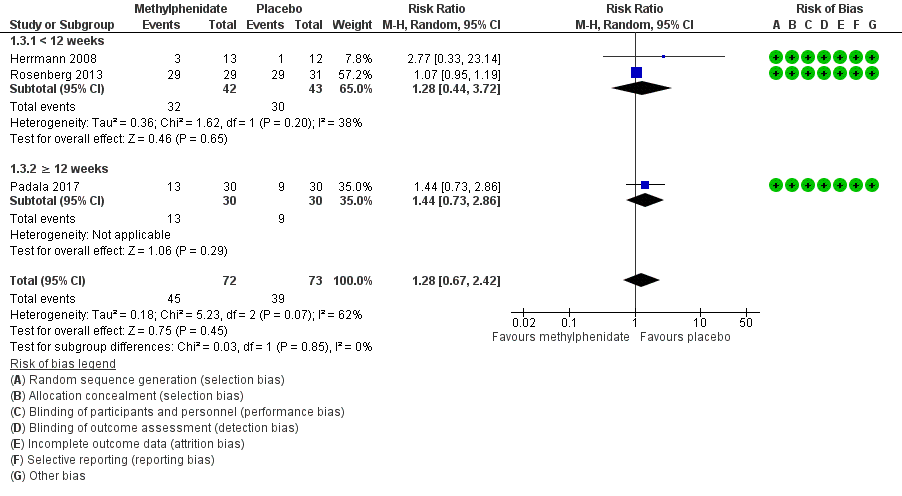
Forest plot of comparison: 7 Methylphenidate, outcome: 7.3 Adverse Events.
Secondary outcomes:
3. Neuropsychiatric symptoms
Only one study investigated and reported on the change in NPS over study duration (Herrmann 2008). There may be little or no difference between treatment groups in the change in NPI total score over two weeks (MD 0.16, 95% CI ‐7.89 to 8.21, P = 0.97, n = 25, 1 study). There was uncertainty associated with this result, which we considered to be of low quality because of serious concerns with imprecision, as there was a wide 95% confidence interval, which may have contributed to the overall null effect, in a single study with a small sample size. See Analysis 1.4.
4. Cognition
All studies assessed change in cognition using the MMSE. Compared to placebo, methylphenidate probably improves cognition slightly, although this difference may not be large enough to be of clinical importance (MD 1.98, 95% CI 1.06 to 2.91, P < 0.0001, n = 145, 3 studies, I2 = 37%). We considered this evidence to be of moderate quality, because of serious concerns with imprecision due to a wide 95% confidence interval.
An exploratory subgroup analysis in studies by trial duration demonstrated that there was probably little or no difference between treatment groups on change in cognition over time in trials with a duration of less than 12 weeks (MD 1.00, 95% CI ‐0.49 to 2.49, P = 0.19, n = 85, 2 studies, I2 = 0%). In Padala 2017, the only study with a trial duration longer than 12 weeks, methylphenidate probably improves cognition compared to placebo (MD 2.60, 95% CI 1.43 to 3.77, P < 0.001, n = 60, 1 study). We rated the evidence for both subgroup analyses as of moderate quality, because of serious concerns with imprecision due to a wide 95% confidence interval.
We found no significant differences between subgroups (Chi2(1) = 2.74, P = 0.10, I2= 63.5%).See Analysis 1.5.
We did not conduct a subgroup analysis based on disease severity, as all three studies enrolled participants with similar AD severity.
5. Functional performance
Only one study reported on the change in functional performance using the ADL and IADL (Padala 2017). There was no evidence of a difference between methylphenidate and placebo ADLs over 12 weeks: MD 0.50, 95% CI ‐0.39 to 1.39, P = 0.27, n = 60 patients, 1 study. See Analysis 1.6. However, compared to placebo, methylphenidate probably improves IADLs over 12 weeks: MD 2.30, 95% CI 0.74 to 3.86, P = 0.004, n = 60 patients, 1 study. There was some uncertainty associated with both findings, which we considered to be of moderate quality, as only one study with a small sample size was included in these comparisons. See Analysis 1.7.
6. Global disease severity
Two studies reported on global disease severity, measured with the CGI. This was expressed in both studies as the number of participants who experienced clinical deterioration over the course of the study (Herrmann 2008; Rosenberg 2013). There was probably little or no difference between treatment groups in the number who experienced clinical deterioration (RR 0.58, 95% CI 0.16 to 2.11, P = 0.40, n = 85, 2 studies I2 = 0%). We considered this evidence to be of moderate quality, because of serious concerns with imprecision due to a wide 95% confidence interval. See Analysis 1.8.
7. Dropouts due to AEs
There may be little or no difference between treatment groups in the number of dropouts due to an AE (RR 2.18, 95% CI 0.64 to 7.45, P = 0.21, n = 145, 3 studies, I2 = 0%). There was low certainty associated with this result, which we considered to be of low quality due to serious concerns about imprecision. See Analysis 1.9.
Comparison of modafinil with placebo
See: summary of findings Table 2. Only one very small study (n = 23 randomized, 1 participant excluded from analysis due to AE related dropout) investigated and reported on the efficacy of modafinil for the treatment of apathy as a primary outcome measure (Frakey 2012). In all of the following outcomes, there were no concerns with risk of bias, inconsistency or indirectness. However, we had very serious concerns with imprecision due to the small sample size and wide 95% confidence intervals. As such we rated the quality of evidence for all of the outcomes as low.
Primary efficacy and safety outcomes:
1. Apathy
Apathy was assessed using the FrSBE apathy subscale. Tscores are converted from raw scores which range from 14 to 70, and there is very limited information available on what constitutes a clinically important difference in score. There was no evidence of a difference between treatment groups in the change in apathy over eight weeks (MD 0.27, 95% CI ‐3.51 to 4.05, P = 0.89, n = 22, 1 study). See Analysis 2.1.
2. Adverse events
We did not conduct an analysis for this outcome, as there was only one adverse event reported in the modafinil treatment group and none reported in the placebo group.
Secondary outcomes:
3. Neuropsychiatric symptoms
This outcome was not reported by Frakey 2012.
4. Cognition
This outcome was not investigated by Frakey 2012.
5. Functional performance
There was no evidence of a difference between modafinil and placebo in change in functional status over eight weeks (MD ‐0.54, 95% CI ‐1.40 to 0.32, P = 0.22, n = 22, 1 study). See Analysis 2.2.
6. Global disease severity
This outcome was not investigated by Frakey 2012.
7. Dropouts due to AEs
There was one dropout from the modafinil treatment group due to an increase in motor tics, and no dropouts from the placebo arm. We did not conduct an analysis for this outcome, as only one individual in the study experienced an AE.
Objective 2:
Included studies of ChEIs, antipsychotics, mibampator and semagacestat were supported by pharmaceutical industry sponsors. Additionally, although a large number of studies with antipsychotics, antipsychotic discontinuation, and antidepressants in AD have been conducted, many of which collected data on NPS including apathy, only a few studies reported this or provided data upon request. We therefore downgraded the overall quality of the evidence due to serious concern about the effect of publication bias. Publication bias was not a concern with studies included in the ChEI comparison, as these trials included a large number of participants, and were less likely to remain unpublished or ignored. Furthermore, these trials may provide a more precise estimate of the treatment effect, whether positive or negative.
We also downgraded the overall quality of the evidence due to serious concerns with indirectness, as none of the studies contributing to Objective 2 comparisons actively recruited participants with clinically significant apathy.
The evidence provided in this section must therefore be considered of low quality at best.
Comparison of cholinesterase inhibitors (ChEIs) with placebo
We included six studies investigating ChEIs for cognition in people with AD, that also included apathy as a secondary outcome measure in this meta‐analysis. All six studies used the NPI‐apathy subscale to assess apathy.
ChEIs may slightly improve apathy compared to placebo (MD ‐0.40, 95% CI ‐0.80 to ‐0.00, P = 0.05, n = 3598, 6 studies, I2= 71%). We considered the available evidence to be of low quality. We downgraded the evidence due to serious concerns with indirectness, inconsistency and selective reporting of adjusted mean values, but upgraded one level due to the large sample size (Kaufer 1998; Morris 1998; Raskind 1999; Tariot 2001; MSAD trial; Herrmann 2005). However, the clinical importance of these findings is uncertain, as apathy was not a primary outcome measure of these studies.
We conducted subgroup analyses of studies using currently‐approved ChEIs (donepezil, galantamine or rivastigmine), all of which had a duration 24 weeks or less, and studies using metrifonate which all lasted more than 24 weeks. Currently‐approved ChEIs may have little or no effect on apathy compared to placebo (MD ‐0.21, 95% CI ‐0.85 to 0.43, P = 0.29, n = 2531, 3 studies, I2 = 80%). However, metrifonate may improve apathy compared to placebo (MD ‐0.63, 95% CI ‐0.98 to ‐0.29, P > 0.001, n = 1067, 3 studies, I2 = 0%). Again, we rated the quality of the evidence as low due to serious concerns with indirectness, and selective reporting of adjusted mean value. There were no significant differences between subgroups (Chi2(1) = 1.30, P = 0.25, I2 = 23.2%). See Analysis 3.1; Figure 6.
We also conducted subgroup analyses of studies in which participants had moderate or severe AD. In those with moderate AD, ChEIs may slightly improve apathy compared to placebo (MD ‐0.43, 95% CI ‐0.79 to ‐0.07, P = 0.02, n = 3100, 4 studies, I2 = 50%). In participants with severe AD, ChEIs may also slightly improve apathy compared to placebo (MD ‐0.36, 95% CI ‐1.82 to 1.10, P = 0.63, n = 498, 2 studies, I2 = 90%); however this finding was not statistically significant. As mentioned previously, we rated the quality of the evidence as low due to serious concerns with indirectness of the study population, and selective reporting of adjusted mean values. There was no significant difference between subgroups (Chi2(1) = 0.01, P = 0.93, I2 = 0%). See Analysis 3.2.
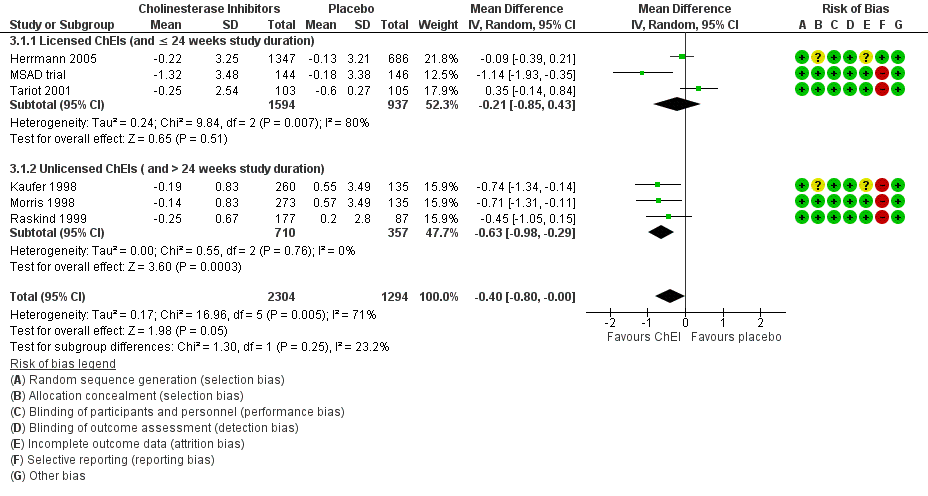
Forest plot of comparison: 3 Cholinesterase Inhibitors, outcome: 3.1 Change in apathy from baseline as measured by the NPI‐apathy subscore (subgroup analysis with licensed versus unlicensed ChEIs).
Comparison of ChEI with ChEI discontinuation (placebo)
Only one study investigating the discontinuation of ChEIs met the inclusion criteria for this meta‐analysis (Herrmann 2016). All participants in this trial were long‐term ChEI users (more than two years), and were considered eligible for this trial if they no longer demonstrated any clinical benefit from their ChEI.
Although not statistically significant, discontinuing ChEIs may slightly improve apathy compared to continued ChEI use, based on the NPI‐apathy subscale (MD 1.11, 95% ‐0.88 to 3.10, P = 0.28, n = 40, 1 study). There was some uncertainty associated with this result, which we considered to be of low quality because of serious concerns with imprecision due to the small sample size and wide 95% confidence interval, and indirectness of results.See Analysis 4.1.
Comparison of antipsychotics with placebo
All studies in this meta‐analysis that investigated antipsychotics were conducted in people with clinically significant agitation and aggression. We did not perform subgroup analyses by trial duration and disease severity, as only two studies met the inclusion criteria for this particular meta‐analysis.
De Deyn 2004 assessed apathy using the NPI‐apathy subscale, while Sultzer 2008 assessed apathy using the BPRS withdrawn depression factor score. Antipsychotic use may slightly worsen apathy compared to placebo (standardized mean difference (SMD 0.14, 95% CI ‐0.00 to 0.28, P = 0.05, n = 1070, 2 studies, I2 = 15%). There is some uncertainty associated with this result, which we considered to be of low quality due to serious concerns with indirectness and publication bias. See Analysis 5.1.
Comparison of antipsychotics with antipsychotic discontinuation (placebo)
Only one study which investigated the discontinuation of antipsychotics met the inclusion criteria for this meta‐analysis (Ruths 2008).
Continued antipsychotic use may slightly improve apathy on the NPI‐apathy subscale compared to antipsychotic discontinuation (placebo): MD ‐0.24, 95% CI ‐0.51 to 0.03, P = 0.08, n = 55, 1 study. There was uncertainty associated with this result, which we considered to be of low quality due to serious concerns with indirectness and publication bias. Additionally, the clinical importance of these findings is uncertain, as apathy was not a primary outcome measure of these studies. See Analysis 6.1.
Comparison of antidepressants with placebo
Two studies with antidepressants met the inclusion criteria for this meta‐analysis (Lanctôt 2002; CitAD trial). All participants had clinically significant NPS (Lanctôt 2002) or agitation (CitAD trial) at baseline. Apathy was assessed with the NPI‐apathy subscale.
We are uncertain whether antidepressants improved apathy compared to placebo over the duration of treatment (MD ‐1.24, 95% ‐1.44 to ‐1.04, P < 0.00001, n = 126, 2 studies, I2 = 3%). There was uncertainty associated with this result, which we considered to be of very low quality due to selective reporting (the NPI‐subscores in the CitAD trial were not normally distributed, and the reported medians were used as an estimate of the sample mean), indirectness of results, and publication bias. See Analysis 7.1.
Comparison of mibampator with placebo
Only one study investigated and reported on the efficacy of mibampator for the treatment of apathy (Trzepacz 2013).
We are uncertain whether mibampator improved apathy, assessed with the FrSBe‐apathy Tscore compared to placebo over the duration of treatment (MD ‐1.20, 95% ‐1.94 to ‐0.46, P = 0.001, n = 132, 1 study). There was uncertainty associated with this result, which we considered to be of very low quality due to selective reporting of adjusted mean values, indirectness of results, and publication bias. See Analysis 8.1.
Comparison of valproate with placebo
Three studies investigated and reported on the efficacy of valproate for the treatment of apathy (Sival 2002; Herrmann 2007; Tariot 2011).
There may be little or no difference between treatment groups in the change in apathy over the duration of treatment (SMD 0.02, 95% CI ‐0.23 to 0.26, P = 0.88, n = 257, 3 studies, I2 = 0%). There was uncertainty associated with this result, which we considered to be of low quality due to indirectness and imprecision. See Analysis 9.1.
Comparison of semagacestat with placebo
Only one paper (Rosenberg 2016) reported on the efficacy of semagacestat for the treatment of apathy in a secondary analysis of a previously published trial (Semgacestat trial).
Semagacestat may slightly worsen apathy assessed with the NPI subscale compared to placebo over the duration of treatment (MD 0.20, 95% CI 0.15 to 0.25, P < 0.001, n = 939, 1 study), but the effect is probably too small to be of clinical significance. There was some uncertainty associated with this result, which we considered to be of low quality as there were concerns with indirectness of results and publication bias. See Analysis 10.1.
Discussion
Summary of main results
The results of this meta‐analysis showed the following main findings:
-
Methylphenidate may improve apathy compared to placebo, based on AES change scores in people with AD and clinically significant apathy at baseline. However, this finding was not supported by the results on NPI‐apathy subscale change scores. Although this inconsistency may be attributed to differences between the scales, another difference is that the analysis with AE data included three studies and 145 participants (Herrmann 2008; Rosenberg 2013; Padala 2017), whereas the analysis with NPI‐apathy subscale data included only two studies with 85 participants (Herrmann 2008; Padala 2017). Subgroup analysis with AE data indicates that the effect size was larger in a 12‐week study than in six‐ and eight‐week studies, but this finding could be due to reasons other than trial duration. Notably, there was uncertainty with these findings, as they were associated with low quality of evidence. Methylphenidate may also improve cognition and function. Both of these findings were associated with moderate quality of evidence, although the difference in cognition was small and as a result may not be clinically significant. There were no significant differences between treatment groups in the risk of developing an AE.
-
In people with AD and clinically significant apathy at baseline, low‐quality evidence from one very small study suggested that there was no effect of modafinil on apathy.
All other included studies measured apathy as a secondary outcome. Participants in these studies did not necessarily have clinically significant apathy at baseline.
-
ChEI use may slightly improve apathy compared to placebo, but there is some uncertainty associated with this result due to low quality of evidence. Furthermore, the clinical importance of this finding is uncertain, as apathy was not a primary outcome measure, and the effect size was small. Significance was maintained and heterogeneity was reduced in studies with metrifonate only. These findings were not replicated in more recent studies with currently‐approved ChEIs. Studies with metrifonate had a longer study duration (more than 24 weeks), and were conducted only in people with mild‐to‐moderate AD. However, as subgroup differences were not significant, we cannot confirm the effect of ChEI type (approved ChEI versus metrifonate) or trial duration on the efficacy of ChEI intervention on apathy. In a subgroup analysis of disease severity, we found similarly‐sized effects in people with moderate and severe AD. However, there is uncertainty associated with this result, due to the low quality of evidence.
-
Atypical antipsychotics and semagacestat may slightly worsen apathy compared to placebo. Based on the findings of one antipsychotic discontinuation trial, continued antipsychotic use may slightly improve apathy compared to antipsychotic discontinuation. The clinical importance of this finding is uncertain, as apathy was not a primary outcome measure, and the effect size was small. The findings of one ChEI discontinuation trial indicated that ChEI discontinuation may slightly improve apathy compared to ChEI continuation. These findings were limited by a low quality of evidence.
-
Valproate demonstrated little or no difference in apathy. However, these findings were supported by low quality of evidence.
-
Our findings on antidepressants and mibampator had very low quality of evidence, due to selective reporting, indirectness of results and publication bias. We are therefore uncertain whether these interventions have any effect on apathy.
Overall completeness and applicability of evidence
By conducting a meta‐analysis we were able to combine findings from multiple clinical trials to evaluate the efficacy of a number of pharmacological interventions for the treatment of apathy in AD. When evaluating the applicability of this review to the clinical setting, outcome measures, participant characteristics, and treatment duration should be taken into consideration.
The studies with modafinil and methylphenidate were directly applicable to our review question. They recruited participants with clinically significant apathy, and included apathy as a primary outcome measure, which was likely chosen prior to designing their respective trials. As such, these trials may have a reduced risk of false‐positive errors resulting from the statistical analysis of many outcomes, and may have a reduced risk of false‐negative errors by providing the foundation for a sample size calculation for an adequately‐powered study (Andrade 2015). For methylphenidate, we found some data on all of our outcome measures. For modafinil, we found no data on cognition, overall NPS, or global disease severity.
All other included studies investigated apathy as a secondary outcome measure. Although this may increase the risk of false‐positive and false‐negative errors, the results of these studies are still of interest given the current absence of approved medications for the treatment of apathy in AD. However, for these interventions, the analyses must be regarded as exploratory. From these studies, we sought data on apathy only. In addition to a standardized diagnosis of AD, studies with antipsychotics, antidepressants, and mibampator also had clinically significant NPS as part of their inclusion criteria; in different studies these were overall NPS burden, agitation/aggression or psychosis. Apathy is one of the most frequently observed NPS in people with mild AD. In the advanced stages of AD, psychosis, agitation and aggression also become more prevalent, but apathy persists. In a systematic review of 59 studies, apathy was reported to be the only NPS with high baseline prevalence, persistence and incidence throughout the course of dementia (Van der Linde 2016). Hence, results from these studies may still be applicable, despite participants having NPS other than apathy. Some but not all of the Objective 2 studies did report apathy scores at baseline in their participants, and in several of these apathy was at levels usually regarded as clinically significant.
Five comparisons contained more than one study and in these study duration varied. The three methylphenidate studies varied from two to 12 weeks. In studies with ChEIs, study duration varied from 12 to 26 weeks. In studies with atypical antipsychotics, study duration varied from four to 36 weeks. In studies with antidepressants, study duration varied from four to nine weeks. Studies with valproate varied in study duration from 3 weeks to 24 months. We had hoped to explore the effect of treatment duration, but in practice the data offered little opportunity to do this due to the small numbers of studies and participants.
For this review, apathy was the only outcome evaluated in Objective 2. However, published systematic reviews of RCTs with ChEIs (Birks 2006), ChEI discontinuation (O'Regan 2015), atypical antipsychotics (Ballard 2006), antipsychotic discontinuation (Declercq 2013), antidepressants (Seitz 2011), and valproate (Lonergan 2009) may provide insight regarding their safety and efficacy in people with AD and apathy.
Quality of the evidence
All the included studies were well conducted and well reported, so that we had few serious concerns about risks of bias. We rated four studies as being at high risk of selective reporting bias because they reported only adjusted and not raw mean scores.
For Objective 1, the overall quality of the evidence was low for our primary efficacy outcome and low or moderate for adverse events and our secondary outcomes. This was largely due to imprecision; there were few studies and they were small. There was also inconsistency between the three methylphenidate studies in the effect on apathy.
For Objective 2, the nature and quality of the evidence meant that our results must be regarded as exploratory only. Many participants in these studies were recruited due to high levels of NPS other than apathy, or had no particular behavioral problems. Hence these studies addressed our review question indirectly. Furthermore, we were able to obtain data on apathy from only a minority of drug trials in AD which have measured it, raising concerns about publication bias. We also considered some of the results to be affected by imprecision, inconsistency or risk of selective reporting bias.
Potential biases in the review process
Ten out of the 21 studies which we included in our meta‐analysis were pharmaceutical industry‐sponsored studies. This may be a source of publication bias, as it has been reported that pharmaceutical‐industry funding is associated with outcomes that are favorable for the funder (Lexchin 2003; Bhandari 2004; Heres 2006). The pharmaceutical industry may not publish negative studies as frequently as positive studies. Publication bias is not necessarily confined to industry‐sponsored trials, as academic researchers may also be more likely to publish positive results, which are more likely to be accepted by editors, reviewed by peers, and more often cited. Clinical trial registries aim to increase transparency and access to information about clinical trials. Although clinical trial registries have been available since 1997, governmental bodies and international organizations have been pushing for the registration and standardization of clinical trial registries since 2005. Since 2008, the revised Declaration of Helsinki has stated that every clinical trial must be registered in a publicly accessible database before recruitment of the first participant (General Assembly of the World Medical Association). However only 10 of the 21 studies included in this meta‐analysis were published in or after 2008.
We contacted the authors of the 41 additional studies which met our inclusion criterion of investigating apathy as a primary or secondary outcome measure as they did not provide data on our primary outcome of apathy in an extractable format. However, since we did not receive a response, or since data were no longer available to the authors, we excluded those studies from our meta‐analyses.
The NPI‐apathy subscale and the AES are two of the most widely‐used scales in research related to apathy in AD. In this review, 16 studies used the NPI‐apathy subscale, four studies used the AES, two used the FrSBe apathy Tscore, and one study each used the BPRS‐withdrawn depression factor score, and the GIP apathetic behavior subscore. As different scales were used to assess apathy in the studies included in this review, heterogeneity of results is a concern. However, there is no widely‐accepted gold‐standard scale for assessing apathy, and there is still a lack of consensus about the definition and diagnostic criteria for apathy (Cummings 2015). It is therefore important for future research to focus on validating scales and diagnostic criteria for apathy in AD. This would provide definitive recommendations for future clinical trials on how to appropriately target recipients of pharmacological interventions, and how to assess apathy, which would reduce the heterogeneity between studies.
Agreements and disagreements with other studies or reviews
The results of this meta‐analysis add to the current body of evidence for pharmacological interventions for apathy, as previous reports have been inconclusive in elucidating whether methylphenidate is effective and safe in the treatment of apathy in people with AD.
In a meta‐analysis conducted by Sepehry 2017, the authors investigated pharmacological therapy for apathy in AD. Fifteen studies were included, and 11 were quantitatively analyzed. Pharmacological agents included ChEIs, memantine and psychostimulants (modafinil and methylphenidate). That review did not find any significant effect of drug over placebo on apathy. However, the authors disclosed that in the absence of descriptive statistics (mean and SD values), they generated effect sizes using P values and sample sizes. If P values were not reported, the authors assumed an alpha of 0.06 for their analyses. This method of data imputation would have likely biased the findings of their results due to a high risk of selective reporting.
A comprehensive review by Harrison 2016 evaluated the evidence of pharmacotherapies for apathy from studies since 2013. However, as they did not require trials to be placebo‐controlled, nor treat apathy as a primary or secondary outcome measure, nor have AD as a standardized diagnosis, their findings were not consistent with ours. With respect to ChEIs, Harrison 2016 reported that previous findings about cognitive enhancers (ChEIs and memantine) were not replicated in more recent studies. This finding was similar to our own, as we found a benefit in the older trials investigating metrifonate, but not with the more recent trials with currently‐approved ChEIs. Additionally, although results with antidepressants were mixed, they found benefits with agomelatine in a non‐placebo‐controlled RCT (Callegari 2016). Their findings with methylphenidate were inconclusive, but they only included one study (Rosenberg 2013). We reported on the efficacy of methylphenidate on apathy in three trials. However, as we did not have high‐quality evidence, we suggest that further studies investigating the efficacy of methylphenidate on apathy in people with AD would increase the quality of evidence and strengthen this finding.

2Study flow diagram.

Risk of bias summary: review authors' judgements about each risk of bias item for each included study.

Figure 3 CaptionRisk of bias graph: review authors' judgements about each risk of bias item presented as percentages across all included studies.

Forest plot of comparison: 7 Methylphenidate, outcome: 7.1 Apathy (AES only).

Forest plot of comparison: 7 Methylphenidate, outcome: 7.3 Adverse Events.

Forest plot of comparison: 3 Cholinesterase Inhibitors, outcome: 3.1 Change in apathy from baseline as measured by the NPI‐apathy subscore (subgroup analysis with licensed versus unlicensed ChEIs).

Comparison 1 Methylphenidate, Outcome 1 Change in apathy from baseline as measured by the AES.

Comparison 1 Methylphenidate, Outcome 2 Change in apathy from baseline as measured by the NPI‐apathy subscore.

Comparison 1 Methylphenidate, Outcome 3 Adverse Events.

Comparison 1 Methylphenidate, Outcome 4 Change in NPS from baseline as measured by the NPI.

Comparison 1 Methylphenidate, Outcome 5 Change in cognition from baseline as measured by the MMSE.

Comparison 1 Methylphenidate, Outcome 6 Change in functional permance from baseline as measured by the ADL.

Comparison 1 Methylphenidate, Outcome 7 Change in functional performance from baseline as measured by the IADL.

Comparison 1 Methylphenidate, Outcome 8 Change in global disease severity from baseline as measured by the CGIC and the ADCS‐CGIC.

Comparison 1 Methylphenidate, Outcome 9 Dropouts due to adverse events.

Comparison 2 Modafinil, Outcome 1 Change in apathy from baseline as measured by the FrSBe‐apathy subscale.

Comparison 2 Modafinil, Outcome 2 Change in functional performance from baseline as measured by the ADL‐Q.
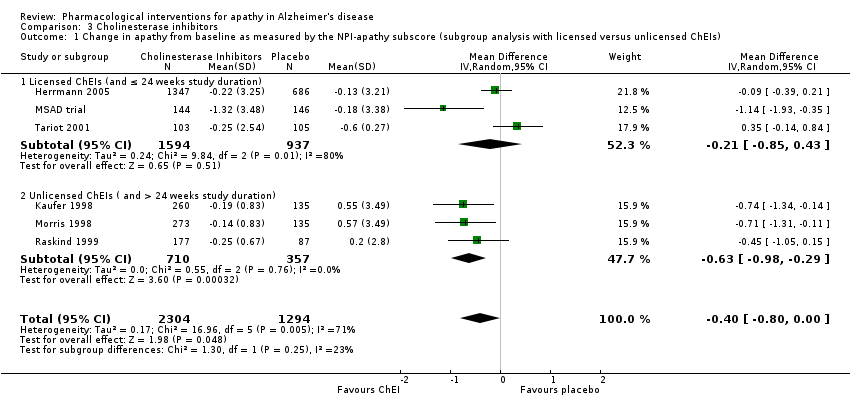
Comparison 3 Cholinesterase inhibitors, Outcome 1 Change in apathy from baseline as measured by the NPI‐apathy subscore (subgroup analysis with licensed versus unlicensed ChEIs).

Comparison 3 Cholinesterase inhibitors, Outcome 2 Change in apathy from baseline as measured by the NPI‐apathy subscore (subgroup analysis with disease severity).

Comparison 4 Discontinuation of cholinesterase inhibitors, Outcome 1 Change in apathy from baseline as measured by the NPI‐apathy subscore.

Comparison 5 Atypical antipsychotics, Outcome 1 Change in apathy from baseline as measured by the NPI‐apathy subscore and the BPRS withdrawn depression factor score.

Comparison 6 Discontinuation of antipsychotics, Outcome 1 Change in apathy from baseline as measured by the NPI‐apathy subscore.

Comparison 7 Antidepressants, Outcome 1 Change in apathy from baseline as measured by the NPI‐apathy subscore.

Comparison 8 Mibampator, Outcome 1 Change in apathy from baseline as measured by the FrSBe‐apathy T score.

Comparison 9 Valproate, Outcome 1 Change in apathy from baseline as measured by the NPI‐apathy subscore and GIP‐apathy subscore.

Comparison 10 Semagacestat, Outcome 1 Change in apathy from baseline as measured by the NPI‐apathy subscore.
| Methylphenidate compared to placebo for apathy in Alzheimer's disease | ||||||
| Patient or population: Apathy in people with mild‐to‐moderate Alzheimer's disease | ||||||
| Outcomes | Anticipated absolute effects* (95% CI) | Relative effect | № of participants | Quality of the evidence | Comments | |
| Risk with placebo | Risk with Methylphenidate | |||||
| Change in apathy (AES score) | The mean change from baseline in apathy was ‐4.2 to 0.6 | MD 4.99 lower | ‐ | 145 | ⊕⊕⊝⊝ | AES: Limited data on clinically meaningful changes |
| Change in apathy (NPI‐apathy subscale score) | The mean change from baseline in apathy ‐2.6 to ‐1.69 | MD 0.08 lower | ‐ | 85 | ⊕⊕⊝⊝ | 1‐ to 2‐point change suggested to be clinically significant in people with a clinically significant apathy (Rosenberg 2013) |
| Adverse events | Study population | RR 1.28 | 145 | ⊕⊕⊝⊝ | ‐ | |
| 534 per 1000 | 684 per 1000 | |||||
| Change in NPS | The mean change from baseline in NPS was ‐2.08 | MD 0.16 higher | ‐ | 25 | ⊕⊕⊝⊝ | 4‐point change suggested to be clinically significant |
| Change in cognition | The mean change from baseline in cognition was ‐1.08 to ‐0.3 | MD 1.79 higher | ‐ | 145 | ⊕⊕⊕⊝ | MMSE: 2‐ to 4‐point change suggested to be clinically significant |
| Change in functional performance assessed with: ADL scale | The mean change from baseline in functional performance was 0.4 | MD 0.50 higher | ‐ | 60 | ⊕⊕⊕⊝ | Limited data on clinically meaningful changes |
| Change in functional performance assessed with: IADL scale | The mean change from baseline in functional performance was ‐0.6 | MD 2.30 higher | ‐ | 60 | ⊕⊕⊕⊝ | Limited data on clinically meaningful changes |
| Change in global disease severity | Study population | RR 0.56 | 85 | ⊕⊕⊕⊝ | ‐ | |
| 116 per 1000 | 65 per 1000 | |||||
| Dropouts | Study population | RR 2.10 | 145 | ⊕⊕⊝⊝ | ‐ | |
| 41 per 1000 | 86 per 1000 | |||||
| *The risk in the intervention group (and its 95% confidence interval) is based on the assumed risk in the comparison group and the relative effect of the intervention (and its 95% CI). AD: Alzheimer's disease; AEs: Adverse Events; MMSE: Mini‐Mental Status Examination; MD: Mean Difference; NPS: Neuropsychiatric Symptom, SMD: Standardized Mean Difference, CI: Confidence interval; RR: Risk ratio; OR: Odds ratio | ||||||
| GRADE Working Group grades of evidence | ||||||
| 1Quality downgraded one level due imprecision (wide 95% confidence interval). | ||||||
| Modafinil compared to placebo for apathy in Alzheimer's disease | ||||||
| Patient or population: Apathy in people with mild‐to‐moderate Alzheimer's disease | ||||||
| Outcomes | Anticipated absolute effects* (95% CI) | Relative effect | № of participants | Quality of the evidence | Comments | |
| Risk with placebo | Risk with Modafinil | |||||
| Change in apathy | The mean change from baseline in apathy was ‐6.82 | MD 0.27 higher | ‐ | 22 | ⊕⊕⊝⊝ | Limited data on clinically meaningful changes on the FrSBe apathy score |
| Adverse Events ‐ reported, but not analyzed in this review | ‐ | ‐ | ‐ | ‐ | ‐ | ‐ |
| Change in NPS ‐ not investigated | ‐ | ‐ | ‐ | ‐ | ‐ | ‐ |
| Change in cognition ‐ not investigated | ‐ | ‐ | ‐ | ‐ | ‐ | ‐ |
| Change in functional performance | The mean change from baseline in functional performance was 0 | MD 0.54 lower | ‐ | 22 | ⊕⊕⊝⊝ | Limited data on clinically meaningful changes |
| Change in global disease severity ‐ not investigated | ‐ | ‐ | ‐ | ‐ | ‐ | ‐ |
| Dropouts ‐ reported, but not analyzed in this review | ‐ | ‐ | ‐ | ‐ | ‐ | ‐ |
| *The risk in the intervention group (and its 95% confidence interval) is based on the assumed risk in the comparison group and the relative effect of the intervention (and its 95% CI). | ||||||
| GRADE Working Group grades of evidence | ||||||
| 1Quality downgraded two levels due to small sample size and imprecision (wide 95% confidence interval). | ||||||
| STUDY DURATION | N OF PARTICIPANTS | Diagnosis | MEAN AGE (YRS) | MEAN MMSE (SD) | MEAN BL NPI‐APATHY (SD) score | COUNTRY | NUMBER OF SITES | TREATMENT GROUPS | |
| METHYLPHENIDATE | |||||||||
| 2 weeks Cross‐over design: 2 treatment phases of 2 weeks with a 1‐week washout between phases | 13 total | Possible or probable AD (NINCDS‐ADRDA), and apathy (NPI‐apathy subscale ≥ 1) | 77.9 (7.8) | 19.9 (4.7) | 5.9 (3) | Canada | 3 | Group 1: Methylphenidate (10 mg twice a day) | |
| 6 weeks | 60 participants | Possible or probable AD (NINCDS‐ADRDA), and clinically significant apathy for at least 4 weeks | 76 (8) | 20 (5) | Group 1: 7 (2) | USA, Canada | 3 | Group 1: Methylphenidate (target: 20 mg daily) | |
| 12 weeks | 60 participants | Dementia of the AD type (DSM‐IV‐TR), and presence of apathy (AES > 40) | 76.6 (7.9) | 23.8 (2.5) | Not reported | USA | 1 | Group 1: Methylphenidate (target: 20 mg daily) | |
| MODAFINIL | |||||||||
| 8 weeks | Group 1: 11 | Possible or probable AD (NINCDS‐ADRDA criteria) and clinically significant apathy (FrSBe Tscore ≥ 65) | Group 1: 75.3 (8.3) | Not disclosed | Not reported | USA | 1 | Group 1: Modafinil (200 mg daily) | |
| CHOLINESTERASE INHIBITORS | |||||||||
| 24 weeks | Group 1: 103 Group 2: 105 | Possible or probable AD with cerebrovascular disease (but not vascular dementia) (NINCDS‐ADRDA criteria) | Group 1: 85.4 | Group 1: 14.4 (5.4) | Not reported | USA | 27 | Group 1: Donepezil ‐ 5 mg/day for 28 days. 10 mg/day after 28 days based on tolerability. | |
| 24 weeks | Group 1: 144 | AD (DSM‐IV and NINCDS‐ADRDA criteria) | 73.6 | Group 1: 11.7 (0.35) | Group 1: | Canada, Australia, France | 32 | Group 1: Donepezil ‐ 5 mg/day for 28 days. 10 mg/day after 28 days based on tolerability. | |
| Range: 3 ‐ 6 months (12 ‐ 24 weeks) | Group 1: 1347 | Probable AD (NINCDS‐ADRDA criteria) | 76 | 18 | Group 1: | USA, Canada, Great Britain, South Africa, Australia, and New Zealand | Multicenter, but number not disclosed | Group 1: Galantamine | |
| 26 weeks | Group 1: 273 | Probable AD (NINCDS‐ADRDA criteria) | Not reported | Not reported | Not reported | USA | 25 | Group 1: Metrifonate (2 weeks – 2.0 mg/kg, followed by 0.65 mg/kg) | |
| 26 weeks | Group 1: 273 | Probable AD (NINCDS‐ADRDA criteria) | Group 1: 73.5 (8.1) | Group 1: 18.8 (5) | Not reported | USA | 24 | Group 1: Metrifonate (2 weeks – 2.0 mg/kg, followed by 0.65 mg/kg) | |
| 26 weeks | Group 1: 177 | Probable AD (NINCDS‐ADRDA criteria) mild‐moderate AD | Group 1: 74.6 (8.3) | Group 1: 18.7 (4.76) | Not reported | USA (additional sites are not disclosed) | Multicenter, but number not disclosed | Group 1: | |
| CHOLINESTERASE DISCONTINUATION | |||||||||
| 8 weeks | Group 1: 21 | Probable AD (NINCDS‐ADRDA criteria) | 89.3 | Group 1: 8.1(5.2) | Group 1: | Canada | 2 | Group 1: Donepezil, | |
| ATYPICAL ANTIPSYCHOTICS | |||||||||
| 10 weeks | Group 1: 132 | Possible or probable AD (NINCDS‐ADRDA criteria and DSM‐IV‐TR), and clinically significant psychotic symptoms | 76.6 (10.4) | 13.7 (5.1) | Group 1: 3.2 (3.9) | Europe, Australia, Israel, Lebanon, and South Africa | 61 | Group 1: 7.5 mg OLZ | |
| Up to 36 weeks (12 weeks of treatment) data available | Group 1: 100 | Dementia of the AD type (DSM‐IV) or probable AD (NINCDS‐ADRDA) and daily delusions, hallucinations, agitation, or aggression over 4 weeks prior to study entry | 77.9 (7.5) | Group 1: 15 (5.4) | Not reported | USA | 42 | Group 1: OLZ | |
| ANTIPSYCHOTIC DISCONTUATION | |||||||||
| 4 weeks | Group 1: 28 | Dementia diagnosis according to ICD‐10 | 83.4 (6.9) | Not provided | Group 1: | Norway | 9 | Group 1: Antipsychotics (haloperidol, risperidone, or olanzapine) | |
| ANTIDEPRESSANTS | |||||||||
| 4 weeks: Cross‐over design: 2 treatment phases of 4 weeks with a 1‐week washout between phases | 22 total | Primary degenerative dementia (DSM‐IV) and probable AD (NINCDS‐ADRDA), and significant behavioral problems (NPI ≥ 8) | 82 (6) | 4.1 (4.7) | Group 1: | Canada | 3 | Group 1: Sertraline (100 mg daily) | |
| 9 weeks | Group 1: 94 | Probable AD (NINCDS‐ADRDA), and significant behavioral problems (NPI ≥ 8), and clinically significant agitation on the NPI > 3 | Group 1: 78 (9) | Group 1: 17 (6.2) | Group 1: | USA | 6 | Group 1: Citalopram (30 mg daily) | |
| MIBAMPATOR | |||||||||
| 12 weeks | Group 1: 63 | Probable AD (NINCDS‐ADRDA) (DSM‐IV‐TR), and clinically significant agitation/aggression | Group 1: 77.2 (8.2) | Group 1: 16.0 (6.1) Group 2: 18 (5.3) | Not reported | USA | Multicenter, but number not disclosed | Group 1: Mibampator (target dose: 3 mg daily) | |
| VALPROATE | |||||||||
| 6 weeks: Cross‐over design: 2 treatment phases of 6 weeks with a 2‐week washout between phases | Group 1: 14 | Probable AD (NINCDS‐ADRDA), primary degenerative dementia (DSM‐IV) | 85.6 (4.5) | 4.5 (4.6) | Group 1: 2.4 (3.8) | Canada | 2 | Group 1: Valproate (mean dose: 1134.6 (400.1) mg daily) | |
| 3 weeks: Cross‐over design: 2 treatment phases of 3 weeks with a 1‐week washout between phases | Group 1: 42 | Senile dementia (NINCDS‐ADRDA)(DSM‐IV) | 80.4 (6.8) | 11.4 (5) | Not reported | Netherlands | 1 | Group 1: Valproate (2 x 240 mg) | |
| 24 months (+ 2‐month single‐blind placebo phase) | Group 1: 153 | Possible or probable AD (NINCDS‐ADRDA) | Group 1: 74.9 | Group 1: 16.9 (3.0) | Group 1: | USA | 46 | Group 1: Valproate (flexible‐dose) (mean modal dose: 250 mg daily) | |
| SEMAGACESTAT | |||||||||
| 76 weeks | Group 1: 463 | Mild‐moderate AD (NINCDS‐ADRDA) | Group 1: 72.7 (7.9) | Group 1: 20.9 (3.5) | Not reported | USA | 91 | Group 1: LY100 | |
| AD: Alzheimer's disease, BL: baseline, DSM: Diagnostic and Statistical Manual of Mental Disoders, FrSBe: Frontal Systems Behavior Scale, ICD: International Classification of Diseases, LY: LY450319 (Eli Lillyand Company study drug), NINCDS‐ADRDA: National Institute of Neurological and Communicative disorders and the Alzheimer's Disease and Related Disorders Association, NPI: Neuropsychiatric Inventory, OLZ: olanzapine, QUE: quetiapine, RIS: risperidone, SD: standard deviation. | |||||||||
| Study | Apathy | AE reported | NPS | Cognition | Function | Global Change | Dropouts due to AEs reported |
| METHYLPHENIDATE | |||||||
| AES‐Informant | Yes | NPI‐total | MMSE | N/A | CGI‐C | Yes | |
| AES‐Informant | Yes | NPI‐total (not reported) | MMSE | N/A | ADCS‐CGIC | Yes | |
| AES‐Clinician | Yes | N/A | MMSE | ADL | N/A | Yes | |
| MODAFINIL | |||||||
| FrSBe‐apathy subscale | Yes | N/A | N/A | ADLQ | N/A | Yes | |
| CHOLINESTERASE INHIBITORS | |||||||
| NPI‐apathy subscale | These outcomes were not investigated for this drug comparison | ||||||
| NPI‐apathy subscale | |||||||
| NPI‐apathy subscale | |||||||
| NPI‐apathy subscale | |||||||
| NPI‐apathy subscale | |||||||
| NPI‐apathy subscale | |||||||
| CHOLINESTERASE DISCONTINUATION | |||||||
| NPI‐apathy subscale | These outcomes were not investigated for this drug comparison. | ||||||
| ATYPICAL ANTIPSYCHOTICS | |||||||
| NPI‐apathy subscale | These outcomes were not investigated for this drug comparison | ||||||
| BPRS‐withdrawn depression factor score | |||||||
| ANTIPSYCHOTIC DISCONTINUATION | |||||||
| NPI‐apathy subscale | These outcomes were not investigated for this drug comparison | ||||||
| ANTIDEPRESSANTS | |||||||
| NPI‐apathy subscale | These outcomes were not investigated for this drug comparison | ||||||
| NPI‐apathy subscale | |||||||
| MIBAMPATOR | |||||||
| FrSBe‐apathy T score | These outcomes were not investigated for this drug comparison | ||||||
| VALPROATE | |||||||
| NPI‐apathy subscale | These outcomes were not investigated for this drug comparison | ||||||
| GIP‐apathetic behavior subscore | These outcomes were not investigated for this drug comparison | ||||||
| NPI‐apathy subscale | These outcomes were not investigated for this drug comparison | ||||||
| SEMAGACESTAT | |||||||
| NPI‐apathy | These outcomes were not investigated for this drug comparison | ||||||
| ADCS‐CGIC: Alzheimer's Diserase Cooperative Study ‐ Clinical Global Impression of Change, ADL: Activities of Daily Living scale, ADLQ: Lawton and Brody Fucntional Assessment, AES: Apathy Evaluation Scale, CGI‐C: Clinical Global Impression of Change, FrSBe: Frontal Systems Behavior Scale, GIP: The Behavior Observation Scale for Intramural Psychogeriatric Patients, IADL: Instrumental Activities of Daily Living Scale, MMSE: Mini‐Mental State Examination, NPI: Neuropsychiatric Inventory. | |||||||
| Outcome or subgroup title | No. of studies | No. of participants | Statistical method | Effect size |
| 1 Change in apathy from baseline as measured by the AES Show forest plot | 3 | 145 | Mean Difference (IV, Random, 95% CI) | ‐4.99 [‐9.55, ‐0.43] |
| 1.1 < 12 weeks | 2 | 85 | Mean Difference (IV, Random, 95% CI) | ‐2.62 [‐4.80, ‐0.44] |
| 1.2 ≥ 12 weeks | 1 | 60 | Mean Difference (IV, Random, 95% CI) | ‐9.90 [‐13.50, ‐6.30] |
| 2 Change in apathy from baseline as measured by the NPI‐apathy subscore Show forest plot | 2 | 85 | Mean Difference (IV, Random, 95% CI) | ‐0.08 [‐3.85, 3.69] |
| 3 Adverse Events Show forest plot | 3 | 145 | Risk Ratio (M‐H, Random, 95% CI) | 1.28 [0.67, 2.42] |
| 3.1 < 12 weeks | 2 | 85 | Risk Ratio (M‐H, Random, 95% CI) | 1.28 [0.44, 3.72] |
| 3.2 ≥ 12 weeks | 1 | 60 | Risk Ratio (M‐H, Random, 95% CI) | 1.44 [0.73, 2.86] |
| 4 Change in NPS from baseline as measured by the NPI Show forest plot | 1 | 25 | Mean Difference (IV, Fixed, 95% CI) | 0.16 [‐7.89, 8.21] |
| 5 Change in cognition from baseline as measured by the MMSE Show forest plot | 3 | 145 | Mean Difference (IV, Fixed, 95% CI) | 1.98 [1.06, 2.91] |
| 5.1 < 12 weeks study duration | 2 | 85 | Mean Difference (IV, Fixed, 95% CI) | 1.00 [‐0.49, 2.49] |
| 5.2 ≥ 12 weeks study duration | 1 | 60 | Mean Difference (IV, Fixed, 95% CI) | 2.6 [1.43, 3.77] |
| 6 Change in functional permance from baseline as measured by the ADL Show forest plot | 1 | 60 | Mean Difference (IV, Fixed, 95% CI) | 0.5 [‐0.39, 1.39] |
| 7 Change in functional performance from baseline as measured by the IADL Show forest plot | 1 | 60 | Mean Difference (IV, Fixed, 95% CI) | 2.3 [0.74, 3.86] |
| 8 Change in global disease severity from baseline as measured by the CGIC and the ADCS‐CGIC Show forest plot | 2 | 85 | Risk Ratio (M‐H, Fixed, 95% CI) | 0.58 [0.16, 2.11] |
| 9 Dropouts due to adverse events Show forest plot | 3 | 145 | Risk Ratio (M‐H, Fixed, 95% CI) | 2.18 [0.64, 7.45] |
| Outcome or subgroup title | No. of studies | No. of participants | Statistical method | Effect size |
| 1 Change in apathy from baseline as measured by the FrSBe‐apathy subscale Show forest plot | 1 | 22 | Mean Difference (IV, Fixed, 95% CI) | 0.27 [‐3.51, 4.05] |
| 2 Change in functional performance from baseline as measured by the ADL‐Q Show forest plot | 1 | 22 | Mean Difference (IV, Fixed, 95% CI) | ‐0.54 [‐1.40, 0.32] |
| Outcome or subgroup title | No. of studies | No. of participants | Statistical method | Effect size |
| 1 Change in apathy from baseline as measured by the NPI‐apathy subscore (subgroup analysis with licensed versus unlicensed ChEIs) Show forest plot | 6 | 3598 | Mean Difference (IV, Random, 95% CI) | ‐0.40 [‐0.80, ‐0.00] |
| 1.1 Licensed ChEIs (and ≤ 24 weeks study duration) | 3 | 2531 | Mean Difference (IV, Random, 95% CI) | ‐0.21 [‐0.85, 0.43] |
| 1.2 Unlicensed ChEIs ( and > 24 weeks study duration) | 3 | 1067 | Mean Difference (IV, Random, 95% CI) | ‐0.63 [‐0.98, ‐0.29] |
| 2 Change in apathy from baseline as measured by the NPI‐apathy subscore (subgroup analysis with disease severity) Show forest plot | 6 | 3598 | Mean Difference (IV, Random, 95% CI) | ‐0.40 [‐0.80, ‐0.00] |
| 2.1 Moderate AD (MMSE ≥ 18) | 4 | 3100 | Mean Difference (IV, Random, 95% CI) | ‐0.43 [‐0.79, ‐0.07] |
| 2.2 Severe AD (MMSE < 18) | 2 | 498 | Mean Difference (IV, Random, 95% CI) | ‐0.36 [‐1.82, 1.10] |
| Outcome or subgroup title | No. of studies | No. of participants | Statistical method | Effect size |
| 1 Change in apathy from baseline as measured by the NPI‐apathy subscore Show forest plot | 1 | 40 | Mean Difference (IV, Fixed, 95% CI) | 1.11 [‐0.88, 3.10] |
| Outcome or subgroup title | No. of studies | No. of participants | Statistical method | Effect size |
| 1 Change in apathy from baseline as measured by the NPI‐apathy subscore and the BPRS withdrawn depression factor score Show forest plot | 2 | 1070 | Std. Mean Difference (IV, Fixed, 95% CI) | 0.14 [0.00, 0.28] |
| Outcome or subgroup title | No. of studies | No. of participants | Statistical method | Effect size |
| 1 Change in apathy from baseline as measured by the NPI‐apathy subscore Show forest plot | 1 | 55 | Mean Difference (IV, Fixed, 95% CI) | ‐0.24 [‐0.51, 0.03] |
| Outcome or subgroup title | No. of studies | No. of participants | Statistical method | Effect size |
| 1 Change in apathy from baseline as measured by the NPI‐apathy subscore Show forest plot | 2 | 126 | Mean Difference (IV, Fixed, 95% CI) | ‐1.24 [‐1.44, ‐1.04] |
| Outcome or subgroup title | No. of studies | No. of participants | Statistical method | Effect size |
| 1 Change in apathy from baseline as measured by the FrSBe‐apathy T score Show forest plot | 1 | 132 | Mean Difference (IV, Fixed, 95% CI) | ‐1.2 [‐1.94, ‐0.46] |
| Outcome or subgroup title | No. of studies | No. of participants | Statistical method | Effect size |
| 1 Change in apathy from baseline as measured by the NPI‐apathy subscore and GIP‐apathy subscore Show forest plot | 3 | 257 | Std. Mean Difference (IV, Fixed, 95% CI) | 0.02 [‐0.23, 0.26] |
| Outcome or subgroup title | No. of studies | No. of participants | Statistical method | Effect size |
| 1 Change in apathy from baseline as measured by the NPI‐apathy subscore Show forest plot | 1 | 939 | Mean Difference (IV, Fixed, 95% CI) | 0.20 [0.15, 0.25] |