Fármacos con cannabis para el dolor neuropático crónico en pacientes adultos
Información
- DOI:
- https://doi.org/10.1002/14651858.CD012182.pub2Copiar DOI

- Base de datos:
-
- Cochrane Database of Systematic Reviews
- Versión publicada:
-
- 07 marzo 2018see what's new
- Tipo:
-
- Intervention
- Etapa:
-
- Review
- Grupo Editorial Cochrane:
-
Grupo Cochrane de Dolor y cuidados paliativos
- Copyright:
-
- Copyright © 2018 The Cochrane Collaboration. Published by John Wiley & Sons, Ltd.
Cifras del artículo
Altmetric:
Citado por:
Autores
Contributions of authors
FP and WH drafted the protocol.
WH developed the search strategy together with Joanne Abbott (PaPaS Information Specialist).
MM, FP and WH selected studies for inclusion and extracted data from the studies.
WH, FP, and MM entered data into Review Manager 5 and carried out the analysis (RevMan 2014).
All review authors interpreted the analysis.
WH drafted the final review.
Sources of support
Internal sources
-
Technische Universität München, Germany
General institutional support
External sources
-
The National Institute for Health Research (NIHR), UK
NIHR Cochrane Programme Grant: 13/89/29 ‐ Addressing the unmet need of chronic pain: providing the evidence for treatments of pain
Declarations of interest
MM: none known; MM is a specialist in palliative care who treats patients with chronic neuropathic pain.
TP: none known; TP is a specialist pain physician and manages patients with neuropathic pain.
LR: none known; PR is a specialist in palliative care who treats patients with chronic neuropathic pain.
FP is a specialist in pain medicine who treats patients with chronic neuropathic pain. He has received speaking fees for one educational lecture for Janssen‐Cilaq (2015) on fibromyalgia and participated in an advisory board for the same company focusing on an unrelated product (2015).
WH is a specialist in general internal medicine, psychosomatic medicine and pain medicine, who treats patients with fibromyalgia and chronic neuropathic pain. He is a member of the medical board of the German Fibromyalgia Association. He is the head of the steering committee of the German guideline on fibromyalgia and a member of the steering committee of the European League Against Rheumatism (EULAR) update recommendations on the management of fibromyalgia. He received speaking fees for one educational lecture from Grünenthal (2015) on pain management.
Acknowledgements
Cochrane Review Group funding acknowledgement: this project was supported by the National Institute for Health Research, via Cochrane Infrastructure funding to Cochrane Pain, Palliative and Supportive Care (PaPaS). The views and opinions expressed therein are those of the review authors and do not necessarily reflect those of the Systematic Reviews Programme, NIHR, NHS or the Department of Health.
The protocol followed the agreed template for neuropathic pain, which was developed in collaboration with Cochrane Musculoskeletal and Cochrane Neuromuscular Diseases. The editorial process was managed by Cochrane Pain, Palliative and Supportive Care.
We thank Joanne Abbott for conducting the searches. We thank Colin Cameron, MD and Alison Moore (consumer) for their valuable reviews.
Version history
| Published | Title | Stage | Authors | Version |
| 2018 Mar 07 | Cannabis‐based medicines for chronic neuropathic pain in adults | Review | Martin Mücke, Tudor Phillips, Lukas Radbruch, Frank Petzke, Winfried Häuser | |
| 2016 May 20 | Cannabinoids for chronic neuropathic pain | Protocol | Martin Mücke, Tudor Phillips, Lukas Radbruch, Frank Petzke, Winfried Häuser | |
Differences between protocol and review
We changed the title of the review from "Cannabinoids" to "Cannabis‐based medicines" because medical cannabis contains compounds other than phytocannabinioids, for example, terpenoids. We updated the Background to reflect new template text. We specified in primary and secondary outcome measures that we preferred composite neuropathic pain scores over single‐scale generic pain scores if both measures were used by studies. We added mean pain intensity as secondary outcome measure. We included the European Union clinical trial register into our search. We added publication bias (all studies funded by the manufacturer of the drug) into the GRADE rating of the quality of evidence, and described our approach to assigning 'very low quality' in some circumstances. We post hoc decided to restrict subgroup analyses to the outcomes as reported in the 'Summary of findings' table. We post hoc decided to perform subgroup analyses of studies with and without publication in peer‐reviewed journals and of studies with high and unclear sample size bias. In the 'Summary of findings' table, we substituted the outcome health‐related quality of life with nervous system disorders and psychiatric disorders as specific adverse events. We removed the planned analysis by tiers of evidence as this is largely replaced by GRADE.
Notes
Assessed for updating in 2020
A restricted search in June 2020 did not identify any potentially relevant studies likely to change the conclusions. Therefore, this review has now been stabilised following discussion with the authors and editors. The review will be assessed for updating in two years. If appropriate we will update the review before this date if new evidence likely to change the conclusions is published, or if standards change substantially which necessitates major revisions.
Keywords
MeSH
Medical Subject Headings (MeSH) Keywords
- Analgesics, Non-Narcotic [adverse effects, *therapeutic use];
- Analgesics, Opioid [therapeutic use];
- Cannabidiol [adverse effects, therapeutic use];
- Chronic Pain [*drug therapy];
- Codeine [analogs & derivatives, therapeutic use];
- Dronabinol [adverse effects, analogs & derivatives, therapeutic use];
- Medical Marijuana [adverse effects, *therapeutic use];
- Neuralgia [*drug therapy];
- Numbers Needed To Treat;
- Randomized Controlled Trials as Topic;
Medical Subject Headings Check Words
Adult; Humans;
PICO
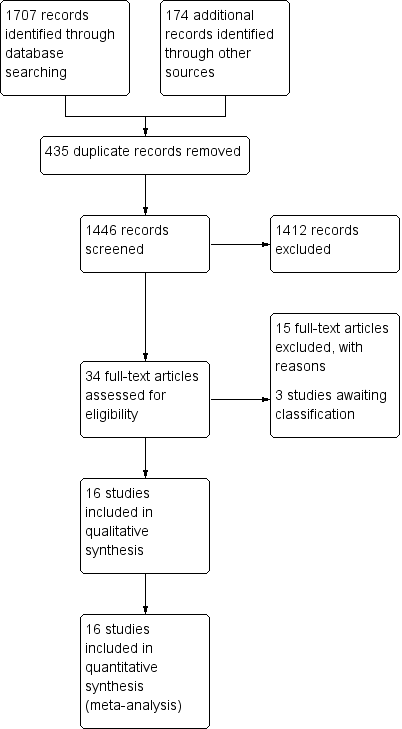
Study flow diagram

'Risk of bias' graph: review authors' judgements about each risk of bias item presented as percentages across all included studies

'Risk of bias' summary: review authors' judgements about each risk of bias item for each included study

Comparison 1: Cannabis‐based medicines versus placebo at final treatment, Outcome 1: Pain relief of 50% or greater

Comparison 1: Cannabis‐based medicines versus placebo at final treatment, Outcome 2: Patient Global Impression much or very much improved

Comparison 1: Cannabis‐based medicines versus placebo at final treatment, Outcome 3: Withdrawals due to adverse events

Comparison 1: Cannabis‐based medicines versus placebo at final treatment, Outcome 4: Serious adverse events

Comparison 1: Cannabis‐based medicines versus placebo at final treatment, Outcome 5: Pain relief of 30% or greater

Comparison 1: Cannabis‐based medicines versus placebo at final treatment, Outcome 6: Mean pain intensity

Comparison 1: Cannabis‐based medicines versus placebo at final treatment, Outcome 7: Health‐related quality of life

Comparison 1: Cannabis‐based medicines versus placebo at final treatment, Outcome 8: Sleep problems

Comparison 1: Cannabis‐based medicines versus placebo at final treatment, Outcome 9: Psychological distress

Comparison 1: Cannabis‐based medicines versus placebo at final treatment, Outcome 10: Withdrawals due to lack of efficacy

Comparison 1: Cannabis‐based medicines versus placebo at final treatment, Outcome 11: Any adverse event

Comparison 1: Cannabis‐based medicines versus placebo at final treatment, Outcome 12: Specific adverse event: nervous system disorders

Comparison 1: Cannabis‐based medicines versus placebo at final treatment, Outcome 13: Specific adverse event: psychiatric disorders
| Cannabis‐based medicines compared with placebo for chronic neuropathic pain | ||||||
| Patient or population: adults with chronic neuropathic pain Settings: outpatient study centres and hospitals in Europe and North America Intervention: cannabis‐based medicines (smoked cannabis; oral plant‐based (dronabinol) or synthetic tetrahydrocannabinol (THC) (nabilone); oromucosal spray of THC and cannabidiol (CBD)) Comparison: placebo | ||||||
| Outcomes | Probable outcome with intervention 95% CI | Probable outcome with placebo | Relative effect Risk difference (95% CI) | No. of participants | Quality of the evidence | Comments |
|---|---|---|---|---|---|---|
| Participant‐reported pain relief of 50% or greater | 209 per 1000 (196 to 222) | 173 per 1000 | 0.05 (0.00 to 0.09) | 1001 (8 studies) | ⊕⊕⊝⊝ low1,2 | NNTB 20 (11 to 100) |
| Patient Global Impression of Change much or very much improved | 261 per 1000 (246 to 276) | 211 per 1000 | 0.09 (0.01 to 0.17) | 1092 (6 studies) | ⊕⊝⊝⊝ very low1,3,4 | NNTB 11 (6 to 100) |
| Withdrawals due to adverse events | 104 per 1000 (99 to 107) | 47 per 1000 | 0.04 (0.02 to 0.07) | 1848 (13 studies) | ⊕⊕⊕⊝ moderate1 | NNTH 25 (16 to 50) |
| Serious adverse events | 66 per 1000 (63 to 69) | 52 per 1000 | 0.01 (‐0.01 to 0.03) | 1876 (13 studies) | ⊕⊕⊝⊝ low1,2 | NNTH not calculated |
| Participant‐reported pain relief of 30% or greater | 377 per 1000 (358 to 396) | 304 per 1000 | 0.09 (0.03 to 0.15) | 1586 (10 studies) | ⊕⊕⊕⊝ moderate1 | NNTB 11 (7 to 33) |
| Specific adverse events:nervous system disorder | 611 per 1000 (576 to 644) | 287 per 1000 | 0.38 (0.18 to 0.58) | 1304 (9 studies) | ⊕⊕⊝⊝ low1,3 | NNTH 3 (2 to 6) |
| Specific adverse events:psychiatric disorders | 165 per 1000 (156 to 174) | 49 per 1000 | 0.10 (0.06 to 0.15) | 1314 (9 studies) | ⊕⊕⊝⊝ low1,3 | NNTH 10 (7 to 16) |
| Abbreviations: | ||||||
| GRADE Working Group grades of evidence High quality: we are very confident that the true effect lies close to that of the estimate of the effect; Moderate quality: we are moderately confident in the effect estimate; the true effect is likely to be close to the estimate of effect, but there is a possibility that it is substantially different; Low quality: our confidence in the effect estimate is limited; the true effect may be substantially different from the estimate of the effect; Very low quality: we have very little confidence in the effect estimate; the true effect is likely to be substantially different from the estimate of effect. | ||||||
| 1 Downgraded once: indirectness. People with current or historical substance abuse, or both, and major medical diseases excluded. 4 Downgraded once: Publication bias. All studies funded by the manufacturer of the drug. | ||||||
| Outcome or subgroup title | No. of studies | No. of participants | Statistical method | Effect size |
| 1.1 Pain relief of 50% or greater Show forest plot | 8 | 1001 | Risk Difference (IV, Random, 95% CI) | 0.05 [0.00, 0.09] |
| 1.1.1 Central pain ‐ multiple sclerosis | 4 | 669 | Risk Difference (IV, Random, 95% CI) | 0.08 [‐0.00, 0.15] |
| 1.1.2 Peripheral pain ‐ chemotherapy‐induced polyneuropathy | 1 | 36 | Risk Difference (IV, Random, 95% CI) | 0.11 [‐0.06, 0.28] |
| 1.1.3 Peripheral pain ‐ diabetic polyneuropathy | 1 | 30 | Risk Difference (IV, Random, 95% CI) | ‐0.20 [‐0.54, 0.14] |
| 1.1.4 Peripheral pain ‐ plexus injury | 1 | 141 | Risk Difference (IV, Random, 95% CI) | 0.01 [‐0.04, 0.06] |
| 1.1.5 Peripheral pain ‐ polyneuropathy of various aetiologies | 1 | 125 | Risk Difference (IV, Random, 95% CI) | 0.13 [0.00, 0.25] |
| 1.2 Patient Global Impression much or very much improved Show forest plot | 6 | 1092 | Risk Difference (IV, Random, 95% CI) | 0.09 [0.01, 0.17] |
| 1.2.1 Central pain ‐ multiple sclerosis | 2 | 397 | Risk Difference (IV, Random, 95% CI) | 0.06 [‐0.01, 0.14] |
| 1.2.2 Central pain ‐ spinal cord injury | 1 | 116 | Risk Difference (IV, Random, 95% CI) | 0.34 [0.17, 0.50] |
| 1.2.3 Peripheral pain ‐ diabetic polyneuropathy | 1 | 281 | Risk Difference (IV, Random, 95% CI) | 0.02 [‐0.09, 0.14] |
| 1.2.4 Peripheral pain ‐ polyneuropathy of various aetiologies | 1 | 228 | Risk Difference (IV, Random, 95% CI) | 0.08 [‐0.02, 0.17] |
| 1.2.5 Central or peripheral pain ‐ various aetiologies | 1 | 70 | Risk Difference (IV, Random, 95% CI) | ‐0.01 [‐0.22, 0.19] |
| 1.3 Withdrawals due to adverse events Show forest plot | 13 | 1848 | Risk Difference (IV, Random, 95% CI) | 0.04 [0.02, 0.07] |
| 1.3.1 Central pain ‐ multiple sclerosis | 4 | 693 | Risk Difference (IV, Random, 95% CI) | 0.04 [0.01, 0.08] |
| 1.3.2 Central pain ‐ spinal cord injury | 1 | 116 | Risk Difference (IV, Random, 95% CI) | 0.09 [0.01, 0.17] |
| 1.3.3 Peripheral pain ‐ chemotherapy‐induced polyneuropathy | 1 | 36 | Risk Difference (IV, Random, 95% CI) | 0.00 [‐0.10, 0.10] |
| 1.3.4 Peripheral pain ‐ diabetic polyneuropathy | 1 | 297 | Risk Difference (IV, Random, 95% CI) | 0.12 [0.04, 0.20] |
| 1.3.5 Peripheral pain ‐ HIV polyneuropathy | 1 | 68 | Risk Difference (IV, Random, 95% CI) | 0.00 [‐0.13, 0.13] |
| 1.3.6 Peripheral pain ‐ plexus injury | 1 | 141 | Risk Difference (IV, Random, 95% CI) | 0.01 [‐0.04, 0.06] |
| 1.3.7 Peripheral pain ‐ polyneuropathy of various aetiologies | 3 | 427 | Risk Difference (IV, Random, 95% CI) | 0.08 [0.02, 0.13] |
| 1.3.8 Central and peripheral pain ‐ various aetiologies | 1 | 70 | Risk Difference (IV, Random, 95% CI) | ‐0.06 [‐0.19, 0.07] |
| 1.4 Serious adverse events Show forest plot | 13 | 1876 | Risk Difference (IV, Random, 95% CI) | 0.01 [‐0.01, 0.03] |
| 1.4.1 Central pain ‐ multiple sclerosis | 4 | 693 | Risk Difference (IV, Random, 95% CI) | 0.03 [‐0.01, 0.06] |
| 1.4.2 Central pain ‐ spinal cord injury | 1 | 116 | Risk Difference (IV, Random, 95% CI) | 0.02 [‐0.05, 0.09] |
| 1.4.3 Peripheral pain ‐ chemotherapy‐induced neuropathy | 1 | 36 | Risk Difference (IV, Random, 95% CI) | 0.00 [‐0.10, 0.10] |
| 1.4.4 Peripheral pain ‐ diabetic polyneuropathy | 1 | 297 | Risk Difference (IV, Random, 95% CI) | 0.01 [‐0.05, 0.08] |
| 1.4.5 Peripheral pain ‐ HIV polyneuropathy | 1 | 68 | Risk Difference (IV, Random, 95% CI) | 0.03 [‐0.07, 0.13] |
| 1.4.6 Peripheral pain ‐ plexus injury | 1 | 141 | Risk Difference (IV, Random, 95% CI) | 0.00 [‐0.03, 0.03] |
| 1.4.7 Peripheral pain ‐ polyneuropathies of various aetiologies | 3 | 455 | Risk Difference (IV, Random, 95% CI) | 0.01 [‐0.02, 0.04] |
| 1.4.8 Central and peripheral pain ‐ various aetiologies | 1 | 70 | Risk Difference (IV, Random, 95% CI) | ‐0.06 [‐0.15, 0.03] |
| 1.5 Pain relief of 30% or greater Show forest plot | 10 | 1586 | Risk Difference (IV, Random, 95% CI) | 0.09 [0.03, 0.15] |
| 1.5.1 Central pain ‐ multiple sclerosis | 3 | 645 | Risk Difference (IV, Random, 95% CI) | 0.11 [‐0.03, 0.25] |
| 1.5.2 Peripheral pain ‐ chemotherapy‐induced polyneuropathy | 1 | 36 | Risk Difference (IV, Random, 95% CI) | 0.11 [‐0.16, 0.38] |
| 1.5.3 Peripheral pain ‐ diabetic polyneuropathy | 2 | 327 | Risk Difference (IV, Random, 95% CI) | ‐0.04 [‐0.14, 0.07] |
| 1.5.4 Peripheral pain ‐ HIV polyneuropathy | 1 | 56 | Risk Difference (IV, Random, 95% CI) | 0.29 [0.05, 0.52] |
| 1.5.5 Peripheral pain ‐ plexus injury | 1 | 141 | Risk Difference (IV, Random, 95% CI) | 0.10 [‐0.06, 0.25] |
| 1.5.6 Peripheral pain ‐ polyneuropathy of various aetiologies | 2 | 381 | Risk Difference (IV, Random, 95% CI) | 0.11 [0.03, 0.19] |
| 1.6 Mean pain intensity Show forest plot | 14 | 1837 | Std. Mean Difference (IV, Random, 95% CI) | ‐0.35 [‐0.60, ‐0.09] |
| 1.6.1 Central pain ‐ multiple sclerosis | 4 | 668 | Std. Mean Difference (IV, Random, 95% CI) | ‐0.10 [‐0.25, 0.05] |
| 1.6.2 Central pain ‐ spinal cord injury | 1 | 114 | Std. Mean Difference (IV, Random, 95% CI) | ‐0.04 [‐0.41, 0.33] |
| 1.6.3 Peripheral pain ‐ chemotherapy‐induced polyneuropathy | 1 | 36 | Std. Mean Difference (IV, Random, 95% CI) | ‐0.20 [‐0.86, 0.45] |
| 1.6.4 Peripheral pain ‐ diabetic polyneuropathy | 2 | 324 | Std. Mean Difference (IV, Random, 95% CI) | ‐0.05 [‐0.27, 0.17] |
| 1.6.5 Peripheral pain ‐ HIV polyneuropathy | 1 | 56 | Std. Mean Difference (IV, Random, 95% CI) | ‐0.41 [‐0.94, 0.12] |
| 1.6.6 Peripheral pain ‐ plexus injury | 1 | 141 | Std. Mean Difference (IV, Random, 95% CI) | ‐0.43 [‐0.79, ‐0.08] |
| 1.6.7 Peripheral pain ‐ polyneuropathy of various aetiologies | 3 | 428 | Std. Mean Difference (IV, Random, 95% CI) | ‐0.65 [‐1.75, 0.44] |
| 1.6.8 Central and peripheral pain ‐ various aetiologies | 1 | 70 | Std. Mean Difference (IV, Random, 95% CI) | ‐0.24 [‐0.71, 0.23] |
| 1.7 Health‐related quality of life Show forest plot | 9 | 1284 | Std. Mean Difference (IV, Random, 95% CI) | 0.02 [‐0.10, 0.13] |
| 1.7.1 Central pain ‐ multiple sclerosis | 2 | 363 | Std. Mean Difference (IV, Random, 95% CI) | ‐0.07 [‐0.27, 0.14] |
| 1.7.2 Central pain ‐ spinal cord injury | 1 | 113 | Std. Mean Difference (IV, Random, 95% CI) | 0.00 [‐0.37, 0.37] |
| 1.7.3 Peripheral pain ‐ diabetic polyneuropathy | 2 | 303 | Std. Mean Difference (IV, Random, 95% CI) | 0.17 [‐0.06, 0.39] |
| 1.7.4 Peripheral pain ‐ plexus injury | 1 | 141 | Std. Mean Difference (IV, Random, 95% CI) | ‐0.07 [‐0.42, 0.28] |
| 1.7.5 Peripheral pain of various aetiologies | 2 | 300 | Std. Mean Difference (IV, Random, 95% CI) | ‐0.03 [‐0.26, 0.21] |
| 1.7.6 Central and peripheral pain ‐ various aetiologies | 1 | 64 | Std. Mean Difference (IV, Random, 95% CI) | 0.15 [‐0.35, 0.64] |
| 1.8 Sleep problems Show forest plot | 8 | 1386 | Std. Mean Difference (IV, Random, 95% CI) | ‐0.47 [‐0.90, ‐0.04] |
| 1.8.1 Central pain ‐ multiple sclerosis | 1 | 339 | Std. Mean Difference (IV, Random, 95% CI) | 0.01 [‐0.21, 0.22] |
| 1.8.2 Central pain ‐ spinal cord injury | 1 | 114 | Std. Mean Difference (IV, Random, 95% CI) | ‐0.04 [‐0.41, 0.32] |
| 1.8.3 Peripheral pain ‐ diabetic polyneuropathy | 1 | 274 | Std. Mean Difference (IV, Random, 95% CI) | ‐0.14 [‐0.38, 0.10] |
| 1.8.4 Peripheral pain ‐ plexus injury | 1 | 141 | Std. Mean Difference (IV, Random, 95% CI) | ‐0.42 [‐0.78, ‐0.07] |
| 1.8.5 Peripheral pain ‐ polyneuropathy of various aetiologies | 3 | 448 | Std. Mean Difference (IV, Random, 95% CI) | ‐0.78 [‐2.17, 0.61] |
| 1.8.6 Central and peripheral pain ‐ various aetiologies | 1 | 70 | Std. Mean Difference (IV, Random, 95% CI) | ‐0.31 [‐0.78, 0.16] |
| 1.9 Psychological distress Show forest plot | 7 | 779 | Std. Mean Difference (IV, Random, 95% CI) | ‐0.32 [‐0.61, ‐0.02] |
| 1.9.1 Central pain ‐ multiple sclerosis | 2 | 363 | Std. Mean Difference (IV, Random, 95% CI) | ‐0.03 [‐0.65, 0.59] |
| 1.9.2 Peripheral pain ‐ chemotherapy‐induced polyneuropathy | 1 | 36 | Std. Mean Difference (IV, Random, 95% CI) | ‐1.07 [‐1.78, ‐0.37] |
| 1.9.3 Peripheral pain ‐ diabetic polyneuropathy | 1 | 30 | Std. Mean Difference (IV, Random, 95% CI) | ‐0.25 [‐0.97, 0.47] |
| 1.9.4 Peripheral pain ‐ plexus injury | 1 | 141 | Std. Mean Difference (IV, Random, 95% CI) | ‐0.27 [‐0.62, 0.08] |
| 1.9.5 Peripheral pain ‐ polyneuropathy of various aetiologies | 2 | 209 | Std. Mean Difference (IV, Random, 95% CI) | ‐0.48 [‐0.80, ‐0.16] |
| 1.10 Withdrawals due to lack of efficacy Show forest plot | 9 | 1576 | Risk Difference (IV, Random, 95% CI) | ‐0.00 [‐0.02, 0.01] |
| 1.10.1 Central pain ‐ multiple sclerosis | 4 | 697 | Risk Difference (IV, Random, 95% CI) | 0.00 [‐0.02, 0.02] |
| 1.10.2 Peripheral pain ‐ diabetic polyneuropathy | 1 | 297 | Risk Difference (IV, Random, 95% CI) | ‐0.01 [‐0.05, 0.03] |
| 1.10.3 Peripheral pain ‐ plexus injury | 1 | 141 | Risk Difference (IV, Random, 95% CI) | 0.00 [‐0.04, 0.04] |
| 1.10.4 Peripheral pain ‐ polyneuropathy of various aetiologies | 2 | 371 | Risk Difference (IV, Random, 95% CI) | ‐0.04 [‐0.09, 0.01] |
| 1.10.5 Central and peripheral pain ‐ various aetiologies | 1 | 70 | Risk Difference (IV, Random, 95% CI) | 0.00 [‐0.05, 0.05] |
| 1.11 Any adverse event Show forest plot | 7 | 1356 | Risk Difference (IV, Random, 95% CI) | 0.19 [0.12, 0.27] |
| 1.11.1 Central pain ‐ multiple sclerosis | 3 | 627 | Risk Difference (IV, Random, 95% CI) | 0.22 [0.05, 0.39] |
| 1.11.2 Central pain ‐ spinal cord injury | 1 | 116 | Risk Difference (IV, Random, 95% CI) | 0.34 [0.18, 0.50] |
| 1.11.3 Peripheral pain ‐ diabetic polyneuropathy | 1 | 297 | Risk Difference (IV, Random, 95% CI) | 0.12 [0.02, 0.22] |
| 1.11.4 Peripheral pain ‐ polyneuropathy of various aetiologies | 1 | 246 | Risk Difference (IV, Random, 95% CI) | 0.15 [0.05, 0.25] |
| 1.11.5 Central and peripheral pain ‐ various aetiologies | 1 | 70 | Risk Difference (IV, Random, 95% CI) | 0.21 [0.06, 0.36] |
| 1.12 Specific adverse event: nervous system disorders Show forest plot | 9 | 1304 | Risk Difference (IV, Random, 95% CI) | 0.38 [0.18, 0.58] |
| 1.12.1 Central pain ‐ multiple sclerosis | 3 | 453 | Risk Difference (IV, Random, 95% CI) | 0.33 [0.09, 0.58] |
| 1.12.2 Central pain ‐ spinal cord injury | 1 | 116 | Risk Difference (IV, Random, 95% CI) | 0.53 [0.38, 0.68] |
| 1.12.3 Peripheral pain ‐chemotherapy‐induced polyneuropathy | 1 | 36 | Risk Difference (IV, Random, 95% CI) | 1.00 [0.90, 1.10] |
| 1.12.4 Peripheral pain ‐ diabetic polyneuropathy | 1 | 297 | Risk Difference (IV, Random, 95% CI) | 0.26 [0.15, 0.37] |
| 1.12.5 Peripheral pain ‐ polyneuropathy of various aetiologies | 2 | 332 | Risk Difference (IV, Random, 95% CI) | 0.29 [0.19, 0.39] |
| 1.12.6 Central and peripheral pain ‐ various aetiologies | 1 | 70 | Risk Difference (IV, Random, 95% CI) | 0.37 [0.15, 0.58] |
| 1.13 Specific adverse event: psychiatric disorders Show forest plot | 9 | 1314 | Risk Difference (IV, Random, 95% CI) | 0.10 [0.06, 0.15] |
| 1.13.1 Central pain ‐ multiple sclerosis | 3 | 453 | Risk Difference (IV, Random, 95% CI) | 0.10 [0.05, 0.16] |
| 1.13.2 Central pain ‐ spinal cord injury | 1 | 116 | Risk Difference (IV, Random, 95% CI) | 0.00 [‐0.06, 0.07] |
| 1.13.3 Peripheral pain ‐ chemotherapy‐induced polyneuropathy | 1 | 36 | Risk Difference (IV, Random, 95% CI) | 0.11 [‐0.06, 0.28] |
| 1.13.4 Peripheral pain ‐ diabetic polyneuropathy | 1 | 297 | Risk Difference (IV, Random, 95% CI) | 0.05 [0.01, 0.09] |
| 1.13.5 Peripheral pain ‐ polyneuropathy of various aetiologies | 2 | 342 | Risk Difference (IV, Random, 95% CI) | 0.21 [0.14, 0.29] |
| 1.13.6 Central and peripheral pain ‐ various aetiologies | 1 | 70 | Risk Difference (IV, Random, 95% CI) | 0.11 [‐0.05, 0.27] |