Fármacos con cannabis para el dolor neuropático crónico en pacientes adultos
Appendices
Appendix 1. Methodological considerations for chronic pain
There have been several recent changes in how the efficacy of conventional and unconventional treatments is assessed in chronic painful conditions. The outcomes are now better defined, particularly with new criteria for what constitutes moderate or substantial benefit (Dworkin 2008); older trials may only report participants with 'any improvement'. Newer trials tend to be larger, avoiding problems from the random play of chance. Newer trials also tend to be of longer duration, up to 12 weeks, and longer trials provide a more rigorous and valid assessment of efficacy in chronic conditions. New standards have evolved for assessing efficacy in neuropathic pain, and we are now applying stricter criteria for the inclusion of trials and assessment of outcomes, and are more aware of problems that may affect our overall assessment. Below we have summarised some of the recent insights that must be considered in this new review.
-
Pain results tend to have a U‐shaped distribution rather than a bell‐shaped distribution. This is true in acute pain (Moore 2011a; Moore 2011b), back pain (Moore 2010c), and arthritis (Moore 2010d), as well as in fibromyalgia (Straube 2010); in all cases average results usually describe the experience of almost no‐one in the trial. Data expressed as averages are potentially misleading, unless they can be proven to be suitable.
-
As a consequence, we have to depend on dichotomous results (the individual either has or does not have the outcome) usually from pain changes or patient global assessments. The Initiative on Methods, Measurement, and Pain Assessment in Clinical Trials (IMMPACT) group has helped with their definitions of minimal, moderate, and substantial improvement (Dworkin 2008). In arthritis, trials of less than 12 weeks' duration, and especially those shorter than eight weeks, overestimate the effect of treatment (Moore 2010c); the effect is particularly strong for less effective analgesics, and this may also be relevant in neuropathic‐type pain.
-
The proportion of patients with at least moderate benefit can be small, even with an effective medicine, falling from 60% with an effective medicine in arthritis to 30% in fibromyalgia (Moore 2009; Moore 2010c; Moore 2010d; Moore 2013b; Moore 2017; Straube 2008; Sultan 2008). A Cochrane Review of pregabalin in neuropathic pain and fibromyalgia demonstrated different response rates for different types of chronic pain (higher in diabetic neuropathy and postherpetic neuralgia and lower in central pain and fibromyalgia) (Moore 2009). This indicates that different neuropathic pain conditions should be treated separately from one another, and that pooling should not be done unless there are good grounds for doing so.
-
Individual patient analyses indicate that patients who get good pain relief (moderate or better) have major benefits in many other outcomes, affecting quality of life in a significant way (Moore 2010b; Moore 2014a).
-
Imputation methods such as last observation carried forward (LOCF), used when participants withdraw from clinical trials, can overstate drug efficacy especially when adverse event withdrawals with drug are greater than those with placebo (Moore 2012).
Appendix 2. Databases, search strategies and hits retrieved
CENTRAL (CRSO)
#1 MESH DESCRIPTOR Cannabis
#2 ((cannabi* or hash* or hemp or marijuana or marihuana or ganja or bhang)):TI,AB,KY
#3 MESH DESCRIPTOR Dronabinol
#4 ((dronabinol or marinol or nabilone or cesamet or dexanabinol or tetrahydrocannabinol or sativex or "HU 211")):TI,AB,KY
#5 #1 OR #2 OR #3 OR #4
#6 MESH DESCRIPTOR Neuralgia EXPLODE ALL TREES
#7 ((pain* or neuralgia or neuropathic)):TI,AB,KY
#9 #6 OR#7
#10 #5 AND #9
May 2016: 202
November 2017: 62
MEDLINE (OVID)
| 1. Cannabis/ |
| 2. (cannabi* or hash* or hemp or marijuana or marihuana or ganja or bhang).tw. |
| 3. Dronabinol/ |
| 4. (dronabinol or marinol or nabilone or cesamet or dexanabinol or tetrahydrocannabinol or sativex or "HU 211").tw. |
| 5. or/1‐4 |
| 6. exp Neuralgia/ |
| 7. (pain* or neuralgia or neuropathic).tw. |
| 8. 6 or 7 |
| 9. 5 and 8 |
| 10. randomized controlled trial.pt. |
| 11. controlled clinical trial.pt. |
| 12. randomized.ab. |
| 13. placebo.ab. |
| 14. drug therapy.fs. |
| 15. randomly.ab. |
| 16. trial.ab. |
| 17. groups.ab. |
| 18. 10 or 11 or 12 or 13 or 14 or 15 or 16 or 17 |
| 19. exp animals/ not humans.sh. |
| 20. 18 not 19 |
| 21. 9 and 20 |
May 2016: 772
November 2017: 177
Embase (OVID)
| 1. Cannabis/ | |
| 2. (cannabi* or hash* or hemp or marijuana or marihuana or ganja or bhang).tw. | |
| 3. Dronabinol/ | |
| 4. (dronabinol or marinol or nabilone or cesamet or dexanabinol or tetrahydrocannabinol or sativex or "HU 211").tw. | |
| 5. or/1‐4 | |
| 6. exp Neuralgia/ | |
| 7. (pain* or neuralgia or neuropathic).tw. | |
| 8. 6 or 7 | |
| 9. 5 and 8 | |
| 10. random$.tw. | |
| 11. factorial$.tw. | |
| 12. crossover$.tw. | |
| 13. cross over$.tw. | |
| 14. cross‐over$.tw. | |
| 15. placebo$.tw. | |
| 16. (doubl$ adj blind$).tw. | |
| 17. (singl$ adj blind$).tw. | |
| 18. assign$.tw. | |
| 19. allocat$.tw. | |
| 20. volunteer$.tw. | |
| 21. Crossover Procedure/ | |
| 22. double‐blind procedure.tw. | |
| 23. Randomized Controlled Trial/ | |
| 24. Single Blind Procedure/ | |
| 25. or/10‐24 | |
| 26. (animal/ or nonhuman/) not human/ | |
| 27. 25 not 26 | |
| 28. 9 and 27 |
May 2016: 417
November 2017: 77
European Union clinical trial register
November 2017: Neuropathic pain AND (cannabis OR cannabinoids): 3
U.S. National Institutes of Health clinical trial register
November 2017: Neuropathic pain AND (cannabis OR cannabinoids): 27
World Health Organization (WHO) International Clinical Trials Registry Platform
November 2017: Neuropathic pain AND (cannabis OR cannabinoids); 116
International Association for Cannabinoid Medicines (IACM) databank
November 2017: Neuropathic pain and controlled study: 28
Appendix 3. GRADE: criteria for assigning grade of evidence
The GRADE system uses the following criteria for assigning a quality level to a body of evidence (Chapter 12, Schünemann 2011).
-
High: randomised trials; or double‐upgraded observational studies
-
Moderate: downgraded randomised trials; or upgraded observational studies
-
Low: double‐downgraded randomised trials; or observational studies
-
Very low: triple‐downgraded randomised trials; or downgraded observational studies; or case series/case reports
Factors that may decrease the quality level of a body of evidence are:
-
limitations in the design and implementation of available studies suggesting high likelihood of bias;
-
indirectness of evidence (indirect population, intervention, control, outcomes);
-
unexplained heterogeneity or inconsistency of results (including problems with subgroup analyses);
-
imprecision of results (wide confidence intervals; confidence interval including zero; low number of events);
-
high probability of publication bias.
Factors that may increase the quality level of a body of evidence are:
-
large magnitude of effect;
-
all plausible confounding would reduce a demonstrated effect or suggest a spurious effect when results show no effect;
-
dose‐response gradient.
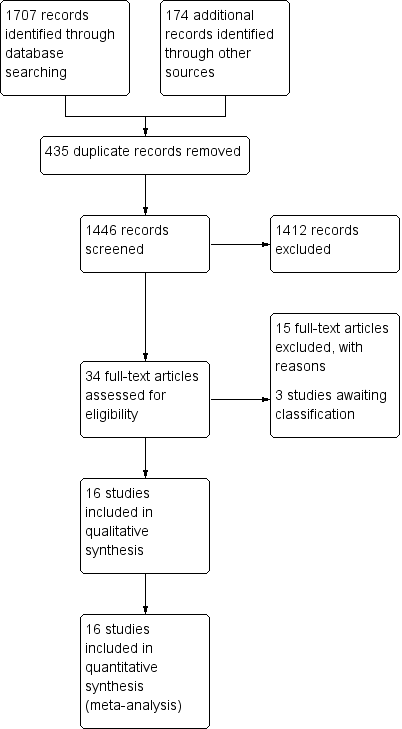
Study flow diagram

'Risk of bias' graph: review authors' judgements about each risk of bias item presented as percentages across all included studies

'Risk of bias' summary: review authors' judgements about each risk of bias item for each included study

Comparison 1: Cannabis‐based medicines versus placebo at final treatment, Outcome 1: Pain relief of 50% or greater

Comparison 1: Cannabis‐based medicines versus placebo at final treatment, Outcome 2: Patient Global Impression much or very much improved

Comparison 1: Cannabis‐based medicines versus placebo at final treatment, Outcome 3: Withdrawals due to adverse events

Comparison 1: Cannabis‐based medicines versus placebo at final treatment, Outcome 4: Serious adverse events

Comparison 1: Cannabis‐based medicines versus placebo at final treatment, Outcome 5: Pain relief of 30% or greater

Comparison 1: Cannabis‐based medicines versus placebo at final treatment, Outcome 6: Mean pain intensity

Comparison 1: Cannabis‐based medicines versus placebo at final treatment, Outcome 7: Health‐related quality of life

Comparison 1: Cannabis‐based medicines versus placebo at final treatment, Outcome 8: Sleep problems

Comparison 1: Cannabis‐based medicines versus placebo at final treatment, Outcome 9: Psychological distress

Comparison 1: Cannabis‐based medicines versus placebo at final treatment, Outcome 10: Withdrawals due to lack of efficacy

Comparison 1: Cannabis‐based medicines versus placebo at final treatment, Outcome 11: Any adverse event

Comparison 1: Cannabis‐based medicines versus placebo at final treatment, Outcome 12: Specific adverse event: nervous system disorders

Comparison 1: Cannabis‐based medicines versus placebo at final treatment, Outcome 13: Specific adverse event: psychiatric disorders
| Cannabis‐based medicines compared with placebo for chronic neuropathic pain | ||||||
| Patient or population: adults with chronic neuropathic pain Settings: outpatient study centres and hospitals in Europe and North America Intervention: cannabis‐based medicines (smoked cannabis; oral plant‐based (dronabinol) or synthetic tetrahydrocannabinol (THC) (nabilone); oromucosal spray of THC and cannabidiol (CBD)) Comparison: placebo | ||||||
| Outcomes | Probable outcome with intervention 95% CI | Probable outcome with placebo | Relative effect Risk difference (95% CI) | No. of participants | Quality of the evidence | Comments |
|---|---|---|---|---|---|---|
| Participant‐reported pain relief of 50% or greater | 209 per 1000 (196 to 222) | 173 per 1000 | 0.05 (0.00 to 0.09) | 1001 (8 studies) | ⊕⊕⊝⊝ low1,2 | NNTB 20 (11 to 100) |
| Patient Global Impression of Change much or very much improved | 261 per 1000 (246 to 276) | 211 per 1000 | 0.09 (0.01 to 0.17) | 1092 (6 studies) | ⊕⊝⊝⊝ very low1,3,4 | NNTB 11 (6 to 100) |
| Withdrawals due to adverse events | 104 per 1000 (99 to 107) | 47 per 1000 | 0.04 (0.02 to 0.07) | 1848 (13 studies) | ⊕⊕⊕⊝ moderate1 | NNTH 25 (16 to 50) |
| Serious adverse events | 66 per 1000 (63 to 69) | 52 per 1000 | 0.01 (‐0.01 to 0.03) | 1876 (13 studies) | ⊕⊕⊝⊝ low1,2 | NNTH not calculated |
| Participant‐reported pain relief of 30% or greater | 377 per 1000 (358 to 396) | 304 per 1000 | 0.09 (0.03 to 0.15) | 1586 (10 studies) | ⊕⊕⊕⊝ moderate1 | NNTB 11 (7 to 33) |
| Specific adverse events:nervous system disorder | 611 per 1000 (576 to 644) | 287 per 1000 | 0.38 (0.18 to 0.58) | 1304 (9 studies) | ⊕⊕⊝⊝ low1,3 | NNTH 3 (2 to 6) |
| Specific adverse events:psychiatric disorders | 165 per 1000 (156 to 174) | 49 per 1000 | 0.10 (0.06 to 0.15) | 1314 (9 studies) | ⊕⊕⊝⊝ low1,3 | NNTH 10 (7 to 16) |
| Abbreviations: | ||||||
| GRADE Working Group grades of evidence High quality: we are very confident that the true effect lies close to that of the estimate of the effect; Moderate quality: we are moderately confident in the effect estimate; the true effect is likely to be close to the estimate of effect, but there is a possibility that it is substantially different; Low quality: our confidence in the effect estimate is limited; the true effect may be substantially different from the estimate of the effect; Very low quality: we have very little confidence in the effect estimate; the true effect is likely to be substantially different from the estimate of effect. | ||||||
| 1 Downgraded once: indirectness. People with current or historical substance abuse, or both, and major medical diseases excluded. 4 Downgraded once: Publication bias. All studies funded by the manufacturer of the drug. | ||||||
| Outcome or subgroup title | No. of studies | No. of participants | Statistical method | Effect size |
| 1.1 Pain relief of 50% or greater Show forest plot | 8 | 1001 | Risk Difference (IV, Random, 95% CI) | 0.05 [0.00, 0.09] |
| 1.1.1 Central pain ‐ multiple sclerosis | 4 | 669 | Risk Difference (IV, Random, 95% CI) | 0.08 [‐0.00, 0.15] |
| 1.1.2 Peripheral pain ‐ chemotherapy‐induced polyneuropathy | 1 | 36 | Risk Difference (IV, Random, 95% CI) | 0.11 [‐0.06, 0.28] |
| 1.1.3 Peripheral pain ‐ diabetic polyneuropathy | 1 | 30 | Risk Difference (IV, Random, 95% CI) | ‐0.20 [‐0.54, 0.14] |
| 1.1.4 Peripheral pain ‐ plexus injury | 1 | 141 | Risk Difference (IV, Random, 95% CI) | 0.01 [‐0.04, 0.06] |
| 1.1.5 Peripheral pain ‐ polyneuropathy of various aetiologies | 1 | 125 | Risk Difference (IV, Random, 95% CI) | 0.13 [0.00, 0.25] |
| 1.2 Patient Global Impression much or very much improved Show forest plot | 6 | 1092 | Risk Difference (IV, Random, 95% CI) | 0.09 [0.01, 0.17] |
| 1.2.1 Central pain ‐ multiple sclerosis | 2 | 397 | Risk Difference (IV, Random, 95% CI) | 0.06 [‐0.01, 0.14] |
| 1.2.2 Central pain ‐ spinal cord injury | 1 | 116 | Risk Difference (IV, Random, 95% CI) | 0.34 [0.17, 0.50] |
| 1.2.3 Peripheral pain ‐ diabetic polyneuropathy | 1 | 281 | Risk Difference (IV, Random, 95% CI) | 0.02 [‐0.09, 0.14] |
| 1.2.4 Peripheral pain ‐ polyneuropathy of various aetiologies | 1 | 228 | Risk Difference (IV, Random, 95% CI) | 0.08 [‐0.02, 0.17] |
| 1.2.5 Central or peripheral pain ‐ various aetiologies | 1 | 70 | Risk Difference (IV, Random, 95% CI) | ‐0.01 [‐0.22, 0.19] |
| 1.3 Withdrawals due to adverse events Show forest plot | 13 | 1848 | Risk Difference (IV, Random, 95% CI) | 0.04 [0.02, 0.07] |
| 1.3.1 Central pain ‐ multiple sclerosis | 4 | 693 | Risk Difference (IV, Random, 95% CI) | 0.04 [0.01, 0.08] |
| 1.3.2 Central pain ‐ spinal cord injury | 1 | 116 | Risk Difference (IV, Random, 95% CI) | 0.09 [0.01, 0.17] |
| 1.3.3 Peripheral pain ‐ chemotherapy‐induced polyneuropathy | 1 | 36 | Risk Difference (IV, Random, 95% CI) | 0.00 [‐0.10, 0.10] |
| 1.3.4 Peripheral pain ‐ diabetic polyneuropathy | 1 | 297 | Risk Difference (IV, Random, 95% CI) | 0.12 [0.04, 0.20] |
| 1.3.5 Peripheral pain ‐ HIV polyneuropathy | 1 | 68 | Risk Difference (IV, Random, 95% CI) | 0.00 [‐0.13, 0.13] |
| 1.3.6 Peripheral pain ‐ plexus injury | 1 | 141 | Risk Difference (IV, Random, 95% CI) | 0.01 [‐0.04, 0.06] |
| 1.3.7 Peripheral pain ‐ polyneuropathy of various aetiologies | 3 | 427 | Risk Difference (IV, Random, 95% CI) | 0.08 [0.02, 0.13] |
| 1.3.8 Central and peripheral pain ‐ various aetiologies | 1 | 70 | Risk Difference (IV, Random, 95% CI) | ‐0.06 [‐0.19, 0.07] |
| 1.4 Serious adverse events Show forest plot | 13 | 1876 | Risk Difference (IV, Random, 95% CI) | 0.01 [‐0.01, 0.03] |
| 1.4.1 Central pain ‐ multiple sclerosis | 4 | 693 | Risk Difference (IV, Random, 95% CI) | 0.03 [‐0.01, 0.06] |
| 1.4.2 Central pain ‐ spinal cord injury | 1 | 116 | Risk Difference (IV, Random, 95% CI) | 0.02 [‐0.05, 0.09] |
| 1.4.3 Peripheral pain ‐ chemotherapy‐induced neuropathy | 1 | 36 | Risk Difference (IV, Random, 95% CI) | 0.00 [‐0.10, 0.10] |
| 1.4.4 Peripheral pain ‐ diabetic polyneuropathy | 1 | 297 | Risk Difference (IV, Random, 95% CI) | 0.01 [‐0.05, 0.08] |
| 1.4.5 Peripheral pain ‐ HIV polyneuropathy | 1 | 68 | Risk Difference (IV, Random, 95% CI) | 0.03 [‐0.07, 0.13] |
| 1.4.6 Peripheral pain ‐ plexus injury | 1 | 141 | Risk Difference (IV, Random, 95% CI) | 0.00 [‐0.03, 0.03] |
| 1.4.7 Peripheral pain ‐ polyneuropathies of various aetiologies | 3 | 455 | Risk Difference (IV, Random, 95% CI) | 0.01 [‐0.02, 0.04] |
| 1.4.8 Central and peripheral pain ‐ various aetiologies | 1 | 70 | Risk Difference (IV, Random, 95% CI) | ‐0.06 [‐0.15, 0.03] |
| 1.5 Pain relief of 30% or greater Show forest plot | 10 | 1586 | Risk Difference (IV, Random, 95% CI) | 0.09 [0.03, 0.15] |
| 1.5.1 Central pain ‐ multiple sclerosis | 3 | 645 | Risk Difference (IV, Random, 95% CI) | 0.11 [‐0.03, 0.25] |
| 1.5.2 Peripheral pain ‐ chemotherapy‐induced polyneuropathy | 1 | 36 | Risk Difference (IV, Random, 95% CI) | 0.11 [‐0.16, 0.38] |
| 1.5.3 Peripheral pain ‐ diabetic polyneuropathy | 2 | 327 | Risk Difference (IV, Random, 95% CI) | ‐0.04 [‐0.14, 0.07] |
| 1.5.4 Peripheral pain ‐ HIV polyneuropathy | 1 | 56 | Risk Difference (IV, Random, 95% CI) | 0.29 [0.05, 0.52] |
| 1.5.5 Peripheral pain ‐ plexus injury | 1 | 141 | Risk Difference (IV, Random, 95% CI) | 0.10 [‐0.06, 0.25] |
| 1.5.6 Peripheral pain ‐ polyneuropathy of various aetiologies | 2 | 381 | Risk Difference (IV, Random, 95% CI) | 0.11 [0.03, 0.19] |
| 1.6 Mean pain intensity Show forest plot | 14 | 1837 | Std. Mean Difference (IV, Random, 95% CI) | ‐0.35 [‐0.60, ‐0.09] |
| 1.6.1 Central pain ‐ multiple sclerosis | 4 | 668 | Std. Mean Difference (IV, Random, 95% CI) | ‐0.10 [‐0.25, 0.05] |
| 1.6.2 Central pain ‐ spinal cord injury | 1 | 114 | Std. Mean Difference (IV, Random, 95% CI) | ‐0.04 [‐0.41, 0.33] |
| 1.6.3 Peripheral pain ‐ chemotherapy‐induced polyneuropathy | 1 | 36 | Std. Mean Difference (IV, Random, 95% CI) | ‐0.20 [‐0.86, 0.45] |
| 1.6.4 Peripheral pain ‐ diabetic polyneuropathy | 2 | 324 | Std. Mean Difference (IV, Random, 95% CI) | ‐0.05 [‐0.27, 0.17] |
| 1.6.5 Peripheral pain ‐ HIV polyneuropathy | 1 | 56 | Std. Mean Difference (IV, Random, 95% CI) | ‐0.41 [‐0.94, 0.12] |
| 1.6.6 Peripheral pain ‐ plexus injury | 1 | 141 | Std. Mean Difference (IV, Random, 95% CI) | ‐0.43 [‐0.79, ‐0.08] |
| 1.6.7 Peripheral pain ‐ polyneuropathy of various aetiologies | 3 | 428 | Std. Mean Difference (IV, Random, 95% CI) | ‐0.65 [‐1.75, 0.44] |
| 1.6.8 Central and peripheral pain ‐ various aetiologies | 1 | 70 | Std. Mean Difference (IV, Random, 95% CI) | ‐0.24 [‐0.71, 0.23] |
| 1.7 Health‐related quality of life Show forest plot | 9 | 1284 | Std. Mean Difference (IV, Random, 95% CI) | 0.02 [‐0.10, 0.13] |
| 1.7.1 Central pain ‐ multiple sclerosis | 2 | 363 | Std. Mean Difference (IV, Random, 95% CI) | ‐0.07 [‐0.27, 0.14] |
| 1.7.2 Central pain ‐ spinal cord injury | 1 | 113 | Std. Mean Difference (IV, Random, 95% CI) | 0.00 [‐0.37, 0.37] |
| 1.7.3 Peripheral pain ‐ diabetic polyneuropathy | 2 | 303 | Std. Mean Difference (IV, Random, 95% CI) | 0.17 [‐0.06, 0.39] |
| 1.7.4 Peripheral pain ‐ plexus injury | 1 | 141 | Std. Mean Difference (IV, Random, 95% CI) | ‐0.07 [‐0.42, 0.28] |
| 1.7.5 Peripheral pain of various aetiologies | 2 | 300 | Std. Mean Difference (IV, Random, 95% CI) | ‐0.03 [‐0.26, 0.21] |
| 1.7.6 Central and peripheral pain ‐ various aetiologies | 1 | 64 | Std. Mean Difference (IV, Random, 95% CI) | 0.15 [‐0.35, 0.64] |
| 1.8 Sleep problems Show forest plot | 8 | 1386 | Std. Mean Difference (IV, Random, 95% CI) | ‐0.47 [‐0.90, ‐0.04] |
| 1.8.1 Central pain ‐ multiple sclerosis | 1 | 339 | Std. Mean Difference (IV, Random, 95% CI) | 0.01 [‐0.21, 0.22] |
| 1.8.2 Central pain ‐ spinal cord injury | 1 | 114 | Std. Mean Difference (IV, Random, 95% CI) | ‐0.04 [‐0.41, 0.32] |
| 1.8.3 Peripheral pain ‐ diabetic polyneuropathy | 1 | 274 | Std. Mean Difference (IV, Random, 95% CI) | ‐0.14 [‐0.38, 0.10] |
| 1.8.4 Peripheral pain ‐ plexus injury | 1 | 141 | Std. Mean Difference (IV, Random, 95% CI) | ‐0.42 [‐0.78, ‐0.07] |
| 1.8.5 Peripheral pain ‐ polyneuropathy of various aetiologies | 3 | 448 | Std. Mean Difference (IV, Random, 95% CI) | ‐0.78 [‐2.17, 0.61] |
| 1.8.6 Central and peripheral pain ‐ various aetiologies | 1 | 70 | Std. Mean Difference (IV, Random, 95% CI) | ‐0.31 [‐0.78, 0.16] |
| 1.9 Psychological distress Show forest plot | 7 | 779 | Std. Mean Difference (IV, Random, 95% CI) | ‐0.32 [‐0.61, ‐0.02] |
| 1.9.1 Central pain ‐ multiple sclerosis | 2 | 363 | Std. Mean Difference (IV, Random, 95% CI) | ‐0.03 [‐0.65, 0.59] |
| 1.9.2 Peripheral pain ‐ chemotherapy‐induced polyneuropathy | 1 | 36 | Std. Mean Difference (IV, Random, 95% CI) | ‐1.07 [‐1.78, ‐0.37] |
| 1.9.3 Peripheral pain ‐ diabetic polyneuropathy | 1 | 30 | Std. Mean Difference (IV, Random, 95% CI) | ‐0.25 [‐0.97, 0.47] |
| 1.9.4 Peripheral pain ‐ plexus injury | 1 | 141 | Std. Mean Difference (IV, Random, 95% CI) | ‐0.27 [‐0.62, 0.08] |
| 1.9.5 Peripheral pain ‐ polyneuropathy of various aetiologies | 2 | 209 | Std. Mean Difference (IV, Random, 95% CI) | ‐0.48 [‐0.80, ‐0.16] |
| 1.10 Withdrawals due to lack of efficacy Show forest plot | 9 | 1576 | Risk Difference (IV, Random, 95% CI) | ‐0.00 [‐0.02, 0.01] |
| 1.10.1 Central pain ‐ multiple sclerosis | 4 | 697 | Risk Difference (IV, Random, 95% CI) | 0.00 [‐0.02, 0.02] |
| 1.10.2 Peripheral pain ‐ diabetic polyneuropathy | 1 | 297 | Risk Difference (IV, Random, 95% CI) | ‐0.01 [‐0.05, 0.03] |
| 1.10.3 Peripheral pain ‐ plexus injury | 1 | 141 | Risk Difference (IV, Random, 95% CI) | 0.00 [‐0.04, 0.04] |
| 1.10.4 Peripheral pain ‐ polyneuropathy of various aetiologies | 2 | 371 | Risk Difference (IV, Random, 95% CI) | ‐0.04 [‐0.09, 0.01] |
| 1.10.5 Central and peripheral pain ‐ various aetiologies | 1 | 70 | Risk Difference (IV, Random, 95% CI) | 0.00 [‐0.05, 0.05] |
| 1.11 Any adverse event Show forest plot | 7 | 1356 | Risk Difference (IV, Random, 95% CI) | 0.19 [0.12, 0.27] |
| 1.11.1 Central pain ‐ multiple sclerosis | 3 | 627 | Risk Difference (IV, Random, 95% CI) | 0.22 [0.05, 0.39] |
| 1.11.2 Central pain ‐ spinal cord injury | 1 | 116 | Risk Difference (IV, Random, 95% CI) | 0.34 [0.18, 0.50] |
| 1.11.3 Peripheral pain ‐ diabetic polyneuropathy | 1 | 297 | Risk Difference (IV, Random, 95% CI) | 0.12 [0.02, 0.22] |
| 1.11.4 Peripheral pain ‐ polyneuropathy of various aetiologies | 1 | 246 | Risk Difference (IV, Random, 95% CI) | 0.15 [0.05, 0.25] |
| 1.11.5 Central and peripheral pain ‐ various aetiologies | 1 | 70 | Risk Difference (IV, Random, 95% CI) | 0.21 [0.06, 0.36] |
| 1.12 Specific adverse event: nervous system disorders Show forest plot | 9 | 1304 | Risk Difference (IV, Random, 95% CI) | 0.38 [0.18, 0.58] |
| 1.12.1 Central pain ‐ multiple sclerosis | 3 | 453 | Risk Difference (IV, Random, 95% CI) | 0.33 [0.09, 0.58] |
| 1.12.2 Central pain ‐ spinal cord injury | 1 | 116 | Risk Difference (IV, Random, 95% CI) | 0.53 [0.38, 0.68] |
| 1.12.3 Peripheral pain ‐chemotherapy‐induced polyneuropathy | 1 | 36 | Risk Difference (IV, Random, 95% CI) | 1.00 [0.90, 1.10] |
| 1.12.4 Peripheral pain ‐ diabetic polyneuropathy | 1 | 297 | Risk Difference (IV, Random, 95% CI) | 0.26 [0.15, 0.37] |
| 1.12.5 Peripheral pain ‐ polyneuropathy of various aetiologies | 2 | 332 | Risk Difference (IV, Random, 95% CI) | 0.29 [0.19, 0.39] |
| 1.12.6 Central and peripheral pain ‐ various aetiologies | 1 | 70 | Risk Difference (IV, Random, 95% CI) | 0.37 [0.15, 0.58] |
| 1.13 Specific adverse event: psychiatric disorders Show forest plot | 9 | 1314 | Risk Difference (IV, Random, 95% CI) | 0.10 [0.06, 0.15] |
| 1.13.1 Central pain ‐ multiple sclerosis | 3 | 453 | Risk Difference (IV, Random, 95% CI) | 0.10 [0.05, 0.16] |
| 1.13.2 Central pain ‐ spinal cord injury | 1 | 116 | Risk Difference (IV, Random, 95% CI) | 0.00 [‐0.06, 0.07] |
| 1.13.3 Peripheral pain ‐ chemotherapy‐induced polyneuropathy | 1 | 36 | Risk Difference (IV, Random, 95% CI) | 0.11 [‐0.06, 0.28] |
| 1.13.4 Peripheral pain ‐ diabetic polyneuropathy | 1 | 297 | Risk Difference (IV, Random, 95% CI) | 0.05 [0.01, 0.09] |
| 1.13.5 Peripheral pain ‐ polyneuropathy of various aetiologies | 2 | 342 | Risk Difference (IV, Random, 95% CI) | 0.21 [0.14, 0.29] |
| 1.13.6 Central and peripheral pain ‐ various aetiologies | 1 | 70 | Risk Difference (IV, Random, 95% CI) | 0.11 [‐0.05, 0.27] |