Antivirales de acción directa para la hepatitis C crónica
Resumen
Antecedentes
Millones de personas en todo el mundo presentan hepatitis C, lo que puede provocar enfermedades hepáticas graves, cáncer hepático y muerte. Los antivirales de acción directa (AAD) son intervenciones relativamente nuevas y costosas para la hepatitis C crónica, y los resultados preliminares indican que los AAD pueden erradicar el virus de la hepatitis C (HCV) de la sangre (respuesta virológica mantenida). La respuesta virológica mantenida (RVM) la utilizan los investigadores y los organismos reguladores como un resultado indirecto de la morbilidad y la mortalidad, y se basa exclusivamente en evidencia observacional. Sin embargo, ningún ensayo aleatorio ha validado su uso.
Objetivos
Evaluar los efectos beneficiosos y perjudiciales de los AAD en pacientes con HCV crónica.
Métodos de búsqueda
Se buscaron todos los ensayos publicados y no publicados en el Registro de Ensayos Controlados del Grupo Cochrane Hepatobiliar (Cochrane Hepato‐Biliary Group Controlled Trials Register), CENTRAL, MEDLINE, Embase, Science Citation Index Expanded, LILACS y en BIOSIS; en la Chinese Biomedical Literature Database (CBM), China Network Knowledge Information (CNKI), la Chinese Science Journal Database (VIP), Google Scholar, la Turning Research into Practice (TRIP) Database, ClinicalTrials.gov, European Medicines Agency (EMA) (www.ema.europa.eu/ema/), WHO International Clinical Trials Registry Platform (www.who.int/ictrp), la Food and Drug Administration (FDA) (www.fda.gov), y en fuentes de compañías farmacéuticas para encontrar ensayos en curso y no publicados. Las búsquedas se realizaron por última vez en octubre de 2016.
Criterios de selección
Ensayos clínicos aleatorios que compararan AAD versus ninguna intervención o placebo, solos o con cointervenciones, en adultos con HCV crónica. Se incluyeron ensayos independientemente del tipo de publicación, el estado de publicación y el idioma.
Obtención y análisis de los datos
Se utilizaron los procedimientos metodológicos estándar previstos por la Colaboración Cochrane. Los resultados primarios fueron morbilidad relacionada con la hepatitis C, eventos adversos graves y calidad de vida relacionada con la salud. Los resultados secundarios fueron: mortalidad por todas las causas, ascitis, hemorragia de las várices, síndrome hepatorrenal, encefalopatía hepática, carcinoma hepatocelular, eventos adversos no graves (cada uno informado por separado) y respuesta virológica mantenida. Se evaluaron de forma sistemática los riesgos de sesgo, se realizó el análisis secuencial de ensayos y se siguió un procedimiento de ocho pasos para evaluar los umbrales para la significación estadística y clínica. La calidad general de la evidencia se evaluó mediante GRADE.
Resultados principales
Se incluyó un total de 138 ensayos que aleatorizaron un total de 25 232 participantes. En general los ensayos fueron a corto plazo y se diseñaron principalmente para evaluar el efecto del tratamiento sobre la RVM. Los ensayos evaluaron 51 AAD diferentes. De estos ensayos, 128 utilizaron el pareamiento con placebo en el grupo control. Todos los ensayos incluidos presentaban un riesgo de sesgo elevado. En 84 ensayos se utilizaron AAD comercializados o en desarrollo (13 466 participantes). Cincuenta y siete ensayos administraron AAD que se han descontinuado o retirado del mercado. Las poblaciones de estudio no habían recibido tratamiento previamente en 95 ensayos, habían estado expuestas a tratamiento en 17 ensayos y 24 ensayos incluyeron pacientes que no habían recibido tratamiento previamente y pacientes que habían recibido tratamiento. Los genotipos del HCV fueron el genotipo 1 (119 ensayos), el genotipo 2 (ocho ensayos), el genotipo 3 (seis ensayos), el genotipo 4 (nueve ensayos) y el genotipo 6 (un ensayo). Se identificaron dos ensayos en curso.
No fue posible determinar de manera confiable el efecto de los AAD comercializados o en desarrollo sobre el resultado primario de morbilidad relacionada con la hepatitis C o mortalidad por todas las causas. No hubo datos sobre la morbilidad relacionada con la hepatitis C y solamente hubo datos limitados sobre la mortalidad a partir de 11 ensayos (AAD 15/2377 [0,63%] versus control 1/617 [0,16%]; OR 3,72; IC del 95%: 0,53 a 26,18; evidencia de muy baja calidad). En este resultado no se realizó el análisis secuencial de ensayos.
Hubo evidencia de muy baja calidad de que los AAD comercializados o en desarrollo no influyen en los eventos adversos graves (AAD 5,2% versus control 5,6%; OR 0,93; IC del 95%: 0,75 a 1,15; 15 817 participantes, 43 ensayos). El análisis secuencial de ensayos mostró que hubo información suficiente para descartar una reducción del 20% del riesgo relativo de un evento adverso grave con los AAD en comparación con placebo. El único AAD que mostró un menor riesgo de eventos adversos graves cuando se realizó el metanálisis por separado fue el simeprevir (OR 0,62; IC del 95%: 0,45 a 0,86). Sin embargo, el análisis secuencial de ensayos mostró que no hubo información suficiente para confirmar ni rechazar una reducción del riesgo relativo del 20% y, cuando se excluyó un ensayo con un resultado extremo, entonces el resultado del metanálisis no mostró evidencia de una diferencia.
Los AAD comercializados o en desarrollo pueden reducir el riesgo de que no ocurra RVM desde el 54,1% en los pacientes sin tratamiento hasta el 23,8% en los pacientes tratados con AAD (CR 0,44; IC del 95%: 0,37 a 0,52; 6886 participantes, 32 ensayos, evidencia de baja calidad). El análisis secuencial de ensayos confirmó este resultado del metanálisis.
Sólo 1/84 ensayos de los AAD comercializados o en desarrollo evaluó los efectos sobre la calidad de vida relacionada con la salud (puntuación mental del SF 36 y puntuación física del SF 36).
No hubo evidencia suficiente de los ensayos sobre los AAD retirados o descontinuados para determinar su efecto sobre la morbilidad relacionada con la hepatitis C ni la mortalidad por todas las causas (OR 0,64; IC del 95%: 0,23 a 1,79; cinco ensayos, evidencia de muy baja calidad). Sin embargo, estos AAD parecieron aumentar el riesgo de eventos adversos graves (OR 1,45; IC del 95%: 1,22 a 1,73; 29 ensayos, evidencia de muy baja calidad). El análisis secuencial de ensayos confirmó este resultado del metanálisis.
Ninguno de los 138 ensayos proporcionó datos útiles para evaluar los efectos de los AAD sobre los otros resultados secundarios (ascitis, hemorragia de las várices, síndrome hepato‐renal, encefalopatía hepática y carcinoma hepatocelular).
Conclusiones de los autores
La evidencia de los resultados principales de interés proviene de ensayos a corto plazo y no fue posible determinar el efecto del tratamiento a largo plazo con los AAD. Las tasas de morbilidad y mortalidad de la hepatitis C observadas en los ensayos son relativamente bajas y no hay seguridad con respecto a cómo los AAD afectan este resultado. En general, hay evidencia de muy baja calidad de que los AAD comercializados o en desarrollo no influyen sobre los eventos adversos graves. No hay evidencia suficiente para determinar si los AAD tienen efectos beneficiosos o perjudiciales sobre otros resultados clínicos del HCV crónico. El simeprevir puede tener efectos beneficiosos sobre el riesgo de eventos adversos graves. En todos los otros análisis no fue posible confirmar ni rechazar que los AAD tuvieran algún efecto clínico. Los AAD pueden reducir el número de pacientes con el virus detectable en la sangre, pero no hay evidencia suficiente a partir de ensayos aleatorios que permita comprender cómo la RVM afecta los resultados clínicos a largo plazo. La RVM todavía es un resultado que necesita validarse de forma adecuada en ensayos clínicos aleatorios.
PICO
Resumen en términos sencillos
Antivirales de acción directa para la hepatitis C crónica
Antecedentes
Millones de personas en todo el mundo presentan hepatitis C, lo que puede provocar enfermedades hepáticas graves, cáncer hepático y muerte. Para la hepatitis C se han utilizado numerosas intervenciones previas basadas en el interferón, pero ninguna de estas intervenciones han probado ser efectivas sobre resultados centrados en el paciente y su uso se asoció con efectos secundarios graves. Los AAD son intervenciones relativamente nuevas pero costosas para la hepatitis C, y los resultados preliminares han indicado que los AAD parecen erradicar el virus de la hepatitis C de la sangre (respuesta virológica mantenida) con mucha más frecuencia. Además, estos agentes parecen provocar muchos menos efectos adversos graves. En esta revisión Cochrane se evaluó la evidencia sobre los efectos clínicos de los AAD para la hepatitis C.
Características de los estudios
Se incluyeron 138 ensayos clínicos con asignación aleatoria. Todos los ensayos incluidos presentaban un riesgo de sesgo elevado. Los 138 ensayos utilizaron 51 AAD diferentes. De estos ensayos, 84 evaluaron los AAD comercializados o en desarrollo; 57 ensayos se realizaron con AAD retirados del mercado. Los ensayos se realizaron entre 2004 y 2016. Los ensayos procedían de todo el mundo, incluyendo 34 países diferentes. Se incluyeron 17 ensayos en los que todos los participantes habían sido tratados previamente para la hepatitis C (habían recibido tratamiento) antes de ser reclutados en el ensayo. En 95 ensayos sólo se incluyeron participantes que no habían sido tratados previamente para la hepatitis C (no habían recibido tratamiento). Los períodos de intervención variaron desde un día a 48 semanas, con un promedio de 14 semanas. El período de intervención y el período de seguimiento combinados variaron desde un día a 120 semanas, con un promedio de 34 semanas.
Resultados clave
No fue posible determinar de manera confiable el efecto de los AAD sobre la morbilidad relacionada con la hepatitis C ni la muerte por cualquier causa. No hubo datos sobre la morbilidad relacionada con la hepatitis C y se registraron muy pocas muertes en el transcurso de los ensayos (15 muertes/2377 participantes con antivirales de acción directa [0,63%] versus una muerte/617 participantes control [0,16%], evidencia de muy baja calidad). Sobre la base de evidencia de muy baja calidad, el 5,2% de los pacientes tratados con AAD tuvieron uno o más eventos adversos graves versus el 5,6% de los participantes que estaban sin tratamiento durante el período de observación. Cuando se analizaron por separado, el simeprevir fue el único antiviral de acción directa que mostró evidencia de un efecto beneficioso cuando se evaluó el riesgo de un evento adverso grave. Sin embargo, estos análisis demostraron que la validez de estos resultados es polémica y que el "azar" podría ser la causa de la diferencia. No hubo información suficiente para determinar si hubo algún efecto de los AAD sobre otros resultados clínicamente relevantes. Los resultados de esta revisión confirman que los AAD parecen reducir el número de pacientes con el virus de la hepatitis C en sangre del 54,1% en los pacientes sin tratar al 23,8% en los que fueron tratados. Debido a que la pérdida del virus de la hepatitis C detectable en la sangre sólo se trata de un análisis de sangre, los estudios no pueden decir qué significa este resultado a largo plazo.
Calidad de la evidencia
Debido a varias limitaciones (p.ej. la falta de cegamiento, la falta de datos relevantes, los datos faltantes, ningún protocolo publicado) la calidad de la evidencia en esta revisión se consideró muy baja o baja. En primer lugar, todos los ensayos y resultados tuvieron alto riesgo de sesgo, lo que significa que dichos resultados probablemente sobrestiman los efectos beneficiosos de los AAD y subestiman cualquier posible efecto perjudicial. En segundo lugar, hubo datos limitados sobre la mayoría de los resultados clínicos, es decir, sólo hubo datos clínicos relevantes para los metanálisis sobre la mortalidad por todas las causas y los eventos adversos graves y, para estos, los datos fueron escasos. Ningún ensayo a largo plazo ha evaluado si el tratamiento con AAD mejora la morbilidad o la mortalidad.
Authors' conclusions
Summary of findings
| Direct‐acting antivirals versus control | ||||||
| Patient or population: adults with chronic hepatitis C | ||||||
| Outcomes | Anticipated absolute effects* (95% CI) | Relative effect (TSA‐adjusted CI) | № of participants | Quality of the evidence | Comments | |
| Risk with placebo or no intervention | Risk with direct‐acting antivirals | |||||
| All‐cause mortality at maximum follow‐up | 2 per 1000 | 7 per 1000 | OR 3.72 (‐) | 2996 | ⊕⊝⊝⊝ | It was not possible to perform Trial Sequential Analysis because of limited data and too few events |
| Proportion of participants with one or more serious adverse event at maximum follow‐up | 56 per 1000 | 52 per 1000 | OR 0.93 (TSA CI 0.71 to 1.33) | 15,817 | ⊕⊝⊝⊝ | Trial Sequential Analysis showed that the boundary for futility was crossed. This leads us to conclude that any possible intervention effect, if any, is less than 20% |
| Proportion of participants with no sustained virological response at maximum follow‐up | 541 per 1000 | 238 per 1000 | RR 0.44 (TSA CI 0.42 to 0.55) | 6886 | ⊕⊕⊝⊝ Low3 | Trial Sequential Analysis showed that the boundary for benefit was crossed. This indicates that DAAs seem to decrease the risk of no sustained virological response by at least 20% if risk of bias and other threats to the validity can be disregarded |
| *The risk in the intervention group (and its 95% confidence interval) is based on the observed risk in the comparison group and the relative effect of the intervention (and its 95% CI). | ||||||
| GRADE Working Group grades of evidence | ||||||
| 1Downgraded two levels because of very serious risk of bias in the included trials (see Figure 1) and two levels due to very serious imprecision (none of the TSA boundaries are crossed, so the information size is too low). | ||||||

| Direct‐acting antivirals withdrawn from the market versus control | ||||||
| Patient or population: adults with chronic hepatitis C | ||||||
| Outcomes | Anticipated absolute effects* (95% CI) | Relative effect (TSA‐adjusted CI) | № of participants | Quality of the evidence | Comments | |
| Risk with placebo or no intervention | Risk with direct‐acting antivirals | |||||
| All‐cause mortality at maximum follow‐up | 7 per 1000 | 5 per 1000 | OR 0.64 (‐) | 3045 | ⊕⊝⊝⊝ | It was not possible to perform Trial Sequential Analysis because of limited data and too few events |
| Proportion of participants with one or more serious adverse event at maximum follow‐up | 75 per 1000 | 108 per 1000 | OR 1.45 (TSA 1.16 to 1.82) | 9229 | ⊕⊝⊝⊝ | Trial Sequential Analysis showed that the boundary for harm was crossed. This shows that there is firm evidence that withdrawn DAAs increase the risk of a serious adverse event by at least 20% |
| Proportion of participants with no sustained virological response at maximum follow‐up | 586 per 1000 | 356 per 1000 | RR 0.61 (0.55, 0.69) (TSA CI 0.42 to 0.55) | 9075 | ⊕⊕⊝⊝ Low3 | Trial Sequential Analysis not performed |
| *The risk in the intervention group (and its 95% confidence interval) is based on the observed risk in the comparison group and the relative effect of the intervention (and its 95% CI). CI: confidence interval; DAA: direct‐acting antivirals; OR: odds ratio; RCTs: randomised clinical trials; RR: risk ratio; TSA: Trial Sequential Analysis | ||||||
| GRADE Working Group grades of evidence | ||||||
| 1Downgraded two levels because of very serious risk of bias in the included trials (see Figure 1) and two levels due to very serious imprecision (none of the TSA boundaries are crossed so the information size is too low). | ||||||
Background
Description of the condition
The hepatitis C virus (HCV) was discovered in 1989 and has since become recognised as the leading cause of cirrhosis and hepatocellular carcinoma (Choo 1989). Worldwide, an estimated 700,000 deaths per year can be related to HCV liver diseases and more than 115 million individuals are infected. This corresponds to a global prevalence of 1.6% (WHO 2014; MCDC 2015). Mother to child transmission of HCV has become a leading cause of paediatric infection of HCV, and up to half of the children infected with HCV acquired the HCV infection in utero (Mok 2005). In the USA, an estimated 50% of individuals with chronic HCV infection are unaware of their diagnosis (Spradling 2012). Failure to identify infected individuals has been considered to be a major bottleneck to successful control of HCV (Spradling 2012). Screening asymptomatic individuals who may have an increased likelihood of being infected with HCV could become an important step toward improving the detection and, ultimately, treatment of HCV‐infected people (Spradling 2012).
HCV is a member of the family Flaviviridae belonging to the Hepacivirus genus, and is an enveloped single‐stranded positive‐sense ribonucleic acid (RNA) virus (Scheel 2013; Dubuisson 2014). The genome of HCV contains one open reading frame encoding a poly‐protein (Scheel 2013; Dubuisson 2014). This poly‐protein is processed by host and viral proteins to yield the structural (core, glycoproteins E1 and E2, and protein P7) and the nonstructural proteins (NS2, NS3, NS4A, NS4B, NS5A, and NS5B) (Scheel 2013; Dubuisson 2014).
Classification of HCV is based on phylogeny (i.e. history of evolution) and sequence diversity, dividing HCV into seven major genotypes (Scheel 2013; Messina 2015). The geographical distribution and the prevalence of the seven genotypes varies (Scheel 2013; Messina 2015). Genotype 1 is highly prevalent, accounting for 46% of all HCV infections globally (Scheel 2013; Messina 2015). Genotype 2 has been found to dominate in West Africa, genotype 3 in South Asia and parts of Scandinavia, genotype 4 in Central and North Africa, genotype 5 in South Africa, and genotype 6 and 7 in South East Asia (Scheel 2013; Gowan 2014; Messina 2015). It has been shown that the interleukin−28 beta (IL‐28B) subunit gene in the host is dramatically associated with both sustained virological response to pegylated interferon α (peg‐IFNα) and ribavirin (RBV) and spontaneous viral clearance in the absence of therapy (Berger 2012).
HCV is primarily transmitted parenterally through exposure to contaminated blood (e.g. in people who inject drugs) (CDCP 1998). The signs and symptoms of HCV have been found to be largely similar across genotypes, but genotype 3 is associated with higher risks of hepatic steatosis and progressive liver disease (Scheel 2013). An infection with HCV is often asymptomatic and if the disease does not progress further to cirrhosis or give rise to cancer, it may not result in harmful events for infected people (Koretz 2015). Approximately 20% of infected people have self‐limited acute hepatitis (Koretz 2015), but in the remaining 80%, the virus is not cleared, which leads to a chronic HCV infection (WHO 2014). A systematic review of 111 studies analysing the natural history of HCV infection, found that the prevalence of cirrhosis 20 years after HCV infection was 16% (Thein 2008). Other studies have reported that further progression into cirrhosis occurred in approximately 20% of HCV people but the prevalence could be even higher (Conteduca 2014; Koretz 2015; Wandeler 2015). Studies have shown varying results, but approximately 10% to 20% of the people with chronic HCV infection progress to end‐stage disease (i.e., decompensated cirrhosis or hepatocellular carcinoma, not just histologic cirrhosis), which corresponds to 8% to16% of all people who are infected with HCV (Koretz 2015).
Before the appearance of DAAs, the recommended standard of care for HCV infection consisted of peg‐IFN α plus RBV (Manns 2006; Brok 2009; Brok 2010; Hauser 2014). Several mechanisms of action of RBV have so far been suggested; one of the proposed mechanisms is a direct effect against the HCV RNA‐dependent RNA polymerase (Clark 2012). However, given the lack of a clear understanding of the RBV mechanism, it is considered challenging to confidently classify RBV as a DAA (Clark 2012).
Treatment with peg‐IFNα plus RBV, compared with other antiviral drugs, has been shown to increase the rates of sustained virological response (SVR) defined as aviraemia 24 weeks after antiviral therapy (Ermis 2015). Treatment with peg‐IFNα plus RBV is associated with serious adverse events, often leading to discontinuation of the treatment, and the effects on clinically‐relevant outcomes remain unclear (Brok 2010; Koretz 2013; Hauser 2014; Koretz 2015; Righi 2015). The many serious adverse events associated with IFNα plus RBV treatment has encouraged the development of new interventions, such as DAAs (Ermis 2015).
Several observational studies have shown that achieving sustained virologic response in hepatitis C seems to be associated with improved clinical outcomes (Smith‐Palmer 2015). However, the SVR is a blood test and, as such, is a surrogate outcome. Since the SVR has been used universally as the primary outcome in hepatitis C treatment trials, it will be necessary to consider it in this review.
Surrogate outcomes may or may not reflect ultimate clinical outcomes and they need to be validated. Such validations cannot be accomplished only by observational evidence (Ciani 2017; Flemming 1996; Flemming 2012; Gluud 2007; Kemp 2017). Validation consists of showing that the creation of surrogate outcomes ultimately results in comparable improvements in clinical outcomes. Thus, validation requires the performance of randomised clinical trials showing that the people who obtain SVRs also have a decreased risk of hepatis C‐related complications. Simply showing an association or a correlation between short‐term measures and long‐term clinical events does not validate a surrogate outcome. For example, people who develop SVRs have underlying characteristics that would predict that they would have better long‐term outcomes even if no treatment was provided (Koretz 2015). Thus, if an observational study shows that people treated with DAAs who obtain SVRs had better outcomes than untreated (or unsuccessfully treated) people who do not obtain SVR, the explanation for the association may simply be that the SVR identified the inherently stronger population who both responded and had fewer clinical events because of their inherently better status (Ciani 2017; Flemming 1996; Flemming 2012; Gluud 2007; Koretz 2015). As indicated by Flemming 1996: "While the effect of an intervention on a biomarker does provide direct evidence regarding biological activity, such evidence could be unreliable regarding effects on true clinical efficacy measures even when the biomarker is strongly correlated with these clinical efficacy measures in natural history observations." "A correlate does not a surrogate make" (Flemming 1996). In one clinical scenario (re‐treating patients with interferon monotherapy), the SVR did fail to validate: while the treated patients did have more SVRs, they also had more morbidity and may also have had a higher all‐cause mortality (Koretz 2013).
SVRs achieved with DAAs are not necessarily universal cures. A retrospective cohort study (El‐Serag 2016) recently showed that the risk of hepatocellular carcinoma after obtaining SVR remains relatively high at 0.33% per year. Older age and presence of cirrhosis at the time of sustained virological response are associated with a high enough risk to warrant surveillance (El‐Serag 2016). Reig 2016 has in a small observational study shown an unexpected high rate and pattern of tumour recurrence coinciding with SVR, and the authors hypothesise that disruption of immune surveillance may facilitate the emergence of metastatic clones (Reig 2016; Reig 2017). Case reports of hepatitis B reactivation have led to labelling changes for the DAAs (Wang 2017). Although SVR is widely accepted by regulatory bodies as a surrogate for long‐term benefit, the results from observational studies are not definitive and validation from randomised evidence has not been confirmed (Garattini 2016; Gluud 2007; Koretz 2015).
Description of the intervention
Direct‐acting antivirals (DAAs) are molecules that target specific nonstructural proteins of the virus, resulting in disruption of viral replication and thereby infection (Poordad 2012; Pockros 2015). There are four classes of DAAs, defined by their mechanism of action and therapeutic target: nonstructural proteins 3/4A (NS3/4A), protease inhibitors (PIs), NS5B nucleoside polymerase inhibitors (NPIs), NS5B non‐nucleoside polymerase inhibitors (NNPIs), and NS5A inhibitors (Poordad 2012; Pockros 2015). Table 1 presents an overview of the different DAAs we have been able to identify.
| Direct‐acting antiviral agents (DAAs) | |||
| NS3/NS4A inhibitors | NS5B inhibitors | NS5A inhibitors | |
| NPI | NNPI | ||
| ACH‐2684 | ALS2200/VX135 | ABT‐072 | ACH‐2928 |
| Asunaprevir | BILB1941 | Beclabuvir | Daclatasvir |
| Boceprevir | GS0938/PSI352938 | BI201127 | Elbasvir |
| Celuprevir | GS6620 | Dasabuvir | GSK2336805 |
| Danoprevir | GS9851(PSI7851) | Deleobuvir | Ledipasvir |
| Faldaprevir | IDX184 | Filibuvir | MK‐8408 |
| Grazoprevir | INX189/BMS986094 | GSK2878175/GSK175 | Odalasvir |
| GS9256 | Mericitabine | IDX375 | Ombitasvir |
| GS9857 | MK‐3682 | MK‐3281 | PPI461 |
| IDX320 | Sofosbuvir | Nesbuvir | Ravidasvir |
| Narlaprevir | VX‐135 | Radalbuvir | Samatasvir |
| Paritaprevir | ‐ | Setrobuvir | Velpatasvir |
| PHX1766 | ‐ | Tegobuvir | ‐ |
| Simperevir | ‐ | TMC‐647055 | ‐ |
| Sovaprevir | ‐ | VCH‐759 | ‐ |
| Telaprevir | ‐ | VCH‐916 | ‐ |
| Vaniprevir | ‐ | VX222 | ‐ |
| Vedroprevir | ‐ | ‐ | ‐ |
The table presents a list of 58 direct‐acting antiviral agents (DAAs). We have listed the DAAs according to the DAA class they belong to (see Background section). When a DAA has not been assigned a generic or brand name, we have presented it with its experimental compound number prefix.
Inhibitors of the NS3/4A protease
DAA first‐generation protease inhibitors
The NS3/NS4A protease inhibitors, telaprevir and boceprevir, were approved for chronic genotype 1 HCV infection in 2011. It was shown that treating with a protease inhibitor combined with peg‐IFNα plus RBV resulted in sustained virological response reaching 68% to 75% in treatment‐naive (i.e. previously untreated) HCV patients and 59% to 88% in treatment‐experienced patients (i.e. previously‐treated HCV patients) (Scheel 2013; Righi 2015). Considerable drawbacks to the treatment with telaprevir or boceprevir include a rapid occurrence of viral resistance (Conteduca 2014), a long treatment duration (24 to 48 weeks), and an apparent increase in serious adverse events (Scheel 2013; Conteduca 2014; Righi 2015). For these reasons, and due to the development of second‐generation protease inhibitors, telaprevir was removed from the market and boceprevir is no longer a recommended intervention (Righi 2015).
DAA second‐generation protease inhibitors
The NS3/NS4A protease inhibitors, simeprevir and paritaprevir, are characterised by a theoretically high potency, have a low barrier to development of resistance (selection of resistant viruses), and there is cross‐resistance (drug‐drug interaction) among the different NS3/NS4A protease inhibitors (Roche 2015). Simeprevir was approved for administration in combination with peg‐IFNα/RBV in 2013 (Ermis 2015). Simeprevir has been used against HCV genotypes 1, 2, 5, and 6 and it is generally associated with tolerable adverse effects (Conteduca 2014; Ermis 2015). The recommended treatment period with simeprevir is approximately 24 weeks. Paritaprevir is often administered in combination with low‐dose ritonavir (an antiretroviral protease inhibitor of HIV/AIDS) aiming for a pharmacologic boosting effect (Pockros 2015). Paritaprevir and ritonavir are also available in combination with ombitasvir (an NS5A inhibitor, see below) and are usually administered with the NNPI dasabuvir (see below) (Pockros 2015).
DAA NS5B polymerase inhibitors and NS5A inhibitors
The NS5B polymerase inhibitors have been used against several HCV genotypes; they share a high theoretical potency and have high theoretical barrier to resistance due to the active site in NS5B, which is highly conserved across HCV genotypes (Conteduca 2014; Ermis 2015; Righi 2015). The NS5B polymerase inhibitors can be divided into two groups: NPIs and NNPIs. The first NPI approved in 2013 was sofosbuvir and it is apparently well‐tolerated (Righi 2015; Roche 2015). Sofosbuvir is administered once daily for 12 weeks in combination with other drugs for HCV and has a limited cross‐resistance interaction profile compared with previous DAAs (Righi 2015; Roche 2015). NNPIs, for example dasabuvir, interact with areas on the NS5B polymerase that are less critical for viral survival. Thus, the NNPIs have the lowest theoretical barrier to resistance amongst the NS5B polymerase inhibitors (Roche 2015).
Due to the theoretical low resistance barrier, NS5A inhibitors are administered with appropriate combination partners as well as protease inhibitors (Conteduca 2014). Daclatasvir, ledipasvir, and ombitasvir are all NS5A inhibitors, and in 2014 in the European Union (EU) and in 2015 in the USA, daclatasvir was approved for use in combination with other DAAs (Righi 2015; www.fda.gov).
The high cost and limited availability of DAA treatment remain as critical issues, especially in low‐income countries, despite the lack of documented benefit of DAAs on patient‐centred outcomes. The costs associated with DAA treatment is highly variable, but as an example, the drug cost of a 12‐week course of treatment with sofosbuvir amounts to GBP 34,983 (excluding value‐added tax (VAT)) (NICE 2015b), and with the addition of peg‐IFNα plus RBV to the treatment, approximately GBP 40,000 are added to the costs (excluding VAT and monitoring costs) for a 24‐week treatment course (NICE 2015a). Harvoni (ledipasvir/sofosbuvir) is the second most prescribed drug in the global market accounting for revenue of USD 9 billion (FiercePharma 2017).
How the intervention might work
DAAs are molecules that target specific nonstructural HCV‐encoded proteins and hence attempt to disrupt viral replication and infection (Pockros 2015). The effects of DAAs theoretically depend on the HCV genotype and subtype (Pockros 2015).
Why it is important to do this review
Previously published randomised clinical trials assessing the effects of DAAs have primarily focused on assessing sustained virological response as an outcome (aviraemia 24 weeks after antiviral therapy) (McHutchison 2010; Bacon 2011; Jacobson 2011; Poordad 2011; Lawitz 2013; Afdhal 2014; Wyles 2015). As examples, treatment with sofosbuvir has shown the proportion of participants with sustained virological response above 85% when combined with peg‐IFNα plus RBV or RBV alone (Righi 2015); a study assessing the use of daclatasvir in combination with peg‐IFNα plus RBV in treatment‐naive genotype 1 patients has shown sustained virological responses in 90% of the HCV patients (Ermis 2015); and ledipasvir in combination with sofosbuvir has, in a randomised clinical trial, shown sustained virological responses between 93% and 99% of the HCV patients (Righi 2015). Many other trials have similarly shown that DAAs seem to increase the proportion of participants with sustained virological response (McHutchison 2010; Bacon 2011; Jacobson 2011; Poordad 2011; Lawitz 2013; Afdhal 2014; Wyles 2015). Observational studies have noted associations between SVRs and increased survival and fewer liver‐related complications. Such associations have been attributed to stabilisation, or even reversal, of fibrosis and attributed to the removal of the hepatitis C virus (EASL 2015). However, association cannot establish causation. As we have described in Description of the condition, a relationship between the SVR and a favourable clinical outcome has not been confirmed from randomised evidence. The clinical effects of DAAs are unclear and have been questioned (Koretz 2015). No systematic review, taking into account the risks of systematic, design, or random errors, has previously been conducted (Wetterslev 2008; Wetterslev 2009; Higgins 2011a; Jakobsen 2014a).
Objectives
To assess the benefits and harms of DAAs in people with chronic HCV.
Methods
Criteria for considering studies for this review
Types of studies
Randomised clinical trials irrespective of publication type, publication status, and language. If, during the selection of trials, we identified any observational studies (i.e. case series; cohort studies, or quasi‐randomised studies) reporting validly on adverse events of DAAs, we planned to consider these data separately, but we did not specifically search for observational studies for inclusion in this review.
Types of participants
Adults diagnosed with chronic HCV (as defined by trialists), regardless of sex, ethnicity, occupation, country of residence, and duration of infection. Both treatment‐naive and treatment‐experienced participants were included.
Trial participants could
-
have been treatment‐naive or treatment‐experienced or both;
-
have had any comorbidity to HCV, such as HIV, hepatitis B, alcoholism, and with any other specific comorbid diagnosis; and
-
have been pregnant women with chronic HCV and adults with chronic HCV who use and inject drugs.
Types of interventions
Any of the four classes of DAA drugs (Description of the intervention;Table 1).
Experimental intervention
Any of the four classes of DAA drugs administered singly, combined with another DAA, or combined with other medical co‐interventions (Description of the intervention;Table 1).
Control intervention
-
No intervention or placebo.
-
Any medical intervention (except for DAAs) or any combination of medical interventions.
Types of outcome measures
Primary outcomes
-
Hepatitis C‐related morbidity (diagnosed after randomisation) or all‐cause mortality. Hepatitis C‐related morbidity was defined as the proportion of participants with either: cirrhosis, ascites, variceal bleeding, hepato‐renal syndrome, hepatic encephalopathy, or hepatocellular carcinoma.
-
Proportion of participants with one or more serious adverse events. We defined a serious adverse event as any untoward medical occurrence that resulted in death, was life‐threatening, required hospitalisation or prolongation of existing hospitalisation, or resulted in persistent or significant disability or incapacity (ICH‐GCP 1997).
-
Health‐related quality of life (any valid continuous outcome scale used by the trialists).
Secondary outcomes
-
All‐cause mortality.
-
Proportion of participants with ascites (as defined by trialists).
-
Proportion of participants with variceal bleeding (as defined by trialists).
-
Proportion of participants with hepato‐renal syndrome (as defined by trialists).
-
Proportion of participants with hepatocellular carcinoma (as defined by trialists).
-
Proportion of participants with hepatic encephalopathy (as defined by trialists).
-
Proportion of participants with non‐serious adverse events (any other adverse event not included in the definition of serious adverse events (see Primary outcomes)). We planned to assess each non‐serious adverse event separately.
-
Proportion of participants without sustained virological response (as defined by trialists). Usually, this is the number of participants with detectable HCV RNA (i.e. above a lower limit of detection) in the serum by a sensitive polymerase chain reaction (PCR)‐based assay or by a transcription‐mediated amplification testing, 12 or 24 weeks after the end of treatment.
Exploratory outcomes
-
Proportion of participants with liver transplantation after randomisation.
-
Proportion of participants without histological improvement (as defined by trialists).
-
Proportion of participants without significant reductions in alanine aminotransferase (ALT) and aspartate aminotransferase (AST) serum levels (as defined by trialists).
We only assessed all outcomes at 'maximum follow‐up'. We planned to use sensitivity analysis to assess how the different follow‐up periods affected our results if we had found that the time from randomisation to maximum follow‐ up differed significantly between the included trials.
Search methods for identification of studies
Electronic searches
We searched the Cochrane Hepato‐Biliary Controlled Trials Register (Gluud 2015), Cochrane Central Register of Controlled Trials (CENTRAL) in the Cochrane Library, MEDLINE (OvidSP), Embase (OvidSP), Science Citation Expanded (Web of Science), LILACS (Bireme), and BIOSIS (Web of Science) in order to identify relevant trials. We also searched the Chinese Biomedical Literature Database (CBM), China Network Knowledge Information (CNKI), the Chinese Science Journal Database (VIP), and the Wanfang Database. Search strategies, including the time spans of the searches, are provided in Appendix 1. Searches were last run in October 2016.
Searching other resources
We searched the bibliographic references of identified randomised clinical trials and review articles in order to find randomised clinical trials not identified by the electronic searches and handsearches. We contacted the principal authors of the identified randomised clinical trials to inquire about additional randomised clinical trials that they might know.
We also searched Google Scholar, The Turning Research into Practice (TRIP) Database, and on‐line trials registries such as ClinicalTrials.gov, European Medicines Agency (EMA) (www.ema.europa.eu/ema/), WHO International Clinical Trial Registry Platform (www.who.int/ictrp), the Food and Drug Administration (FDA) (www.fda.gov), as well as pharmaceutical company sources for ongoing or unpublished trials.
Additionally, we handsearched Hepatology, New England Journal of Medicine, JAMA, BMJ, PLoS Medicine, and Annals of Internal Medicine for relevant trials.
We also searched for unpublished and grey literature trials.
Data collection and analysis
We performed the review following the recommendations of Cochrane (Higgins 2011a) and the Cochrane Hepato‐Biliary Module (Gluud 2015). We performed the analyses using Review Manager 5 (RevMan 2014), STATA 14 (www.stata.com), and Trial Sequential Analysis (Thorlund 2011; TSA 2011).
Selection of studies
Fourteen review authors (EN, JF, KF, KK, GH, GP, SD, KW, MB, GB, SK, JP, DN, RK) independently and in pairs assessed all identified articles. If a trial was identified as relevant by one author, but not by another, the authors discussed the reasoning behind their decision. If they still disagreed, JCJ served as arbitrator.
Data extraction and management
Twelve review authors (EN, JF, KF, KK, GH, GP, SD, KW, MB, GB, SK, DN) independently and in pairs extracted and validated data. We used data extraction forms that were designed for the purpose. The twelve authors discussed any disagreement concerning the extracted data. If the authors still disagreed, JCJ served as arbitrator. In case of relevant data not being available, we contacted the trial authors.
Assessment of risk of bias in included studies
The review authors, working in pairs, independently assessed the risk of bias of each included trial according to the recommendations in theCochrane Handbook for Systematic Reviews of Interventions (Higgins 2011b) and the Cochrane Hepato‐Biliary Module (Gluud 2015). We used the following definitions in the assessment of risk of bias (Schulz 1995; Moher 1998; Kjaergard 2001; Wood 2008; Higgins 2011a; Lundh 2012; Savović 2012a; Savović 2012b):
Allocation sequence generation
-
Low risk of bias: sequence generation was achieved using computer random‐number generation or a random‐number table. Drawing lots, tossing a coin, shuffling cards, and throwing dice were adequate if performed by an independent person not otherwise involved in the trial.
-
Unclear risk of bias: the method of sequence generation was not specified.
-
High risk of bias: the sequence generation method was not random or only quasi‐randomised.
Allocation concealment
-
Low risk of bias: the allocation sequence was described as unknown to the investigators. Hence, the participants' allocations could not have been foreseen in advance of, or during, enrolment. Allocation was controlled by a central and independent randomisation unit, an on‐site locked computer, identical looking numbered sealed opaque envelopes, drug bottles or containers prepared by an independent pharmacist, or an independent investigator.
-
Unclear risk of bias: it was unclear if the allocation was hidden or if the block size was relatively small and fixed so that intervention allocations may have been foreseen in advance of, or during, enrolment.
-
High risk of bias: the allocation sequence was likely to be known to the investigators who assigned the participants.
Blinding of participants and treatment providers
-
Low risk of bias: it was described that both participants and treatment providers were blinded to treatment allocation.
-
Unclear risk of bias: it was unclear whether participants and treatment providers were blinded, or the extent of blinding was insufficiently described.
-
High risk of bias: no blinding or incomplete blinding of participants and treatment providers was performed.
Blinding of outcome assessment
-
Low risk of bias: it was mentioned that outcome assessors were blinded and this was described.
-
Unclear risk of bias: it was not mentioned whether the outcome assessors were blinded, or the extent of blinding was insufficiently described.
-
High risk of bias: no blinding or incomplete blinding of outcome assessors was performed.
Incomplete outcome data
-
Low risk of bias: missing data were unlikely to make intervention effects depart from plausible values. This could either be: 1. there were no drop‐outs or withdrawals; or 2. the numbers and reasons for the withdrawals and drop‐outs for all outcomes were clearly stated and could be described as being similar in both groups, and the trial handled missing data appropriately in an intention‐to‐treat analysis using proper methods (e.g. multiple imputations). Generally, the trial was judged to be at a low risk of bias due to incomplete outcome data if drop‐outs were less than 5%. However, the 5% cut‐off was not definitive.
-
Unclear risk of bias: there was insufficient information to assess whether missing data were likely to induce bias on the results.
-
High risk of bias: the results were likely to be biased due to missing data either because the pattern of drop‐outs could be described as being different in the two intervention groups or the trial used improper methods in dealing with the missing data (e.g. last observation carried forward).
Selective outcome reporting
-
Low risk of bias: a protocol was published before randomisation began and all outcome results were reported adequately.
-
Unclear risk of bias: no protocol was published.
-
High risk of bias: the outcomes in the protocol were not reported on.
Vested‐interest bias
-
Low risk of bias: it was described that the trial was not sponsored by any pharmaceutical company, any person, or any group with a financial or other interest in a certain result of the trial.
-
Unclear risk of bias: it was unclear how the trial was sponsored.
-
High risk of bias: the trial was sponsored by a pharmaceutical company, a person, or a group with a certain financial or other interest in a given result of the trial.
Other bias
-
Low risk of bias: the trial appeared to be free of other bias domains that could put it at risk of bias.
-
Unclear risk of bias: the trial may or may not have been free of other domains that could put it at risk of bias.
-
High risk of bias: there were other factors in the trial that could put it at risk of bias.
Overall risk of bias
We judged trials to be at an 'overall low risk of bias' if they were assessed as 'low risk of bias' in all the above domains. We judged trials to be at an 'overall high risk of bias' if they were assessed as having unclear risk of bias or high risk of bias in one or more of the above domains.
We assessed the domains 'Blinding of outcome assessment', 'Incomplete outcome data', and 'Selective outcome reporting' for each outcome result. Thus, we assessed the bias risk for each outcome result in addition to the overall bias risk for each trial.
Measures of treatment effect
Dichotomous outcomes
We planned to present risk ratios (RR) with 95% confidence intervals (CI) for dichotomous outcomes. However, since we found several trials with zero events, we handled this according to Sweeting 2004, and used odds ratios (OR) instead.
Continuous outcomes
We included both follow‐up scores and change scores in the analyses. We used follow‐up scores in the analyses in the case when both were reported. We presented the mean differences (MD) and the standardised mean differences (SMD) with 95% CI for continuous outcomes.
Unit of analysis issues
For cross‐over trials, we only included participants from the first treatment period in the trial. We avoided counting data more than once from participants in control arms of trials with multiple experimental intervention arms by dividing the sample size and number of participants experiencing the event by the number of eligible treatment arms used.. There were no other unit of analysis issues.
Dealing with missing data
Dichotomous outcomes
If the trialists used proper methodology (e.g. multiple imputation) to deal with missing data, we used these data in our primary analysis. We did not impute missing values for any outcomes in our primary analysis. In two of our sensitivity analyses (see below), we imputed missing data (Jakobsen 2014a).
Continuous outcomes
If trialists used proper methodology (e.g. multiple imputation) to deal with missing data, we used these data in our primary analysis (Jakobsen 2014a). We primarily used follow‐up scores. If only change‐from‐baseline values were reported, we analysed change scores together with follow‐up scores (Higgins 2011c). If standard deviations (SDs) were not reported, we calculated these using data from the trial if possible. We did not impute missing values for any outcomes in our primary analysis (Jakobsen 2014a).
Sensitivity analyses
To assess the potential impact of the missing data for dichotomous outcomes, we performed the two following sensitivity analyses (Jakobsen 2014a).
-
'Best‐worst‐case' scenario: we assumed that all participants lost to follow‐up in the experimental group had survived, had no serious adverse event, and had no morbidity (for all dichotomous outcomes); and all those participants with missing outcomes in the control group had not survived, had a serious adverse event, and had morbidity (for all dichotomous outcomes).
-
'Worst‐best‐case' scenario: we assumed that all participants lost to follow‐up in the experimental group had not survived, had a serious adverse event, and had morbidity (for all dichotomous outcomes); and that all those participants lost to follow‐up in the control group had survived, had no serious adverse event, and had no morbidity (for all dichotomous outcomes).
Assessment of heterogeneity
We primarily inspected forest plots visually in order to assess if there were signs of statistical heterogeneity (Jakobsen 2014a). We also assessed the presence of statistical heterogeneity using the Chi² test with significance set at P value < 0.10 and measured the quantities of heterogeneity using the I² statistic (Higgins 2003; Deeks 2011).
Assessment of reporting biases
We primarily inspected funnel plots visually in order to assess if there were signs of reporting bias if 10 or more trials were included (Jakobsen 2014a). Using the asymmetry of the funnel plot, we assessed the risk of bias. For dichotomous outcomes we also assessed if there were signs of asymmetry with the Harbord test if τ2 was less than 0.1 and with the Rücker test if τ2 was more than 0.1 (Harbord 2006; Sterne 2011). For continuous outcomes we used the regression asymmetry test (Egger 1997).
Data synthesis
We based our primary conclusions on the results of the primary outcomes with low risk of bias. Our primary analyses were based on trials assessing the effects of DAAs on the market and trials using similar medical co‐interventions in both the experimental and control group.
Meta‐analysis
We undertook this meta‐analysis according to the recommendations stated in the Cochrane Handbook for Systematic Reviews of Interventions (Deeks 2011). We used the statistical software Review Manager 5 provided by Cochrane to analyse data (RevMan 2014). When we observed unbalanced data, a large number of zero events, and rare incidences of events in the control group, we excluded trial results with zero events in both groups (Deeks 2011). We then used reciprocal zero cell correction and fixed meta‐analysis in STATA 14 (www.stata.com) and the following subgroup analyses were based on the inverse variance method (Sweeting 2004; Deeks 2011).
Assessment of significance
We assessed our intervention effects with both random‐effects meta‐analysis and fixed‐effect meta‐analysis (Jakobsen 2014a). We used the more conservative point estimate of the two (Jakobsen 2014a). The more conservative point estimate was the estimate closest to zero effect. If the two estimates were equal, we used the estimate with the widest CI. Our analyses showed that multiple trials had zero and rare events. In these cases we used fixed‐effect meta‐analysis (Sweeting 2004). We assessed three primary outcomes; therefore, we considered a P value of 0.025 or less as statistically significant on the primary outcomes (Jakobsen 2014a; Jakobsen 2014b; Jakobsen 2016a). We assessed eight secondary outcomes; therefore, we considered a P value of 0.011 or less as statistically significant on the secondary outcomes (Jakobsen 2014a; Jakobsen 2014b; Jakobsen 2016a). We used an eight‐step procedure to assess if the thresholds for statistical significance and clinical significance were crossed (Jakobsen 2014a).
Trial Sequential Analysis
Traditional meta‐analysis runs the risk of random errors due to sparse data and repetitive testing of accumulating data when updating reviews. Therefore, we performed Trial Sequential Analysis (Wetterslev 2008; Wetterslev 2009; Brok 2010; Jakobsen 2014a) on the outcomes in order to calculate the required information size and assessed the eventual breach of the cumulative Z‐curve of the relevant trial sequential monitoring boundaries for benefit, harm, or futility (Wetterslev 2008; Wetterslev 2009; Brok 2010; Jakobsen 2014a). Thereby, we wished to control the risks of type I errors and type II errors. A more detailed description of Trial Sequential Analysis can be found at www.ctu.dk/tsa (Thorlund 2011; TSA 2011).
For dichotomous outcomes, we estimated the required information size based on the proportion of participants with an outcome in the control group, a relative risk reduction of 20%, an alpha of 2.5% and 1.1% depending on primary or secondary outcome, a beta of 20%, and the observed diversity in the trials in the meta‐analysis (Jakobsen 2014a). For continuous outcomes, we estimated the required information size based on the SD observed in the control group of trials with low risk of bias, a minimal relevant difference of 50% of this observed SD, an alpha of 2.5% and 1.1% depending on primary or secondary outcome, a beta of 20%, and the observed diversity in the trials in the meta‐analysis (Jakobsen 2014a).
'Summary of findings' table
We created 'Summary of findings' tables on three of our outcomes (all‐cause mortality, serious adverse events, and no sustained virological response) using GRADEpro Guideline Development Tool (www.gradepro.org). We chose these three outcomes because we consider these outcomes to be the important outcomes for decision makers; all‐cause mortality and serious adverse events because of the obvious clinical relevance of these outcomes, and no sustained virological because of the focus on this surrogate outcome in hepatitis C intervention research (see Description of the condition and Agreements and disagreements with other studies or reviews). The GRADE approach appraises the quality of a body of evidence based on the extent to which one can be confident that an estimate of effect or association reflects the item being assessed. The quality of a body of evidence considers within‐study risk of bias, indirectness of the evidence, heterogeneity of the data, imprecision of effect estimates (wide CIs) (Jakobsen 2014), and risk of publication bias (Balshem 2011; Guyatt 2011a; Guyatt 2011b; Guyatt 2011c; Guyatt 2011d; Guyatt 2011e; Guyatt 2011f; Guyatt 2011g; Guyatt 2011h; Guyatt 2013a; Guyatt 2013b; Guyatt 2013c; Mustafa 2013).
Subgroup analysis and investigation of heterogeneity
We planned a large number of subgroup analyses (see below). We did not specify in detail how exactly we would compare the subgroups, but we chose to use the formal test for subgroup difference (Deeks 2011) to assess if there was evidence of a difference between subgroups. and if the formal test for subgroup differences (Deeks 2011) showed evidence of a difference then we assessed each subgroup separately and reported each subgroup meta‐analysis result. We chose to use the formal test for subgroup difference (Deeks 2011) to limit the number of comparisons and hence problems with multiplicity. The large number of comparisons increases the risks of type I errors and type II errors (Jakobsen 2014a; Jakobsen 2016a).
-
Trials with overall low risk of bias compared to trials with overall high risk of bias.
-
Trials randomising HCV participants following the different combinations of DAAs assessed.
-
Trials randomising HCV participants with and without HIV infection.
-
Trials randomising HCV participants with and without HIV infection, hepatitis B, alcoholism, severe fibrosis, cirrhosis, mixed group, or any other specific comorbid diagnosis.
-
Trials randomising HCV participants specifically according to the different HCV genotypes (both comparing the effects of different drug combination on the same genotype and the effects each specific drug combination on each genotype).
-
Trials randomising HCV participants specifically according to the different IL28 genotypes (both comparing the effects of different drug combination on the same IL 28 genotype and the effects each specific drug combination on each IL28 genotype).
-
Trials randomising HCV participants from Asian compared to non‐Asian regions (Thomas 2009).
-
Trials randomising HCV participants according to specific races or ethnicities (Thomas 2009).
-
Trials that are stopped early (not reaching the planned sample size) compared to trials that are not stopped early.
-
Trials randomising treatment‐naive participants compared to previously‐treated patients.
-
Trials assessing the effects of DAAs combined with IFN compared to trials assessing the effects of DAAs combined with no IFN.
-
Trials assessing the effects of DAAs combined with RBV compared to trials assessing the effects of DAAs combined with no RBV.
-
Trials randomising HCV participants with and without chronic kidney disease (as defined by trialists).
-
Trials randomising HCV participants with and without mixed cryoglobulinaemia (as defined by trialists).
Sensitivity analysis
Please see above under Dealing with missing data. Furthermore, we intended to use sensitivity analyses whenever we wanted to assess robustness of our findings (Jakobsen 2014a).
Results
Description of studies
We assessed all trials according to the Cochrane Handbook of Stystematic Reviews of Interventions (Schünemann 2011), and the protocol for this review Jakobsen 2016b. Characteristics of each trial can be found in Characteristics of included studies; Characteristics of excluded studies; and Characteristics of ongoing studies.
Results of the search
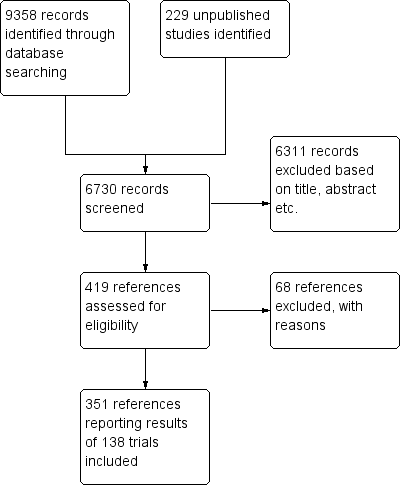
We identified a total of 9358 potentially relevant references through searching the Cochrane Central Register of Controlled Trials (CENTRAL), MEDLINE, Embase, Science Citation Expanded, LILACS, BIOSIS, Chinese Biomedical Literature Database (CBM), China Network Knowledge Information (CNKI), the Chinese Science Journal Database (VIP), and the Wanfang Database. Additionally, 229 unpublished records were identified through United States Food and Drug Administration, clinical trials registers of the USA and Europe, and company websites. We excluded 2857 reference duplicates. Accordingly, 6730 were screened, and 6312 records were excluded based on titles and abstracts. We assessed 419 published/unpublished full‐text papers for eligibility. Of these we excluded 68 references because of the inclusion criteria and exclusion criteria. Reasons for exclusion are listed in the Characteristics of excluded studies table. We included 351 references reporting results of 138 trials. Additionally two trials were ongoing trials. The study flow chart can be seen in Figure 2 (Moher 2009).
Study flow diagram
Included studies
We included 351 references on 138 trials (Figure 2). The trials were conducted between 2004 and 2016. Only 85 of these trials assessed DAAs on the market or under development. Fifty‐seven trials were on withdrawn DAAs. The trials were from 34 different countries located in six continents: Argentina, Australia, Austria, Belgium, Brazil, Canada, Chile, China, Czech Republic, Denmark, France, Germany, India, Ireland, Israel, Italy, Japan, Korea, Lithuania, Mexico, Moldova, Netherlands, New Zealand, Poland, Puerto Rico, Romania, Russia, South Korea, Spain, Sweden, Taiwan, Thailand, UK, USA. For further details on included studies see Characteristics of included studies.
Participants
A total of 25,232 participants were randomised in 138 trials (two trials did not report the number of randomised participants). A total of 13,466 participants were randomised in the 84 trials assessing DAAs on the market or under development. The number of participants in each trial ranged from 10 to 1097 (average 182 participants).
We included 17 trials where the participants were treatment‐experienced, 95 trials where the participants were treatment‐naive, 24 trials where the participants were mixed (both treatment‐naive and treatment‐experienced), and five trials where it was unclear whether the participants were treatment‐experienced or treatment‐naive.
We included participants with different HCV genotypes: HCV genotype 1 (119 trials), HCV genotype 2 (eight trials), HCV genotype 3 (six trials), HCV genotype 4 (nine trials), and HCV genotype 6 (one trial). Twelve trials did not specify which HCV genotypes they assessed.
We included three trials where HIV was an inclusion criteria, 102 where HIV was an exclusion criteria, one trial with both HIV and non‐HIV participants, and 35 trials where it was unclear if HIV was an inclusion/exclusion criteria.
Two trials included only participants with diagnosed cirrhosis, 44 trials included both participants with and without cirrhosis, 67 trials did not include participants with cirrhosis or advanced liver disease, and in 25 trials it was unclear wether participants with cirrhosis or advanced liver disease were included.
Experimental interventions
Eighty‐four trials were on DAAs on the market or under development. Fifty‐seven trials were on withdrawn (or discontinued) DAAs. The intervention period ranged from one day to 48 weeks with an average of 14 weeks. The follow‐up in the included trials ranged from one day to 120 weeks with an average of 34 weeks. The 138 trials used 51 different DAAs: ACH‐2064 (n = 1); alisporivir (n = 1); ALS‐2200 (n = 1); asunaprevir (n = 3); balapiravir (n = 2); beclabuvir (n = 2); BILB‐1941 (n = 1); BILN‐2061 (n = 1); BIT‐25 (n = 1); boceprevir (n = 12); ciluprevir (n = 2); daclatasvir (n = 6); danoprevir (n = 5); deleobuvir (n = 2); faldaprevir (n = 8); filibuvir (n = 2); grazoprevir (n = 2); GS‐6620 (n = 1); GS‐9256 (n = 2); GS‐9451 (n = 2); GS‐9669 (n = 1); GS‐9851 (n = 1); GS‐9857 (n = 1); GSK2336805 (n = 2); GSK2878175 (n = 1); HCV‐796 (n = 1); IDX‐184 (n = 2); INX‐09189 (n = 1); ledispasvir (n = 1); mericitabine (n = 6); mixed (n = 13); narlaprevir (n = 2); nesbuvir (n = 2); odalasavir (n = 1); ombitasvir (n = 1); paritaprevir (n = 1); PHX1766 (n = 1); PPI‐461 (n = 1); PSI‐352938 (n = 1); samatasvir (n = 1); setrobuvir (n = 2); simeprevir (n = 11); sofosbuvir (n = 6); sovaprevir (n = 2); tegobuvir (n = 2); telaprevir (n = 10); valopicitabine (n = 1); vaniprevir (n = 5); VCH‐759 (n = 1); VCH‐916 (n = 1); velpatasvir (n = 1); VX‐222 (n = 1).
Control interventions and co‐interventions
We included 128 trials where the control group received a matching placebo and 13 trials where the control group did not receive placebo. We included 46 trials where neither intervention group (DAA and control) received RBV nor IFN; 79 trials where both groups received RBV and IFN; two trials where both groups received IFN and no RBV; five trials where both groups received RBV and no IFN; three trials where only the control group received IFN and RBV; two trials where only the control group received RBV; and one trial where only the experimental group received RBV and IFN. We included three trials where an additional DAA (different from the experimental type of DAA) was given as co‐intervention in both the experimental and control group.
Funding
One trial was not funded by someone with a financial interest in a certain result of the trial (Mostafa 2015). In the remaining 140 trials it was either not reported, in sufficient detail, how the trial was funded or the trial was financially supported by someone with a financial interest in a certain result of the trial (Figure 1).
Excluded studies
We excluded 68 studies. Of these, 38 studies had a control group receiving an intervention beyond our inclusion and exclusion criteria (33 studies had DAA as control intervention, five studies had no control group); seven studies did not use DAA as intervention; 12 studies were not randomised; seven studies were comments; and four studies used healthy participants. Characteristics of excluded studies table presents a summary of the reasons for the exclusions.
Risk of bias in included studies
Allocation
We assessed the generation of the allocation sequence generation as low risk of bias in 37/138 trials. The remaining trials were described as being randomised but they did not describe the method used for allocation sequence generation in sufficient detail, resulting in an 'uncertain risk of bias' (Figure 1).
We assessed the methodology used for allocation concealment as low risk of bias in 38/138 trials. The methodology used for allocation concealment was unclear or we assessed it as high risk of bias in the remaining trials (Figure 1).
Blinding
We assessed the blinding of participants and personnel as low risk of bias in 28/138 trials. The remaining trials either did not describe the blinding of participants and personnel in sufficient detail (unclear) or we assessed the methodology as high risk of bias (Figure 1).
We assessed the blinding of outcome assessors as low risk of bias in 14/138 trials. The methods for blinding of outcome assessors for the remaining trials were either not described in sufficient detail (unclear) or we assessed them as high risk of bias (Figure 1).
Incomplete outcome data
We assessed trials' handling of incomplete outcome data as low risk of bias in 49/138 trials. The remaining trials either did not describe how they handled incomplete outcome data (unclear) or we assessed the methodology as high risk of bias (Figure 1).
Selective reporting
We assessed selective outcome reporting as low risk of bias in 49/138 trials. The remaining trials either did not register or publish a protocol with predefined outcomes before the randomisation began or the methodology was assessed as high risk of bias (Figure 1).
Other potential sources of bias
We assessed the vested‐interest domain as low risk of bias in one trial (Mostafa 2015) and high risk of bias in the remaining 140 trials; either because the funding or financial interests were not reported in sufficient detail or because the trial was financially supported by someone with a financial interest in a certain result of the trial.
Overall risk of bias
Based on our predefined 'Risk of bias' assessment, we considered all 138 trials at high risk of bias. Many trials were judged to have unclear risk of bias in several domains, and additional information could not be obtained from the trial authors. Only four trials had low risk of bias in 7/8 domains (Wedemeyer 2013; Feld 2014; Zeuzem 2014a; C‐EDGE TN 2015. The latter four trials were at high risk of bias in the vested‐interest bias risk domain (Figure 1). Additional information can be found in the 'Risk of bias' summary (Figure 1).
Effects of interventions
See: Summary of findings for the main comparison Direct‐acting antivirals versus control; Summary of findings 2 Direct‐acting antivirals withdrawn from the market versus control
Analyses of trials assessing the effects of DAAs on the market or under development
Hepatitis C‐related morbidity or all‐cause mortality
When analysing the composite outcome hepatitis C‐related morbidity or all‐cause mortality, all events were deaths only.
Meta‐analysis
Eleven trials with a total of 2996 participants provided useful data on all‐cause mortality. A total of 15/2377 (0.63%) participants died in the DAA groups versus 1/617 (0.16%) participants who died in the control groups during the observation period. Because of the unbalanced data, the large number of zero events, and the rare incidence of events in the control group, we used reciprocal zero cell correction and fixed‐effect meta‐analysis (STATA 14; www.stata.com) (Sweeting 2004). The extracted data can be found in the standard results section, but the meta‐analysis results can be found in the STATA forest plots. Meta‐analysis showed no evidence of a difference when assessing risk of all‐cause mortality (OR 3.72, 95% CI 0.53 to 26.18, P = 0.19; I² = 0%, 11 trials, very low‐quality evidence, Analysis 1.1).
Heterogeneity
Neither visual inspection of the forest plots nor tests for statistical heterogeneity (I² = 0%, P = 0.99) indicated significant heterogeneity.
Risk of bias and sensitivity analyses
The risk of bias of this outcome result was assessed as high risk of bias.
Additional analyses
Due to the total lack of data on hepatitis C‐related morbidity and the low number of events on all‐cause mortality, we did not perform additional analysis including Trial Sequential Analysis, Bayes factor, funnel plots, or subgroup analysis.
Serious adverse events
Meta‐analysis
Forty‐three trials with a total of 15,817 participants reported results on serious adverse events. A total of 376/13,574 (2.77%) participants in the DAA groups had one or more serious adverse events versus a total of 125/2243 (5.57%) participants in the control groups during the observation period (Table 2). Because of the unbalanced data, the large number of zero events, and the rare incidence of events in the control groups, we used reciprocal zero cell correction and fixed‐effect meta‐analysis (STATA 14; www.stata.com) (Sweeting 2004; Deeks 2011). The extracted data can be found in the Data and analyses section, but the meta‐analysis is performed in STATA (figure not shown). The meta‐analysis showed no evidence of a difference between the two intervention groups (OR 0.93, 95% CI 0.75 to 1.15, P = 0.52, I² = 0%; 43 trials, very low‐quality evidence, Analysis 2.1).
| Trial | Experimental intervention | Type and number of serious adverse events (experimental group) | Proportion of participants with a serious adverse event (experimental group) | Type and number of serious adverse events (control group) | Proportion of participants with a serious adverse event (control group) |
| Asunaprevir | 1 abdominal pain, 1 lung neoplasm malignant, 1 cytolytic hepatitis, and 2 unspecified events | 5 out of 36 | None reported | 0 out of 11 | |
| Asunaprevir | 2 deaths and 14 unspecified events | 16 out of 177 | 3 unspecified events | 3 out of 61 | |
| Balapiravir | Many events but only a few were specified: 3 deaths, 10 haematological, 10 infection, 8 eye disorders | 49 out of 432 | Many events but not all were specified: 2 infections, 1 death | 9 out of 72 | |
| Beclabuvir | 1 anaemia, 1 constipation, 1 febrile neutropenia, 1 leukopenia | 1 out of 26 | 1 serotonin syndrome | 1 out of 13 | |
| Boceprevir | 5 anaemia, 1 angina pectoris, 1 atrial fibrillation, 1 coronary artery disease, 1 myocardial infarction, 1 myopericarditis, 2 abdominal pain, 1 constipation, 1 diarrhoea, 1 gastritis, 1 irritable bowel syndrome, 1 oesophageal varices haemorrhage, 1 pancreatitis acute, 1 pancreatitis necrotising, 1 peptic ulcer, 1 asthenia, 3 chest pain, 1 oedema peripheral, 1 pyrexia, 1 cholecystitis, 3 appendicitis, 1 bronchopneumonia, 1 catheter site infection, 1 gastroenteritis viral, 1 pneumonia, 1 lower limb fracture, 1 overdose, 1 decreased appetite, 1 dehydration, 1 hyperglycaemia, 1 back pain, 2 intervertebral disc protrusion, 1 pain in extremity, 1 hepatic neoplasm malignant, 1 hepatic encephalopathy, 1 sciatica, 1 syncope, 1 bipolar disorder, 1 completed suicide, 4 depression, 2 homicidal ideation, 5 suicidal ideation, 2 dyspnoea, 1 pleuritic pain, 1 pneumothorax, 1 abdominal hernia repair, 1 deep vein thrombosis, 1 phlebitis | 39 out of 323 | 2 chest pain, 1 cholelithiasis, 1 gastroenteritis | 4 out of 80 | |
| Boceprevir | 1 coronary artery disease, 1 diarrhoea, 1 asthenia, 1 pyrexia, 2 pneumonia, 2 syncope, 1 suicidal ideation, 1 deep vein thrombosis, 1 neutropenia, 1 thrombocytopenia, 1 cardiac failure, 1 upper gastrointestinal haemorrhage , 1 multi‐organ failure, 1 bronchitis, 1 cellulitis, 1 chlamydia infection, 1 influenza, 1 pneumonia staphylococcal, 1 staphylococcal bacteraemia, 1 staphylococcal infection, 1 urosepsis, 1 gun shot wound, 2 hyponatraemia, 1 lethargy, 1 subarachnoid haemorrhage, 1 mental status changes | 18 out of 134 | 1 chest pain, 1 intervertebral disc protrusion, 1 abnormal behaviour, 1 irritability, 1 osteotomy, 1 foreign body, 1 neuralgia, 1 anxiety, 1 renal colic | 7 out of 67 | |
| Boceprevir | 14 neutropenia, 1 intestinal obstruction, 1 osteomyelitis chronic, 1 pneumonia, 1 diabetic ketoacidosis, 1 intervertebral disc protrusion, 1 transient ischaemic attack | 17 out of 159 | 4 neutropenia, 1 general disorders, 1 accidental overdose, 1 prostatitis, 2 hypertension | 9 out of 78 | |
| Boceprevir | 1 anaemia, 1 abdominal pain, 2 asthenia, 2 pyrexia, 2 pneumonia, 1 decreased appetite, 1 dehydration, 2 depression, 2 homicidal ideation, 3 suicidal ideation, 1 dyspnoea, 1 deep vein thrombosis, 3 nausea, 1 vomiting, 3 neutropenia, 1 multi‐organ failure, 2 cellulitis, 2 abdominal pain upper, 1 headache, 1 suicide attempt, 1 accidental overdose, 1 fall, 1 pulmonary embolism, 1 gastroenteritis, 1 erysipelas, 1 panic attack, 1 fatigue, 1 supraventricular tachycardia, 3 pancreatitis, 1 cerebrovascular accident, 1 hypoaesthesia, 1 anxiety, 1 retinal ischaemia, 1 neuropathy peripheral, 1 aggression, 1 scotoma, 1 hypovolaemia, 1 vulval abscess, 1 retinopathy, 1 inguinal hernia, 1 cervix carcinoma, 1 pericarditis, 1 paranoia, 1 neutrophil count decreased, 1 paraesthesia, 1 peritoneal haemorrhage, 1 deafness unilateral, 1 periodontal disease, 1 corneal infection, 1 pneumonia streptococcal, 1 drug toxicity, 1 blood amylase increased, 1 lipase increased, 1 basal cell carcinoma, 1 renal cell carcinoma | 40 out of 527 | 1 suicidal ideation, 1 breast cancer, 1 parathyroid tumour benign, 1 muscle spasms, 1 rib fracture, 1 contusion, 1 inguinal hernia, 1 diplopia, 1 staphylococcal sepsis, 1 animal bite, 1 hand fracture, 1 third nerve paralysis, 1 alcoholism, 1 dependence | 8 out of 104 | |
| Boceprevir | 1 anaemia | 1 out of 49 | 1 anaemia | 1 out of 52 | |
| Boceprevir | 7 anaemia, 1 atrial fibrillation, 1 coronary artery disease, 2 abdominal pain, 1 gastritis, 1 pancreatitis acute, 5 chest pain, 4 pyrexia, 1 cholecystitis, 4 pneumonia, 1 overdose, 1 dehydration, 1 back pain, 1 intervertebral disc protrusion, 5 syncope, 1 completed suicide, 2 depression, 4 suicidal ideation, 1 dyspnoea, 1 nausea, 2 vomiting, 3 neutropenia, 3 thrombocytopenia, 2 bronchitis, 3 cellulitis, 1 staphylococcal infection, 1 hyponatraemia, 1 pancytopenia, 1 breast cancer, 1 malaise, 1 pneumonia pneumococcal, 1 haemoptysis, 1 road traffic accident, 1 suicide attempt, 1 pruritus, 1 rash erythematous, 1 dizziness, 2 pulmonary embolism, 1 haemorrhoids, 4 gastroenteritis, 1 general physical health deterioration, 1 hypertensive crisis, 1 colon cancer, 1 drug abuse, 2 hypokalaemia, 2 chest discomfort, 1 fatigue, 1 perirectal abscess, 1 acute myocardial infarction, 1 gastrointestinal haemorrhage, 1 aplasia pure red cell, 2 leukopenia, 1 atrial flutter, 1 cardiac arrest, 1 hypertrophic cardiomyopathy, 1 tachycardia, 1 deafness, 1 conjunctivitis, 1 optic neuropathy, 1 papilledema, 1 abdominal pain lower, 1 colonic polyp, 1 gastroesophageal reflux disease, 1 hematemesis, 1 haemorrhoidal haemorrhage, 1 Mallory‐weiss syndrome, 1 umbilical hernia, 1 sarcoidosis, 1 abscess, 1 abscess limb, 1 bacteraemia, 1 epiglottitis, 1 infected bites, 1 injection site infection, 1 scrotal abscess, 1 tracheobronchitis, 1 post procedural complication, 1 transfusion reaction, 1 vascular pseudoaneurysm, 1 wound dehiscence, 1 flank pain, 1 groin pain, 1 musculoskeletal chest pain, 1 bladder cancer, 1 pancreatic carcinoma, 1 prostate cancer, 1 carotid artery stenosis, 1 cerebral ischaemia, 1 motor neurone disease, 1 muscle spasticity, 1 affective disorder, 1 alcohol abuse, 1 anxiety, 1 psychiatric decompensation, 1 scrotal pain, 2 cough, 1 pleural fibrosis, 1 alcohol use, 1 laryngeal operation, 1 accelerated hypertension, 1 arterial thrombosis limb, 2 hypotension | 87 out of 734 | 1 anaemia, 1 myocardial infarction, 1 abdominal pain, 2 pyrexia, 1 cholecystitis, 1 appendicitis, 1 pneumonia, 1 hepatic neoplasm malignant, 1 completed suicide, 1 depression, 1 suicidal ideation, 1 pneumothorax, 2 cholelithiasis, 1 nausea, 1 vomiting, 1 cellulitis, 1 breast cancer, 1 colitis, 1 upper respiratory tract infection, 1 suicide attempt, 2 death, 1 accidental overdose, 1 dizziness, 1 loss of consciousness, 1 cholecystitis acute, 1 sinusitis, 2 pancreatitis, 1 leukocytosis, 1 cardiac arrest, 1 cardio‐respiratory arrest, 1 hypothyroidism, 1 cholelithiasis obstructive, 1 atypical mycobacterial infection, 1 diverticulitis, 1 enterocolitis infectious, 1 alcohol poisoning, 1 spinal fracture, 1 white blood cell count decreased, 1 lung adenocarcinoma, 1 prostate cancer, 1 hypoaesthesia, 1 affective disorder, 1 bipolar disorder, 1 drug dependence, 1 intentional self‐injury, 1 personality disorder, 1 glomerulonephritis minimal lesion, 1 renal tubular necrosis, 1 physical assault, 1 cholecystectomy, 1 skin neoplasm excision | 31 out of 363 | |
| Boceprevir | None reported | 0 out of 28 | 1 atrial fibrillation | 1 out of 10 | |
| Boceprevir | 3 anaemia, 2 pneumonia, 1 syncope, 1 depression, 1 deep vein thrombosis, 1 lymphadenopathy, 1 renal failure acute, 2 pulmonary embolism, 1 arthralgia, 1 sinusitis, 1 urinary tract infection, 1 lung infection pseudomonal, 1 pelvic inflammatory disease, 1 pulmonary hypertension, 1 suicide attempt | 11 out of 64 | 2 anaemia, 1 overdose, 1 cholelithiasis, 1 abdominal pain upper, 1 meniscus lesion, 1 pancreatitis, 1 post procedural infection, 1 renal failure, 1 cholecystectomy, 1 vulval abscess, 1 ventricular fibrillation, 1 ligament rupture, 1 lactic acidosis, 1 respiratory failure | 7 out of 34 | |
| Daclatasvir | 1 hepatic neoplasm malignant, 1 rectal ulcer haemorrhage, 1 gastrointestinal inflammation, 1 adhesion, 1 biliary colic, 1 hyperbilirubinaemia, 1 appendiceal abscess, 1 tonsil cancer | 6 out of 196 | 1 abdominal pain upper, 1 epicondylitis, 1 conversion disorder | 3 out of 100 | |
| Daclatasvir | 1 anaemia, 1 abdominal pain, 1 gastritis, 1 chest pain, 2 pneumonia, 1 overdose, 1 syncope, 2 depression, 2 suicidal ideation, 1 dyspnoea, 1 bronchitis, 1 peritonitis, 1 rash generalised, 1 febrile neutropenia, 1 aplastic anaemia, 1 auricular perichondritis, 2 gastric ulcer haemorrhage, 1 death, 1 bile duct stone, 1 clostridium difficile, 1 furuncle, 1 carbuncle, 1 oral herpes, 1 accidental overdose, 2 falls, 1 bursitis, 1 rhabdomyolysis, 1 muscle spasms, 1 costochondritis, 1 dizziness, 1 loss of consciousness, 1 adjustment disorder, 1 hypomania, 1 mental disorder, 1 substance‐induced psychotic disorder, 1 schizophrenia, paranoid type | 25 out of 317 | 2 anaemia, 1 atrial fibrillation, 1 pneumonia, 1 pyelonephritis, 1 haemoglobin decreased, 1 epistaxis, 1 electrocardiogram change, 1 neutrophil count decreased, 1 myalgia, 1 aphasia, 1 paraesthesia | 6 out of 78 | |
| Daclatasvir | 1 pancreatitis acute, 1 back pain | 2 out of 34 | None reported | 0 out of 8 | |
| Daclatasvir | 1 anaemia, 1 chest pain, 2 syncope, 1 bronchitis, 1 epistaxis | 3 out of 36 | None reported | 0 out of 12 | |
| Danoprevir | 28 unspecified SAEs and 2 deaths | 29 out of 373 | 1 unspecified SAE | 1 out of 44 | |
| Danoprevir | 1 benign paroxysmal vertigo | 1 out of 40 | None reported | 0 out of 8 | |
| Danoprevir | 1 gastroenteritis viral | 1 out of 47 | None reported | 0 out of 12 | |
| Danoprevir | 1 altered mood | 1 out of 25 | None reported | 0 out of 5 | |
| Danoprevir | 14 SAEs but not specified, 1 death | 15 out of 194 | 6 SAEs but not specified | 6 out of 31 | |
| Deleobuvir | 1 drug eruption | 1 out of 46 | None reported | 0 out of 14 | |
| Deleobuvir | 1 syncope, 1 rash maculo‐papular, 1 umbilical hernia | 3 out of 49 | None reported | 0 out of 8 | |
| Faldaprevir | 2 anaemia, 1 angina pectoris, 2 diarrhoea, 1 oesophageal varices haemorrhage, 1 cholecystitis, 2 pneumonia, 1 dehydration, 1 back pain, 1 intervertebral disc protrusion, 1 bipolar disorder, 1 depression, 1 suicidal ideation, 1 dyspnoea, 2 nausea, 3 vomiting, 2 neutropenia, 1 thrombocytopenia, 1 cellulitis, 1 mental status changes, 1 pancytopenia, 1 breast cancer, 1 malaise, 2 rash, 2 sepsis, 1 suicide attempt, 1 renal failure acute, 1 rash maculo‐papular, 1 accidental overdose, 1 muscle spasm, 1 tibia fracture, 1 contusion, 1 pulmonary embolism, 2 abortion spontaneous, 1 hypokalaemia, 1 subcutaneous abscess, 1 acute myocardial infarction, 1 pancreatitis, 1 umbilical hernia, 1 diverticulitis, 1 cerebral ischaemia, 1 drug dependence, 1 personality disorder, 1 epidermolysis, 1 ascites, 1 duodenal ulcer haemorrhage, 1 large intestine perforation, 1 hepatic cirrhosis, 2 hepatic failure, 1 hypersensitivity, 1 infective chondritis, 1 vulval abscess, 1 fibula fracture, 1 jaw fracture, 1 ligament sprain, 1 hypocalcaemia, 1 hyponatraemia, 1 hepatocellular carcinoma, 1 papillary thyroid cancer | 47 out of 525 | 1 anaemia, 2 depression, 1 suicidal ideation, 1 bile duct stone, 1 subcutaneous abscess, 1 optic ischaemic neuropathy, 1 laceration, 1 mental status change | 8 out of 132 | |
| Faldaprevir | 3 anaemia, 1 atrial fibrillation, 1 myocardial infarction, 1 asthenia, 1 chest pain, 1 pyrexia, 1 bronchopneumonia, 1 pneumonia, 1 sciatica, 2 vomiting, 1 thrombocytopenia, 1 pancytopenia, 1 headache, 2 rash, 1 drug eruption, 1 dizziness, 1 haemorrhoids, 1 psychotic disorder, 1 urinary tract infection, 1 diabetes mellitus, 1 parapsoriasis, 1 pancreatitis, 1 histiocytosis haematophagic, 1 cerebrovascular accident, 1 muscular weakness, 1 epistaxis, 1 leukopenia, 1 sarcoidosis, 1 hypotension, 1 idiopathic thrombocytopenic purpura, 1 optic ischaemic neuropathy, 1 hypersensitivity, 1 hypoparathyroidism, 1 retinopathy, 1 subdural hematoma, 1 cervix carcinoma, 1 cubital tunnel syndrome, 1 dyspnoea exertional | 34 out of 520 | 1 anaemia, 1 cholecystitis, 1 gun shot wound, 1 rash maculo‐papular, 1 diverticulitis, 1 inguinal hernia, 1 hepatic lesion, 1 polymyositis, 1 blister | 8 out of 132 | |
| Faldaprevir | 5 anaemia, 1 atrial fibrillation, 1 abdominal pain, 5 diarrhoea, 1 pancreatitis acute, 1 asthenia, 1 chest pain, 8 pyrexia, 2 appendicitis, 1 gastroenteritis viral, 2 pneumonia, 1 decreased appetite, 1 dehydration, 1 back pain, 1 hepatic neoplasm malignant, 2 cholelithiasis, 1 biliary colic, 2 hyperbilirubinaemia, 3 nausea, 2 vomiting, 1 thrombocytopenia, 1 cellulitis, 1 bradycardia, 2 presyncope, 2 malaise, 2 headache, 2 sepsis, 1 rash erythematous, 1 rash generalised, 1 fall, 1 multiple injuries, 1 haematochezia, 1 peritonitis bacterial, 1 congestive cardiac failure, 1 gastroenteritis, 1 hypertensive crisis, 1 hypokalaemia, 1 fatigue, 1 pancreatitis, 1 coma, 1 renal colic, 1 leukopenia, 1 cardio‐respiratory arrest, 1 anxiety, 1 psychiatric decompensation, 2 hypotension, 1 viral infection, 2 ascites, 1 hepatic failure, 1 hypoglycaemia, 1 haemolytic anaemia, 1 keratosis follicular, 1 oral lichen planus, 1 peritoneal haemorrhage, 1 salivary gland calculus, 1 hepatorenal failure, 2 jaundice, 1 streptococcal infection, 1 blood lactate dehydrogenase increased, 1 international normalised ratio abnormal, 1 metabolic acidosis, 1 fasciitis, 1 joint instability, 1 musculoskeletal discomfort, 1 haemothorax, 1 venous thrombosis | 54 out of 599 | 1 depression, 1 pleural effusion | 1 out of 78 | |
| Faldaprevir | 1 abdominal pain upper | 1 out of 35 | 1 abdominal pain | 1 out of 8 | |
| Faldaprevir | 1 asthenia, 1 cataract , 1 hypoalbuminaemia, 1 metabolic disorder, 1 ascites | 4 out of 88 | None reported | 0 out of 8 | |
| Faldeprevir | 4 anaemia, 1 angina pectoris, 1 myocardial infarction, 1 diarrhoea, 1 asthenia, 1 chest pain, 1 oedema peripheral, 4 pyrexia, 1 cholecystitis, 1 pneumonia, 2 dehydration, 1 intervertebral disc protrusion, 2 syncope, 1 depression, 1 nausea, 2 vomiting, 1 thrombocytopenia, 1 upper gastrointestinal haemorrhage, 1 influenza, 1 lower respiratory tract infection, 2 photosensitivity reaction, 1 upper respiratory tract infection, 2 headache, 1 rash, 1 road traffic accident, 2 suicide attempt, 3 drug eruption, 2 rash maculo‐papular, 1 rash erythematous, 2 febrile neutropenia, 1 oral herpes, 1 pulmonary embolism, 1 pyelonephritis, 1 cataract, 1 anaemia haemolytic autoimmune, 1 lymphopenia, 1 microvascular angina, 1 prinzmetal angina, 1 anal fistula, 1 haemorrhoids, 1 mouth ulceration, 1 rectal haemorrhage, 1 chest discomfort, 1 fatigue, 1 mucosal inflammation, 1 gallbladder polyp, 1 cryoglobulinaemia, 1 anal abscess, 1 ear infection, 2 H1N1 influenza, 1 infected skin ulcer, 1 lymphangitis, 1 perirectal abscess, 1 pharyngitis, 1 subcutaneous abscess, 1 superinfection bacterial, 1 urinary tract infection, 1 diabetes mellitus, 1 ischaemic stroke, 1 acute psychosis, 1 depressed mood, 1 calculus ureteric, 1 endometrial hyperplasia, 1 dermatitis atopic, 1 eczema, 1 erythema multiforme, 1 lichen planus, 1 palmar‐plantar erythrodysaesthesia syndrome, 1 parapsoriasis, 1 pruritus allergic, 1 rash pruritic, 1 appendicectomy | 61 out of 641 | 1 headache, 1 photophobia, 1 cyst, 1 benign salivary gland neoplasm, 1 migraine | 2 out of 71 | |
| Filibuvir | 1 blood creatinine increased, 1 chronic obstructive pulmonary disease, 1 pulmonary embolism | 3 out of 27 | 1 thyroiditis, 1 gait disturbance | 2 out of 8 | |
| Filibuvir | 1 anaemia, 1 appendicitis, 1 rectal ulcer haemorrhage, 1 craniocerebral injury, 1 vertigo, 1 vestibular disorder, 1 haematochezia, 1 peritonitis bacterial, 1 lymph node tuberculosis, 1 scapula fracture, 1 blood urea nitrogen/creatinine increased, 1 gastric cancer, 1 rectal cancer, 1 abortion spontaneous, 1 cardiac necrosis, 1 pyoderma gangrenosum, 1 depression, 1 breast cancer, 1 chronic obstructive pulmonary disease, 1 lung neoplasm malignant, 1 fall, 1 loss of consciousness, 1 bacterial abscess CNS, 1 actinomyces test positive, 1 pulmonary calcification | 20 out of 192 | 1 neutropenia, 1 sepsis, 1 pulmonary embolism, 1 cerebral haemorrhage, 1 ecchymosis, 1 Appendicitis perforated | 6 out of 96 | |
| GS‐9451 | 1 death, 1 heroin overdose | 1 out of 33 | None reported | 0 out of 8 | |
| GSK2336805 | 1 pneumonia, 1 upper lobe cavitary lesion | 1 out of 11 | None reported | 0 out of 4 | |
| IDX‐184 | 1 pancreatitis, 1 acute cholecystitis | 2 out of 65 | 1 agitation | 1 out of 16 | |
| Mericitabine/danoprevir | 1 multiple drug overdose, 1 ankle fracture | 2 out of 73 | None reported | 0 out of 14 | |
| Mericitabine | 1 nephrolithiasis, 1 porphyria non‐acute | 2 out of 102 | 1 arthritis infective | 1 out of 49 | |
| Mericitabine | 6 SAEs but not specified | 5 out of 81 | 4 SAEs but not specified | 3 out of 85 | |
| Narlaprevir | 1 pyrexia, 1 elevated CRP | 1 out of 32 | None reported | 0 out of 8 | |
| Odalasvir (ACH‐3102) and sovaprevir | 1 non‐cardiac chest pain | 1 out of 20 | None reported | 0 out of 10 | |
| Paritaprevir (ABT‐450)/r–ombitasvir | 1 pneumonia, 1 nausea, 1 vomiting, 1 bradycardia, 1 chronic obstructive pulmonary disease, 1 renal failure acute, | 9 out of 393 | 1 atrial fibrillation | 1 out of 97 | |
| Paritaprevir/ABT‐072/dasabuvir | 1 haemorrhoids, 1 malignant melanoma | 2 out of 63 | None reported | 0 out of 11 | |
| Paritaprevir/ombitasvir | 1 anaemia, 1 abdominal pain, 1 diarrhoea, 1 cholecystitis, 1 appendicitis, 1 overdose, 1 sinus tachycardia, 1 ventricular extrasystoles, 1 nausea, 1 vomiting, 1 chills, 1 non‐cardiac chest pain, 1 lobar pneumonia, 1 postoperative wound infection, 1 lumbar vertebral fracture, 1 non‐small cell lung cancer, 1 encephalopathy, 1 acute respiratory failure, 1 hypoxia, 1 mediastinal mass, 1 aortic stenosis, 1 biliary colic, 1 subcutaneous abscess | 12 out of 630 | None reported | 0 out of 158 | |
| R1626 | 6 SAEs but not specified | 6 out of 84 | 1 SAE but not specified | 1 out of 20 | |
| Simeprevir | 1 abdominal pain, 1 pyrexia, 1 appendicitis, 2 pneumonia, 1 depression, 1 dyspnoea, 1 cholelithiasis, 1 anaemia haemolytic autoimmune, 1 pancytopenia, 1 angina pectoris, 1 bradycardia, 1 myocardial ischaemia, 1 hepatitis, 1 endocarditis, 1 lower respiratory tract infection, 1 septic shock, 1 breast cancer, 1 Guillain‐Barre syndrome, 1 presyncope, 1 confusional state, 1 vaginal haemorrhage, 1 chronic obstructive pulmonary disease, 1 respiratory acidosis, 1 photosensitivity reaction | 14 out of 260 | 1 atrial fibrillation, 1 depression, 1 bronchitis, 1 hypercalcaemia, 1 head injury, 1 bacterial prostatitis, 1 pericarditis, 1 infection, 1 inguinal hernia, 1 neuropathy peripheral, 1 arthritis infective, 1 headache | 11 out of 133 | |
| Simeprevir | 1 cholecystitis, 1 intervertebral disc protrusion, 1 depression, 1 nausea, 1 breast cancer, 1 hyperthyroidism, 1 ocular vasculitis, 1 abdominal pain upper, 1 colitis, 1 small intestinal obstruction, 1 malaise, 1 incision site cellulitis, 1 necrotising fasciitis, 1 perihepatic abscess, 1 pneumonia pneumococcal, 1 upper respiratory tract infection, 1 post‐procedural bile leak, 1 malnutrition, 1 type 1 diabetes mellitus, 1 spinal disorder, 1 parathyroid tumour benign, 1 headache, 1 haemoptysis, 1 cutaneous vasculitis, 1 hypertension | 20 out of 309 | 1 myocardial infarction, 1 myopericarditis, 1 asthenia, 1 appendicitis, 1 vomiting, 1 chronic obstructive pulmonary disease, 1 headache, 1 subcutaneous abscess, 1 vulval abscess, 1 myositis, 1 ovarian neoplasm | 10 out of 77 | |
| Simeprevir | 1 subarachnoid haemorrhage, 1 malaise, 1 cerebral infarction, 1 vulvar erosion, 1 rash, 1 incorrect dose administered | 5 out of 79 | None reported | 0 out of 13 | |
| Simeprevir | 1 depression, 1 non‐cardiac chest pain, 1 angina unstable, 1 nephrolithiasis, 1 ureteric stenosis, 1 colitis ischaemic, 1 incision site infection, 1 craniocerebral injury, 1 foot fracture, 1 meniscus lesion, 1 multiple injuries, 1 rib fracture, 1 tibia fracture, 1 traumatic lung injury, 1 wound, 1 cholesterosis, 1 type 2 diabetes mellitus, 1 shock haemorrhagic | 10 out of 305 | 1 anaemia, 1 decreased appetite, 1 cholelithiasis, 1 contusion, 1 supraventricular tachycardia, 1 ligament sprain, 1 pain, 1 atypical pneumonia, 1 chronic hepatitis C, 1 pulmonary tuberculosis, 1 undifferentiated connective tissue disease, 1 brain neoplasm | 9 out of 152 | |
| Simeprevir | 1 sinus arrest, 1 erysipelas, 1 type 1 diabetes mellitus, 1 psychotic disorder, 1 drug abuse, 1 bronchitis, 1 exostosis, 1 toe deformity, 1 hyperthyroidism, 1 Bowen's disease, 1 neutropenia, 1 thrombocytopenia, 1 breast cancer, 1 sepsis, 1 cupulolithiasis, 1 pneumonia escherichia, 1 panic reaction | 13 out of 88 | 1 pneumonia, 1 sinusitis, 1 panic attack, 1 social stay hospitalisation, 1 pneumonia escherichia | 3 out of 28 | |
| Simeprevir | 2 anaemia, 1 back pain, 1 syncope, 1 hyperthyroidism, 1 death, 1 muscle spasms, 1 colon cancer, 1 anal abscess, 1 urinary tract infection, 1 mixed deafness, 1 hyphaema, 1 visual impairment, 1 enterocutaneous fistula, 1 autoimmune hepatitis, 1 lymphadenitis bacteria, 1 fluid overload, 1 epilepsy, 1 memory impairment, 1 aggression | 16 out of 257 | 1 anaemia, 1 pancreatitis acute, 1 dehydration, 1 vomiting, 1 pancytopenia, 1 loss of consciousness, 1 angina unstable, 1 meniscus lesion, 1 pulmonary embolism, 1 cholecystitis acute, 1 drug abuse, 1 retinal ischaemia, 1 respiratory tract infection viral, 1 viral infection, 1 neuropathy peripheral, 1 thoracic outlet syndrome | 10 out of 134 | |
| Simeprevir | None reported | 0 out of 58 | 1 liver decompensation | 1 out of 24 | |
| Simeprevir | 1 anaemia, 1 abdominal pain, 1 diarrhoea, 1 oedema peripheral, 2 cholecystitis, 1 pneumonia, 1 overdose, 2 | 31 out of 396 | 1 sciatica, 1 nausea, 1 vomiting, 1 lower respiratory tract infection, 1 haemorrhoids, 1 weight decreased, 1 histiocytosis haematophagic, 1 tuberculosis | 4 out of 66 | |
| Sofosbuvir | 1 drug withdrawal syndrome, 1 non‐cardiac chest pain, 1 oedema peripheral, 1 pyrexia, 1 hypersensitivity, 1 abdominal abscess, 1 cellulitis, 2 overdose, 1 injury, 1 road traffic accident, 1 spinal compression fracture, 1 hypoglycaemia, 1 hepatic neoplasm malignant, 1 abnormal behaviour, 1 eczema | 11 out of 207 | 1 pancreatitis, 1 bile duct stone, 1 bronchitis | 2 out of 71 | |
| Sofosbuvir | 1 retinal vein occlusion, 1 depression, 1 suicidal ideation, 1 lymphangitis, 1 acute myocardial infarction | 4 out of 95 | 1 chest pain, 1 electrocardiogram ST segment elevation | 1 out of 26 | |
| Sofosbuvir | 1 anaemia, 1 chest pain, 1 cellulitis, 1 chronic obstructive pulmonary disease, 1 urinary tract infection, 1 allergy to anthropod sting, 1 osteomyelitis chronic , 1 toxicity to various agents | 7 out of 256 | 1 pneumothorax, 1 breast cancer, 1 infection, 1 atrioventricular shock, 1 clavicle fracture, 1 rib fracture | 3 out of 243 | |
| Sofosbuvir | 1 anaemia, 1 depression, 1 peripheral ischaemia, 1 pancreatitis acute | 4 out of 49 | 1 abdominal pain | 1 out of 14 | |
| Sofosbuvir/velpatasvir | 1 bronchitis, 1 cellulitis, 1 influenza, 1 chronic obstructive pulmonary disease, 1 death, 1 gastroenteritis, 1 acute myocardial infarct, 1 ligament sprain, 1 foot abscess, 1 foot necrosis, 1 recurring appendicitis, 1 epileptic seizure, 1 rotator cuff syndrome, 1 lung cancer, 1 mania, 1 palpitations, 1 small bowel obstruction, 1 upper limb fracture, 1 vestibular neuronitis | 15 out of 624 | None reported | 0 out of 116 | |
| Telaprevir | 1 cholelithiasis | 1 out of 16 | None reported | 0 out of 8 | |
| Telaprevir | 5 anaemia, 2 abdominal pain, 1 asthenia, 1 pyrexia, 1 back pain, 3 syncope, 3 depression, 2 dyspnoea, 1 nausea, 1 chills, 1 pancytopenia, 5 rash, 1 lymphadenopathy, 1 hydrocele, 1 retinal haemorrhage, 1 catheter‐related complication, 1 bacterial sepsis, 1 pneumonia, 1 herpes viral, 1 sepsis, 1 road traffic accident, 1 tendon rupture, 1 lung neoplasm malignant, 1 speech disorder, 1 disorientation, 1 emotional distress, 1 suicide attempt, 1 renal failure, 1 acute testicular swelling, 3 pruritis, 2 drug eruption, 2 rash maculo‐papular, 1 rash erythematous, 1 rash generalised, 1 toxic skin eruption, 1 urticaria, 1 splenectomy | 36 out of 241 | 2 anaemia, 1 angina pectoris, 1 syncope, 1 hyperthyroidism, 1 gastroenteritis, 1 haemorrhagic anaemia, 1 alcoholic pancreatitis, 1 paranoia, 1 uterine polyp | 8 out of 82 | |
| Telaprevir | 18 anaemia, 3 pneumonia, 3 syncope, 2 cellulitis, 5 rash, 3 psychiatric disorder, 2 musculoskeletal disorder, 2 cardiac disorder, 2 eye disorder, 3 hepatobiliary disorders, 2 vascular disorder | 64 out of 727 | 4 anaemia, 1 cellulitis, 3 psychiatric disorder, 3 musculoskeletal disorder, 2 cardiac disorder, 4 renal and urinary disorder, 1 eye disorder, 1 vascular disorder | 24 out of 361 | |
| Telaprevir | 2 anaemia, 1 gastroenteritis viral, 1 dehydration, 2 depression, 1 non‐cardiac chest pain, 1 chronic obstructive pulmonary disease, 1 rash, 1 rash generalised, 1 furuncle, 1 colitis ischaemic, 1 acute myocardial infarction, 1 adrenal disorder, 2 scotoma, 1 retinal exudates, 1 retinal infarction, 1 bronchitis bacterial, 1 incisional hernia, 1 lumbar radiculopathy, 1 exfoliative rash | 18 out of 175 | 1 lobar pneumonia, 1 pancytopenia, 1 anxiety, 1 lymphadenitis bacteria, 1 deafness neurosensory | 4 out of 75 | |
| Telaprevir | 6 anaemia, 1 pancreatitis acute, 1 gastroenteritis viral, 1 pneumonia, 1 dehydration, 1 back pain, 1 suicidal ideation, 2 cholelithiasis, 1 postoperative wound infection, 1 upper gastrointestinal haemorrhage, 1 confusional state, 2 small intestinal obstruction, 1 necrotising fasciitis, 1 pneumonia pneumococcal, 1 post‐procedural bile leak, 1 rash, 1 renal failure acute, 1 retinal detachment, 9 gastroenteritis, 1 cholecystitis acute, 1 sinusitis, 1 hypokalaemia, 1 eczema, 2 pancreatitis, 1 dermatitis, 1 diverticulitis, 1 alcohol abuse, 1 hypotension, 1 haemorrhagic anaemia, 1 idiopathic thrombocytopenic purpura, 1 cardiomyopathy, 1 diverticular perforation, 1 gastritis erosive, 1 abscess intestinal, 1 cholecystitis infective, 1 infected insect bite, 1 sepsis syndrome, 1 hypovolaemia, 1 B‐cell unclassifiable lymphoma low grade, 1 migraine with aura, 1 ruptured cerebral aneurysm, 1 neurogenic bladder, 1 lichenoid keratosis, 1 rash macular | 28 out of 339 | 1 anaemia, 1 pneumonia, 2 dehydration, 1 syncope, 1 depression, 1 non‐small cell lung cancer, 1 headache, 2 rash, 1 renal failure acute, 2 gastroenteritis, 1 renal tubular acidosis, 1 decubitus ulcer, 1 hematoma | 9 out of 114 | |
| Telaprevir | 1 myocardial infarction, 1 staphylococcal infection, 1 pyelonephritis acute, 1 haemolytic anaemia, 1 groin infection, 1 cellulitis staphylococcal, 1 staphylococcal abscess, 1 hypokalaemia, 1 hyponatraemia, 1 epididymitis, 1 non‐ cardiac chest pain | 7 out of 38 | 1 anaemia, 1 appendicitis, 1 peritonitis | 2 out of 22 | |
| Telaprevir | 13 anaemia, 1 febrile neutropenia, 2 pancytopenia, 1 thrombocytopenia , 3 acute myocardial infarction, 2 atrial fibrillation, 1 cardiac valve disease, 1 myocardial infarction, 1 supraventricular tachycardia, 1 sudden hearing loss, 1 Basedow's disease, 1 retinal detachment, 1 abdominal pain, 1 anal fissure, 1 caecitis, 1 gastrointestinal haemorrhage, 1 pancreatitis, 2 pancreatitis acute, 1 general physical health deterioration, 1 pyrexia, 1 appendicitis, 2 bronchitis, 1 erysipelas, 1 folliculitis, 1 Helicobacter gastritis, 1 pneumonia, 1 post‐procedural infection, 1 rectal abscess, 2 sepsis, 1 sinusitis, 1 tooth abscess, 2 urinary tract infection, 1 injection site reaction, 1 animal scratch, 1 ankle fracture, 1 femoral neck fracture, 1 multiple drug overdose, 1 blood corticotrophin decreased, 1 weight decreased, 1 anorexia, 1 diabetes mellitus, 1 bronchial carcinoma, 2 gastric cancer, 2 hepatic neoplasm malignant, 1 histiocytosis haematophagic, 1 lung neoplasm malignant, 1 lethargy, 1 subarachnoid haemorrhage, 2 syncope, 1 delirium, 1 depression, 1 insomnia, 1 substance abuse, 1 renal cyst, 1 renal failure, 1 urinary bladder polyp, 1 prostatitis, 1 pulmonary embolism, 1 dermatitis, 1 eczema , 1 erythema multiforme, 1 pruritus 1 pustular psoriasis, 1 rash, 2 toxic skin eruption, 1 orthostatic hypotension, 1 peripheral artery aneurysm | 65 out of 530 | 1 anaemia, 1 atrial fibrillation, 1 abdominal pain, 1 pneumonia, 1 colitis, 1 pyelonephritis, 1 cerebral thrombosis, 1 coma | 7 out of 132 | |
| Vaniprevir | 1 appendicitis, 1 lobar pneumonia, 1 septic shock, 1 confusional state, 1 gastroenteritis, 1 cholecystitis acute, 1 empyema, 1 haemoglobin decreased, 1 myopathy | 8 out of 75 | 1 colon cancer | 1 out of 19 | |
| Vaniprevir | 1 anaemia, 1 pneumonia, 1 syncope, 1 upper gastrointestinal haemorrhage, 1 cellulitis, 1 confusional state, 1 dizziness, 1 nephrolithiasis, 1 malignant melanoma, 3 retinal detachment, 1 joint dislocation, 1 congestive cardiac failure, 2 gastroenteritis, 1 femur fracture, 1 hyperglycaemia, 1 dermatomyositis, 1 retinal vascular thrombosis, 1 general physical health deterioration, 1 anaphylactic reaction, 1 pyelonephritis, 1 pyelonephritis acute, 1 carbon monoxide poisoning, 1 arthralgia, 1 arthritis infective, 1 completed suicide | 22 out of 229 | 1 hypertensive crisis | 1 out of 56 |
SAE: serious adverse events.
Heterogeneity
Neither visual inspection of the funnel plots nor tests for statistical heterogeneity (I² = 0%, P = 0.99) indicated significant heterogeneity.
Trial Sequential Analysis
The Trial Sequential Analysis showed that the Z‐curve crossed the trial sequential monitoring boundary for futility. Hence, there is firm evidence that DAAs versus control do not reduce the risk of serious adverse events by 20% or more (Figure 3).

Trial Sequential Analysis of the effects of direct‐acting antivirals on the market or under development versus placebo or no intervention on risk of serious adverse events. The analysis was based on a proportion in the control group (Pc) of 4.5%, a relative risk reduction (RRR) of 20%, and alfa of 2.5%, a beta of 20%, and a diversity of 0%. The cumulative Z‐curve enters the futility area after the randomisation of about 6000 participants.
Bayes factor
Bayes factor was calculated based on a RR of 20%, and the meta‐analysis result (OR 0.93). Bayes factor was 2.41 which is above the Bayes factor threshold for significance of 0.1, supporting that there seems to be more evidence for the null hypothesis compared to the evidence for an intervention effect of 20% relative risk reduction (RRR).
Risk of bias and sensitivity analyses
The risk of bias of the outcome result was assessed as high risk of bias.
The best‐worst case meta‐analysis (OR 0.79, 95% CI 0.64 to 0.97, I²= 0%, P = 0.022) (see Dealing with missing data) and worst‐best case meta‐analysis (OR 1.06, 95% CI 0.86 to 1.31, I² = 0%, P = 0.56) (see Dealing with missing data) showed that incomplete outcome data may influence the results.
Visual inspection of the funnel plots showed no clear signs of asymmetry.
Subgroup analyses
The test for subgroup differences comparing the effects of each type of DAA showed no evidence of a difference (P = 0.49). The only single DAA that showed evidence of a difference when meta‐analysed separately was simeprevir (OR 0.62, 95% CI 0.45 to 0.86, P = 0.004; Analysis 2.3). However, a post hoc Trial Sequential Analysis showed that the trial sequential monitoring boundary for benefit was not crossed (Figure 4). Furthermore, if just one trial with an extreme result (Forns 2014) was excluded from the analysis then a post hoc sensitivity meta‐analysis did not show evidence of a difference (OR 0.70, 95% CI 0.49 to 1.01, P = 0.053). The remaining P values for each DAA meta‐analysed separately were: paritaprevir P = 0.69; asunaprevir P = 0.20; alisporivir P = 0.15; daclatasvir P = 0.75; danoprevir P = 0.15; mericitabine P = 0.96; GSK2336805 P = 0.63; sofosbuvir P = 0.66; GS‐9451 P = 0.70; vaniprevir P = 0.06; GS‐9851 P = 0.83; beclabuvir P = 0.44 (Analysis 2.3).
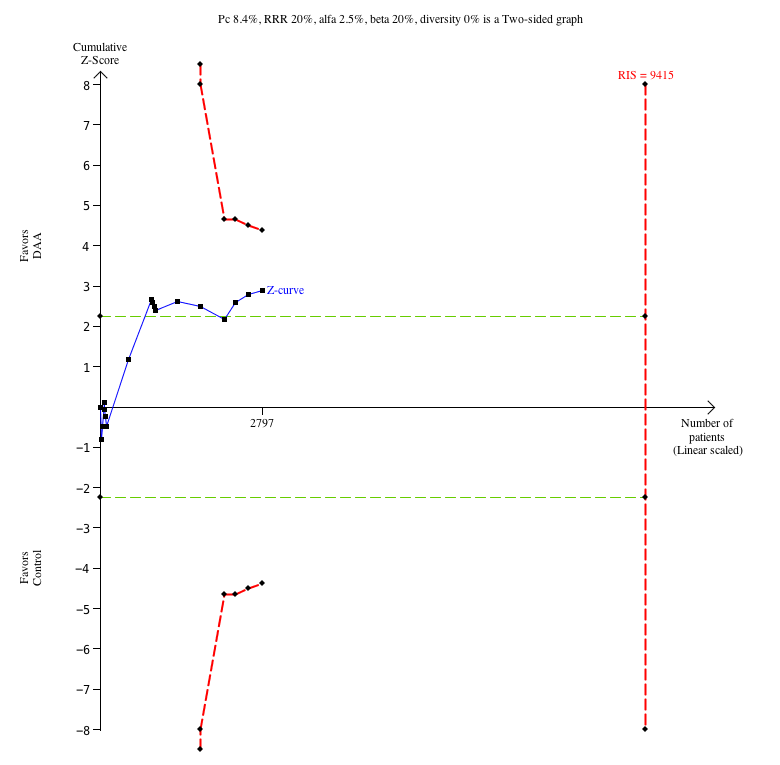
Trial Sequential Analysis of the effects of simeprevir versus placebo or no intervention on risk of serious adverse events. The analysis was based on a proportion in the control group (Pc) of 8.4%, a relative risk reduction (RRR) of 20%, and alfa of 2.5%, a beta of 20%, and a diversity of 0%. The cumulative Z‐curve crosses the naive type I error level of 5%, but it does not cross the trial monitoring boundary for benefit.
The test for subgroup differences showed no evidence of a difference in five subgroup analyses (treatment‐naive compared to treatment‐experienced, P = 0.39; IFN in both groups compared to no IFN in both groups, P = 0.277; RBV in both groups compared to no RBV in both groups, P = 0.10; viral genotype 1 compared to mixed, P = 0.09); subclasses of DAAs (P = 0.31). Because of no relevant data it was not possible to conduct any of the remaining planned subgroup analyses (Analysis 2.3; Analysis 2.4; Analysis 2.5; Analysis 2.6; Analysis 2.7; Analysis 2.8; Analysis 2.9; Analysis 2.10; Analysis 2.11; Analysis 2.12; Analysis 2.13; Analysis 2.14; Analysis 2.15; Analysis 2.16; Analysis 2.17).
As a post hoc analysis we calculated the median dose of each assessed DAA. We then divided all trials reporting relevant data into two groups: 1. trials assessing the effects of a DAA over or at the median dose, and 2. trials assessing the effects of a DAA below the median dose. The test for subgroup differences showed no evidence of a difference (P = 0.67).
Assessment of clinical significance
We did not assess the clinical significance of the results on serious adverse events because the threshold for statistical significance was not crossed.
Health‐related quality of life
Only one trial assessed the effects of a DAA (sofosbuvir, DAA on the market) on quality of life (SF 36 mental score and SF 36 physical score) (FISSION 2013). There was no evidence of a difference between the DAA and control on either SF 36 mental score or SF 36 physical score (FISSION 2013). An additional trial also assessed the effects sofosbuvir on quality of life (SF 36 mental score and SF 36 physical score) (POSITRON 2013). However, this trial randomised participants to a combination of DAAs and RBV versus placebo. There was no evidence of a difference between the compared groups on either SF 36 mental score or SF 36 physical score (POSITRON 2013).
No sustained virological response
Meta‐analysis
Thirty‐two trials with a total of 7115 participants reported results on no sustained virological response. A total of 1214/5347 (22.7%) in the DAA groups and a total of 955/1768 (54.0%) participants in the control group had no sustained virological response during the observation period. Meta‐analysis showed that DAAs seemed to decrease the risk of no sustained virological response (RR 0.44, 95% CI 0.37 to 0.52, P < 0.00001, I² = 77%, 32 trials, low‐quality evidence; Analysis 3.1).
Heterogeneity
Visual inspection of the funnel plots did not indicate significant statistical heterogeneity (Analysis 3.1). The tests for statistical heterogeneity (I² = 78%; P < 0.00001) indicated significant heterogeneity.
Trial Sequential Analysis
The Trial Sequential Analysis showed that the Z‐curve crossed the trial sequential monitoring boundary for benefit. Hence, there is evidence that DAAs versus control do reduce the risk of no sustained virological response by 20% or more (Figure 5).
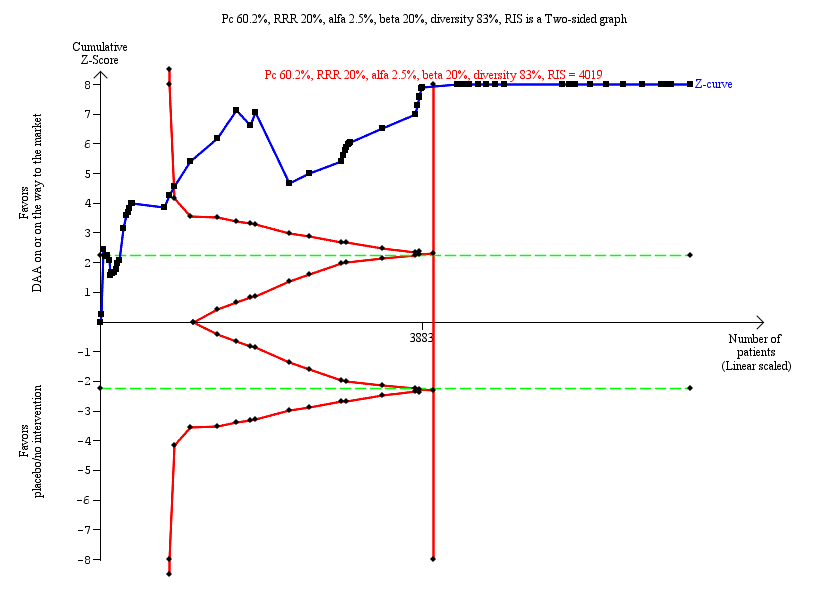
Trial Sequential Analysis of the effects of direct‐acting antivirals on the market or under development versus placebo or no intervention on risk of no sustained virological response. The analysis was based on a proportion in the control group (Pc) of 60.2%, a RRR of 20%, and alfa of 2.5%, a beta of 20%, and a diversity of 83%. After randomisation of about 1000 participants, the cumulative Z‐curve crosses the trial sequential monitoring boundary for benefit.
Bayes factor
Bayes factor was calculated based on a RR of 20%, and the meta‐analysis result (OR 0.44). Bayes factor of 3.29 * 10‐25 was below the Bayes factor threshold for significance of 0.1, supporting that there seems to be more evidence for a 20 % RRR on risk of no sustained virological response compared to evidence for the null hypothesis.
Risk of bias and sensitivity analyses
The risk of bias of the outcome result was assessed as high.
The best‐worst (OR 0.41, 95% CI 0.34 to 0.49, Analysis 3.18) and the worst‐best (OR 0.51, 95% CI 0.43 to 0.60, Analysis 3.19) case meta‐analyses showed that incomplete outcome data bias did not seem to have any potential impact on the meta‐analysis result.
Visual inspection of the funnel plots showed signs of asymmetry. However, the Harbord test showed no evidence of a difference (P = 0.52).
Subgroup analyses
Types of DAA
The test for subgroup differences comparing the effects of each type of DAA showed evidence of a difference between the different DAAs (P < 0.001, I² = 61.1%, Analysis 3.3). When analysed separately, the following single DAAs all showed evidence of an effect when assessing no sustained virological response: asunaprevir (RR 0.49, 95% CI 0.29 to 0.85, Analysis 3.3); daclatasvir (RR 0.60, 95% CI 0.50 to 0.73, Analysis 3.3); danoprevir (RR 0.38, 95% CI 0.28 to 0.51, Analysis 3.3); GS‐9451 (RR 0.42, 95% CI 0.26 to 0.67, Analysis 3.3); simeprevir (RR 0.39, 95% CI 0.33 to 0.46, Analysis 3.3); sofosbuvir (RR 0.34, 95% CI 0.20 to 0.58, Analysis 3.3); and vaniprevir (RR 0.33, 95% CI 0.25 to 0.43, Analysis 3.3).
Subclass of DAA
The test for subgroup differences comparing the effects of each type of DAA showed evidence of a difference between the different DAAs (P < 0.00001, I² = 95%, Analysis 3.4). When analysed separately, the following subclasses of DAAs all showed evidence of an effect when assessing no sustained virological response: NS3/NS4A inhibitors (RR 0.41, 95% CI 0.36 to 0.46, Analysis 3.4); NS5B inhibitors (NPI) (RR 0.57, 95% CI 0.36 to 0.90); and NS5A inhibitors (RR 0.59, 95% CI 0.49 to 0.69, Analysis 3.4).
Viral genotype
The test for subgroup differences comparing the effects of DAAs in different genotypes showed evidence of a difference between the subgroups (P = 0.002; I² = 73.6%, Analysis 3.7). Only trials randomising participants with HCV genotype 1 (RR 0.43, 95% CI 0.37 to 0.50, Analysis 3.7) and HCV genotype 4 (RR 0.10, 95% CI 0.02 to 0.68, Analysis 3.7) showed an evidence of a difference when analysed separately.
Human genotype
The test for subgroup differences comparing the effects of DAAs in different human genotypes did not show evidence of a difference between the subgroups (P = 0.62; I² = 0%, Analysis 3.8). All of the subgroups showed clear evidence of differences in favour of DAAs when analysed separately (Analysis 3.8).
Trials conducted in an Asian region compared to trials not conducted in an Asian region
The test for subgroup differences comparing the effects of DAAs in trials conducted in an Asian region compared to trials conducted outside an Asian region showed evidence of a difference between the subgroups, with larger effects in Asia: (P < 0.02, I² = 70.3%, Analysis 3.9). When analysed separately, both trials randomising Asian (RR 0.34, 95% CI 0.28 to 0.42) and non‐Asian (RR 0.51, 95% CI 0.43 to 0.60) participants showed clear evidence of differences in favour of DAAs (Analysis 3.9).
Treatment‐experienced compared to treatment‐naive
The test for subgroup differences comparing the effects of DAAs in trials randomising treatment‐experienced participants to trials randomising treatment‐naive participants, did not show evidence of a difference between the subgroups (P = 0.46; I² = 0%, Analysis 3.12). When analysed separately, both trials randomising treatment‐experienced (RR 0.50, 95% CI 0.36 to 0.69) and treatment‐naive (RR 0.48, 95% CI 0.41 to 0.56) participants showed clear evidence of differences in favour of DAAs (Analysis 3.12).
IFN as co‐intervention compared to no IFN as co‐intervention
The test for subgroup differences comparing the effects of DAAs in trials using IFN as co‐intervention in both groups compared to trials not using IFN as co‐intervention in both groups, did not show evidence of a difference between the subgroups (P = 0.68, I² = 0%, Analysis 3.13).
None of the remaining planned subgroup analyses were possible to conduct because of the lack of relevant trial data.
As a post hoc analysis we calculated the median dose of each assessed DAA. We then divided all trials reporting relevant data into two groups: 1. trials assessing the effects of a DAA over or at the median dose, and 2. trials assessing the effects of a DAA below the median dose. The test for subgroup differences showed no evidence of a difference (P = 0.56; Analysis 3.20).
Assessment of clinical significance
A number of the analyses showed clear evidence of an effect. However, the clinical relevance of these effects on a non‐validated surrogate outcome results is unclear (see Background).
Analysis of trials using RBV and IFN only in the control group
Analysis of trials using RBV and IFN only in the control group and not as co‐intervention in the experimental group, showed that there was no evidence of a difference between the DAAs versus RBV and IFN on risk of serious adverse events (OR 1.81, 95% CI 0.74 to 4.44, P = 0.192, I² = 0%, 3 trials, very low‐quality evidence).
Our results are summarised in our 'Summary of findings' tables (summary of findings Table for the main comparison; summary of findings Table 2).
Analyses of trials assessing the effects of withdrawn DAAs
Hepatitis C‐related morbidity or all‐cause mortality
When analysing the composite outcome hepatitis C‐related morbidity or all‐cause mortality, all events were deaths only.
Meta‐analysis showed no evidence of an effect when assessing the effects of withdrawn DAAs on hepatitis C‐related morbidity or all‐cause mortality (OR 0.64, 95% CI 0.23 to 1.79, P = 0.40, I² = 0%; 5 trials, very low‐quality evidence). Test for subgroup differences between DAAs on the market and withdrawn DAAs showed no evidence of a difference (P=0.45) (Analysis 5.1)
Additional analyses
Due to the total lack of data on hepatitis C‐related morbidity and the low number of events on all‐cause mortality, we did not perform additional analysis, including Trial Sequential Analysis, Bayes factor, funnel plots, or subgroup analysis.
Serious adverse events
Meta‐analysis showed that withdrawn DAAs seemed to increase the risk of serious adverse events (OR 1.45, 95% CI 1.22 to 1.73, P = 0.001, I² = 0%, 29 trials, very low‐quality evidence). A post hoc Trial Sequential Analysis confirmed this meta‐analysis result (Figure 6). Test for subgroup differences between DAAs on the market and withdrawn DAAs showed evidence of a difference between the DAAs that are on the market and the withdrawn DAAs (P < 0.001) (Analysis 6.1).
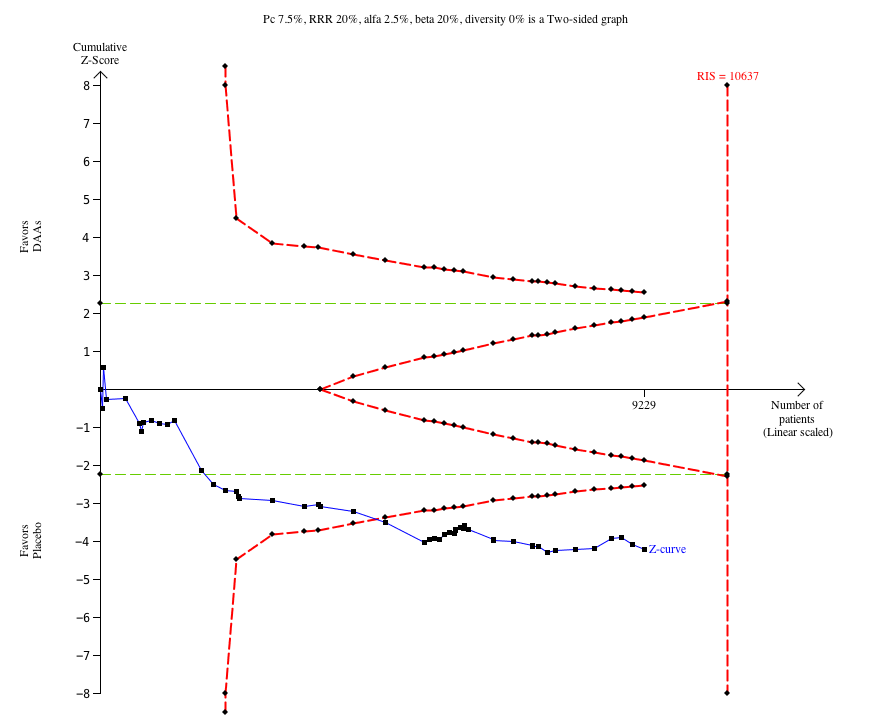
Trial Sequential Analysis of the effects of withdrawn direct‐acting antivirals versus placebo or no intervention on risk of serious adverse events. The analysis was based on a proportion in the control group (Pc) of 7.5%, a RRR of 20%, and alfa of 2.5%, a beta of 20%, and a diversity of 0%. After randomisation of about 5000 participants, the cumulative Z‐curve crosses the trial sequential monitoring boundary for harm.
No sustained virological response
Meta‐analysis of trials assessing the effects of withdrawn DAAs showed similar results to the meta‐analysis of trials assessing the effects of DAAs on the market or under development when assessing no sustained virological response (Analysis 7.1).
Without significant reductions in serum ALT or AST
Four trials reported results on participants without significant reductions in serum ALT or AST, but all of these trials assessed the effects of withdrawn DAAs (Analysis 12.1). Meta‐analysis showed that these withdrawn DAAs seemed to decrease the risk of no significant reduction of serum ALT or AST (RR 0.79, 95% CI 0.68 to 0.92, Analysis 12.1).
Non‐serious adverse events
A large number of non‐serious adverse events were reported in the included trials. Overall, 92.4% of the DAA participants experienced one or more non‐serious adverse event compared to 91.5% control participants. We have summarised these in Table 3. We plan to analyse each of these adverse events separately, in detail, in a later publication.
| Trial | Experimental intervention | Type and number of participants with a non‐serious adverse events (experimental group) | Proportion of participants with a non‐serious adverse event (experimental group) | Type and number of participants with a non‐serious adverse events (control group) | Proportion of participants with a non‐serious adverse event (control group) |
| Asunaprevir | 18 diarrhoea, 13 nausea, 10 asthenia, 21 fatigue, 14 influenza‐like illness, 7 irritability, 12 decreased appetite, 4 arthralgia, 9 myalgia, 13 headache, 9 depression, 10 insomnia, 7 cough, 10 dyspnoea, 7 alopecia, 11 dry skin, 10 pruritus, 6 rash | 36 out of 36 | 1 diarrhoea, 2 nausea, 4 asthenia, 5 fatigue, 5 influenza‐like illness, 4 irritability, 3 decreased appetite, 4 arthralgia, 1 myalgia, 6 headache, 1 depression, 1 insomnia, 3 cough, 3 dyspnoea, 3 alopecia, 1 dry skin, 2 pruritus, 3 rash | 11 out of 11 | |
| Asunaprevir | 8 anaemia, 63 asthenia, 62 fatigue, 37 influenza‐like illness, 43 decreased appetite, 66 headache, 41 pruritus | 173 out of 177 | 3 anaemia, 1 asthenia, 62 fatigue, 23 influenza‐like illness, 22 decreased appetite, 26 headache, 16 pruritus | 57 out of 61 | |
| Asunaprevir | 1 nausea, 3 headache, 1 flatulence | Not specified out of 20 | None reported | Not specified out of 4 | |
| Asunaprevir | 1 nausea, 3 headache | Not specified out of 12 | 1 nausea, 1 flatulence | Not specified out of 3 | |
| Balapiravir | 120 anaemia, 41 neutropenia, 115 diarrhoea, 162 nausea, 138 chills, 231 fatigue, 117 pyrexia, 100 arthralgia, 156 myalgia, 82 dizziness, 241 headache, 90 depression, 174 insomnia, 86 cough, 88 alopecia, 60 dry skin, 108 pruritus, 90 rash | Not specified out of 432 | 6 anaemia, 3 neutropenia, 16 diarrhoea, 25 nausea, 30 chills, 43 fatigue, 19 pyrexia, 16 arthralgia, 33 myalgia, 15 dizziness, 42 headache, 17 depression, 24 insomnia, 11 cough, 11 alopecia, 16 dry skin, 15 pruritus, 13 rash | Not specified out of 72 | |
| Beclabuvir | 5 anaemia, 5 neutropenia, 5 diarrhoea, 9 nausea, 3 chills, 12 fatigue, 6 influenza‐like illness, 7 irritability, 3 pyrexia, 7 decreased appetite, 4 arthralgia, 5 myalgia, 12 headache, 6 depression, 9 insomnia, 6 cough, 5 pruritus, 2 rash | Not specified out of 26 | 5 anaemia, 1 neutropenia, 1 diarrhoea, 2 nausea, 5 fatigue, 7 influenza‐like illness, 3 irritability, 1 pyrexia, 2 decreased appetite, 3 headache, 3 depression, 3 insomnia, 3 cough, 4 pruritus, 4 rash | Not specified out of 13 | |
| BILB‐1941 | 25 diarrhoea, 7 nausea, 2 vomiting | 30 out of 77 | 2 diarrhoea | 3 out of 19 | |
| BMS‐791325 | 1 diarrhoea, 1 nausea, 1 vomiting, 1 headache, 1 pruritus | 9 out of 20 | 1 nausea, 1 vomiting, 1 headache | 1 out of 4 | |
| Boceprevir | 145 anaemia, 46 neutropenia, 78 diarrhoea, 140 nausea, 47 vomiting, 68 asthenia, 106 chills, 179 fatigue, 79 influenza‐like illness, 67 irritability, 93 pyrexia, 83 decreased appetite, 73 arthralgia, 81 myalgia, 52 dizziness, 142 dysgeusia, 133 headache, 46 depression, 97 insomnia, 70 cough, 69 dyspnoea, 71 alopecia, 72 dry skin, 62 pruritus, 51 rash | 319 out of 323 | 16 anaemia, 8 neutropenia, 13 diarrhoea, 30 nausea, 6 vomiting, 13 asthenia, 24 chills, 40 fatigue, 20 influenza‐like illness, 10 irritability, 20 pyrexia, 13 decreased appetite, 13 arthralgia, 19 myalgia, 8 dizziness, 9 dysgeusia, 39 headache, 12 depression, 19 insomnia, 14 cough, 14 dyspnoea, 13 alopecia, 7 dry skin, 14 pruritus, 5 rash | 77 out of 80 | |
| Boceprevir | 67 anaemia, 41 neutropenia, 33 diarrhoea, 52 nausea, 16 vomiting, 29 asthenia, 14 chills, 67 fatigue, 35 influenza‐like illness, 29 irritability, 18 pyrexia, 27 decreased appetite, 16 arthralgia, 25 myalgia, 17 dizziness, 52 dysgeusia, 37 headache, 22 depression, 32 insomnia, 26 cough, 26 dyspnoea, 22 alopecia, 20 dry skin, 18 pruritus, 31 rash | 133 out of 134 | 22 anaemia, 12 neutropenia, 5 diarrhoea, 18 nausea, 12 asthenia, 8 chills, 36 fatigue, 18 influenza‐like illness, 16 irritability, 8 pyrexia, 12 decreased appetite, 12 arthralgia, 5 myalgia, 10 dizziness, 10 dysgeusia, 21 headache, 6 depression, 20 insomnia, 14 cough, 17 dyspnoea, 5 alopecia, 11 dry skin, 8 pruritus, 5 rash | 67 out of 67 | |
| Boceprevir | 105 anaemia, 103 leukopenia, 141 neutropenia, 16 thrombocytopenia, 22 diarrhoea, 13 dry mouth, 59 nausea, 12 vomiting, 63 asthenia, 24 chills, 40 fatigue, 51 hyperthermia, 356 influenza‐like illness, 9 injection site erythema, 18 irritability, 217 pyrexia, 14 body temperature increased, 33 weight decreased, 10 decreased appetite, 16 arthralgia, 33 myalgia, 9 dizziness, 69 dysgeusia, 89 headache, 2 sleep disorder, 38 cough, 7 dyspnoea, 33 alopecia, 12 dry skin, 20 pruritus, 17 rash | 153 out of 159 | 31 anaemia, 35 leukopenia, 45 neutropenia, 7 thrombocytopenia, 3 diarrhoea, 5 dry mouth, 15 nausea, 2 vomiting, 23 asthenia, 2 chills, 18 fatigue, 12 hyperthermia, 72 influenza‐like illness, 2 injection site erythema, 11 irritability, 124 pyrexia, 2 body temperature increased, 9 weight decreased, 7 decreased appetite, 4 arthralgia, 8 myalgia, 7 dizziness, 5 dysgeusia, 51 headache, 4 sleep disorder, 14 cough, 7 dyspnoea, 16 alopecia, 3 dry skin, 6 pruritus, 2 rash | 71 out of 78 | |
| Boceprevir | 226 anaemia, 96 neutropenia, 109 diarrhoea, 186 nausea, 81 vomiting, 53 asthenia, 130 chills, 259 fatigue, 79 influenza‐like illness, 91 irritability, 129 pyrexia, 49 decreased appetite, 76 arthralgia, 99 myalgia, 70 dizziness, 111 dysgeusia, 190 headache, 91 depression, 146 insomnia, 76 cough, 66 dyspnoea, 131 alopecia, 60 dry skin, 80 pruritus, 27 rash | 413 out of 416 | 35 anaemia, 12 neutropenia, 23 diarrhoea, 45 nausea, 5 vomiting, 14 asthenia, 35 chills, 57 fatigue, 25 influenza‐like illness, 23 irritability, 35 pyrexia, 12 decreased appetite, 21 arthralgia, 17 myalgia, 16 dizziness, 9 dysgeusia, 45 headache, 22 depression, 40 insomnia, 20 cough, 15 dyspnoea, 27 alopecia, 17 dry skin, 16 pruritus, 6 rash | 102 out of 104 | |
| Boceprevir | 361 anaemia, 184 neutropenia, 180 diarrhoea, 334 nausea, 145 vomiting, 125 asthenia, 255 chills, 405 fatigue, 174 influenza‐like illness, 164 irritability, 240 pyrexia, 186 decreased appetite, 141 arthralgia, 170 myalgia, 146 dizziness, 293 dysgeusia, 335 headache, 151 depression, 239 insomnia, 130 cough, 152 dyspnoea, 179 alopecia, 153 dry skin, 181 pruritus, 181 rash | 728 out of 734 | 107 anaemia, 77 neutropenia, 79 diarrhoea, 153 nausea, 57 vomiting, 70 asthenia, 102 chills, 217 fatigue, 93 influenza‐like illness, 86 irritability, 120 pyrexia, 90 decreased appetite, 66 arthralgia, 94 myalgia, 59 dizziness, 64 dysgeusia, 153 headache, 78 depression, 118 insomnia, 76 cough, 59 dyspnoea, 99 alopecia, 66 dry skin, 98 pruritus, 83 rash | 353 out of 363 | |
| Boceprevir | 26 anaemia, 12 neutropenia, 21 diarrhoea, 26 nausea, 18 vomiting, 22 asthenia, 5 chills, 25 fatigue, 16 influenza‐like illness, 10 irritability, 24 pyrexia, 22 decreased appetite, 7 arthralgia, 9 myalgia, 8 dizziness, 18 dysgeusia, 18 headache, 11 depression, 15 insomnia, 9 cough, 5 dyspnoea, 12 alopecia, 8 dry skin, 13 pruritus, 5 rash | 62 out of 64 | 8 anaemia, 2 neutropenia, 6 diarrhoea, 11 nausea, 5 vomiting, 9 asthenia, 5 chills, 12 fatigue, 13 influenza‐like illness, 5 irritability, 7 pyrexia, 6 decreased appetite, 2 arthralgia, 6 myalgia, 2 dizziness, 5 dysgeusia, 6 headache, 4 depression, 9 insomnia, 6 cough, 2 dyspnoea, 6 alopecia, 3 dry skin, 3 pruritus | 33 out of 34 | |
| Daclatasvir | 7 anaemia, 9 neutropenia, 10 diarrhoea, 22 nausea, 4 vomiting, 13 asthenia, 4 chills, 35 fatigue, 19 influenza‐like illness, 17 irritability, 7 pyrexia, 12 decreased appetite, 11 arthralgia, 14 myalgia, 6 dizziness, 5 dysgeusia, 30 headache, 11 depression, 19 insomnia, 8 cough, 12 dyspnoea, 12 alopecia, 13 dry skin, 27 pruritus, 25 rash | 98 out of 100 | 5 anaemia, 8 neutropenia, 3 diarrhoea, 8 nausea, 4 vomiting, 7 asthenia, 19 fatigue, 7 influenza‐like illness, 6 irritability, 2 pyrexia, 8 decreased appetite, 9 arthralgia, 11 myalgia, 6 dizziness, 3 dysgeusia, 9 headache, 9 depression, 17 insomnia, 8 cough, 6 dyspnoea, 5 alopecia, 6 dry skin, 14 pruritus, 12 rash | 48 out of 51 | |
| Daclatasvir | 53 anaemia, 43 neutropenia, 73 diarrhoea, 109 nausea, 34 vomiting, 32 asthenia, 49 chills, 174 fatigue, 94 influenza‐like illness, 72 irritability, 48 pyrexia, 67 decreased appetite, 55 arthralgia, 88 myalgia, 46 dizziness, 25 dysgeusia, 136 headache, 45 depression, 102 insomnia, 54 cough, 58 dyspnoea, 80 alopecia, 88 dry skin, 119 pruritus, 94 rash | 311 out of 317 | 9 anaemia, 9 neutropenia, 14 diarrhoea, 20 nausea, 11 vomiting, 7 asthenia, 16 chills, 46 fatigue, 16 influenza‐like illness, 22 irritability, 15 pyrexia, 17 decreased appetite, 19 arthralgia, 24 myalgia, 9 dizziness, 4 dysgeusia, 36 headache, 10 depression, 30 insomnia, 18 cough, 11 dyspnoea, 13 alopecia, 15 dry skin, 26 pruritus, 25 rash | 76 out of 78 | |
| Daclatasvir | 11 anaemia, 7 neutropenia, 2 diarrhoea, 4 nausea, 6 fatigue, 1 irritability, 11 pyrexia, 7 decreased appetite, 4 arthralgia, 1 myalgia, 1 dizziness, 4 dysgeusia, 3 headache, 7 insomnia, 4 cough, 2 dyspnoea, 8 alopecia, 1 dry skin, 6 pruritus, 7 rash | 34 out of 34 | 5 anaemia, 4 neutropenia, 3 diarrhoea, 2 nausea, 3 vomiting, 4 chills, 4 fatigue, 2 influenza‐like illness, 5 pyrexia, 5 decreased appetite, 2 arthralgia, 2 myalgia, 1 dizziness, 1 dysgeusia, 4 headache, 2 insomnia, 1 cough, 6 alopecia, 1 dry skin, 3 pruritus, 3 rash | 8 out of 8 | |
| Daclatasvir | 14 anaemia, 9 neutropenia, 5 diarrhoea, 13 nausea, 7 vomiting, 9 asthenia, 4 chills, 19 fatigue, 11 influenza‐like illness, 12 irritability, 7 pyrexia, 9 decreased appetite, 2 arthralgia, 8 myalgia, 5 dizziness, 2 dysgeusia, 19 headache, 7 depression, 9 insomnia, 9 cough, 6 dyspnoea, 8 alopecia, 2 dry skin, 12 pruritus, 10 rash | 36 out of 36 | 5 anaemia, 5 neutropenia, 3 diarrhoea, 6 nausea, 1 asthenia, 2 chills, 9 fatigue, 4 influenza‐like illness, 2 irritability, 3 pyrexia, 3 decreased appetite, 3 myalgia, 1 dizziness, 1 dysgeusia, 3 headache, 3 depression, 6 insomnia, 3 cough, 2 dyspnoea, 2 alopecia, 1 dry skin, 3 pruritus, 3 rash | 12 out of 12 | |
| Daclatasvir | 1 diarrhoea, 1 nausea, 4 headache | 7 out of 16 | None reported | 0 out of 2 | |
| Daclatasvir | 2 diarrhoea, 3 fatigue, 1 arthralgia, 1 dizziness, 5 headache, 2 insomnia, 1 dry skin | 16 out of 24 | 1 nausea, 1 vomiting, 2 headache | 4 out of 6 | |
| Danoprevir | 115 diarrhoea, 106 nausea, 77 asthenia, 89 chills, 158 fatigue, 125 pyrexia, 88 decreased appetite, 72 arthralgia, 93 myalgia,158 headache, 102 insomnia, 62 cough, 54 alopecia, 83 pruritus, 78 rash | 364 out of 373 | 5 diarrhoea, 13 nausea, 9 asthenia, 8 chills, 17 fatigue, 15 pyrexia, 6 decreased appetite, 9 arthralgia, 13 myalgia, 24 headache, 16 insomnia, 12 cough, 4 alopecia, 14 pruritus, 6 rash | 42 out of 44 | |
| Danoprevir | 2 diarrhoea, 3 myalgia, 5 headache | 21 out of 40 | 1 diarrhoea, 2 headache | 3 out of 10 | |
| Danoprevir | 6 neutropenia, 5 diarrhoea, 4 nausea, 3 asthenia, 5 chills, 8 fatigue, 4 influenza‐like illness, 2 pyrexia, 2 arthralgia, 17 myalgia, 6 dizziness, 23 headache, 2 depression, 6 insomnia, 3 pruritus | 42 out of 47 | 2 neutropenia, 2 diarrhoea, 1 nausea, 1 chills, 3 fatigue, 1 influenza‐like illness, 1 arthralgia, 5 myalgia, 1 dizziness, 4 headache, 1 depression, 2 insomnia | 12 out of 12 | |
| Danoprevir | 4 diarrhoea, 5 nausea, 5 fatigue, 3 influenza‐like illness, 5 irritability, 5 arthralgia, 5 myalgia, 11 headache, 4 insomnia, 6 rash | 24 out of 25 | 1 diarrhoea, 3 nausea, 1 fatigue, 2 myalgia, 4 headache, 2 insomnia | 5 out of 5 | |
| Danoprevir | 53 anaemia, 70 neutropenia, 56 diarrhoea, 85 nausea, 29 vomiting, 57 chills, 109 fatigue, 38 irritability, 51 pyrexia, 34 decreased appetite, 29 arthralgia, 60 myalgia, 92 headache, 42 depression, 69 insomnia, 31 alopecia, 46 pruritus, 42 rash | Not specified out of 194 | 13 anaemia, 11 neutropenia, 7 diarrhoea, 10 nausea, 4 vomiting, 13 chills, 14 fatigue, 7 irritability, 5 pyrexia, 4 decreased appetite, 9 arthralgia, 11 myalgia, 18 headache, 4 depression, 9 insomnia, 5 alopecia, 6 pruritus, 8 rash | Not specified out of 31 | |
| Deleobuvir | 1 anaemia, 19 diarrhoea, 19 nausea, 11 vomiting, 16 asthenia, 3 chills, 12 fatigue, 14 influenza‐like illness, 7 irritability, 6 pyrexia, 14 decreased appetite, 4 arthralgia, 4 myalgia, 6 dizziness, 4 dysgeusia, 20 headache, 15 insomnia, 6 cough, 3 dyspnoea, 1 alopecia, 6 dry skin, 5 pruritus, 8 rash | 49 out of 49 | 1 nausea, 1 asthenia, 1 chills, 2 fatigue, 1 influenza‐like illness, 2 irritability, 1 decreased appetite, 2 headache, 1 dry skin, 1 pruritus, 2 rash | 7 out of 8 | |
| Faldaprevir | 114 anaemia, 59 neutropenia, 160 diarrhoea, 249 nausea, 110 vomiting, 29 asthenia, 78 chills, 246 fatigue, 39 influenza‐like illness, 67 irritability, 79 pyrexia, 117 decreased appetite, 72 arthralgia, 100 myalgia, 80 dizziness, 31 dysgeusia, 165 headache, 68 depression, 137 insomnia, 89 cough, 53 dyspnoea, 96 alopecia, 67 dry skin, 164 pruritus, 298 rash | 513 out of 525 | 27 anaemia, 14 neutropenia, 23 diarrhoea, 52 nausea, 11 vomiting, 6 asthenia, 25 chills, 70 fatigue, 15 influenza‐like illness, 27 irritability, 20 pyrexia, 26 decreased appetite, 22 arthralgia, 37 myalgia, 25 dizziness, 3 dysgeusia, 45 headache, 11 depression, 38 insomnia, 21 cough, 20 dyspnoea, 22 alopecia, 15 dry skin, 37 pruritus, 41 rash | 130 out of 132 | |
| Faldaprevir | 89 anaemia, 57 neutropenia, 121 diarrhoea, 168 nausea, 79 vomiting, 96 asthenia, 143 fatigue, 92 influenza‐like illness, 37 irritability, 110 pyrexia, 87 decreased appetite, 39 arthralgia, 41 myalgia, 38 dizziness, 23 dysgeusia, 146 headache, 32 depression, 70 insomnia, 58 cough, 36 dyspnoea, 49 alopecia, 80 dry skin, 160 pruritus, 139 rash | 496 out of 520 | 26 anaemia, 18 neutropenia, 17 diarrhoea, 19 nausea, 6 vomiting, 27 asthenia, 35 fatigue, 21 influenza‐like illness, 9 irritability, 32 pyrexia, 22 decreased appetite, 14 arthralgia, 20 myalgia, 13 dizziness, 5 dysgeusia, 40 headache, 8 depression, 22 insomnia, 20 cough, 16 dyspnoea, 15 alopecia, 17 dry skin, 41 pruritus, 25 rash | 120 out of 132 | |
| Faldaprevir | 98 anaemia, 65 neutropenia, 190 diarrhoea, 318 nausea, 171 vomiting, 108 asthenia, 32 chills, 204 fatigue, 107 influenza‐like illness, 49 irritability, 113 pyrexia, 128 decreased appetite, 60 arthralgia, 72 myalgia, 37 dizziness, 39 dysgeusia, 182 headache, 52 depression, 118 insomnia, 99 cough, 47 dyspnoea, 53 alopecia, 108 dry skin, 225 pruritus, 160 rash | 585 out of 599 | 8 anaemia, 12 neutropenia, 10 diarrhoea, 18 nausea, 5 vomiting, 21 asthenia, 5 chills, 16 fatigue, 15 influenza‐like illness, 11 irritability, 14 pyrexia, 10 decreased appetite, 7 arthralgia, 8 myalgia, 6 dizziness, 4 dysgeusia, 22 headache, 10 depression, 13 insomnia, 16 cough, 7 dyspnoea, 4 alopecia, 12 dry skin, 23 pruritus, 16 rash | 74 out of 78 | |
| Faldaprevir | 2 anaemia, 1 neutropenia, 4 diarrhoea, 7 nausea, 10 asthenia, 2 chills, 2 fatigue, 4 influenza‐like illness, 4 irritability, 2 pyrexia, 1 decreased appetite, 7 myalgia, 1 dizziness, 6 headache, 2 depression, 5 insomnia, 2 cough, 1 alopecia, 5 dry skin, 3 pruritis, 1 rash | 32 out of 26 | 1 diarrhoea, 2 nausea, 2 asthenia, 2 headache, 1 depression, 1 insomnia, 1 cough | 5 out of 8 | |
| Faldaprevir | 1 neutropenia, 3 diarrhoea, 3 nausea, 3 vomiting, 2 influenza‐like illness, 8 pyrexia, 2 decreased appetite, 2 arthralgia, 4 dizziness, 1 dysgeusia, 7 headache, 1 depression, 5 insomnia, 1 cough, 3 alopecia, 1 dry skin, 6 pruritus, 6 rash | 33 out of 35 | 2 nausea, 2 vomiting, 1 influenza‐like illness, 1 pyrexia, 1 decreased appetite, 1 headache, 1 insomnia, 1 dyspnoea, 2 dry skin, 3 pruritus, 1 rash | 6 out of 8 | |
| Faldeprevir | 85 anaemia, 49 neutropenia, 188 diarrhoea, 239 nausea, 105 vomiting, 122 asthenia, 54 chills, 194 fatigue, 217 influenza‐like illness, 82 irritability, 86 pyrexia, 133 decreased appetite, 72 arthralgia, 133 myalgia, 48 dizziness, 25 dysgeusia, 243 headache, 68 depression, 107 insomnia, 100 cough, 73 dyspnoea, 106 alopecia, 122 dry skin, 227 pruritus, 163 rash | 620 out of 641 | 12 anaemia, 8 neutropenia, 13 diarrhoea, 14 nausea, 4 vomiting, 15 asthenia, 8 chills, 24 fatigue, 34 influenza‐like illness, 10 irritability, 11 pyrexia, 11 decreased appetite, 5 arthralgia, 12 myalgia, 5 dizziness, 27 headache, 7 depression, 17 insomnia, 9 cough, 11 dyspnoea, 8 alopecia, 10 dry skin, 12 pruritus, 12 rash | 65 out of 71 | |
| Filibuvir | 13 anaemia,4 neutropenia ,6 diarrhoea, 13 nausea, 3 vomiting, 4 chills, 13 fatigue, 3 influenza‐like illness, 2 irritability, 2 pyrexia, 3 decreased appetite, 2 arthralgia, 4 myalgia, 4 dizziness, 14 headache, 5 depression, 11 insomnia, 5 cough, 2 dyspnoea, 2 alopecia, 3 dry skin, 2 pruritus, 3 rash | 27 out of 27 | 3 anaemia, 3 diarrhoea, 4 nausea, 1 vomiting, 1 chills, 5 fatigue, 2 influenza‐like illness, 2 decreased appetite, 2 arthralgia, 2 headache, 3 depression, 2 insomnia, 2 cough, 2 dyspnoea, 1 alopecia, 2 dry skin, 3 pruritus, 1 rash | 8 out of 8 | |
| Filibuvir | 26 anaemia, 26 neutropenia, 24 diarrhoea, 55 nausea, 20 vomiting, 35 asthenia, 25 chills, 73 fatigue, 29 influenza‐like illness, 33 irritability, 28 pyrexia, 36 decreased appetite, 30 arthralgia, 37 myalgia, 20 dizziness, 40 dysgeusia, 61 headache, 32 depression, 55 insomnia, 33 cough, 18 dyspnoea, 34 alopecia, 33 dry skin, 56 pruritus, 34 rash | 174 out of 192 | anaemia, neutropenia, diarrhoea, nausea, vomiting, asthenia, chills, fatigue, influenza‐like illness, irritability, pyrexia, decreased appetite, arthralgia, myalgia, dizziness, dysgeusia, headache, depression, insomnia, cough, dyspnoea, alopecia, dry skin, pruritus, rash. The authors did not report number of adverse events in the control group | 90 out of 96 | |
| Grazoprevir | 9 diarrhoea, 2 nausea, 1 vomiting, 7 fatigue, 1 dysgeusia, 16 headache, 1 insomnia, 2 pruritis | 34 out of 76 | 1 headache | 2 out of 15 | |
| GSK2336805 | 3 anaemia, 3 neutropenia, 4 nausea, 2 vomiting, 2 chills, 5 fatigue, 2 cough | 11 out of 11 | 1 fatigue | 4 out of 4 | |
| IDX‐184 | 1 diarrhoea, 2 fatigue, 1 dizziness, 4 headache | 8 out of 33 | 1 diarrhoea, 1 fatigue, 1 dizziness, 1 headache | 4 out of 8 | |
| IDX‐184 | 6 neutropenia, 7 diarrhoea, 22 nausea, 5 vomiting, 15 chills, 36 fatigue, 10 irritability, 9 pyrexia, 5 decreased appetite, 19 myalgia, 27 headache, 4 depression, 10 insomnia, 6 pruritus | 59 out of 65 | 4 neutropenia, 2 diarrhoea, 3 nausea, 5 chills, 9 fatigue, 4 irritability, 3 decreased appetite, 5 myalgia, 7 headache, 3 depression, 5 insomnia, 2 pruritus | 12 out of 16 | |
| IDX320 | 1 diarrhoea, 1 myalgia, 4 headache | Not specified out of 30 | None reported | 0 out of 8 | |
| Ledispasvir | 2 nausea, 6 headache, 2 rash | 18 out of 59 | 1 nausea | 4 out of 11 | |
| Mericitabine/danoprevir | 7 diarrhoea, 9 nausea, 36 headache, 9 rash | Not specified out of 73 | 1 diarrhoea, 2 nausea, 8 headache, 1 rash | Not specified out of 14 | |
| Mericitabine | 25 diarrhoea, 16 nausea, 6 chills, 47 fatigue, 14 irritability, 16 pyrexia, 12 arthralgia, 19 myalgia, 43 headache, 27 insomnia, 21 cough, 15 pruritus | Not specified out of 102 | 12 diarrhoea, 14 nausea, 12 chills, 25 fatigue, 10 irritability, 14 pyrexia, 11 arthralgia, 18 myalgia, 28 headache, 11 insomnia, 11 cough, 11 pruritus | Not specified out of 49 | |
| Mericitabine | 18 diarrhoea, 33 nausea, 31 chills, 58 fatigue, 21 irritability, 20 pyrexia, 25 decreased appetite, 18 arthralgia, 24 myalgia, 19 dizziness, 42 headache, 31 insomnia, 17 cough, 14 alopecia, 15 pruritus, 17 rash | Not specified out of 81 | 20 diarrhoea, 34 nausea, 33 chills, 58 fatigue, 25 irritability, 27 pyrexia, 22 decreased appetite, 21 arthralgia, 24 myalgia, 20 dizziness, 38 headache, 28 insomnia, 22 cough, 17 alopecia, 28 pruritus, 28 rash | Not specified out of 85 | |
| Narlaprevir | 10 diarrhoea, 8 nausea, 30 influenza‐like illness, 6 dizziness, 11 headache | 32 out of 32 | 1 nausea, 6 influenza‐like illness, 1 dizziness | 7 out of 8 | |
| Narlaprevir | 87 anaemia, 84 diarrhoea, 131 nausea, 54 vomiting, 44 chills, 123 fatigue, 106 influenza‐like illness, 58 irritability, 58 pyrexia, 61 decreased appetite, 60 arthralgia, 39 myalgia, 58 dizziness, 83 headache, 33 depression, 80 insomnia, 28 pruritus, 31 rash | Not specified out of 93 | 6 anaemia, 17 diarrhoea, 50 nausea, 28 vomiting, 17 chills, 56 fatigue, 44 influenza‐like illness, 28 irritability, 17 pyrexia, 44 decreased appetite, 28 arthralgia, 6 dizziness, 39 headache, 22 depression, 39 insomnia, 33 pruritus, 11 rash | Not specified out of 18 | |
| Odalasvir/sovaprevir | 5 anaemia, 2 diarrhoea, 5 fatigue, 2 influenza‐like illness, 2 irritability, 1 decreased appetite, 2 arthralgia, 3 myalgia, 1 dizziness, 1 dysgeusia, 6 headache, 2 insomnia, 4 cough, 1 dyspnoea, 1 pruritus, 1 rash | 20 out of 20 | 2 diarrhoea, 4 fatigue, 1 myalgia, 1 dizziness, 1 headache, 1 cough, pruritus | 10 out of 10 | |
| Ombitasvir | 6 anaemia, 5 neutropenia, 4 diarrhoea, 9 nausea, 7 vomiting, 6 chills, 18 fatigue, 1 influenza‐like illness, 1 irritability, 3 pyrexia, 5 decreased appetite, 2 arthralgia, 2 myalgia, 2 dizziness, 9 headache, 4 depression, 4 insomnia, 3 cough, 2 dyspnoea, 5 dry skin, 3 pruritus, 6 rash | 26 out of 28 | 1 neutropenia, 1 diarrhoea, 3 nausea, 2 vomiting, 6 fatigue, 2 influenza‐like illness, 1 irritability, 1 decreased appetite, 1 myalgia, 2 headache, 1 depression, 2 insomnia, 1 cough, dyspnoea, 1 dry skin, 2 rash | 9 out of 9 | |
| Paritaprevir/ABT‐072/dasabuvir | 12 anaemia, 14 neutropenia, 16 diarrhoea, 15 nausea, 6 vomiting, 4 asthenia, 11 chills, 29 fatigue, 14 influenza‐like illness, 8 irritability, 12 pyrexia, 4 decreased appetite, 9 arthralgia, 14 myalgia, 9 dizziness, 6 dysgeusia, 38 headache, 15 depression, 14 insomnia, 6 cough, 6 dyspnoea, 5 alopecia, 2 dry skin, 8 pruritus, 12 rash | 63 out of 63 | 1 anaemia, 2 neutropenia, 4 diarrhoea, 4 nausea, 1 vomiting, 1 asthenia, 6 fatigue, 1 influenza‐like illness, 1 irritability, 1 pyrexia, 2 decreased appetite, 1 arthralgia, 3 myalgia, 4 dizziness, 2 dysgeusia, 4 headache, 2 insomnia, 2 dyspnoea, 1 alopecia, 2 pruritus, 2 rash | 10 out of 11 | |
| Paritaprevir/ombitasvir | 24 anaemia, 65 diarrhoea, 112 nausea, 23 vomiting, 59 asthenia, 164 fatigue, 26 irritability, 37 decreased appetite, 23 arthralgia, 21 myalgia, 38 dizziness, 156 headache, 67 insomnia, 34 cough, 38 dyspnoea, 27 dry skin, 80 pruritus, 51 rash | 391 out of 473 | 11 diarrhoea, 22 nausea, 6 vomiting, 6 asthenia, 45 fatigue, 4 irritability, 5 decreased appetite, 9 arthralgia, 8 myalgia, 6 dizziness, 42 headache, 12 insomnia, 8 cough, 4 dyspnoea, 2 dry skin, 7 pruritus, 9 rash | 108 out of 158 | |
| Paritaprevir/ombitasvir | 19 anaemia, 47 diarrhoea, 72 nausea, 22 vomiting, 60 asthenia, 115 fatigue, 22 irritability, 24 decreased appetite, 21 arthralgia, 28 myalgia, 30 dizziness, 13 dysgeusia, 126 headache, 52 insomnia, 43 cough, 50 dyspnoea, 27 dry skin, 53 pruritus, 34 rash | 328 out of 394 | 12 diarrhoea, 17 nausea, 11 asthenia, 22 fatigue, 8 irritability, 2 decreased appetite, 7 arthralgia, 10 myalgia, 5 dizziness, 5 dysgeusia, 34 headache, 7 insomnia, 5 cough, 10 dyspnoea, 3 dry skin, 5 pruritus, 6 rash | 74 out of 97 | |
| PHX1766 | 1 nausea, 2 fatigue, 1 dizziness | Not specified | None reported | Not specified | |
| R1626 | 43 neutropenia, 42 diarrhoea, 49 nausea, 26 vomiting, 39 chills, 45 fatigue, 20 irritability, 29 pyrexia, 21 arthralgia, 23 myalgia, 15 dizziness, 47 headache, 27 insomnia, 15 cough, 11 pruritus, 20 rash | Not specified out of 84 | 5 diarrhoea, 10 nausea, 2 vomiting, 9 chills, 10 fatigue, 1 irritability, 8 pyrexia, 5 arthralgia, 11 myalgia, 3 dizziness, 11 headache, 6 insomnia, 4 cough, 6 pruritus, 2 rash | Not specified out of 20 | |
| Samatasvir | 4 nausea, 1 decreased appetite, 6 headache, 1 insomnia | 20 out of 48 | 1 nausea, 1 decreased appetite, 1 headache, 1 insomnia | 6 out of 12 | |
| Simeprevir | 40 anaemia, 37 neutropenia, 36 diarrhoea, 59 nausea, 18 vomiting, 57 asthenia, 17 chills, 87 fatigue, 78 influenza‐like illness, 63 pyrexia, 35 decreased appetite, 26 arthralgia, 39 myalgia, 14 dizziness, 12 dysgeusia, 87 headache, 22 depression, 49 insomnia, 34 cough, 26 dyspnoea, 26 alopecia, 24 dry skin, 16 pruritus, 33 rash | 245 out of 260 | 24 anaemia, 26 neutropenia, 22 diarrhoea, 26 nausea, 9 vomiting, 25 asthenia, 11 chills, 58 fatigue, 27 influenza‐like illness, 30 pyrexia, 24 decreased appetite, 12 arthralgia, 17 myalgia, 6 dizziness, 7 dysgeusia, 48 headache, 10 depression, 33 insomnia, 21 cough, 5 dyspnoea, 17 alopecia, 18 dry skin, 37 pruritus, 19 rash | 123 out of 133 | |
| Simeprevir | 63 anaemia, 75 neutropenia, 47 diarrhoea, 86 nausea, 22 vomiting, 63 asthenia, 25 chills, 107 fatigue, 98 influenza‐like illness, 11 irritability, 64 pyrexia, 17 decreased appetite, 53 arthralgia, 55 myalgia, 29 dizziness, 16 dysgeusia, 142 headache, 32 depression, 69 insomnia, 52 cough, 33 dyspnoea, 53 alopecia, 63 dry skin, 173 pruritus, 65 rash | 302 out of 309 | 16 anaemia, 16 neutropenia, 12 diarrhoea, 21 nausea, 5 vomiting, 16 asthenia, 8 chills, 37 fatigue, 29 influenza‐like illness, 8 irritability, 13 pyrexia, 6 decreased appetite, 11 arthralgia, 17 myalgia, 6 dizziness, 5 dysgeusia, 40 headache, 14 depression, 23 insomnia, 15 cough, 6 dyspnoea, 16 alopecia, 14 dry skin, 35 pruritus, 18 rash | 75 out of 77 | |
| Simeprevir | 24 anaemia, 13 diarrhoea,13 nausea, 6 vomiting, 4 chills, 2 fatigue, 42 pyrexia, 15 decreased appetite, 27 arthralgia, 15 myalgia, 3 dizziness, 6 dysgeusia, 41 headache, 2 depression, 23 insomnia, 8 cough, 25 alopecia, 5 dry skin, 15 pruritus, 47 rash | 79 out of 79 | 5 anaemia, 5 diarrhoea, 2 vomiting, 7 pyrexia, 3 decreased appetite, 2 arthralgia, 2 myalgia, 8 headache, 2 insomnia, 2 cough, 6 alopecia, 6 rash | 13 out of 13 | |
| Simeprevir | 70 anaemia, 8 neutropenia, 20 diarrhoea, 16 nausea, 6 vomiting, 13 fatigue, 75 pyrexia, 28 decreased appetite, 30 arthralgia, 9 myalgia, 4 dizziness, 20 dysgeusia, 54 headache, 27 insomnia, 11 cough, 44 alopecia, 8 dry skin, 35 pruritus, 57 rash | 123 out of 123 | 36 anaemia, 1 neutropenia, 20 diarrhoea, 16 nausea, 6 vomiting, 7 fatigue, 31 pyrexia, 20 decreased appetite, 14 arthralgia, 11 myalgia, 4 dizziness, 8 dysgeusia, 26 headache, 3 depression, 25 insomnia, 8 cough, 28 alopecia, 9 dry skin, 18 pruritus, 37 rash | 60 out of 60 | |
| Simeprevir | 82 anaemia, 59 neutropenia, 14 diarrhoea, 16 nausea, 15 asthenia, 63 fatigue, 39 influenza‐like illness, 67 pyrexia, 28 decreased appetite, 13 arthralgia, 36 myalgia, 39 headache, 17 insomnia, 16 cough, 47 alopecia, 40 pruritus, 57 rash | 298 out of 305 | 53 anaemia, 32 neutropenia, 7 diarrhoea, 10 nausea, 7 asthenia, 36 fatigue, 19 influenza‐like illness, 46 pyrexia, 16 decreased appetite, 4 arthralgia, 22 myalgia, 28 headache, 18 insomnia, 17 cough, 26 alopecia, 17 pruritus, 27 rash | 149 out of 152 | |
| Simeprevir | 44 anaemia, 54 neutropenia, 35 diarrhoea, 65 nausea, 23 vomiting, 25 asthenia, 33 chills, 111 fatigue, 62 influenza‐like illness, 51 pyrexia, 47 decreased appetite, 34 arthralgia, 39 myalgia, 23 dizziness, 16 dysgeusia, 88 headache, 23 depression, 56 insomnia, 25 cough, 23 dyspnoea, 30 alopecia, 33 dry skin, 68 pruritus, 60 rash | 252 out of 264 | 24 anaemia, 15 neutropenia, 19 diarrhoea, 32 nausea, 9 vomiting, 21 asthenia, 18 chills, 53 fatigue, 26 influenza‐like illness, 28 pyrexia, 19 decreased appetite, 21 arthralgia, 18 myalgia, 9 dizziness, 4 dysgeusia, 51 headache, 16 depression, 31 insomnia, 20 cough, 9 dyspnoea, 16 alopecia, 11 dry skin, 20 pruritus, 30 rash | 124 out of 130 | |
| Simeprevir | 16 anaemia, 26 neutropenia, 20 diarrhoea, 31 nausea, 9 vomiting, 26 asthenia, 6 chills, 35 fatigue, 24 influenza‐like illness, 10 irritability, 21 pyrexia, 7 decreased appetite, 20 arthralgia, 14 myalgia, 4 dizziness, 5 dysgeusia, 42 headache, 14 depression, 12 insomnia, 19 cough, 18 dyspnoea, 16 alopecia, 19 dry skin, 18 pruritus, 9 rash | 82 out of 83 | 4 anaemia, 4 neutropenia, 3 diarrhoea, 4 nausea, 3 vomiting, 7 asthenia, 5 chills, 13 fatigue, 5 influenza‐like illness, 4 irritability, 4 pyrexia, 2 decreased appetite, 3 arthralgia, 8 myalgia, 3 dizziness, 3 dysgeusia, 16 headache, 2 depression, 7 insomnia, 10 cough, 4 dyspnoea, 3 alopecia, 5 dry skin, 7 pruritus, 5 rash | 28 out of 28 | |
| Simeprevir | 46 anaemia, 49 neutropenia, 34 diarrhoea, 63 nausea, 17 vomiting, 59 asthenia, 21 chills, 95 fatigue, 66 influenza‐like illness, 80 pyrexia, 46 decreased appetite, 32 arthralgia, 58 myalgia, 21 dizziness, 101 headache, 29 depression, 51 insomnia, 32 cough, 23 dyspnoea, 43 alopecia, 28 dry skin, 65 pruritus, 46 rash | 243 out of 257 | 33 anaemia, 29 neutropenia, 12 diarrhoea, 24 nausea, 7 vomiting, 38 asthenia, 12 chills, 56 fatigue, 35 influenza‐like illness, 53 pyrexia, 21 decreased appetite, 14 arthralgia, 28 myalgia, 9 dizziness, 49 headache, 19 depression, 21 insomnia, 22 cough, 11 dyspnoea, 27 alopecia, 18 dry skin, 34 pruritus, 15 rash | 131 out of 134 | |
| Simeprevir | 1 anaemia, 1 diarrhoea, 6 nausea, 8 fatigue, 1 irritability, 2 myalgia, 7 headache, 3 insomnia, 6 pruritus, 10 rash | 46 out of 58 | 9 anaemia, 5 neutropenia, 2 diarrhoea, 7 nausea, 4 asthenia, 17 fatigue, 6 influenza‐like illness, 3 irritability, 4 myalgia, 8 headache, 6 insomnia, 4 pruritus, 3 rash | 22 out of 24 | |
| Simeprevir | 76 anaemia, 101 neutropenia, 59 diarrhoea, 95 nausea, 21 vomiting, 84 asthenia, 34 chills, 174 fatigue, 116 influenza‐like illness, 53 irritability, 69 pyrexia, 69 decreased appetite, 50 arthralgia, 64 myalgia, 29 dizziness, 22 dysgeusia, 138 headache, 45 depression, 79 insomnia, 76 cough, 49 dyspnoea, 31 alopecia, 72 dry skin, 135 pruritus, 61 rash | 380 out of 396 | 13 anaemia, 11 neutropenia, 13 diarrhoea, 14 nausea, 5 vomiting, 7 asthenia, 6 chills, 174 fatigue, 13 influenza‐like illness, 7 irritability, 9 pyrexia, 9 decreased appetite, 9 arthralgia, 12 myalgia, 6 dizziness, 3 dysgeusia, 24 headache, 6 depression, 9 insomnia, 8 cough, 4 dyspnoea, 5 alopecia, 10 dry skin, 11 pruritus, 9 rash | 63 out of 66 | |
| Sofosbuvir | 19 diarrhoea, 46 nausea, 12 vomiting, 91 fatigue, 19 irritability, 7 decreased appetite, 16 arthralgia, 19 dizziness, 43 headache, 15 depression, 39 insomnia, 11 cough, 19 dyspnoea, 23 pruritus, 18 rash | 184 out of 207 | 4 diarrhoea, 13 nausea, 5 vomiting, 17 fatigue, 1 irritability, 7 decreased appetite, 1 arthralgia, 5 dizziness, 14 headache, 1 depression, 3 insomnia, 2 cough, 1 dyspnoea, 6 pruritus, 6 rash | 55 out of 71 | |
| Sofosbuvir | 19 anaemia, 23 neutropenia, 18 diarrhoea, 38 nausea, 12 vomiting, 2 asthenia, 37 chills, 64 fatigue, 15 irritability, 22 pyrexia, 11 decreased appetite, 10 arthralgia, 17 myalgia, 11 dizziness, 9 dysgeusia, 37 headache, 12 depression, 24 insomnia, 14 cough, 11 dyspnoea, 10 alopecia, 12 dry skin, 13 pruritus, 29 rash | 117 out of 120 | 7 anaemia, 5 neutropenia, 2 diarrhoea, 9 nausea, 2 vomiting, 1 asthenia, 10 chills, 16 fatigue, 5 irritability, 2 pyrexia, 4 decreased appetite, 5 arthralgia, 6 myalgia, 3 dizziness, 15 headache, 3 depression, 9 insomnia, 3 cough, 4 dyspnoea, 2 alopecia, 3 dry skin, 3 pruritus, 4 rash | 26 out of 26 | |
| Sofosbuvir | 20 anaemia, 23 diarrhoea, 46 nausea, 17 vomiting, 7 chills, 92 fatigue, 7 influenza‐like illness, 25 irritability, 6 pyrexia, 17 decreased appetite, 15 arthralgia, 21 myalgia, 27 dizziness, 64 headache, 14 depression, 31 insomnia, 19 cough, 18 dyspnoea, 12 alopecia, 11 dry skin, 19 pruritus, 23 rash | 219 out of 256 | 28 anaemia, 30 neutropenia, 45 diarrhoea, 70 nausea, 23 vomiting, 44 chills, 134 fatigue, 44 influenza‐like illness, 40 irritability, 33 pyrexia, 44 decreased appetite, 35 arthralgia, 40 myalgia, 33 dizziness, 108 headache, 34 depression, 71 insomnia, 21 cough, 20 dyspnoea, 24 alopecia, 23 dry skin, 42 pruritus, 43 rash | 233 out of 243 | |
| Sofosbuvir | 7 anaemia, 17 nausea, 3 vomiting, 22 fatigue, 4 pyrexia, 7 decreased appetite, 12 arthralgia, 7 myalgia, 6 dizziness, 15 headache, 4 depression, 7 insomnia, 9 pruritus | 45 out of 49 | 1 anaemia, 5 nausea, 2 chills, 6 fatigue, 1 pyrexia, 1 decreased appetite, 1 myalgia, 2 dizziness, 2 headache, 2 insomnia,1 pruritus | 13 out of 14 | |
| Sofosbuvir/velpatasvir | 48 diarrhoea, 75 nausea, 41 asthenia, 126 fatigue, 40 arthralgia, 25 myalgia, 182 headache, 50 insomnia, 39 cough | 485 out of 624 | 8 diarrhoea, 13 nausea, 9 asthenia, 23 fatigue, 9 arthralgia, 6 myalgia, 33 headache, 11 insomnia, 4 cough | 89 out of 116 | |
| Telaprevir | 1 diarrhoea, 4 nausea, 1 vomiting, 6 asthenia, 4 fatigue, 10 influenza‐like illness, 3 headache, 2 insomnia, 1 dyspnoea, 1 dry skin, 3 pruritus | 16 out of 16 | 1 anaemia, 1 neutropenia, 3 asthenia, 4 influenza‐like illness, 1 decreased appetite, 1 headache, 1 insomnia, 1 cough, 1 dry skin, 2 pruritus, 2 rash | 8 out of 8 | |
| Telaprevir | 2 diarrhoea, 3 nausea, 1 chills, 5 myalgia, 2 dizziness, 5 headache, 3 dry skin, 3 rash | 14 out of 16 | 1 diarrhoea, 1 nausea, 1 asthenia, 2 chills, 2 myalgia, 1 dizziness, 2 headache, 1 dry skin | 4 out of 4 | |
| Telaprevir | 1 anaemia, 4 diarrhoea, 8 nausea, 5 vomiting, 9 asthenia, 1 chills, 5 fatigue, 11 influenza‐like illness, 1 irritability, 2 pyrexia, 1 arthralgia, 4 myalgia, 3 dizziness, 5 headache, 1 depression, 2 insomnia, 1 cough, 2 dyspnoea, 1 alopecia, 3 dry skin, 11 pruritus, 5 rash | 26 out of 31 | 1 neutropenia, 1 diarrhoea, 1 nausea, 5 asthenia, 3 chills, 2 fatigue, 7 influenza‐like illness, 5 pyrexia, 3 myalgia, 1 dysgeusia, 6 headache, 1 depression, 2 insomnia, 2 cough, 2 dyspnoea, 1 dry skin, 2 pruritus | 16 out of 18 | |
| Telaprevir | 44 anaemia, 11 neutropenia, 66 diarrhoea, 102 nausea, 22 vomiting, 110 asthenia, 12 chills, 70 fatigue, 92 influenza‐like illness, 22 irritability, 44 pyrexia, 30 decreased appetite, 36 arthralgia, 35 myalgia, 12 dizziness, 20 dysgeusia, 105 headache, 51 depression, 62 insomnia, 37 cough, 50 dyspnoea, 29 alopecia, 64 dry skin, 139 pruritus, 71 rash | 240 out of 241 | 14 anaemia, 14 neutropenia, 23 diarrhoea, 33 nausea, 12 vomiting, 26 asthenia, 10 chills, 30 fatigue, 43 influenza‐like illness, 11 irritability, 19 pyrexia, 16 decreased appetite, 14 arthralgia, 17 myalgia, 8 dizziness, 3 dysgeusia, 37 headache, 19 depression, 32 insomnia, 21 cough, 13 dyspnoea, 17 alopecia, 29 dry skin, 29 pruritus, 22 rash | 81 out of 82 | |
| Telaprevir | 276 anaemia, 217 diarrhoea, 302 nausea, 418 fatigue, 203 pyrexia, 304 headache, 233 insomnia, 346 pruritus, 262 rash | 723 out of 727 | 70 anaemia, 80 diarrhoea, 112 nausea, 206 fatigue, 87 pyrexia, 142 headache, 111 insomnia, 131 pruritus, 88 rash | 354 out of 361 | |
| Telaprevir | 58 anaemia, 30 neutropenia, 64 diarrhoea, 93 nausea, 38 vomiting, 29 chills, 127 fatigue, 75 influenza‐like illness, 23 irritability, 33 pyrexia, 22 decreased appetite, 34 arthralgia, 27 myalgia, 41 dizziness, 16 dysgeusia, 80 headache, 34 depression, 68 insomnia, 36 cough, 25 dyspnoea, 21 alopecia, 28 dry skin, 74 pruritus, 62 rash | 175 out of 175 | 20 anaemia, 18 neutropenia, 21 diarrhoea, 22 nausea, 9 vomiting, 14 chills, 57 fatigue, 32 influenza‐like illness, 22 irritability, 22 pyrexia, 9 decreased appetite, 16 arthralgia, 18 myalgia, 14 dizziness, 8 dysgeusia, 45 headache, 13 depression, 29 insomnia, 14 cough, 11 dyspnoea, 8 alopecia, 19 dry skin, 17 pruritus, 20 rash | 75 out of 75 | |
| Telaprevir | 69 anaemia, 31 neutropenia, 115 diarrhoea, 122 nausea, 37 vomiting, 57 chills, 197 fatigue, 93 influenza‐like illness, 63 irritability, 59 pyrexia, 20 decreased appetite, 51 arthralgia, 60 myalgia, 47 dizziness, 130 headache, 43 depression, 83 insomnia, 46 cough, 27 dyspnoea, 54 alopecia, 32 dry skin, 129 pruritus, 126 rash | 329 out of 339 | 9 anaemia, 7 neutropenia, 22 diarrhoea, 39 nausea, 13 vomiting, 15 chills, 64 fatigue, 36 influenza‐like illness, 25 irritability, 14 pyrexia, 12 decreased appetite, 21 arthralgia, 21 myalgia, 18 dizziness, 41 headache, 19 depression, 19 insomnia, 20 cough, 9 dyspnoea, 13 alopecia, 7 dry skin, 17 pruritus, 20 rash | 111 out of 114 | |
| Telaprevir | 35 anaemia, 26 neutropenia, 34 diarrhoea, 44 nausea, 27 vomiting, 22 asthenia, 15 chills, 50 fatigue, 24 influenza‐like illness, 18 irritability, 34 pyrexia, 30 decreased appetite, 9 arthralgia, 20 myalgia, 19 dizziness, 18 dysgeusia, 38 headache, 11 depression, 25 insomnia, 15 cough, 5 dyspnoea, 18 alopecia, 11 dry skin, 30 pruritus, 12 rash | 38 out of 38 | 8 anaemia, 2 neutropenia, 6 diarrhoea, 11 nausea, 5 vomiting, 9 asthenia, 5 chills, 12 fatigue, 13 influenza‐like illness, 5 irritability, 7 pyrexia, 6 decreased appetite, 2 arthralgia, 6 myalgia, 2 dizziness, 5 dysgeusia, 6 headache, 4 depression, 9 insomnia, 6 cough, 2 dyspnoea, 6 alopecia, 3 dry skin, 3 pruritus | 22 out of 22 | |
| Telaprevir | 171 anaemia, 73 neutropenia, 135 diarrhoea, 181 nausea, 68 vomiting, 111 asthenia, 73 chills, 276 fatigue, 179 influenza‐like illness, 74 irritability, 130 pyrexia, 40 decreased appetite, 67 arthralgia, 87 myalgia, 47 dizziness, 65 dysgeusia, 221 headache, 59 depression, 152 insomnia, 128 cough, 82 dyspnoea, 78 alopecia, 97 dry skin, 270 pruritus, 194 rash | 517 out of 530 | 19 anaemia, 14 neutropenia, 18 diarrhoea, 31 nausea, 11 vomiting, 38 asthenia, 73 chills, 53 fatigue, 33 influenza‐like illness, 21 irritability, 36 pyrexia, 9 decreased appetite, 20 arthralgia, 24 myalgia, 7 dizziness, 8 dysgeusia, 49 headache, 19 depression, 34 insomnia, 26 cough, 17 dyspnoea, 17 alopecia, 21 dry skin, 36 pruritus, 25 rash | 126 out of 132 | |
| Vaniprevir | 6 anaemia, 7 neutropenia, 16 diarrhoea, 26 nausea, 16 vomiting, 13 asthenia, 5 chills, 17 fatigue, 17influenza‐like illness, 4 irritability, 8 pyrexia, 13 decreased appetite, 8 arthralgia, 3 myalgia, 5 dizziness, 2 dysgeusia, 26 headache, 8 depression, 15 insomnia, 8 cough, 7 dyspnoea, 6 alopecia, 6 dry skin, 9 pruritus, 10 rash | 71 out of 75 | 3 anaemia, 2 neutropenia, 4 diarrhoea, 6 nausea, 4 asthenia, 2 chills, 7 fatigue, 4 influenza‐like illness, 3 irritability, 2 pyrexia, 2 decreased appetite, 2 arthralgia, 3 myalgia, 7 headache, 3 depression, 2 insomnia, 3 cough, 5 dyspnoea, 3 alopecia, 6 dry skin, 4 pruritus, 4 rash | 19 out of 19 | |
| Vaniprevir | 6 anaemia, 7 neutropenia, 16 diarrhoea, 26 nausea, 16 vomiting, 13 asthenia, 5 chills, 17 fatigue, 17 influenza‐like illness, 4 irritability, 8 pyrexia, 13 decreased appetite, 8 arthralgia, 3 myalgia, 5 dizziness, 2 dysgeusia, 26 headache, 8 depression, 15 insomnia, 8 cough, 7 dyspnoea, 6 alopecia, 6 dry skin, 9 pruritus, 10 rash | 71 out of 75 | 3 anaemia, 2 neutropenia, 4 diarrhoea, 6 nausea, 4 asthenia, 2 chills, 7 fatigue, 4 influenza‐like illness, 3 irritability, 2 pyrexia, 2 decreased appetite, 2 arthralgia, 3 myalgia, 7 headache, 3 depression, 2 insomnia, 3 cough, 5 dyspnoea, 3 alopecia, 6 dry skin, 4 pruritus, 4 rash | 19 out of 19 | |
| Vaniprevir | 43 anaemia, 34 neutropenia, 97 diarrhoea, 110 nausea, 59 vomiting, 50 asthenia, 16 chills, 92 fatigue, 54 influenza‐like illness, 24 irritability, 37 pyrexia, 40 decreased appetite, 37 arthralgia, 38 myalgia, 23 dizziness, 16 dysgeusia, 92 headache, 32 depression, 40 insomnia, 54 cough, 30 dyspnoea, 35 alopecia, 37 dry skin, 75 pruritus, 43 rash | 225 out of 229 | 8 anaemia, 3 neutropenia, 9 diarrhoea, 10 nausea, 3 vomiting, 11 asthenia, 1 chills, 18 fatigue, 12 influenza‐like illness, 8 irritability, 14 pyrexia, 5 decreased appetite, 11 arthralgia, 12 myalgia, 6 dizziness, 3 dysgeusia, 20 headache, 3 depression, 14 insomnia, 14 cough, 8 dyspnoea, 5 alopecia, 10 dry skin, 14 pruritus, 10 rash | 55 out of 56 | |
| Vaniprevir | 43 anaemia, 34 neutropenia, 97 diarrhoea, 110 nausea, 59 vomiting, 50 asthenia, 16 chills, 92 fatigue, 54 influenza‐like illness, 24 irritability, 37 pyrexia, 40 decreased appetite, 37 arthralgia, 38 myalgia, 23 dizziness, 16 dysgeusia, 92 headache, 32 depression, 40 insomnia, 54 cough, 30 dyspnoea, 35 alopecia, 37 dry skin, 75 pruritus, 43 rash | 225 out of 229 | 8 anaemia, 3 neutropenia, 9 diarrhoea, 10 nausea, 3 vomiting, 11 asthenia, 1 chills, 18 fatigue, 12 influenza‐like illness, 8 irritability, 14 pyrexia, 5 decreased appetite, 11 arthralgia, 12 myalgia, 6 dizziness, 3 dysgeusia, 20 headache, 3 depression, 14 insomnia, 14 cough, 8 dyspnoea, 5 alopecia, 10 dry skin, 14 pruritus, 10 rash | 55 out of 56 | |
| VCH‐759 | 18 diarrhoea, 3 nausea, 4 vomiting, 1 chills, 5 fatigue, 8 headache | 20 out of 23 | 5 diarrhoea, 1 nausea, 2 headache | 6 out of 9 | |
| Velpatasvir | 2 diarrhoea, 3 nausea, 4 vomiting, 6 headache, 2 cough | 18 out of 70 | None reported | 3 out of 17 |
Remaining outcomes
None of the included trials assessed the effects of DAAs on ascites; variceal bleeding; hepato‐renal syndrome; hepatic encephalopathy; liver transplantation; hepatocellular carcinoma; or histological improvement.
Our main results on DAAs on the market or under development are summarised in summary of findings Table for the main comparison. Our main results on withdrawn DAAs are summarised in summary of findings Table 2.
Discussion
Summary of main results
We included 138 trials randomising a total of 25,232 participants. All trials and outcome results were at high risk of bias and we assessed the evidence for all outcomes as very low or low quality. There were limited data on most of our clinical outcomes, that is, we could only identify clinical trial data on all‐cause mortality and serious adverse events. Our primary results showed that when all DAAs on the market or under development were pooled in one analysis, DAAs did not seem to have any significant effects on the risk of serious adverse events. When meta‐analysed separately, simeprevir was the only DAA showing evidence of a lower risk of a serious adverse event compared with placebo. However, Trial Sequential Analysis showed that there was not enough information to confirm or reject our anticipated intervention effect. The outcome result had high risk of bias, and when one trial with an extreme result was excluded from the analysis then the meta‐analysis result showed no evidence of an effect. Withdrawn DAAs seemed to increase the risk of serious adverse events. There was not enough information to confirm or refute that DAAs have clinically relevant effects on other clinically relevant outcomes. Most of the included randomised clinical trials primarily focused on and assessed the effects of DAAs on sustained virological response. Our results confirm that DAAs seem to reduce the risk of no sustained virological response, but all the trial results were at high risk of bias. The clinical relevance of the results on sustained virological response has not been demonstrated from randomised evidence. Our main results are summarised in summary of findings Table for the main comparison.
Overall completeness and applicability of evidence
We searched for published and unpublished trials irrespective of publication type, publication status, publication date, and language. We also searched bibliographies of both Cochrane and non‐Cochrane reviews for any trials we missed.
The funnel plot for SVR shows possible asymmetry arising from data missing from the bottom right of the distribution (Figure 7). Although our analysis of SVR may be missing data from smaller trials (presumably showing smaller or no beneficial effects of DAAs) the impact of missing data on the results is negligible. The similar result obtained with a fixed‐effect model (RR 0.42) does not indicate that small study effects exaggerate results of the primary analysis.
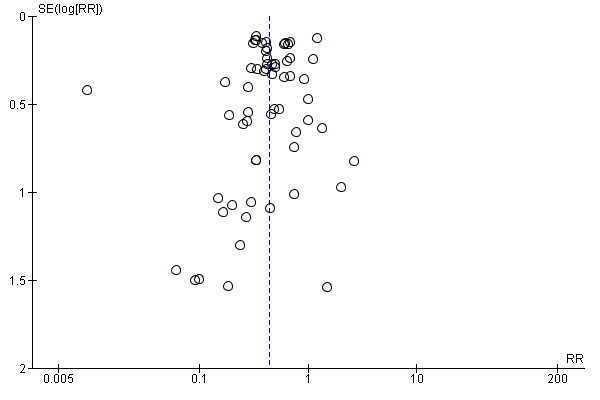
Funnel plot of comparison: 3 DAA on or on the way to the market versus placebo/no intervention (sustained virological response), outcome: 3.1 Without sustained virological response.
Our primary analysis included all DAAs that are on the market or under development. We did not include withdrawn DAAs in the primary analysis because of the historical clinical relevance of assessing the effects of these DAAs. It might be that the different types of DAAs have different clinical effects, and we therefore also assessed each DAA separately. When analysing the effects of DAAs on risk of serious adverse events, tests for subgroup difference showed evidence of a difference, but when analysed separately, only simeprevir showed evidence of an effect. Nevertheless, the evidence of an effect depended on only one trial with an extreme result and the meta‐analysis result showed no evidence of a difference when this trial was excluded from the analysis. It might be that simeprevir has a beneficial effect on risk of serious adverse events but this effect needs to be shown in trials with low risk of bias in all domains. The remaining analyses showed that there was not enough information to confirm or refute that DAAs have beneficial or harmful effects on clinically relevant outcomes.
Our analyses showed that most DAAs seem to decrease the risk of no sustained virological response but, as mentioned, this result is based on trials at high risk of bias and the clinical relevance of results on this non‐validated surrogate outcome is unknown.
Quality of the evidence
We have assessed the quality of the evidence for the results of three main outcomes (summary of findings Table for the main comparison). The GRADE assessments showed that the quality if the evidence was very low for mortality (due to risk of bias and imprecision) and serious adverse events (due to risk of bias and indirectness). Trial Sequential Analysis of serious adverse events showed that the boundary for futility was crossed. Hence, there is firm evidence that DAAs versus control do not reduce the risk of serious adverse events by 20% or more (Figure 3). A post‐hoc Trial Sequential Analysis showed that the acquired information was large enough to rule out that DAAs versus control reduce the risk of serious adverse events by 15% or more.
The quality of evidence for SVR was low due to risk of bias. We have reconsidered the issue of indirectness in relation to SVR and decided that indirectness is not applicable since we have not used it as a proxy for long‐term cure in the review. Accordingly, there is a high risk that future trials may overturn the results of this present review. Reasons for the GRADE assessments are given in the footnotes of the summary of findings Table for the main comparison. The boundary for benefit was crossed in the Trial Sequential Analysis of no sustained virological response showing that our analyses have sufficient sample size to indicate that DAAs reduce the risk of no sustained virological response.
Potential biases in the review process
Strengths
We included trials regardless of publication type, publication status, language, and choice of outcomes. We contacted all relevant trial authors if additional information was needed.
We used predefined up‐to‐date systematic review methodology and the methodology was not changed during the review process (Higgins 2011a; Jakobsen 2014a). We used Trial Sequential Analyses and adjusted our thresholds for significance to control the risks of random errors (Deeks 2011; Jakobsen 2014a), we thoroughly assessed the risks of bias of each trial to assess the risks of systematic errors ('bias') (Higgins 2011b; Jakobsen 2014a), and we used an eight‐step procedure to assess if the thresholds for statistical and clinical significance were crossed (Jakobsen 2014a). This adds further robustness to our results and conclusions. We also tested the robustness of our results with sensitivity analyses (best‐worst, worst‐best, etc.) (Sterne 2011; Jakobsen 2014a).
We reported both aggregate as well as individual serious adverse events for all included trials reporting them. We also reported non‐serious adverse events for all trials reporting them.
Limitations
Our systematic review has several limitations.
Our bias risk assessment showed that all trials were at high risk of bias. It is, therefore, highly probable that our review results are also biased, that is, that there is a great risk that our results overestimate benefit and underestimate harms (Jakobsen 2014a; Lundh 2012; Savović 2012a; Savović 2012b). This is the primary limitation of our review.
The Trial Sequential Analyses showed that, except for the primary analysis of the effects of DAAs on risk of serious adverse events, we did not have enough information to confirm or refute our anticipated clinical intervention effects. Not enough trials with a sufficient number of participants assessing clinically relevant outcomes have been conducted. It might be that limited statistical power has caused the multiple neutral meta‐analysis results and that DAAs do have beneficial or harmful effects. Furthermore, we planned multiple secondary analyses and a large number of subgroup analyses, which lead to an increased risk of type I errors (Jakobsen 2014a). Hence, the risk of random type I errors is large in this review.
We included all types of DAAs (on the market or under development) in our primary analysis and the primary analysis of the results of the effects of DAAs on risk of serious adverse events showed that we had enough information to rule out a 20% relative risk reduction. It might be that different DAAs have different effects and that including certain DAAs in the analysis dilutes the beneficial or harmful effects of other DAAs. However, we found no signs of heterogeneity in our analyses, which indicates that all of the different DAAs seem to have no, or very limited, clinical effects on risk of serious adverse events. We chose primarily to focus on the overall pooled analysis of DAAs on the market or under development for two reasons: 1. a pooled analysis would have the largest statistical power as well as precision; and 2. it would be possible to compare the different DAAs in subgroup analysis if all types of DAA were included in this present review.
Our review is flawed by the lack of proper assessments of serious adverse events in observational studies and our lack of assessment of non‐serious adverse events in randomised clinical trials as well as in observational studies. This gives our systematic review a significant tilt towards focusing on beneficial effects. We report the adverse events reported in the trials, but we decided post hoc to analyse the details on non‐serious adverse events (due to their large number and prevalence) in a future publication focusing on this. For future systematic reviews, there is also a need to assess serious as well as non‐serious adverse events reported in observational studies.
A potential limitation is the use of the composite outcome 'serious adverse events'. It is obvious that according to the definition of this outcome (see Primary outcomes) each component of this composite outcome will not necessarily have similar degrees of severity. This might bias the results of this outcome (Garattini 2016). For example, if certain more severe serious adverse events occur in one of the intervention groups and other less severe serious adverse events occur in the other intervention group, then there is a risk of overlooking actual severity differences between the compared groups when analysing this composite outcome (Garattini 2016). All‐cause mortality would be the optimal patient‐relevant outcome with the fewest methodological limitations (Garattini 2016). However, due to limited information sizes it is rare that conclusions can be drawn assessing all‐cause mortality and this is also the case in our present review. To obtain adequate statistical power it is often necessary to use composite outcomes; the potential limitations of using composite outcomes should always be considered when interpreting review results.
We chose pragmatically to only assess outcomes at one assessment time point, that is, the trial's result as provided at maximum follow‐up. Most trials were only short‐term results. Hence, our results can neither confirm nor reject that DAAs have clinical long‐term effects, which is a further limitation of our present review results, especially because most of the harmful effects of hepatitis C take years to develop.
Agreements and disagreements with other studies or reviews
We have identified multiple reviews assessing the effects of different DAAs for chronic HCV. Tehey primarily focus on the effects of DAAs on sustained virological response showing, like we do, that DAAs increased sustained virological response. The previous reviews generally concluded that they were ‘safe’ (except for the withdrawn first‐generation protease inhibitors). We summarise below the results of some of the identified reviews.
Lang 2013 meta‐analysed the results of six randomised clinical trials involving a total of 2759 participants with chronic HCV genotype 1 infection. The results showed that the sustained virological response rate was significantly higher in the telaprevir‐based regimens group (withdrawn DAA) than in the control group (OR 3.81; 95% CI 2.43 to 5.96). The results also showed that the relapse rate was significantly lower in the telaprevir‐based regimens group than in the control group (RR 0.40; 95% CI 0.24 to 0.66). However, there was an increased risk of serious adverse events in the telaprevir‐based regimens group (RR 1.45; 95% CI 1.12 to 1.87).
Basile 2014 meta‐analysed the results of six trials involving 636 participants in the analyses. HCV genotype 1 participants had an overall 12‐week sustained virological response of 66% (95% CI 57% to 73%) after 12 weeks of treatment. The outcome was significantly better for treatment‐naive participants (70%) compared to treatment‐experienced (10%). However, for HCV Genotype 2 and 3, there were similar 12‐week sustained virological responses for both treatment‐naive and treatment‐experienced participants. The overall 12‐week sustained virological response after 12 weeks of treatment was 75% (95% CI 71% to 78%).
Coco 2014 concludes that the first‐generation protease inhibitors boceprevir (withdrawn DAA) and telaprevir (withdrawn DAA), administered with peg‐IFN and RBV, significantly improved the sustained virological response both in treatment‐naive and treatment‐experienced participants with chronic genotype 1 hepatitis C. Nevertheless, their use was offset by the high incidence of adverse reactions.
Childs‐Kean 2015 reviewed the effects of simeprevir and sofosbuvir. The review focused almost exclusively on results on sustained virological response. Simeprevir was studied with peg‐IFN and RBV in seven published phase 3 trials, with overall efficacy rates of 59% to 100% (sustained virological response). Sofosbuvir was studied with RBV and with or without peg‐IFN in six phase‐3 trials with overall efficacy rates of 50% to 93% (sustained virological response). Rates of serious adverse events and early discontinuation were low in all phase‐3 trials. The most common adverse events were fatigue, insomnia, diarrhoea, headache, and anaemia, and most were considered mild to moderate in severity. The authors concluded that sofosbuvir‐ and simeprevir‐containing regimens were highly effective in obtaining sustained virological response and appeared safe for the treatment of chronic hepatitis C infection.
A narrative review presented an overview of the treatment of chronic HCV (Elbaz 2015). The authors concluded that an eradication of HCV seemed to be possible in the near future (Elbaz 2015).
Another narrative review concluded that DAAs were well‐tolerated oral therapies with 'cure' rates of > 90% in most patient populations (Götte 2016). The authors focused on results on sustained virologic response and on the structural and mechanistic insights of DAAs (Götte 2016).
Conti 2016 have recently shown in an observational study that the occurrence of liver cancer is not reduced in people who obtained sustained virological response after treatment with DAAs. In addition, people previously treated for HCC still have a high risk of tumour recurrence in the short term, despite DAA treatment (Conti 2016).
Several studies have shown that achieving sustained virologic response in hepatitis C seems to be associated with improved clinical outcomes (Smith‐Palmer 2015). However, as mentioned in Description of the condition the results of these observational studies should be interpreted with caution. Several of these non‐randomised comparisons were between those who were treated and achieved a sustained virologic response and those who were treated but did not achieve a sustained virologic response; this study design has several major limitations with regard to making any inferences about causation. First of all, observational studies will always have confounding factors. Secondly, the two subgroups had different prognoses with regard to their baseline characteristics (since patients who develop sustained virologic response have characteristics that would predict that they are less likely to progress, such as limited fibrosis, lack of obesity, favourable IL B28 genotype, female sex, lack of HIV/alcohol, etc). Lastly, it is incorrect to attribute these different outcomes to treatment because all of the patients were treated. Comparison between those who achieved sustained virologic response and those never treated is confounded by the reason for the participants to have been, or not have been treated, and then further confounded by the problem with the differences in baseline characteristics
Our present review results confirm that DAAs seem to work on sustained virological response. Our present review results add to the previous findings that there are still limited data on the clinical effects of DAAs and that there seem to be no significant effects of DAAs on the risk of serious adverse events. We had too few data to assess the effects of DAAs on all‐cause mortality. It must be noted that we, in this present review, have assessed the effects of DAAs on ‘serious adverse events’, and in our definition, adverse events are included in our analyses regardless of a possible causal link with the DAA. When an adverse event was ‘serious’ then we included it. Even though most of our results were short‐term results, we were not able to demonstrate the presence of major clinically beneficial or harmful effects of DAAs in people with chronic hepatitis C.


Study flow diagram
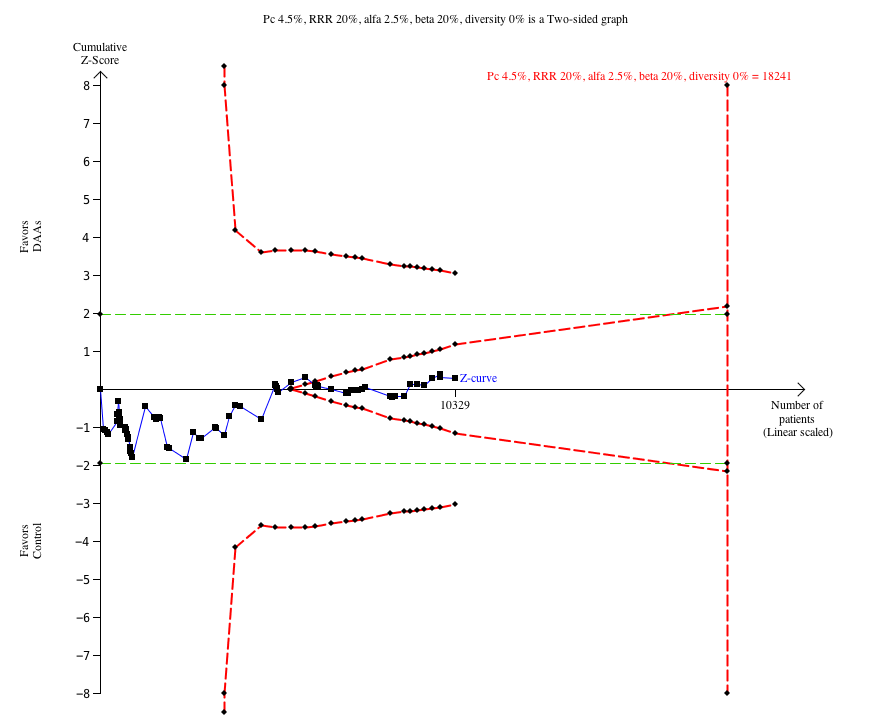
Trial Sequential Analysis of the effects of direct‐acting antivirals on the market or under development versus placebo or no intervention on risk of serious adverse events. The analysis was based on a proportion in the control group (Pc) of 4.5%, a relative risk reduction (RRR) of 20%, and alfa of 2.5%, a beta of 20%, and a diversity of 0%. The cumulative Z‐curve enters the futility area after the randomisation of about 6000 participants.

Trial Sequential Analysis of the effects of simeprevir versus placebo or no intervention on risk of serious adverse events. The analysis was based on a proportion in the control group (Pc) of 8.4%, a relative risk reduction (RRR) of 20%, and alfa of 2.5%, a beta of 20%, and a diversity of 0%. The cumulative Z‐curve crosses the naive type I error level of 5%, but it does not cross the trial monitoring boundary for benefit.

Trial Sequential Analysis of the effects of direct‐acting antivirals on the market or under development versus placebo or no intervention on risk of no sustained virological response. The analysis was based on a proportion in the control group (Pc) of 60.2%, a RRR of 20%, and alfa of 2.5%, a beta of 20%, and a diversity of 83%. After randomisation of about 1000 participants, the cumulative Z‐curve crosses the trial sequential monitoring boundary for benefit.

Trial Sequential Analysis of the effects of withdrawn direct‐acting antivirals versus placebo or no intervention on risk of serious adverse events. The analysis was based on a proportion in the control group (Pc) of 7.5%, a RRR of 20%, and alfa of 2.5%, a beta of 20%, and a diversity of 0%. After randomisation of about 5000 participants, the cumulative Z‐curve crosses the trial sequential monitoring boundary for harm.

Funnel plot of comparison: 3 DAA on or on the way to the market versus placebo/no intervention (sustained virological response), outcome: 3.1 Without sustained virological response.
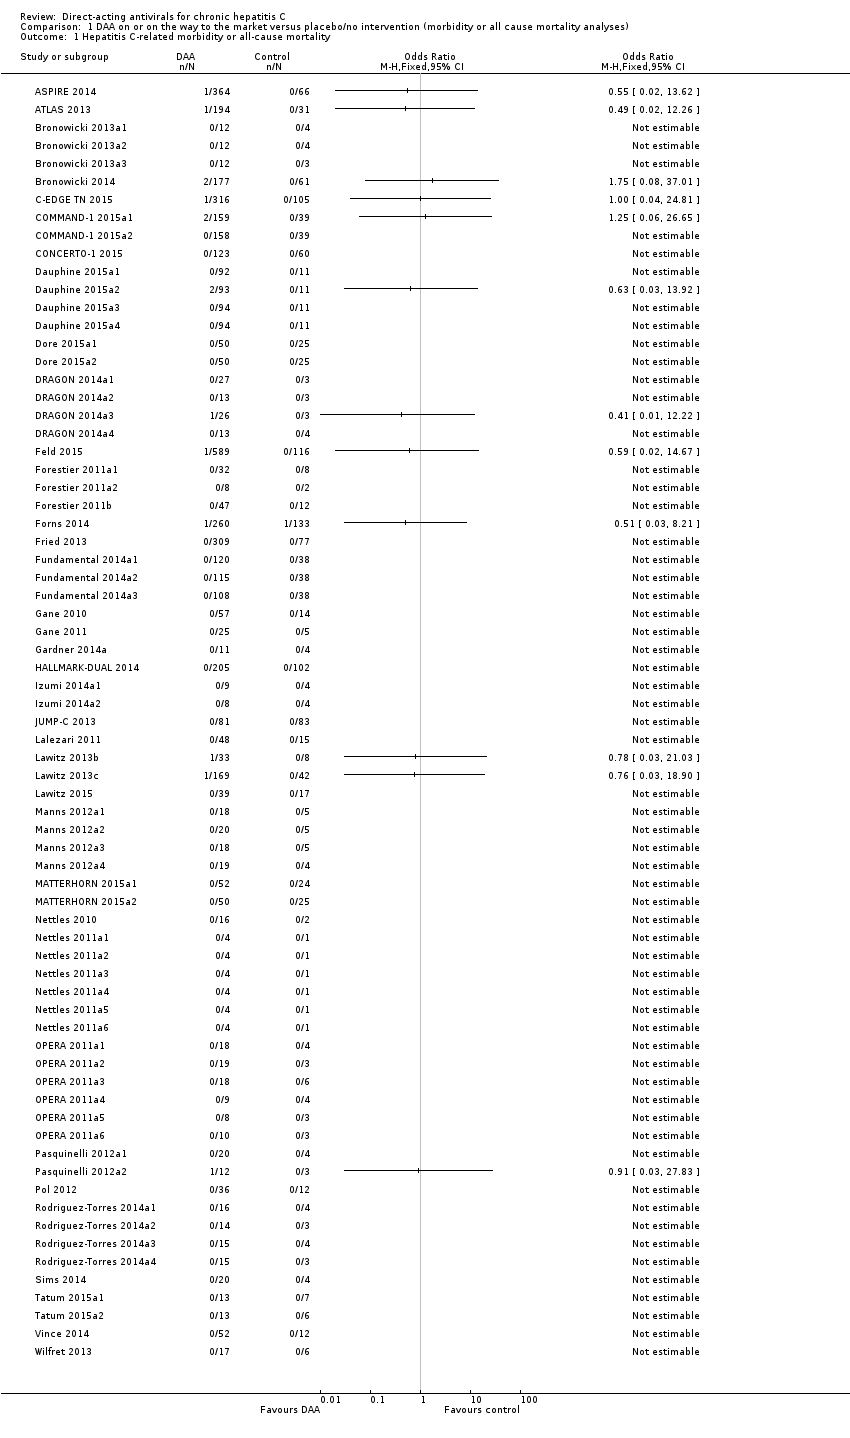
Comparison 1 DAA on or on the way to the market versus placebo/no intervention (morbidity or all cause mortality analyses), Outcome 1 Hepatitis C‐related morbidity or all‐cause mortality.

Comparison 1 DAA on or on the way to the market versus placebo/no intervention (morbidity or all cause mortality analyses), Outcome 2 Hepatitis C‐related morbidity or all‐cause mortality ‐ bias risk.

Comparison 1 DAA on or on the way to the market versus placebo/no intervention (morbidity or all cause mortality analyses), Outcome 3 Hepatitis C‐related morbidity or all‐cause mortality ‐ according to type of DAA.

Comparison 1 DAA on or on the way to the market versus placebo/no intervention (morbidity or all cause mortality analyses), Outcome 4 Hepatitis C‐related morbidity or all‐cause mortality ‐ according to group of DAA.

Comparison 1 DAA on or on the way to the market versus placebo/no intervention (morbidity or all cause mortality analyses), Outcome 5 Hepatitis C‐related morbidity or all‐cause mortality ‐ according to HIV‐infection.

Comparison 1 DAA on or on the way to the market versus placebo/no intervention (morbidity or all cause mortality analyses), Outcome 6 Hepatitis C‐related morbidity or all‐cause mortality ‐ according to comorbidity.

Comparison 1 DAA on or on the way to the market versus placebo/no intervention (morbidity or all cause mortality analyses), Outcome 7 Hepatitis C‐related morbidity or all‐cause mortality ‐ according to viral genotype.

Comparison 1 DAA on or on the way to the market versus placebo/no intervention (morbidity or all cause mortality analyses), Outcome 8 Hepatitis C‐related morbidity or all‐cause mortality ‐ according to human genotype (IL28b).

Comparison 1 DAA on or on the way to the market versus placebo/no intervention (morbidity or all cause mortality analyses), Outcome 9 Hepatitis C‐related morbidity or all‐cause mortality ‐ according to Asian‐region.

Comparison 1 DAA on or on the way to the market versus placebo/no intervention (morbidity or all cause mortality analyses), Outcome 10 Hepatitis C‐related morbidity or all‐cause mortality ‐ according to specific ethnicities.

Comparison 1 DAA on or on the way to the market versus placebo/no intervention (morbidity or all cause mortality analyses), Outcome 11 Hepatitis C‐related morbidity or all‐cause mortality ‐ according to reaching planned sample size.

Comparison 1 DAA on or on the way to the market versus placebo/no intervention (morbidity or all cause mortality analyses), Outcome 12 Hepatitis C‐related morbidity or all‐cause mortality ‐ according to prior treatment.

Comparison 1 DAA on or on the way to the market versus placebo/no intervention (morbidity or all cause mortality analyses), Outcome 13 Hepatitis C‐related morbidity or all‐cause mortality ‐ according to interferon.
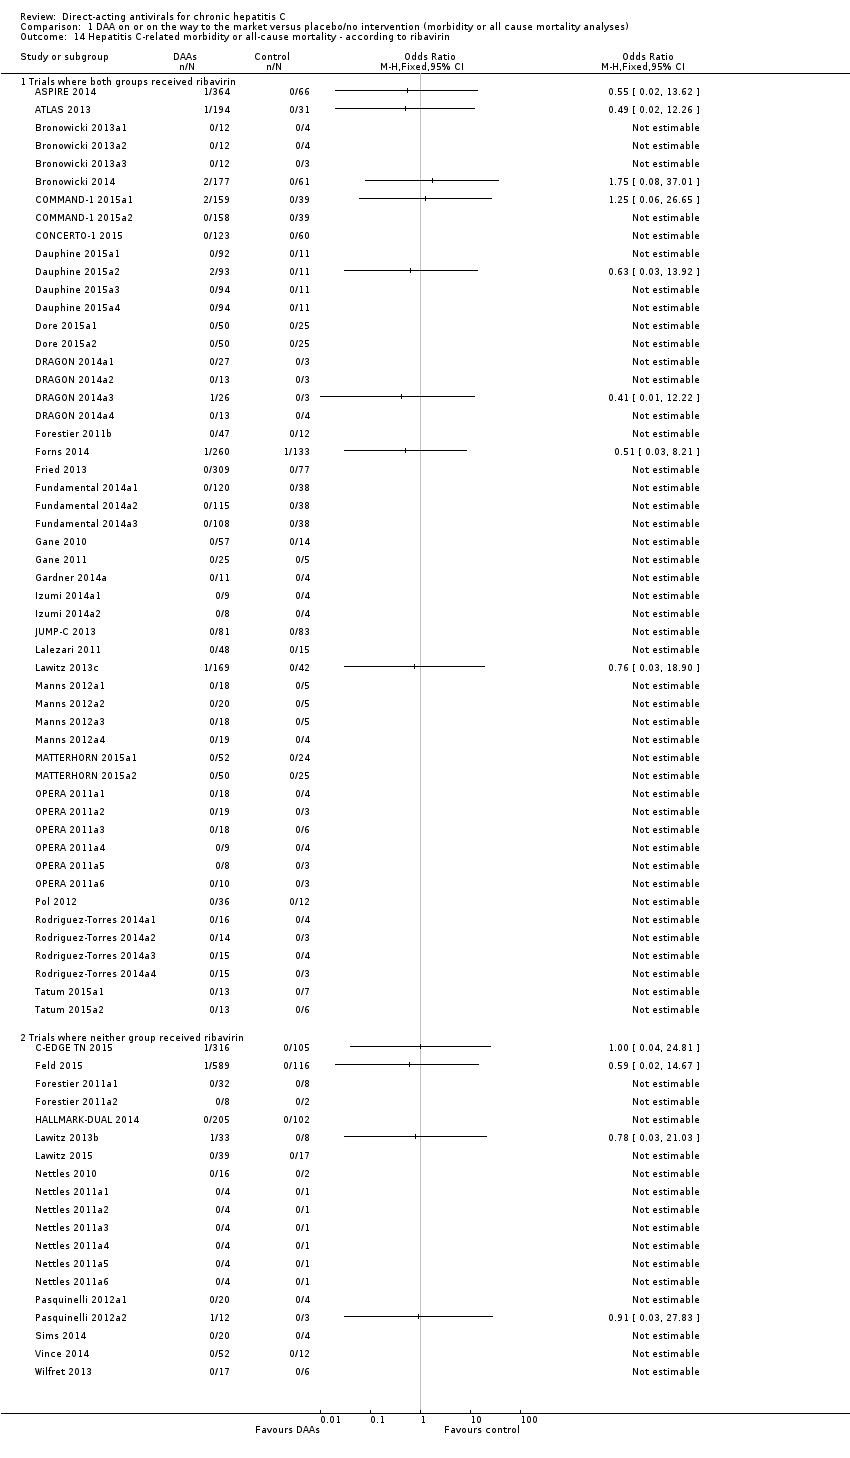
Comparison 1 DAA on or on the way to the market versus placebo/no intervention (morbidity or all cause mortality analyses), Outcome 14 Hepatitis C‐related morbidity or all‐cause mortality ‐ according to ribavirin.

Comparison 1 DAA on or on the way to the market versus placebo/no intervention (morbidity or all cause mortality analyses), Outcome 15 Hepatitis C‐related morbidity or all‐cause mortality ‐ according to chronic kidney disease.

Comparison 1 DAA on or on the way to the market versus placebo/no intervention (morbidity or all cause mortality analyses), Outcome 16 Hepatitis C‐related morbidity or all‐cause mortality ‐ according to cryoglobulinaemia.

Comparison 1 DAA on or on the way to the market versus placebo/no intervention (morbidity or all cause mortality analyses), Outcome 17 Hepatitis C‐related morbidity or all‐cause mortality ‐ according to DAA group as co‐intervention.

Comparison 1 DAA on or on the way to the market versus placebo/no intervention (morbidity or all cause mortality analyses), Outcome 18 Hepatitis C‐related morbidity or all‐cause mortality ‐ according to median dose.

Comparison 2 DAA on or on the way to the market versus placebo/no intervention (serious adverse events analyses), Outcome 1 Serious adverse events.

Comparison 2 DAA on or on the way to the market versus placebo/no intervention (serious adverse events analyses), Outcome 2 Serious adverse events ‐ bias risk.

Comparison 2 DAA on or on the way to the market versus placebo/no intervention (serious adverse events analyses), Outcome 3 Serious adverse events ‐ according to type of DAA.

Comparison 2 DAA on or on the way to the market versus placebo/no intervention (serious adverse events analyses), Outcome 4 Serious adverse events ‐ according to group of DAA.

Comparison 2 DAA on or on the way to the market versus placebo/no intervention (serious adverse events analyses), Outcome 5 Serious adverse events ‐ according to HIV‐infection.

Comparison 2 DAA on or on the way to the market versus placebo/no intervention (serious adverse events analyses), Outcome 6 Serious adverse events ‐ according to comorbidity.

Comparison 2 DAA on or on the way to the market versus placebo/no intervention (serious adverse events analyses), Outcome 7 Serious adverse events ‐ according to viral genotype.

Comparison 2 DAA on or on the way to the market versus placebo/no intervention (serious adverse events analyses), Outcome 8 Serious adverse events ‐ according to human genotype (IL28b).

Comparison 2 DAA on or on the way to the market versus placebo/no intervention (serious adverse events analyses), Outcome 9 Serious adverse events ‐ according to Asian‐region.

Comparison 2 DAA on or on the way to the market versus placebo/no intervention (serious adverse events analyses), Outcome 10 Serious adverse events ‐ according to specific ethnicities.

Comparison 2 DAA on or on the way to the market versus placebo/no intervention (serious adverse events analyses), Outcome 11 Serious adverse events ‐ according to reaching planned sample size.

Comparison 2 DAA on or on the way to the market versus placebo/no intervention (serious adverse events analyses), Outcome 12 Serious adverse events ‐ according to prior treatment.

Comparison 2 DAA on or on the way to the market versus placebo/no intervention (serious adverse events analyses), Outcome 13 Serious adverse events ‐ according to interferon.

Comparison 2 DAA on or on the way to the market versus placebo/no intervention (serious adverse events analyses), Outcome 14 Serious adverse events ‐ according to ribavirin.

Comparison 2 DAA on or on the way to the market versus placebo/no intervention (serious adverse events analyses), Outcome 15 Serious adverse events ‐ according to chronic kidney disease.

Comparison 2 DAA on or on the way to the market versus placebo/no intervention (serious adverse events analyses), Outcome 16 Serious adverse events ‐ according to cryoglobulinaemia.

Comparison 2 DAA on or on the way to the market versus placebo/no intervention (serious adverse events analyses), Outcome 17 Serious adverse events ‐ according to DAA group as co‐intervention.

Comparison 2 DAA on or on the way to the market versus placebo/no intervention (serious adverse events analyses), Outcome 18 Serious adverse events ‐ according to median dose.

Comparison 3 DAA on or on the way to the market versus placebo/no intervention (sustained virological response), Outcome 1 Without sustained virological response.

Comparison 3 DAA on or on the way to the market versus placebo/no intervention (sustained virological response), Outcome 2 Without sustained virological response ‐ bias risk.

Comparison 3 DAA on or on the way to the market versus placebo/no intervention (sustained virological response), Outcome 3 Without sustained virological response ‐ according to type of DAA.

Comparison 3 DAA on or on the way to the market versus placebo/no intervention (sustained virological response), Outcome 4 Without sustained virological response ‐ according to group of DAA.

Comparison 3 DAA on or on the way to the market versus placebo/no intervention (sustained virological response), Outcome 5 Without sustained virological response ‐ according to HIV‐infection.

Comparison 3 DAA on or on the way to the market versus placebo/no intervention (sustained virological response), Outcome 6 Without sustained virological response ‐ according to comorbidity.

Comparison 3 DAA on or on the way to the market versus placebo/no intervention (sustained virological response), Outcome 7 Without sustained virological response ‐ according to viral genotype.
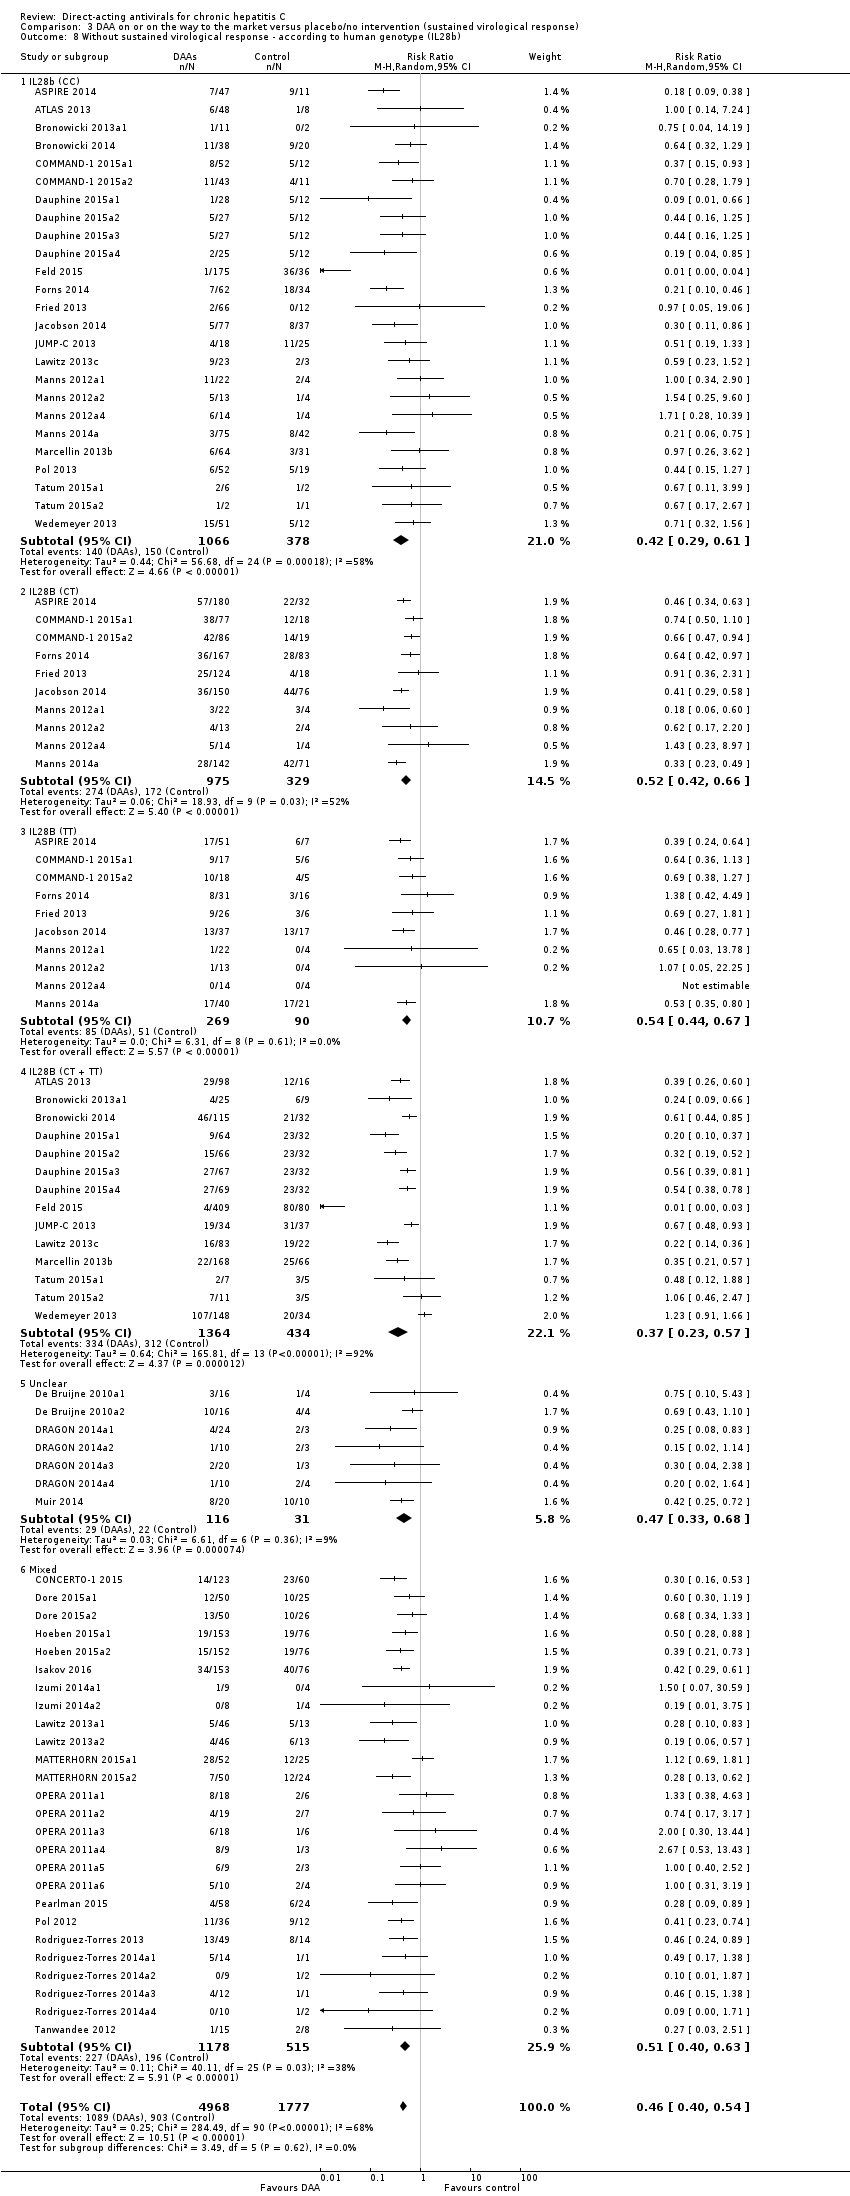
Comparison 3 DAA on or on the way to the market versus placebo/no intervention (sustained virological response), Outcome 8 Without sustained virological response ‐ according to human genotype (IL28b).

Comparison 3 DAA on or on the way to the market versus placebo/no intervention (sustained virological response), Outcome 9 Without sustained virological response ‐ according to Asian‐region.

Comparison 3 DAA on or on the way to the market versus placebo/no intervention (sustained virological response), Outcome 10 Without sustained virological response ‐ according to specific ethnicities.
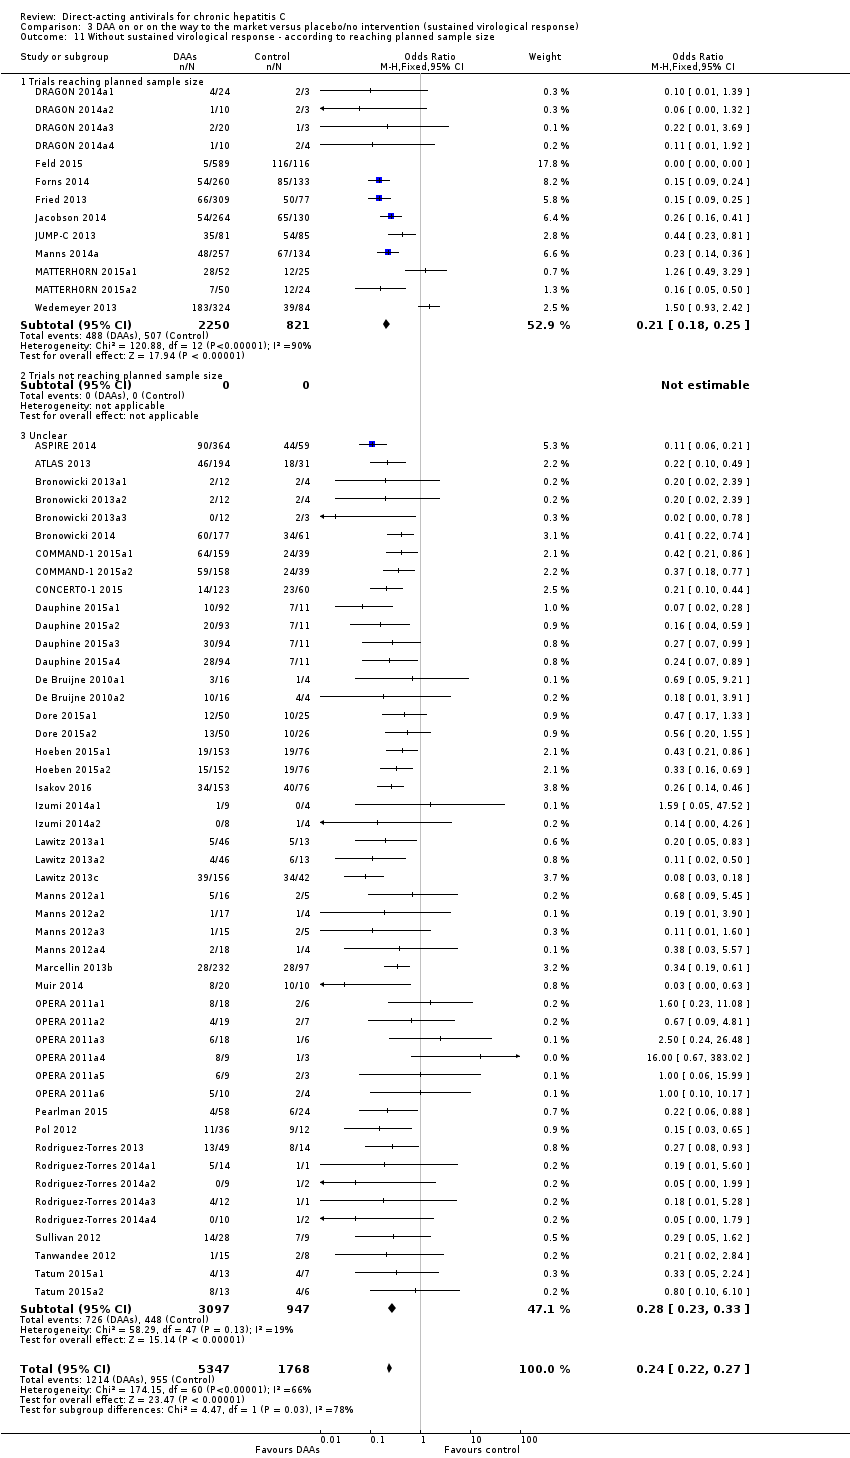
Comparison 3 DAA on or on the way to the market versus placebo/no intervention (sustained virological response), Outcome 11 Without sustained virological response ‐ according to reaching planned sample size.

Comparison 3 DAA on or on the way to the market versus placebo/no intervention (sustained virological response), Outcome 12 Without sustained virological response ‐ according to prior treatment.

Comparison 3 DAA on or on the way to the market versus placebo/no intervention (sustained virological response), Outcome 13 Without sustained virological response ‐ according to interferon.

Comparison 3 DAA on or on the way to the market versus placebo/no intervention (sustained virological response), Outcome 14 Without sustained virological response ‐ according to ribavirin.

Comparison 3 DAA on or on the way to the market versus placebo/no intervention (sustained virological response), Outcome 15 Without sustained virological response ‐ according to chronic kidney disease.

Comparison 3 DAA on or on the way to the market versus placebo/no intervention (sustained virological response), Outcome 16 Without sustained virological response ‐ according to cryoglobulinaemia.

Comparison 3 DAA on or on the way to the market versus placebo/no intervention (sustained virological response), Outcome 17 Without sustained virological response ‐ according to DAA group as co‐intervention.

Comparison 3 DAA on or on the way to the market versus placebo/no intervention (sustained virological response), Outcome 18 Without sustained virological response ‐ 'Best‐worst case' scenario.

Comparison 3 DAA on or on the way to the market versus placebo/no intervention (sustained virological response), Outcome 19 Without sustained virological response ‐ 'Worst‐best case' scenario.

Comparison 3 DAA on or on the way to the market versus placebo/no intervention (sustained virological response), Outcome 20 Without sustained virological response ‐ according to median dose.

Comparison 4 Danoprevir versus placebo/no intervention, Outcome 1 Hepatitis C‐related morbidity or all‐cause mortality.

Comparison 4 Danoprevir versus placebo/no intervention, Outcome 2 Hepatitis C‐related morbidity or all‐cause mortality ‐ according to dose.

Comparison 4 Danoprevir versus placebo/no intervention, Outcome 3 Serious adverse events.

Comparison 4 Danoprevir versus placebo/no intervention, Outcome 4 Serious adverse events ‐ according to median dose.

Comparison 4 Danoprevir versus placebo/no intervention, Outcome 5 Without sustained virological response.

Comparison 4 Danoprevir versus placebo/no intervention, Outcome 6 Without sustained virological response ‐ according to median dose.

Comparison 5 All DAA versus placebo/no intervention/other medical intervention (morbidity or all‐cause mortality analyses), Outcome 1 Hepatitis C‐related morbidity or all‐cause mortality.

Comparison 6 All DAA versus placebo/no intervention/other medical intervention (serious adverse events analyses), Outcome 1 Serious adverse events.

Comparison 6 All DAA versus placebo/no intervention/other medical intervention (serious adverse events analyses), Outcome 2 Serious adverse events ‐ bias risk.

Comparison 6 All DAA versus placebo/no intervention/other medical intervention (serious adverse events analyses), Outcome 3 Serious adverse events ‐ according to type of DAA.

Comparison 6 All DAA versus placebo/no intervention/other medical intervention (serious adverse events analyses), Outcome 4 Serious adverse events ‐ according to group of DAA.

Comparison 6 All DAA versus placebo/no intervention/other medical intervention (serious adverse events analyses), Outcome 5 Serious adverse events ‐ according to HIV‐infection.

Comparison 6 All DAA versus placebo/no intervention/other medical intervention (serious adverse events analyses), Outcome 6 Serious adverse events ‐ according to comorbidity.

Comparison 6 All DAA versus placebo/no intervention/other medical intervention (serious adverse events analyses), Outcome 7 Serious adverse events ‐ according to viral genotype.

Comparison 6 All DAA versus placebo/no intervention/other medical intervention (serious adverse events analyses), Outcome 8 Serious adverse events ‐ according to human genotype (IL28b).

Comparison 6 All DAA versus placebo/no intervention/other medical intervention (serious adverse events analyses), Outcome 9 Serious adverse events ‐ according to Asian‐region.

Comparison 6 All DAA versus placebo/no intervention/other medical intervention (serious adverse events analyses), Outcome 10 Serious adverse events ‐ according to specific ethnicities.

Comparison 6 All DAA versus placebo/no intervention/other medical intervention (serious adverse events analyses), Outcome 12 Serious adverse events ‐ according to prior treatment.

Comparison 6 All DAA versus placebo/no intervention/other medical intervention (serious adverse events analyses), Outcome 13 Serious adverse events ‐ according to interferon.

Comparison 6 All DAA versus placebo/no intervention/other medical intervention (serious adverse events analyses), Outcome 14 Serious adverse events ‐ according to ribavirin.

Comparison 6 All DAA versus placebo/no intervention/other medical intervention (serious adverse events analyses), Outcome 15 Serious adverse events ‐ according to chronic kidney disease.
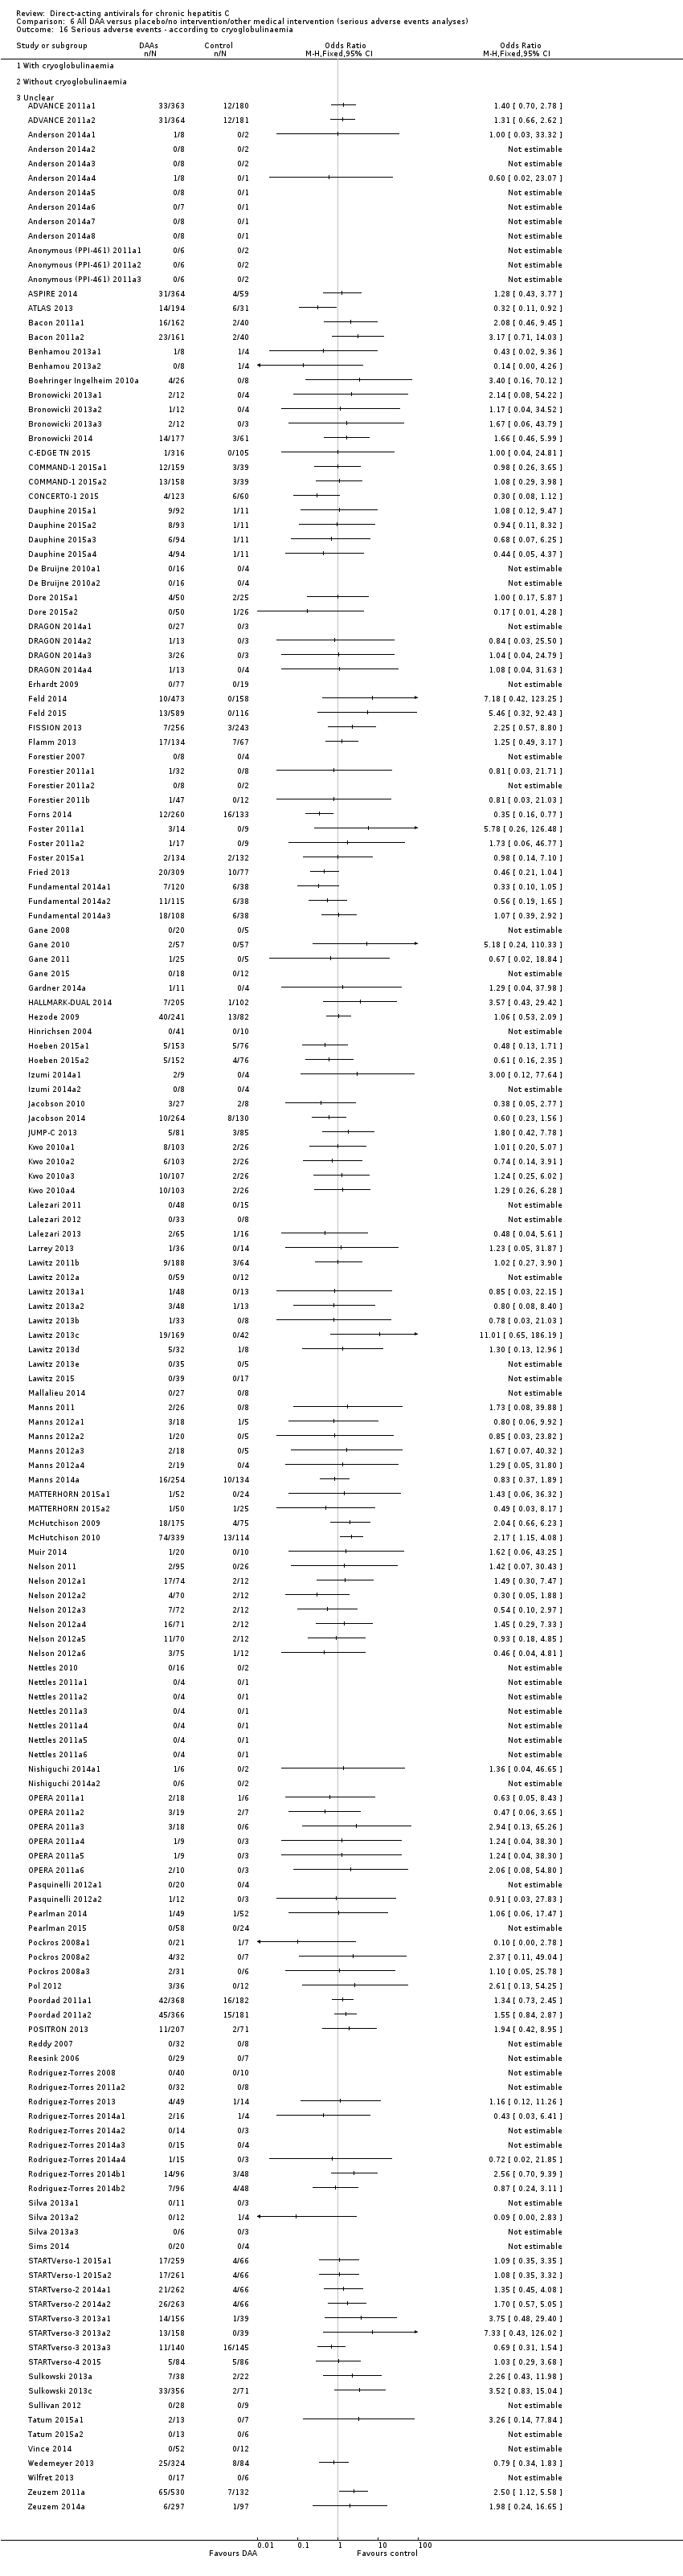
Comparison 6 All DAA versus placebo/no intervention/other medical intervention (serious adverse events analyses), Outcome 16 Serious adverse events ‐ according to cryoglobulinaemia.

Comparison 6 All DAA versus placebo/no intervention/other medical intervention (serious adverse events analyses), Outcome 17 Serious adverse events ‐ according to DAA group as co‐intervention.

Comparison 7 All DAA versus placebo/no intervention/other medical intervention (sustained virological response analyses), Outcome 1 Without sustained virological response.

Comparison 8 All DAA versus placebo/no intervention/other medical intervention (quality of life scores), Outcome 1 SF‐36 physical score.
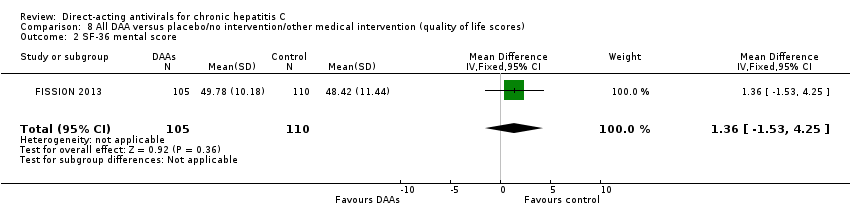
Comparison 8 All DAA versus placebo/no intervention/other medical intervention (quality of life scores), Outcome 2 SF‐36 mental score.
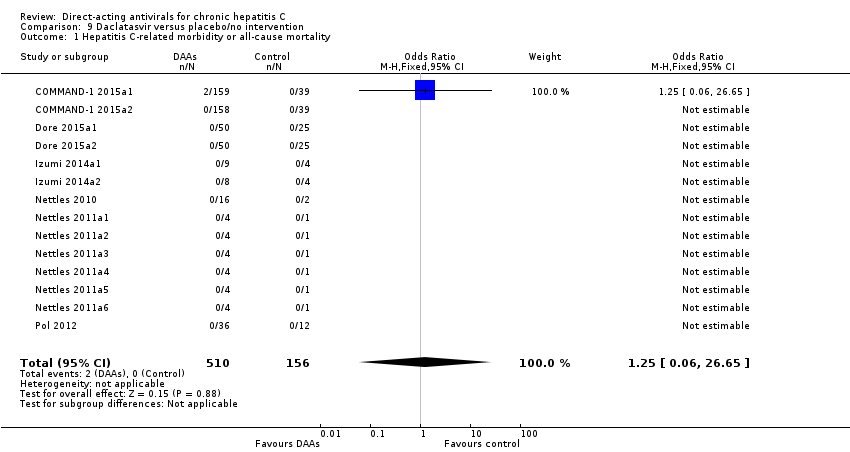
Comparison 9 Daclatasvir versus placebo/no intervention, Outcome 1 Hepatitis C‐related morbidity or all‐cause mortality.

Comparison 9 Daclatasvir versus placebo/no intervention, Outcome 2 Hepatitis C‐related morbidity or all‐cause mortality ‐ according to dose.

Comparison 9 Daclatasvir versus placebo/no intervention, Outcome 3 Serious adverse events.

Comparison 9 Daclatasvir versus placebo/no intervention, Outcome 4 Serious adverse events ‐ according to median dose.

Comparison 9 Daclatasvir versus placebo/no intervention, Outcome 5 Without sustained virological response.

Comparison 9 Daclatasvir versus placebo/no intervention, Outcome 6 Without sustained virological response ‐ according to median dose.

Comparison 10 Simeprevir versus placebo/no intervention, Outcome 1 Hepatitis C‐related morbidity or all‐cause mortality.

Comparison 10 Simeprevir versus placebo/no intervention, Outcome 2 Hepatitis C‐related morbidity or all‐cause mortality ‐ according to dose.

Comparison 10 Simeprevir versus placebo/no intervention, Outcome 3 Serious adverse events.

Comparison 10 Simeprevir versus placebo/no intervention, Outcome 4 Serious adverse events ‐ according to median dose.
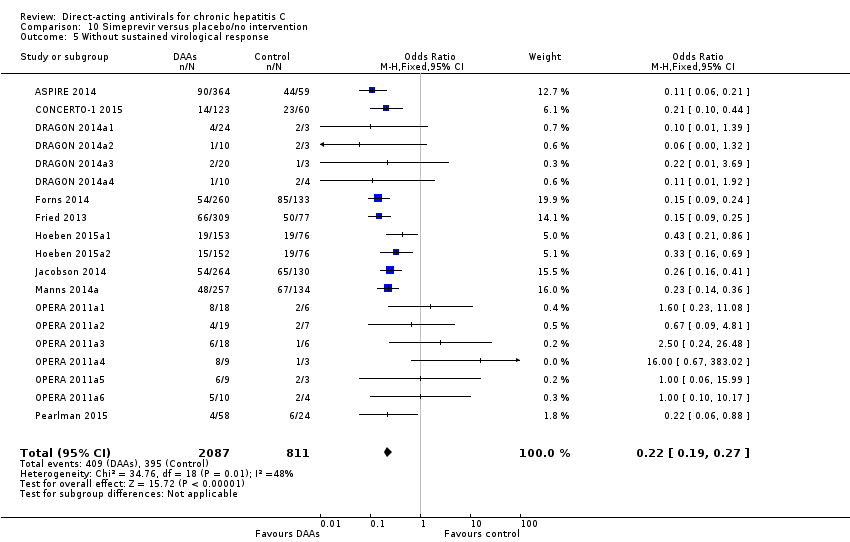
Comparison 10 Simeprevir versus placebo/no intervention, Outcome 5 Without sustained virological response.

Comparison 10 Simeprevir versus placebo/no intervention, Outcome 6 Without sustained virological response ‐ according to median dose.

Comparison 11 Vaniprevir versus placebo/no intervention, Outcome 1 Hepatitis C‐related morbidity or all‐cause mortality.

Comparison 11 Vaniprevir versus placebo/no intervention, Outcome 2 Hepatitis C‐related morbidity or all‐cause mortality ‐ according to dose.

Comparison 11 Vaniprevir versus placebo/no intervention, Outcome 3 Serious adverse events.

Comparison 11 Vaniprevir versus placebo/no intervention, Outcome 4 Serious adverse events ‐ according to median dose.

Comparison 11 Vaniprevir versus placebo/no intervention, Outcome 5 Without sustained virological response.

Comparison 11 Vaniprevir versus placebo/no intervention, Outcome 6 Without sustained virological response ‐ according to median dose.

Comparison 12 All DAA versus placebo/no intervention, Outcome 1 Without significant reductions in ALT/AST serum levels.

Comparison 12 All DAA versus placebo/no intervention, Outcome 2 Without significant reductions in ALT/AST serum levels ‐ according to DAA status.
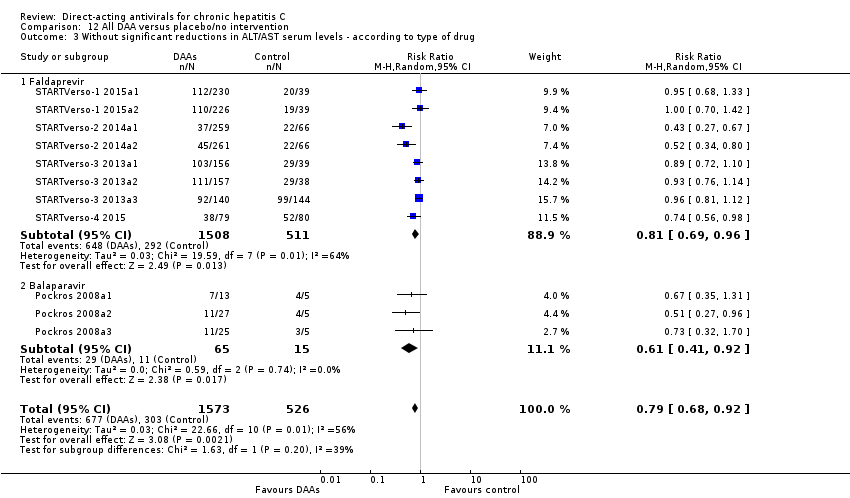
Comparison 12 All DAA versus placebo/no intervention, Outcome 3 Without significant reductions in ALT/AST serum levels ‐ according to type of drug.
| Direct‐acting antivirals versus control | ||||||
| Patient or population: adults with chronic hepatitis C | ||||||
| Outcomes | Anticipated absolute effects* (95% CI) | Relative effect (TSA‐adjusted CI) | № of participants | Quality of the evidence | Comments | |
| Risk with placebo or no intervention | Risk with direct‐acting antivirals | |||||
| All‐cause mortality at maximum follow‐up | 2 per 1000 | 7 per 1000 | OR 3.72 (‐) | 2996 | ⊕⊝⊝⊝ | It was not possible to perform Trial Sequential Analysis because of limited data and too few events |
| Proportion of participants with one or more serious adverse event at maximum follow‐up | 56 per 1000 | 52 per 1000 | OR 0.93 (TSA CI 0.71 to 1.33) | 15,817 | ⊕⊝⊝⊝ | Trial Sequential Analysis showed that the boundary for futility was crossed. This leads us to conclude that any possible intervention effect, if any, is less than 20% |
| Proportion of participants with no sustained virological response at maximum follow‐up | 541 per 1000 | 238 per 1000 | RR 0.44 (TSA CI 0.42 to 0.55) | 6886 | ⊕⊕⊝⊝ Low3 | Trial Sequential Analysis showed that the boundary for benefit was crossed. This indicates that DAAs seem to decrease the risk of no sustained virological response by at least 20% if risk of bias and other threats to the validity can be disregarded |
| *The risk in the intervention group (and its 95% confidence interval) is based on the observed risk in the comparison group and the relative effect of the intervention (and its 95% CI). | ||||||
| GRADE Working Group grades of evidence | ||||||
| 1Downgraded two levels because of very serious risk of bias in the included trials (see Figure 1) and two levels due to very serious imprecision (none of the TSA boundaries are crossed, so the information size is too low). | ||||||
| Direct‐acting antivirals withdrawn from the market versus control | ||||||
| Patient or population: adults with chronic hepatitis C | ||||||
| Outcomes | Anticipated absolute effects* (95% CI) | Relative effect (TSA‐adjusted CI) | № of participants | Quality of the evidence | Comments | |
| Risk with placebo or no intervention | Risk with direct‐acting antivirals | |||||
| All‐cause mortality at maximum follow‐up | 7 per 1000 | 5 per 1000 | OR 0.64 (‐) | 3045 | ⊕⊝⊝⊝ | It was not possible to perform Trial Sequential Analysis because of limited data and too few events |
| Proportion of participants with one or more serious adverse event at maximum follow‐up | 75 per 1000 | 108 per 1000 | OR 1.45 (TSA 1.16 to 1.82) | 9229 | ⊕⊝⊝⊝ | Trial Sequential Analysis showed that the boundary for harm was crossed. This shows that there is firm evidence that withdrawn DAAs increase the risk of a serious adverse event by at least 20% |
| Proportion of participants with no sustained virological response at maximum follow‐up | 586 per 1000 | 356 per 1000 | RR 0.61 (0.55, 0.69) (TSA CI 0.42 to 0.55) | 9075 | ⊕⊕⊝⊝ Low3 | Trial Sequential Analysis not performed |
| *The risk in the intervention group (and its 95% confidence interval) is based on the observed risk in the comparison group and the relative effect of the intervention (and its 95% CI). CI: confidence interval; DAA: direct‐acting antivirals; OR: odds ratio; RCTs: randomised clinical trials; RR: risk ratio; TSA: Trial Sequential Analysis | ||||||
| GRADE Working Group grades of evidence | ||||||
| 1Downgraded two levels because of very serious risk of bias in the included trials (see Figure 1) and two levels due to very serious imprecision (none of the TSA boundaries are crossed so the information size is too low). | ||||||
| Direct‐acting antiviral agents (DAAs) | |||
| NS3/NS4A inhibitors | NS5B inhibitors | NS5A inhibitors | |
| NPI | NNPI | ||
| ACH‐2684 | ALS2200/VX135 | ABT‐072 | ACH‐2928 |
| Asunaprevir | BILB1941 | Beclabuvir | Daclatasvir |
| Boceprevir | GS0938/PSI352938 | BI201127 | Elbasvir |
| Celuprevir | GS6620 | Dasabuvir | GSK2336805 |
| Danoprevir | GS9851(PSI7851) | Deleobuvir | Ledipasvir |
| Faldaprevir | IDX184 | Filibuvir | MK‐8408 |
| Grazoprevir | INX189/BMS986094 | GSK2878175/GSK175 | Odalasvir |
| GS9256 | Mericitabine | IDX375 | Ombitasvir |
| GS9857 | MK‐3682 | MK‐3281 | PPI461 |
| IDX320 | Sofosbuvir | Nesbuvir | Ravidasvir |
| Narlaprevir | VX‐135 | Radalbuvir | Samatasvir |
| Paritaprevir | ‐ | Setrobuvir | Velpatasvir |
| PHX1766 | ‐ | Tegobuvir | ‐ |
| Simperevir | ‐ | TMC‐647055 | ‐ |
| Sovaprevir | ‐ | VCH‐759 | ‐ |
| Telaprevir | ‐ | VCH‐916 | ‐ |
| Vaniprevir | ‐ | VX222 | ‐ |
| Vedroprevir | ‐ | ‐ | ‐ |
| The table presents a list of 58 direct‐acting antiviral agents (DAAs). We have listed the DAAs according to the DAA class they belong to (see Background section). When a DAA has not been assigned a generic or brand name, we have presented it with its experimental compound number prefix. | |||
| Trial | Experimental intervention | Type and number of serious adverse events (experimental group) | Proportion of participants with a serious adverse event (experimental group) | Type and number of serious adverse events (control group) | Proportion of participants with a serious adverse event (control group) |
| Asunaprevir | 1 abdominal pain, 1 lung neoplasm malignant, 1 cytolytic hepatitis, and 2 unspecified events | 5 out of 36 | None reported | 0 out of 11 | |
| Asunaprevir | 2 deaths and 14 unspecified events | 16 out of 177 | 3 unspecified events | 3 out of 61 | |
| Balapiravir | Many events but only a few were specified: 3 deaths, 10 haematological, 10 infection, 8 eye disorders | 49 out of 432 | Many events but not all were specified: 2 infections, 1 death | 9 out of 72 | |
| Beclabuvir | 1 anaemia, 1 constipation, 1 febrile neutropenia, 1 leukopenia | 1 out of 26 | 1 serotonin syndrome | 1 out of 13 | |
| Boceprevir | 5 anaemia, 1 angina pectoris, 1 atrial fibrillation, 1 coronary artery disease, 1 myocardial infarction, 1 myopericarditis, 2 abdominal pain, 1 constipation, 1 diarrhoea, 1 gastritis, 1 irritable bowel syndrome, 1 oesophageal varices haemorrhage, 1 pancreatitis acute, 1 pancreatitis necrotising, 1 peptic ulcer, 1 asthenia, 3 chest pain, 1 oedema peripheral, 1 pyrexia, 1 cholecystitis, 3 appendicitis, 1 bronchopneumonia, 1 catheter site infection, 1 gastroenteritis viral, 1 pneumonia, 1 lower limb fracture, 1 overdose, 1 decreased appetite, 1 dehydration, 1 hyperglycaemia, 1 back pain, 2 intervertebral disc protrusion, 1 pain in extremity, 1 hepatic neoplasm malignant, 1 hepatic encephalopathy, 1 sciatica, 1 syncope, 1 bipolar disorder, 1 completed suicide, 4 depression, 2 homicidal ideation, 5 suicidal ideation, 2 dyspnoea, 1 pleuritic pain, 1 pneumothorax, 1 abdominal hernia repair, 1 deep vein thrombosis, 1 phlebitis | 39 out of 323 | 2 chest pain, 1 cholelithiasis, 1 gastroenteritis | 4 out of 80 | |
| Boceprevir | 1 coronary artery disease, 1 diarrhoea, 1 asthenia, 1 pyrexia, 2 pneumonia, 2 syncope, 1 suicidal ideation, 1 deep vein thrombosis, 1 neutropenia, 1 thrombocytopenia, 1 cardiac failure, 1 upper gastrointestinal haemorrhage , 1 multi‐organ failure, 1 bronchitis, 1 cellulitis, 1 chlamydia infection, 1 influenza, 1 pneumonia staphylococcal, 1 staphylococcal bacteraemia, 1 staphylococcal infection, 1 urosepsis, 1 gun shot wound, 2 hyponatraemia, 1 lethargy, 1 subarachnoid haemorrhage, 1 mental status changes | 18 out of 134 | 1 chest pain, 1 intervertebral disc protrusion, 1 abnormal behaviour, 1 irritability, 1 osteotomy, 1 foreign body, 1 neuralgia, 1 anxiety, 1 renal colic | 7 out of 67 | |
| Boceprevir | 14 neutropenia, 1 intestinal obstruction, 1 osteomyelitis chronic, 1 pneumonia, 1 diabetic ketoacidosis, 1 intervertebral disc protrusion, 1 transient ischaemic attack | 17 out of 159 | 4 neutropenia, 1 general disorders, 1 accidental overdose, 1 prostatitis, 2 hypertension | 9 out of 78 | |
| Boceprevir | 1 anaemia, 1 abdominal pain, 2 asthenia, 2 pyrexia, 2 pneumonia, 1 decreased appetite, 1 dehydration, 2 depression, 2 homicidal ideation, 3 suicidal ideation, 1 dyspnoea, 1 deep vein thrombosis, 3 nausea, 1 vomiting, 3 neutropenia, 1 multi‐organ failure, 2 cellulitis, 2 abdominal pain upper, 1 headache, 1 suicide attempt, 1 accidental overdose, 1 fall, 1 pulmonary embolism, 1 gastroenteritis, 1 erysipelas, 1 panic attack, 1 fatigue, 1 supraventricular tachycardia, 3 pancreatitis, 1 cerebrovascular accident, 1 hypoaesthesia, 1 anxiety, 1 retinal ischaemia, 1 neuropathy peripheral, 1 aggression, 1 scotoma, 1 hypovolaemia, 1 vulval abscess, 1 retinopathy, 1 inguinal hernia, 1 cervix carcinoma, 1 pericarditis, 1 paranoia, 1 neutrophil count decreased, 1 paraesthesia, 1 peritoneal haemorrhage, 1 deafness unilateral, 1 periodontal disease, 1 corneal infection, 1 pneumonia streptococcal, 1 drug toxicity, 1 blood amylase increased, 1 lipase increased, 1 basal cell carcinoma, 1 renal cell carcinoma | 40 out of 527 | 1 suicidal ideation, 1 breast cancer, 1 parathyroid tumour benign, 1 muscle spasms, 1 rib fracture, 1 contusion, 1 inguinal hernia, 1 diplopia, 1 staphylococcal sepsis, 1 animal bite, 1 hand fracture, 1 third nerve paralysis, 1 alcoholism, 1 dependence | 8 out of 104 | |
| Boceprevir | 1 anaemia | 1 out of 49 | 1 anaemia | 1 out of 52 | |
| Boceprevir | 7 anaemia, 1 atrial fibrillation, 1 coronary artery disease, 2 abdominal pain, 1 gastritis, 1 pancreatitis acute, 5 chest pain, 4 pyrexia, 1 cholecystitis, 4 pneumonia, 1 overdose, 1 dehydration, 1 back pain, 1 intervertebral disc protrusion, 5 syncope, 1 completed suicide, 2 depression, 4 suicidal ideation, 1 dyspnoea, 1 nausea, 2 vomiting, 3 neutropenia, 3 thrombocytopenia, 2 bronchitis, 3 cellulitis, 1 staphylococcal infection, 1 hyponatraemia, 1 pancytopenia, 1 breast cancer, 1 malaise, 1 pneumonia pneumococcal, 1 haemoptysis, 1 road traffic accident, 1 suicide attempt, 1 pruritus, 1 rash erythematous, 1 dizziness, 2 pulmonary embolism, 1 haemorrhoids, 4 gastroenteritis, 1 general physical health deterioration, 1 hypertensive crisis, 1 colon cancer, 1 drug abuse, 2 hypokalaemia, 2 chest discomfort, 1 fatigue, 1 perirectal abscess, 1 acute myocardial infarction, 1 gastrointestinal haemorrhage, 1 aplasia pure red cell, 2 leukopenia, 1 atrial flutter, 1 cardiac arrest, 1 hypertrophic cardiomyopathy, 1 tachycardia, 1 deafness, 1 conjunctivitis, 1 optic neuropathy, 1 papilledema, 1 abdominal pain lower, 1 colonic polyp, 1 gastroesophageal reflux disease, 1 hematemesis, 1 haemorrhoidal haemorrhage, 1 Mallory‐weiss syndrome, 1 umbilical hernia, 1 sarcoidosis, 1 abscess, 1 abscess limb, 1 bacteraemia, 1 epiglottitis, 1 infected bites, 1 injection site infection, 1 scrotal abscess, 1 tracheobronchitis, 1 post procedural complication, 1 transfusion reaction, 1 vascular pseudoaneurysm, 1 wound dehiscence, 1 flank pain, 1 groin pain, 1 musculoskeletal chest pain, 1 bladder cancer, 1 pancreatic carcinoma, 1 prostate cancer, 1 carotid artery stenosis, 1 cerebral ischaemia, 1 motor neurone disease, 1 muscle spasticity, 1 affective disorder, 1 alcohol abuse, 1 anxiety, 1 psychiatric decompensation, 1 scrotal pain, 2 cough, 1 pleural fibrosis, 1 alcohol use, 1 laryngeal operation, 1 accelerated hypertension, 1 arterial thrombosis limb, 2 hypotension | 87 out of 734 | 1 anaemia, 1 myocardial infarction, 1 abdominal pain, 2 pyrexia, 1 cholecystitis, 1 appendicitis, 1 pneumonia, 1 hepatic neoplasm malignant, 1 completed suicide, 1 depression, 1 suicidal ideation, 1 pneumothorax, 2 cholelithiasis, 1 nausea, 1 vomiting, 1 cellulitis, 1 breast cancer, 1 colitis, 1 upper respiratory tract infection, 1 suicide attempt, 2 death, 1 accidental overdose, 1 dizziness, 1 loss of consciousness, 1 cholecystitis acute, 1 sinusitis, 2 pancreatitis, 1 leukocytosis, 1 cardiac arrest, 1 cardio‐respiratory arrest, 1 hypothyroidism, 1 cholelithiasis obstructive, 1 atypical mycobacterial infection, 1 diverticulitis, 1 enterocolitis infectious, 1 alcohol poisoning, 1 spinal fracture, 1 white blood cell count decreased, 1 lung adenocarcinoma, 1 prostate cancer, 1 hypoaesthesia, 1 affective disorder, 1 bipolar disorder, 1 drug dependence, 1 intentional self‐injury, 1 personality disorder, 1 glomerulonephritis minimal lesion, 1 renal tubular necrosis, 1 physical assault, 1 cholecystectomy, 1 skin neoplasm excision | 31 out of 363 | |
| Boceprevir | None reported | 0 out of 28 | 1 atrial fibrillation | 1 out of 10 | |
| Boceprevir | 3 anaemia, 2 pneumonia, 1 syncope, 1 depression, 1 deep vein thrombosis, 1 lymphadenopathy, 1 renal failure acute, 2 pulmonary embolism, 1 arthralgia, 1 sinusitis, 1 urinary tract infection, 1 lung infection pseudomonal, 1 pelvic inflammatory disease, 1 pulmonary hypertension, 1 suicide attempt | 11 out of 64 | 2 anaemia, 1 overdose, 1 cholelithiasis, 1 abdominal pain upper, 1 meniscus lesion, 1 pancreatitis, 1 post procedural infection, 1 renal failure, 1 cholecystectomy, 1 vulval abscess, 1 ventricular fibrillation, 1 ligament rupture, 1 lactic acidosis, 1 respiratory failure | 7 out of 34 | |
| Daclatasvir | 1 hepatic neoplasm malignant, 1 rectal ulcer haemorrhage, 1 gastrointestinal inflammation, 1 adhesion, 1 biliary colic, 1 hyperbilirubinaemia, 1 appendiceal abscess, 1 tonsil cancer | 6 out of 196 | 1 abdominal pain upper, 1 epicondylitis, 1 conversion disorder | 3 out of 100 | |
| Daclatasvir | 1 anaemia, 1 abdominal pain, 1 gastritis, 1 chest pain, 2 pneumonia, 1 overdose, 1 syncope, 2 depression, 2 suicidal ideation, 1 dyspnoea, 1 bronchitis, 1 peritonitis, 1 rash generalised, 1 febrile neutropenia, 1 aplastic anaemia, 1 auricular perichondritis, 2 gastric ulcer haemorrhage, 1 death, 1 bile duct stone, 1 clostridium difficile, 1 furuncle, 1 carbuncle, 1 oral herpes, 1 accidental overdose, 2 falls, 1 bursitis, 1 rhabdomyolysis, 1 muscle spasms, 1 costochondritis, 1 dizziness, 1 loss of consciousness, 1 adjustment disorder, 1 hypomania, 1 mental disorder, 1 substance‐induced psychotic disorder, 1 schizophrenia, paranoid type | 25 out of 317 | 2 anaemia, 1 atrial fibrillation, 1 pneumonia, 1 pyelonephritis, 1 haemoglobin decreased, 1 epistaxis, 1 electrocardiogram change, 1 neutrophil count decreased, 1 myalgia, 1 aphasia, 1 paraesthesia | 6 out of 78 | |
| Daclatasvir | 1 pancreatitis acute, 1 back pain | 2 out of 34 | None reported | 0 out of 8 | |
| Daclatasvir | 1 anaemia, 1 chest pain, 2 syncope, 1 bronchitis, 1 epistaxis | 3 out of 36 | None reported | 0 out of 12 | |
| Danoprevir | 28 unspecified SAEs and 2 deaths | 29 out of 373 | 1 unspecified SAE | 1 out of 44 | |
| Danoprevir | 1 benign paroxysmal vertigo | 1 out of 40 | None reported | 0 out of 8 | |
| Danoprevir | 1 gastroenteritis viral | 1 out of 47 | None reported | 0 out of 12 | |
| Danoprevir | 1 altered mood | 1 out of 25 | None reported | 0 out of 5 | |
| Danoprevir | 14 SAEs but not specified, 1 death | 15 out of 194 | 6 SAEs but not specified | 6 out of 31 | |
| Deleobuvir | 1 drug eruption | 1 out of 46 | None reported | 0 out of 14 | |
| Deleobuvir | 1 syncope, 1 rash maculo‐papular, 1 umbilical hernia | 3 out of 49 | None reported | 0 out of 8 | |
| Faldaprevir | 2 anaemia, 1 angina pectoris, 2 diarrhoea, 1 oesophageal varices haemorrhage, 1 cholecystitis, 2 pneumonia, 1 dehydration, 1 back pain, 1 intervertebral disc protrusion, 1 bipolar disorder, 1 depression, 1 suicidal ideation, 1 dyspnoea, 2 nausea, 3 vomiting, 2 neutropenia, 1 thrombocytopenia, 1 cellulitis, 1 mental status changes, 1 pancytopenia, 1 breast cancer, 1 malaise, 2 rash, 2 sepsis, 1 suicide attempt, 1 renal failure acute, 1 rash maculo‐papular, 1 accidental overdose, 1 muscle spasm, 1 tibia fracture, 1 contusion, 1 pulmonary embolism, 2 abortion spontaneous, 1 hypokalaemia, 1 subcutaneous abscess, 1 acute myocardial infarction, 1 pancreatitis, 1 umbilical hernia, 1 diverticulitis, 1 cerebral ischaemia, 1 drug dependence, 1 personality disorder, 1 epidermolysis, 1 ascites, 1 duodenal ulcer haemorrhage, 1 large intestine perforation, 1 hepatic cirrhosis, 2 hepatic failure, 1 hypersensitivity, 1 infective chondritis, 1 vulval abscess, 1 fibula fracture, 1 jaw fracture, 1 ligament sprain, 1 hypocalcaemia, 1 hyponatraemia, 1 hepatocellular carcinoma, 1 papillary thyroid cancer | 47 out of 525 | 1 anaemia, 2 depression, 1 suicidal ideation, 1 bile duct stone, 1 subcutaneous abscess, 1 optic ischaemic neuropathy, 1 laceration, 1 mental status change | 8 out of 132 | |
| Faldaprevir | 3 anaemia, 1 atrial fibrillation, 1 myocardial infarction, 1 asthenia, 1 chest pain, 1 pyrexia, 1 bronchopneumonia, 1 pneumonia, 1 sciatica, 2 vomiting, 1 thrombocytopenia, 1 pancytopenia, 1 headache, 2 rash, 1 drug eruption, 1 dizziness, 1 haemorrhoids, 1 psychotic disorder, 1 urinary tract infection, 1 diabetes mellitus, 1 parapsoriasis, 1 pancreatitis, 1 histiocytosis haematophagic, 1 cerebrovascular accident, 1 muscular weakness, 1 epistaxis, 1 leukopenia, 1 sarcoidosis, 1 hypotension, 1 idiopathic thrombocytopenic purpura, 1 optic ischaemic neuropathy, 1 hypersensitivity, 1 hypoparathyroidism, 1 retinopathy, 1 subdural hematoma, 1 cervix carcinoma, 1 cubital tunnel syndrome, 1 dyspnoea exertional | 34 out of 520 | 1 anaemia, 1 cholecystitis, 1 gun shot wound, 1 rash maculo‐papular, 1 diverticulitis, 1 inguinal hernia, 1 hepatic lesion, 1 polymyositis, 1 blister | 8 out of 132 | |
| Faldaprevir | 5 anaemia, 1 atrial fibrillation, 1 abdominal pain, 5 diarrhoea, 1 pancreatitis acute, 1 asthenia, 1 chest pain, 8 pyrexia, 2 appendicitis, 1 gastroenteritis viral, 2 pneumonia, 1 decreased appetite, 1 dehydration, 1 back pain, 1 hepatic neoplasm malignant, 2 cholelithiasis, 1 biliary colic, 2 hyperbilirubinaemia, 3 nausea, 2 vomiting, 1 thrombocytopenia, 1 cellulitis, 1 bradycardia, 2 presyncope, 2 malaise, 2 headache, 2 sepsis, 1 rash erythematous, 1 rash generalised, 1 fall, 1 multiple injuries, 1 haematochezia, 1 peritonitis bacterial, 1 congestive cardiac failure, 1 gastroenteritis, 1 hypertensive crisis, 1 hypokalaemia, 1 fatigue, 1 pancreatitis, 1 coma, 1 renal colic, 1 leukopenia, 1 cardio‐respiratory arrest, 1 anxiety, 1 psychiatric decompensation, 2 hypotension, 1 viral infection, 2 ascites, 1 hepatic failure, 1 hypoglycaemia, 1 haemolytic anaemia, 1 keratosis follicular, 1 oral lichen planus, 1 peritoneal haemorrhage, 1 salivary gland calculus, 1 hepatorenal failure, 2 jaundice, 1 streptococcal infection, 1 blood lactate dehydrogenase increased, 1 international normalised ratio abnormal, 1 metabolic acidosis, 1 fasciitis, 1 joint instability, 1 musculoskeletal discomfort, 1 haemothorax, 1 venous thrombosis | 54 out of 599 | 1 depression, 1 pleural effusion | 1 out of 78 | |
| Faldaprevir | 1 abdominal pain upper | 1 out of 35 | 1 abdominal pain | 1 out of 8 | |
| Faldaprevir | 1 asthenia, 1 cataract , 1 hypoalbuminaemia, 1 metabolic disorder, 1 ascites | 4 out of 88 | None reported | 0 out of 8 | |
| Faldeprevir | 4 anaemia, 1 angina pectoris, 1 myocardial infarction, 1 diarrhoea, 1 asthenia, 1 chest pain, 1 oedema peripheral, 4 pyrexia, 1 cholecystitis, 1 pneumonia, 2 dehydration, 1 intervertebral disc protrusion, 2 syncope, 1 depression, 1 nausea, 2 vomiting, 1 thrombocytopenia, 1 upper gastrointestinal haemorrhage, 1 influenza, 1 lower respiratory tract infection, 2 photosensitivity reaction, 1 upper respiratory tract infection, 2 headache, 1 rash, 1 road traffic accident, 2 suicide attempt, 3 drug eruption, 2 rash maculo‐papular, 1 rash erythematous, 2 febrile neutropenia, 1 oral herpes, 1 pulmonary embolism, 1 pyelonephritis, 1 cataract, 1 anaemia haemolytic autoimmune, 1 lymphopenia, 1 microvascular angina, 1 prinzmetal angina, 1 anal fistula, 1 haemorrhoids, 1 mouth ulceration, 1 rectal haemorrhage, 1 chest discomfort, 1 fatigue, 1 mucosal inflammation, 1 gallbladder polyp, 1 cryoglobulinaemia, 1 anal abscess, 1 ear infection, 2 H1N1 influenza, 1 infected skin ulcer, 1 lymphangitis, 1 perirectal abscess, 1 pharyngitis, 1 subcutaneous abscess, 1 superinfection bacterial, 1 urinary tract infection, 1 diabetes mellitus, 1 ischaemic stroke, 1 acute psychosis, 1 depressed mood, 1 calculus ureteric, 1 endometrial hyperplasia, 1 dermatitis atopic, 1 eczema, 1 erythema multiforme, 1 lichen planus, 1 palmar‐plantar erythrodysaesthesia syndrome, 1 parapsoriasis, 1 pruritus allergic, 1 rash pruritic, 1 appendicectomy | 61 out of 641 | 1 headache, 1 photophobia, 1 cyst, 1 benign salivary gland neoplasm, 1 migraine | 2 out of 71 | |
| Filibuvir | 1 blood creatinine increased, 1 chronic obstructive pulmonary disease, 1 pulmonary embolism | 3 out of 27 | 1 thyroiditis, 1 gait disturbance | 2 out of 8 | |
| Filibuvir | 1 anaemia, 1 appendicitis, 1 rectal ulcer haemorrhage, 1 craniocerebral injury, 1 vertigo, 1 vestibular disorder, 1 haematochezia, 1 peritonitis bacterial, 1 lymph node tuberculosis, 1 scapula fracture, 1 blood urea nitrogen/creatinine increased, 1 gastric cancer, 1 rectal cancer, 1 abortion spontaneous, 1 cardiac necrosis, 1 pyoderma gangrenosum, 1 depression, 1 breast cancer, 1 chronic obstructive pulmonary disease, 1 lung neoplasm malignant, 1 fall, 1 loss of consciousness, 1 bacterial abscess CNS, 1 actinomyces test positive, 1 pulmonary calcification | 20 out of 192 | 1 neutropenia, 1 sepsis, 1 pulmonary embolism, 1 cerebral haemorrhage, 1 ecchymosis, 1 Appendicitis perforated | 6 out of 96 | |
| GS‐9451 | 1 death, 1 heroin overdose | 1 out of 33 | None reported | 0 out of 8 | |
| GSK2336805 | 1 pneumonia, 1 upper lobe cavitary lesion | 1 out of 11 | None reported | 0 out of 4 | |
| IDX‐184 | 1 pancreatitis, 1 acute cholecystitis | 2 out of 65 | 1 agitation | 1 out of 16 | |
| Mericitabine/danoprevir | 1 multiple drug overdose, 1 ankle fracture | 2 out of 73 | None reported | 0 out of 14 | |
| Mericitabine | 1 nephrolithiasis, 1 porphyria non‐acute | 2 out of 102 | 1 arthritis infective | 1 out of 49 | |
| Mericitabine | 6 SAEs but not specified | 5 out of 81 | 4 SAEs but not specified | 3 out of 85 | |
| Narlaprevir | 1 pyrexia, 1 elevated CRP | 1 out of 32 | None reported | 0 out of 8 | |
| Odalasvir (ACH‐3102) and sovaprevir | 1 non‐cardiac chest pain | 1 out of 20 | None reported | 0 out of 10 | |
| Paritaprevir (ABT‐450)/r–ombitasvir | 1 pneumonia, 1 nausea, 1 vomiting, 1 bradycardia, 1 chronic obstructive pulmonary disease, 1 renal failure acute, | 9 out of 393 | 1 atrial fibrillation | 1 out of 97 | |
| Paritaprevir/ABT‐072/dasabuvir | 1 haemorrhoids, 1 malignant melanoma | 2 out of 63 | None reported | 0 out of 11 | |
| Paritaprevir/ombitasvir | 1 anaemia, 1 abdominal pain, 1 diarrhoea, 1 cholecystitis, 1 appendicitis, 1 overdose, 1 sinus tachycardia, 1 ventricular extrasystoles, 1 nausea, 1 vomiting, 1 chills, 1 non‐cardiac chest pain, 1 lobar pneumonia, 1 postoperative wound infection, 1 lumbar vertebral fracture, 1 non‐small cell lung cancer, 1 encephalopathy, 1 acute respiratory failure, 1 hypoxia, 1 mediastinal mass, 1 aortic stenosis, 1 biliary colic, 1 subcutaneous abscess | 12 out of 630 | None reported | 0 out of 158 | |
| R1626 | 6 SAEs but not specified | 6 out of 84 | 1 SAE but not specified | 1 out of 20 | |
| Simeprevir | 1 abdominal pain, 1 pyrexia, 1 appendicitis, 2 pneumonia, 1 depression, 1 dyspnoea, 1 cholelithiasis, 1 anaemia haemolytic autoimmune, 1 pancytopenia, 1 angina pectoris, 1 bradycardia, 1 myocardial ischaemia, 1 hepatitis, 1 endocarditis, 1 lower respiratory tract infection, 1 septic shock, 1 breast cancer, 1 Guillain‐Barre syndrome, 1 presyncope, 1 confusional state, 1 vaginal haemorrhage, 1 chronic obstructive pulmonary disease, 1 respiratory acidosis, 1 photosensitivity reaction | 14 out of 260 | 1 atrial fibrillation, 1 depression, 1 bronchitis, 1 hypercalcaemia, 1 head injury, 1 bacterial prostatitis, 1 pericarditis, 1 infection, 1 inguinal hernia, 1 neuropathy peripheral, 1 arthritis infective, 1 headache | 11 out of 133 | |
| Simeprevir | 1 cholecystitis, 1 intervertebral disc protrusion, 1 depression, 1 nausea, 1 breast cancer, 1 hyperthyroidism, 1 ocular vasculitis, 1 abdominal pain upper, 1 colitis, 1 small intestinal obstruction, 1 malaise, 1 incision site cellulitis, 1 necrotising fasciitis, 1 perihepatic abscess, 1 pneumonia pneumococcal, 1 upper respiratory tract infection, 1 post‐procedural bile leak, 1 malnutrition, 1 type 1 diabetes mellitus, 1 spinal disorder, 1 parathyroid tumour benign, 1 headache, 1 haemoptysis, 1 cutaneous vasculitis, 1 hypertension | 20 out of 309 | 1 myocardial infarction, 1 myopericarditis, 1 asthenia, 1 appendicitis, 1 vomiting, 1 chronic obstructive pulmonary disease, 1 headache, 1 subcutaneous abscess, 1 vulval abscess, 1 myositis, 1 ovarian neoplasm | 10 out of 77 | |
| Simeprevir | 1 subarachnoid haemorrhage, 1 malaise, 1 cerebral infarction, 1 vulvar erosion, 1 rash, 1 incorrect dose administered | 5 out of 79 | None reported | 0 out of 13 | |
| Simeprevir | 1 depression, 1 non‐cardiac chest pain, 1 angina unstable, 1 nephrolithiasis, 1 ureteric stenosis, 1 colitis ischaemic, 1 incision site infection, 1 craniocerebral injury, 1 foot fracture, 1 meniscus lesion, 1 multiple injuries, 1 rib fracture, 1 tibia fracture, 1 traumatic lung injury, 1 wound, 1 cholesterosis, 1 type 2 diabetes mellitus, 1 shock haemorrhagic | 10 out of 305 | 1 anaemia, 1 decreased appetite, 1 cholelithiasis, 1 contusion, 1 supraventricular tachycardia, 1 ligament sprain, 1 pain, 1 atypical pneumonia, 1 chronic hepatitis C, 1 pulmonary tuberculosis, 1 undifferentiated connective tissue disease, 1 brain neoplasm | 9 out of 152 | |
| Simeprevir | 1 sinus arrest, 1 erysipelas, 1 type 1 diabetes mellitus, 1 psychotic disorder, 1 drug abuse, 1 bronchitis, 1 exostosis, 1 toe deformity, 1 hyperthyroidism, 1 Bowen's disease, 1 neutropenia, 1 thrombocytopenia, 1 breast cancer, 1 sepsis, 1 cupulolithiasis, 1 pneumonia escherichia, 1 panic reaction | 13 out of 88 | 1 pneumonia, 1 sinusitis, 1 panic attack, 1 social stay hospitalisation, 1 pneumonia escherichia | 3 out of 28 | |
| Simeprevir | 2 anaemia, 1 back pain, 1 syncope, 1 hyperthyroidism, 1 death, 1 muscle spasms, 1 colon cancer, 1 anal abscess, 1 urinary tract infection, 1 mixed deafness, 1 hyphaema, 1 visual impairment, 1 enterocutaneous fistula, 1 autoimmune hepatitis, 1 lymphadenitis bacteria, 1 fluid overload, 1 epilepsy, 1 memory impairment, 1 aggression | 16 out of 257 | 1 anaemia, 1 pancreatitis acute, 1 dehydration, 1 vomiting, 1 pancytopenia, 1 loss of consciousness, 1 angina unstable, 1 meniscus lesion, 1 pulmonary embolism, 1 cholecystitis acute, 1 drug abuse, 1 retinal ischaemia, 1 respiratory tract infection viral, 1 viral infection, 1 neuropathy peripheral, 1 thoracic outlet syndrome | 10 out of 134 | |
| Simeprevir | None reported | 0 out of 58 | 1 liver decompensation | 1 out of 24 | |
| Simeprevir | 1 anaemia, 1 abdominal pain, 1 diarrhoea, 1 oedema peripheral, 2 cholecystitis, 1 pneumonia, 1 overdose, 2 | 31 out of 396 | 1 sciatica, 1 nausea, 1 vomiting, 1 lower respiratory tract infection, 1 haemorrhoids, 1 weight decreased, 1 histiocytosis haematophagic, 1 tuberculosis | 4 out of 66 | |
| Sofosbuvir | 1 drug withdrawal syndrome, 1 non‐cardiac chest pain, 1 oedema peripheral, 1 pyrexia, 1 hypersensitivity, 1 abdominal abscess, 1 cellulitis, 2 overdose, 1 injury, 1 road traffic accident, 1 spinal compression fracture, 1 hypoglycaemia, 1 hepatic neoplasm malignant, 1 abnormal behaviour, 1 eczema | 11 out of 207 | 1 pancreatitis, 1 bile duct stone, 1 bronchitis | 2 out of 71 | |
| Sofosbuvir | 1 retinal vein occlusion, 1 depression, 1 suicidal ideation, 1 lymphangitis, 1 acute myocardial infarction | 4 out of 95 | 1 chest pain, 1 electrocardiogram ST segment elevation | 1 out of 26 | |
| Sofosbuvir | 1 anaemia, 1 chest pain, 1 cellulitis, 1 chronic obstructive pulmonary disease, 1 urinary tract infection, 1 allergy to anthropod sting, 1 osteomyelitis chronic , 1 toxicity to various agents | 7 out of 256 | 1 pneumothorax, 1 breast cancer, 1 infection, 1 atrioventricular shock, 1 clavicle fracture, 1 rib fracture | 3 out of 243 | |
| Sofosbuvir | 1 anaemia, 1 depression, 1 peripheral ischaemia, 1 pancreatitis acute | 4 out of 49 | 1 abdominal pain | 1 out of 14 | |
| Sofosbuvir/velpatasvir | 1 bronchitis, 1 cellulitis, 1 influenza, 1 chronic obstructive pulmonary disease, 1 death, 1 gastroenteritis, 1 acute myocardial infarct, 1 ligament sprain, 1 foot abscess, 1 foot necrosis, 1 recurring appendicitis, 1 epileptic seizure, 1 rotator cuff syndrome, 1 lung cancer, 1 mania, 1 palpitations, 1 small bowel obstruction, 1 upper limb fracture, 1 vestibular neuronitis | 15 out of 624 | None reported | 0 out of 116 | |
| Telaprevir | 1 cholelithiasis | 1 out of 16 | None reported | 0 out of 8 | |
| Telaprevir | 5 anaemia, 2 abdominal pain, 1 asthenia, 1 pyrexia, 1 back pain, 3 syncope, 3 depression, 2 dyspnoea, 1 nausea, 1 chills, 1 pancytopenia, 5 rash, 1 lymphadenopathy, 1 hydrocele, 1 retinal haemorrhage, 1 catheter‐related complication, 1 bacterial sepsis, 1 pneumonia, 1 herpes viral, 1 sepsis, 1 road traffic accident, 1 tendon rupture, 1 lung neoplasm malignant, 1 speech disorder, 1 disorientation, 1 emotional distress, 1 suicide attempt, 1 renal failure, 1 acute testicular swelling, 3 pruritis, 2 drug eruption, 2 rash maculo‐papular, 1 rash erythematous, 1 rash generalised, 1 toxic skin eruption, 1 urticaria, 1 splenectomy | 36 out of 241 | 2 anaemia, 1 angina pectoris, 1 syncope, 1 hyperthyroidism, 1 gastroenteritis, 1 haemorrhagic anaemia, 1 alcoholic pancreatitis, 1 paranoia, 1 uterine polyp | 8 out of 82 | |
| Telaprevir | 18 anaemia, 3 pneumonia, 3 syncope, 2 cellulitis, 5 rash, 3 psychiatric disorder, 2 musculoskeletal disorder, 2 cardiac disorder, 2 eye disorder, 3 hepatobiliary disorders, 2 vascular disorder | 64 out of 727 | 4 anaemia, 1 cellulitis, 3 psychiatric disorder, 3 musculoskeletal disorder, 2 cardiac disorder, 4 renal and urinary disorder, 1 eye disorder, 1 vascular disorder | 24 out of 361 | |
| Telaprevir | 2 anaemia, 1 gastroenteritis viral, 1 dehydration, 2 depression, 1 non‐cardiac chest pain, 1 chronic obstructive pulmonary disease, 1 rash, 1 rash generalised, 1 furuncle, 1 colitis ischaemic, 1 acute myocardial infarction, 1 adrenal disorder, 2 scotoma, 1 retinal exudates, 1 retinal infarction, 1 bronchitis bacterial, 1 incisional hernia, 1 lumbar radiculopathy, 1 exfoliative rash | 18 out of 175 | 1 lobar pneumonia, 1 pancytopenia, 1 anxiety, 1 lymphadenitis bacteria, 1 deafness neurosensory | 4 out of 75 | |
| Telaprevir | 6 anaemia, 1 pancreatitis acute, 1 gastroenteritis viral, 1 pneumonia, 1 dehydration, 1 back pain, 1 suicidal ideation, 2 cholelithiasis, 1 postoperative wound infection, 1 upper gastrointestinal haemorrhage, 1 confusional state, 2 small intestinal obstruction, 1 necrotising fasciitis, 1 pneumonia pneumococcal, 1 post‐procedural bile leak, 1 rash, 1 renal failure acute, 1 retinal detachment, 9 gastroenteritis, 1 cholecystitis acute, 1 sinusitis, 1 hypokalaemia, 1 eczema, 2 pancreatitis, 1 dermatitis, 1 diverticulitis, 1 alcohol abuse, 1 hypotension, 1 haemorrhagic anaemia, 1 idiopathic thrombocytopenic purpura, 1 cardiomyopathy, 1 diverticular perforation, 1 gastritis erosive, 1 abscess intestinal, 1 cholecystitis infective, 1 infected insect bite, 1 sepsis syndrome, 1 hypovolaemia, 1 B‐cell unclassifiable lymphoma low grade, 1 migraine with aura, 1 ruptured cerebral aneurysm, 1 neurogenic bladder, 1 lichenoid keratosis, 1 rash macular | 28 out of 339 | 1 anaemia, 1 pneumonia, 2 dehydration, 1 syncope, 1 depression, 1 non‐small cell lung cancer, 1 headache, 2 rash, 1 renal failure acute, 2 gastroenteritis, 1 renal tubular acidosis, 1 decubitus ulcer, 1 hematoma | 9 out of 114 | |
| Telaprevir | 1 myocardial infarction, 1 staphylococcal infection, 1 pyelonephritis acute, 1 haemolytic anaemia, 1 groin infection, 1 cellulitis staphylococcal, 1 staphylococcal abscess, 1 hypokalaemia, 1 hyponatraemia, 1 epididymitis, 1 non‐ cardiac chest pain | 7 out of 38 | 1 anaemia, 1 appendicitis, 1 peritonitis | 2 out of 22 | |
| Telaprevir | 13 anaemia, 1 febrile neutropenia, 2 pancytopenia, 1 thrombocytopenia , 3 acute myocardial infarction, 2 atrial fibrillation, 1 cardiac valve disease, 1 myocardial infarction, 1 supraventricular tachycardia, 1 sudden hearing loss, 1 Basedow's disease, 1 retinal detachment, 1 abdominal pain, 1 anal fissure, 1 caecitis, 1 gastrointestinal haemorrhage, 1 pancreatitis, 2 pancreatitis acute, 1 general physical health deterioration, 1 pyrexia, 1 appendicitis, 2 bronchitis, 1 erysipelas, 1 folliculitis, 1 Helicobacter gastritis, 1 pneumonia, 1 post‐procedural infection, 1 rectal abscess, 2 sepsis, 1 sinusitis, 1 tooth abscess, 2 urinary tract infection, 1 injection site reaction, 1 animal scratch, 1 ankle fracture, 1 femoral neck fracture, 1 multiple drug overdose, 1 blood corticotrophin decreased, 1 weight decreased, 1 anorexia, 1 diabetes mellitus, 1 bronchial carcinoma, 2 gastric cancer, 2 hepatic neoplasm malignant, 1 histiocytosis haematophagic, 1 lung neoplasm malignant, 1 lethargy, 1 subarachnoid haemorrhage, 2 syncope, 1 delirium, 1 depression, 1 insomnia, 1 substance abuse, 1 renal cyst, 1 renal failure, 1 urinary bladder polyp, 1 prostatitis, 1 pulmonary embolism, 1 dermatitis, 1 eczema , 1 erythema multiforme, 1 pruritus 1 pustular psoriasis, 1 rash, 2 toxic skin eruption, 1 orthostatic hypotension, 1 peripheral artery aneurysm | 65 out of 530 | 1 anaemia, 1 atrial fibrillation, 1 abdominal pain, 1 pneumonia, 1 colitis, 1 pyelonephritis, 1 cerebral thrombosis, 1 coma | 7 out of 132 | |
| Vaniprevir | 1 appendicitis, 1 lobar pneumonia, 1 septic shock, 1 confusional state, 1 gastroenteritis, 1 cholecystitis acute, 1 empyema, 1 haemoglobin decreased, 1 myopathy | 8 out of 75 | 1 colon cancer | 1 out of 19 | |
| Vaniprevir | 1 anaemia, 1 pneumonia, 1 syncope, 1 upper gastrointestinal haemorrhage, 1 cellulitis, 1 confusional state, 1 dizziness, 1 nephrolithiasis, 1 malignant melanoma, 3 retinal detachment, 1 joint dislocation, 1 congestive cardiac failure, 2 gastroenteritis, 1 femur fracture, 1 hyperglycaemia, 1 dermatomyositis, 1 retinal vascular thrombosis, 1 general physical health deterioration, 1 anaphylactic reaction, 1 pyelonephritis, 1 pyelonephritis acute, 1 carbon monoxide poisoning, 1 arthralgia, 1 arthritis infective, 1 completed suicide | 22 out of 229 | 1 hypertensive crisis | 1 out of 56 | |
| SAE: serious adverse events. | |||||
| Trial | Experimental intervention | Type and number of participants with a non‐serious adverse events (experimental group) | Proportion of participants with a non‐serious adverse event (experimental group) | Type and number of participants with a non‐serious adverse events (control group) | Proportion of participants with a non‐serious adverse event (control group) |
| Asunaprevir | 18 diarrhoea, 13 nausea, 10 asthenia, 21 fatigue, 14 influenza‐like illness, 7 irritability, 12 decreased appetite, 4 arthralgia, 9 myalgia, 13 headache, 9 depression, 10 insomnia, 7 cough, 10 dyspnoea, 7 alopecia, 11 dry skin, 10 pruritus, 6 rash | 36 out of 36 | 1 diarrhoea, 2 nausea, 4 asthenia, 5 fatigue, 5 influenza‐like illness, 4 irritability, 3 decreased appetite, 4 arthralgia, 1 myalgia, 6 headache, 1 depression, 1 insomnia, 3 cough, 3 dyspnoea, 3 alopecia, 1 dry skin, 2 pruritus, 3 rash | 11 out of 11 | |
| Asunaprevir | 8 anaemia, 63 asthenia, 62 fatigue, 37 influenza‐like illness, 43 decreased appetite, 66 headache, 41 pruritus | 173 out of 177 | 3 anaemia, 1 asthenia, 62 fatigue, 23 influenza‐like illness, 22 decreased appetite, 26 headache, 16 pruritus | 57 out of 61 | |
| Asunaprevir | 1 nausea, 3 headache, 1 flatulence | Not specified out of 20 | None reported | Not specified out of 4 | |
| Asunaprevir | 1 nausea, 3 headache | Not specified out of 12 | 1 nausea, 1 flatulence | Not specified out of 3 | |
| Balapiravir | 120 anaemia, 41 neutropenia, 115 diarrhoea, 162 nausea, 138 chills, 231 fatigue, 117 pyrexia, 100 arthralgia, 156 myalgia, 82 dizziness, 241 headache, 90 depression, 174 insomnia, 86 cough, 88 alopecia, 60 dry skin, 108 pruritus, 90 rash | Not specified out of 432 | 6 anaemia, 3 neutropenia, 16 diarrhoea, 25 nausea, 30 chills, 43 fatigue, 19 pyrexia, 16 arthralgia, 33 myalgia, 15 dizziness, 42 headache, 17 depression, 24 insomnia, 11 cough, 11 alopecia, 16 dry skin, 15 pruritus, 13 rash | Not specified out of 72 | |
| Beclabuvir | 5 anaemia, 5 neutropenia, 5 diarrhoea, 9 nausea, 3 chills, 12 fatigue, 6 influenza‐like illness, 7 irritability, 3 pyrexia, 7 decreased appetite, 4 arthralgia, 5 myalgia, 12 headache, 6 depression, 9 insomnia, 6 cough, 5 pruritus, 2 rash | Not specified out of 26 | 5 anaemia, 1 neutropenia, 1 diarrhoea, 2 nausea, 5 fatigue, 7 influenza‐like illness, 3 irritability, 1 pyrexia, 2 decreased appetite, 3 headache, 3 depression, 3 insomnia, 3 cough, 4 pruritus, 4 rash | Not specified out of 13 | |
| BILB‐1941 | 25 diarrhoea, 7 nausea, 2 vomiting | 30 out of 77 | 2 diarrhoea | 3 out of 19 | |
| BMS‐791325 | 1 diarrhoea, 1 nausea, 1 vomiting, 1 headache, 1 pruritus | 9 out of 20 | 1 nausea, 1 vomiting, 1 headache | 1 out of 4 | |
| Boceprevir | 145 anaemia, 46 neutropenia, 78 diarrhoea, 140 nausea, 47 vomiting, 68 asthenia, 106 chills, 179 fatigue, 79 influenza‐like illness, 67 irritability, 93 pyrexia, 83 decreased appetite, 73 arthralgia, 81 myalgia, 52 dizziness, 142 dysgeusia, 133 headache, 46 depression, 97 insomnia, 70 cough, 69 dyspnoea, 71 alopecia, 72 dry skin, 62 pruritus, 51 rash | 319 out of 323 | 16 anaemia, 8 neutropenia, 13 diarrhoea, 30 nausea, 6 vomiting, 13 asthenia, 24 chills, 40 fatigue, 20 influenza‐like illness, 10 irritability, 20 pyrexia, 13 decreased appetite, 13 arthralgia, 19 myalgia, 8 dizziness, 9 dysgeusia, 39 headache, 12 depression, 19 insomnia, 14 cough, 14 dyspnoea, 13 alopecia, 7 dry skin, 14 pruritus, 5 rash | 77 out of 80 | |
| Boceprevir | 67 anaemia, 41 neutropenia, 33 diarrhoea, 52 nausea, 16 vomiting, 29 asthenia, 14 chills, 67 fatigue, 35 influenza‐like illness, 29 irritability, 18 pyrexia, 27 decreased appetite, 16 arthralgia, 25 myalgia, 17 dizziness, 52 dysgeusia, 37 headache, 22 depression, 32 insomnia, 26 cough, 26 dyspnoea, 22 alopecia, 20 dry skin, 18 pruritus, 31 rash | 133 out of 134 | 22 anaemia, 12 neutropenia, 5 diarrhoea, 18 nausea, 12 asthenia, 8 chills, 36 fatigue, 18 influenza‐like illness, 16 irritability, 8 pyrexia, 12 decreased appetite, 12 arthralgia, 5 myalgia, 10 dizziness, 10 dysgeusia, 21 headache, 6 depression, 20 insomnia, 14 cough, 17 dyspnoea, 5 alopecia, 11 dry skin, 8 pruritus, 5 rash | 67 out of 67 | |
| Boceprevir | 105 anaemia, 103 leukopenia, 141 neutropenia, 16 thrombocytopenia, 22 diarrhoea, 13 dry mouth, 59 nausea, 12 vomiting, 63 asthenia, 24 chills, 40 fatigue, 51 hyperthermia, 356 influenza‐like illness, 9 injection site erythema, 18 irritability, 217 pyrexia, 14 body temperature increased, 33 weight decreased, 10 decreased appetite, 16 arthralgia, 33 myalgia, 9 dizziness, 69 dysgeusia, 89 headache, 2 sleep disorder, 38 cough, 7 dyspnoea, 33 alopecia, 12 dry skin, 20 pruritus, 17 rash | 153 out of 159 | 31 anaemia, 35 leukopenia, 45 neutropenia, 7 thrombocytopenia, 3 diarrhoea, 5 dry mouth, 15 nausea, 2 vomiting, 23 asthenia, 2 chills, 18 fatigue, 12 hyperthermia, 72 influenza‐like illness, 2 injection site erythema, 11 irritability, 124 pyrexia, 2 body temperature increased, 9 weight decreased, 7 decreased appetite, 4 arthralgia, 8 myalgia, 7 dizziness, 5 dysgeusia, 51 headache, 4 sleep disorder, 14 cough, 7 dyspnoea, 16 alopecia, 3 dry skin, 6 pruritus, 2 rash | 71 out of 78 | |
| Boceprevir | 226 anaemia, 96 neutropenia, 109 diarrhoea, 186 nausea, 81 vomiting, 53 asthenia, 130 chills, 259 fatigue, 79 influenza‐like illness, 91 irritability, 129 pyrexia, 49 decreased appetite, 76 arthralgia, 99 myalgia, 70 dizziness, 111 dysgeusia, 190 headache, 91 depression, 146 insomnia, 76 cough, 66 dyspnoea, 131 alopecia, 60 dry skin, 80 pruritus, 27 rash | 413 out of 416 | 35 anaemia, 12 neutropenia, 23 diarrhoea, 45 nausea, 5 vomiting, 14 asthenia, 35 chills, 57 fatigue, 25 influenza‐like illness, 23 irritability, 35 pyrexia, 12 decreased appetite, 21 arthralgia, 17 myalgia, 16 dizziness, 9 dysgeusia, 45 headache, 22 depression, 40 insomnia, 20 cough, 15 dyspnoea, 27 alopecia, 17 dry skin, 16 pruritus, 6 rash | 102 out of 104 | |
| Boceprevir | 361 anaemia, 184 neutropenia, 180 diarrhoea, 334 nausea, 145 vomiting, 125 asthenia, 255 chills, 405 fatigue, 174 influenza‐like illness, 164 irritability, 240 pyrexia, 186 decreased appetite, 141 arthralgia, 170 myalgia, 146 dizziness, 293 dysgeusia, 335 headache, 151 depression, 239 insomnia, 130 cough, 152 dyspnoea, 179 alopecia, 153 dry skin, 181 pruritus, 181 rash | 728 out of 734 | 107 anaemia, 77 neutropenia, 79 diarrhoea, 153 nausea, 57 vomiting, 70 asthenia, 102 chills, 217 fatigue, 93 influenza‐like illness, 86 irritability, 120 pyrexia, 90 decreased appetite, 66 arthralgia, 94 myalgia, 59 dizziness, 64 dysgeusia, 153 headache, 78 depression, 118 insomnia, 76 cough, 59 dyspnoea, 99 alopecia, 66 dry skin, 98 pruritus, 83 rash | 353 out of 363 | |
| Boceprevir | 26 anaemia, 12 neutropenia, 21 diarrhoea, 26 nausea, 18 vomiting, 22 asthenia, 5 chills, 25 fatigue, 16 influenza‐like illness, 10 irritability, 24 pyrexia, 22 decreased appetite, 7 arthralgia, 9 myalgia, 8 dizziness, 18 dysgeusia, 18 headache, 11 depression, 15 insomnia, 9 cough, 5 dyspnoea, 12 alopecia, 8 dry skin, 13 pruritus, 5 rash | 62 out of 64 | 8 anaemia, 2 neutropenia, 6 diarrhoea, 11 nausea, 5 vomiting, 9 asthenia, 5 chills, 12 fatigue, 13 influenza‐like illness, 5 irritability, 7 pyrexia, 6 decreased appetite, 2 arthralgia, 6 myalgia, 2 dizziness, 5 dysgeusia, 6 headache, 4 depression, 9 insomnia, 6 cough, 2 dyspnoea, 6 alopecia, 3 dry skin, 3 pruritus | 33 out of 34 | |
| Daclatasvir | 7 anaemia, 9 neutropenia, 10 diarrhoea, 22 nausea, 4 vomiting, 13 asthenia, 4 chills, 35 fatigue, 19 influenza‐like illness, 17 irritability, 7 pyrexia, 12 decreased appetite, 11 arthralgia, 14 myalgia, 6 dizziness, 5 dysgeusia, 30 headache, 11 depression, 19 insomnia, 8 cough, 12 dyspnoea, 12 alopecia, 13 dry skin, 27 pruritus, 25 rash | 98 out of 100 | 5 anaemia, 8 neutropenia, 3 diarrhoea, 8 nausea, 4 vomiting, 7 asthenia, 19 fatigue, 7 influenza‐like illness, 6 irritability, 2 pyrexia, 8 decreased appetite, 9 arthralgia, 11 myalgia, 6 dizziness, 3 dysgeusia, 9 headache, 9 depression, 17 insomnia, 8 cough, 6 dyspnoea, 5 alopecia, 6 dry skin, 14 pruritus, 12 rash | 48 out of 51 | |
| Daclatasvir | 53 anaemia, 43 neutropenia, 73 diarrhoea, 109 nausea, 34 vomiting, 32 asthenia, 49 chills, 174 fatigue, 94 influenza‐like illness, 72 irritability, 48 pyrexia, 67 decreased appetite, 55 arthralgia, 88 myalgia, 46 dizziness, 25 dysgeusia, 136 headache, 45 depression, 102 insomnia, 54 cough, 58 dyspnoea, 80 alopecia, 88 dry skin, 119 pruritus, 94 rash | 311 out of 317 | 9 anaemia, 9 neutropenia, 14 diarrhoea, 20 nausea, 11 vomiting, 7 asthenia, 16 chills, 46 fatigue, 16 influenza‐like illness, 22 irritability, 15 pyrexia, 17 decreased appetite, 19 arthralgia, 24 myalgia, 9 dizziness, 4 dysgeusia, 36 headache, 10 depression, 30 insomnia, 18 cough, 11 dyspnoea, 13 alopecia, 15 dry skin, 26 pruritus, 25 rash | 76 out of 78 | |
| Daclatasvir | 11 anaemia, 7 neutropenia, 2 diarrhoea, 4 nausea, 6 fatigue, 1 irritability, 11 pyrexia, 7 decreased appetite, 4 arthralgia, 1 myalgia, 1 dizziness, 4 dysgeusia, 3 headache, 7 insomnia, 4 cough, 2 dyspnoea, 8 alopecia, 1 dry skin, 6 pruritus, 7 rash | 34 out of 34 | 5 anaemia, 4 neutropenia, 3 diarrhoea, 2 nausea, 3 vomiting, 4 chills, 4 fatigue, 2 influenza‐like illness, 5 pyrexia, 5 decreased appetite, 2 arthralgia, 2 myalgia, 1 dizziness, 1 dysgeusia, 4 headache, 2 insomnia, 1 cough, 6 alopecia, 1 dry skin, 3 pruritus, 3 rash | 8 out of 8 | |
| Daclatasvir | 14 anaemia, 9 neutropenia, 5 diarrhoea, 13 nausea, 7 vomiting, 9 asthenia, 4 chills, 19 fatigue, 11 influenza‐like illness, 12 irritability, 7 pyrexia, 9 decreased appetite, 2 arthralgia, 8 myalgia, 5 dizziness, 2 dysgeusia, 19 headache, 7 depression, 9 insomnia, 9 cough, 6 dyspnoea, 8 alopecia, 2 dry skin, 12 pruritus, 10 rash | 36 out of 36 | 5 anaemia, 5 neutropenia, 3 diarrhoea, 6 nausea, 1 asthenia, 2 chills, 9 fatigue, 4 influenza‐like illness, 2 irritability, 3 pyrexia, 3 decreased appetite, 3 myalgia, 1 dizziness, 1 dysgeusia, 3 headache, 3 depression, 6 insomnia, 3 cough, 2 dyspnoea, 2 alopecia, 1 dry skin, 3 pruritus, 3 rash | 12 out of 12 | |
| Daclatasvir | 1 diarrhoea, 1 nausea, 4 headache | 7 out of 16 | None reported | 0 out of 2 | |
| Daclatasvir | 2 diarrhoea, 3 fatigue, 1 arthralgia, 1 dizziness, 5 headache, 2 insomnia, 1 dry skin | 16 out of 24 | 1 nausea, 1 vomiting, 2 headache | 4 out of 6 | |
| Danoprevir | 115 diarrhoea, 106 nausea, 77 asthenia, 89 chills, 158 fatigue, 125 pyrexia, 88 decreased appetite, 72 arthralgia, 93 myalgia,158 headache, 102 insomnia, 62 cough, 54 alopecia, 83 pruritus, 78 rash | 364 out of 373 | 5 diarrhoea, 13 nausea, 9 asthenia, 8 chills, 17 fatigue, 15 pyrexia, 6 decreased appetite, 9 arthralgia, 13 myalgia, 24 headache, 16 insomnia, 12 cough, 4 alopecia, 14 pruritus, 6 rash | 42 out of 44 | |
| Danoprevir | 2 diarrhoea, 3 myalgia, 5 headache | 21 out of 40 | 1 diarrhoea, 2 headache | 3 out of 10 | |
| Danoprevir | 6 neutropenia, 5 diarrhoea, 4 nausea, 3 asthenia, 5 chills, 8 fatigue, 4 influenza‐like illness, 2 pyrexia, 2 arthralgia, 17 myalgia, 6 dizziness, 23 headache, 2 depression, 6 insomnia, 3 pruritus | 42 out of 47 | 2 neutropenia, 2 diarrhoea, 1 nausea, 1 chills, 3 fatigue, 1 influenza‐like illness, 1 arthralgia, 5 myalgia, 1 dizziness, 4 headache, 1 depression, 2 insomnia | 12 out of 12 | |
| Danoprevir | 4 diarrhoea, 5 nausea, 5 fatigue, 3 influenza‐like illness, 5 irritability, 5 arthralgia, 5 myalgia, 11 headache, 4 insomnia, 6 rash | 24 out of 25 | 1 diarrhoea, 3 nausea, 1 fatigue, 2 myalgia, 4 headache, 2 insomnia | 5 out of 5 | |
| Danoprevir | 53 anaemia, 70 neutropenia, 56 diarrhoea, 85 nausea, 29 vomiting, 57 chills, 109 fatigue, 38 irritability, 51 pyrexia, 34 decreased appetite, 29 arthralgia, 60 myalgia, 92 headache, 42 depression, 69 insomnia, 31 alopecia, 46 pruritus, 42 rash | Not specified out of 194 | 13 anaemia, 11 neutropenia, 7 diarrhoea, 10 nausea, 4 vomiting, 13 chills, 14 fatigue, 7 irritability, 5 pyrexia, 4 decreased appetite, 9 arthralgia, 11 myalgia, 18 headache, 4 depression, 9 insomnia, 5 alopecia, 6 pruritus, 8 rash | Not specified out of 31 | |
| Deleobuvir | 1 anaemia, 19 diarrhoea, 19 nausea, 11 vomiting, 16 asthenia, 3 chills, 12 fatigue, 14 influenza‐like illness, 7 irritability, 6 pyrexia, 14 decreased appetite, 4 arthralgia, 4 myalgia, 6 dizziness, 4 dysgeusia, 20 headache, 15 insomnia, 6 cough, 3 dyspnoea, 1 alopecia, 6 dry skin, 5 pruritus, 8 rash | 49 out of 49 | 1 nausea, 1 asthenia, 1 chills, 2 fatigue, 1 influenza‐like illness, 2 irritability, 1 decreased appetite, 2 headache, 1 dry skin, 1 pruritus, 2 rash | 7 out of 8 | |
| Faldaprevir | 114 anaemia, 59 neutropenia, 160 diarrhoea, 249 nausea, 110 vomiting, 29 asthenia, 78 chills, 246 fatigue, 39 influenza‐like illness, 67 irritability, 79 pyrexia, 117 decreased appetite, 72 arthralgia, 100 myalgia, 80 dizziness, 31 dysgeusia, 165 headache, 68 depression, 137 insomnia, 89 cough, 53 dyspnoea, 96 alopecia, 67 dry skin, 164 pruritus, 298 rash | 513 out of 525 | 27 anaemia, 14 neutropenia, 23 diarrhoea, 52 nausea, 11 vomiting, 6 asthenia, 25 chills, 70 fatigue, 15 influenza‐like illness, 27 irritability, 20 pyrexia, 26 decreased appetite, 22 arthralgia, 37 myalgia, 25 dizziness, 3 dysgeusia, 45 headache, 11 depression, 38 insomnia, 21 cough, 20 dyspnoea, 22 alopecia, 15 dry skin, 37 pruritus, 41 rash | 130 out of 132 | |
| Faldaprevir | 89 anaemia, 57 neutropenia, 121 diarrhoea, 168 nausea, 79 vomiting, 96 asthenia, 143 fatigue, 92 influenza‐like illness, 37 irritability, 110 pyrexia, 87 decreased appetite, 39 arthralgia, 41 myalgia, 38 dizziness, 23 dysgeusia, 146 headache, 32 depression, 70 insomnia, 58 cough, 36 dyspnoea, 49 alopecia, 80 dry skin, 160 pruritus, 139 rash | 496 out of 520 | 26 anaemia, 18 neutropenia, 17 diarrhoea, 19 nausea, 6 vomiting, 27 asthenia, 35 fatigue, 21 influenza‐like illness, 9 irritability, 32 pyrexia, 22 decreased appetite, 14 arthralgia, 20 myalgia, 13 dizziness, 5 dysgeusia, 40 headache, 8 depression, 22 insomnia, 20 cough, 16 dyspnoea, 15 alopecia, 17 dry skin, 41 pruritus, 25 rash | 120 out of 132 | |
| Faldaprevir | 98 anaemia, 65 neutropenia, 190 diarrhoea, 318 nausea, 171 vomiting, 108 asthenia, 32 chills, 204 fatigue, 107 influenza‐like illness, 49 irritability, 113 pyrexia, 128 decreased appetite, 60 arthralgia, 72 myalgia, 37 dizziness, 39 dysgeusia, 182 headache, 52 depression, 118 insomnia, 99 cough, 47 dyspnoea, 53 alopecia, 108 dry skin, 225 pruritus, 160 rash | 585 out of 599 | 8 anaemia, 12 neutropenia, 10 diarrhoea, 18 nausea, 5 vomiting, 21 asthenia, 5 chills, 16 fatigue, 15 influenza‐like illness, 11 irritability, 14 pyrexia, 10 decreased appetite, 7 arthralgia, 8 myalgia, 6 dizziness, 4 dysgeusia, 22 headache, 10 depression, 13 insomnia, 16 cough, 7 dyspnoea, 4 alopecia, 12 dry skin, 23 pruritus, 16 rash | 74 out of 78 | |
| Faldaprevir | 2 anaemia, 1 neutropenia, 4 diarrhoea, 7 nausea, 10 asthenia, 2 chills, 2 fatigue, 4 influenza‐like illness, 4 irritability, 2 pyrexia, 1 decreased appetite, 7 myalgia, 1 dizziness, 6 headache, 2 depression, 5 insomnia, 2 cough, 1 alopecia, 5 dry skin, 3 pruritis, 1 rash | 32 out of 26 | 1 diarrhoea, 2 nausea, 2 asthenia, 2 headache, 1 depression, 1 insomnia, 1 cough | 5 out of 8 | |
| Faldaprevir | 1 neutropenia, 3 diarrhoea, 3 nausea, 3 vomiting, 2 influenza‐like illness, 8 pyrexia, 2 decreased appetite, 2 arthralgia, 4 dizziness, 1 dysgeusia, 7 headache, 1 depression, 5 insomnia, 1 cough, 3 alopecia, 1 dry skin, 6 pruritus, 6 rash | 33 out of 35 | 2 nausea, 2 vomiting, 1 influenza‐like illness, 1 pyrexia, 1 decreased appetite, 1 headache, 1 insomnia, 1 dyspnoea, 2 dry skin, 3 pruritus, 1 rash | 6 out of 8 | |
| Faldeprevir | 85 anaemia, 49 neutropenia, 188 diarrhoea, 239 nausea, 105 vomiting, 122 asthenia, 54 chills, 194 fatigue, 217 influenza‐like illness, 82 irritability, 86 pyrexia, 133 decreased appetite, 72 arthralgia, 133 myalgia, 48 dizziness, 25 dysgeusia, 243 headache, 68 depression, 107 insomnia, 100 cough, 73 dyspnoea, 106 alopecia, 122 dry skin, 227 pruritus, 163 rash | 620 out of 641 | 12 anaemia, 8 neutropenia, 13 diarrhoea, 14 nausea, 4 vomiting, 15 asthenia, 8 chills, 24 fatigue, 34 influenza‐like illness, 10 irritability, 11 pyrexia, 11 decreased appetite, 5 arthralgia, 12 myalgia, 5 dizziness, 27 headache, 7 depression, 17 insomnia, 9 cough, 11 dyspnoea, 8 alopecia, 10 dry skin, 12 pruritus, 12 rash | 65 out of 71 | |
| Filibuvir | 13 anaemia,4 neutropenia ,6 diarrhoea, 13 nausea, 3 vomiting, 4 chills, 13 fatigue, 3 influenza‐like illness, 2 irritability, 2 pyrexia, 3 decreased appetite, 2 arthralgia, 4 myalgia, 4 dizziness, 14 headache, 5 depression, 11 insomnia, 5 cough, 2 dyspnoea, 2 alopecia, 3 dry skin, 2 pruritus, 3 rash | 27 out of 27 | 3 anaemia, 3 diarrhoea, 4 nausea, 1 vomiting, 1 chills, 5 fatigue, 2 influenza‐like illness, 2 decreased appetite, 2 arthralgia, 2 headache, 3 depression, 2 insomnia, 2 cough, 2 dyspnoea, 1 alopecia, 2 dry skin, 3 pruritus, 1 rash | 8 out of 8 | |
| Filibuvir | 26 anaemia, 26 neutropenia, 24 diarrhoea, 55 nausea, 20 vomiting, 35 asthenia, 25 chills, 73 fatigue, 29 influenza‐like illness, 33 irritability, 28 pyrexia, 36 decreased appetite, 30 arthralgia, 37 myalgia, 20 dizziness, 40 dysgeusia, 61 headache, 32 depression, 55 insomnia, 33 cough, 18 dyspnoea, 34 alopecia, 33 dry skin, 56 pruritus, 34 rash | 174 out of 192 | anaemia, neutropenia, diarrhoea, nausea, vomiting, asthenia, chills, fatigue, influenza‐like illness, irritability, pyrexia, decreased appetite, arthralgia, myalgia, dizziness, dysgeusia, headache, depression, insomnia, cough, dyspnoea, alopecia, dry skin, pruritus, rash. The authors did not report number of adverse events in the control group | 90 out of 96 | |
| Grazoprevir | 9 diarrhoea, 2 nausea, 1 vomiting, 7 fatigue, 1 dysgeusia, 16 headache, 1 insomnia, 2 pruritis | 34 out of 76 | 1 headache | 2 out of 15 | |
| GSK2336805 | 3 anaemia, 3 neutropenia, 4 nausea, 2 vomiting, 2 chills, 5 fatigue, 2 cough | 11 out of 11 | 1 fatigue | 4 out of 4 | |
| IDX‐184 | 1 diarrhoea, 2 fatigue, 1 dizziness, 4 headache | 8 out of 33 | 1 diarrhoea, 1 fatigue, 1 dizziness, 1 headache | 4 out of 8 | |
| IDX‐184 | 6 neutropenia, 7 diarrhoea, 22 nausea, 5 vomiting, 15 chills, 36 fatigue, 10 irritability, 9 pyrexia, 5 decreased appetite, 19 myalgia, 27 headache, 4 depression, 10 insomnia, 6 pruritus | 59 out of 65 | 4 neutropenia, 2 diarrhoea, 3 nausea, 5 chills, 9 fatigue, 4 irritability, 3 decreased appetite, 5 myalgia, 7 headache, 3 depression, 5 insomnia, 2 pruritus | 12 out of 16 | |
| IDX320 | 1 diarrhoea, 1 myalgia, 4 headache | Not specified out of 30 | None reported | 0 out of 8 | |
| Ledispasvir | 2 nausea, 6 headache, 2 rash | 18 out of 59 | 1 nausea | 4 out of 11 | |
| Mericitabine/danoprevir | 7 diarrhoea, 9 nausea, 36 headache, 9 rash | Not specified out of 73 | 1 diarrhoea, 2 nausea, 8 headache, 1 rash | Not specified out of 14 | |
| Mericitabine | 25 diarrhoea, 16 nausea, 6 chills, 47 fatigue, 14 irritability, 16 pyrexia, 12 arthralgia, 19 myalgia, 43 headache, 27 insomnia, 21 cough, 15 pruritus | Not specified out of 102 | 12 diarrhoea, 14 nausea, 12 chills, 25 fatigue, 10 irritability, 14 pyrexia, 11 arthralgia, 18 myalgia, 28 headache, 11 insomnia, 11 cough, 11 pruritus | Not specified out of 49 | |
| Mericitabine | 18 diarrhoea, 33 nausea, 31 chills, 58 fatigue, 21 irritability, 20 pyrexia, 25 decreased appetite, 18 arthralgia, 24 myalgia, 19 dizziness, 42 headache, 31 insomnia, 17 cough, 14 alopecia, 15 pruritus, 17 rash | Not specified out of 81 | 20 diarrhoea, 34 nausea, 33 chills, 58 fatigue, 25 irritability, 27 pyrexia, 22 decreased appetite, 21 arthralgia, 24 myalgia, 20 dizziness, 38 headache, 28 insomnia, 22 cough, 17 alopecia, 28 pruritus, 28 rash | Not specified out of 85 | |
| Narlaprevir | 10 diarrhoea, 8 nausea, 30 influenza‐like illness, 6 dizziness, 11 headache | 32 out of 32 | 1 nausea, 6 influenza‐like illness, 1 dizziness | 7 out of 8 | |
| Narlaprevir | 87 anaemia, 84 diarrhoea, 131 nausea, 54 vomiting, 44 chills, 123 fatigue, 106 influenza‐like illness, 58 irritability, 58 pyrexia, 61 decreased appetite, 60 arthralgia, 39 myalgia, 58 dizziness, 83 headache, 33 depression, 80 insomnia, 28 pruritus, 31 rash | Not specified out of 93 | 6 anaemia, 17 diarrhoea, 50 nausea, 28 vomiting, 17 chills, 56 fatigue, 44 influenza‐like illness, 28 irritability, 17 pyrexia, 44 decreased appetite, 28 arthralgia, 6 dizziness, 39 headache, 22 depression, 39 insomnia, 33 pruritus, 11 rash | Not specified out of 18 | |
| Odalasvir/sovaprevir | 5 anaemia, 2 diarrhoea, 5 fatigue, 2 influenza‐like illness, 2 irritability, 1 decreased appetite, 2 arthralgia, 3 myalgia, 1 dizziness, 1 dysgeusia, 6 headache, 2 insomnia, 4 cough, 1 dyspnoea, 1 pruritus, 1 rash | 20 out of 20 | 2 diarrhoea, 4 fatigue, 1 myalgia, 1 dizziness, 1 headache, 1 cough, pruritus | 10 out of 10 | |
| Ombitasvir | 6 anaemia, 5 neutropenia, 4 diarrhoea, 9 nausea, 7 vomiting, 6 chills, 18 fatigue, 1 influenza‐like illness, 1 irritability, 3 pyrexia, 5 decreased appetite, 2 arthralgia, 2 myalgia, 2 dizziness, 9 headache, 4 depression, 4 insomnia, 3 cough, 2 dyspnoea, 5 dry skin, 3 pruritus, 6 rash | 26 out of 28 | 1 neutropenia, 1 diarrhoea, 3 nausea, 2 vomiting, 6 fatigue, 2 influenza‐like illness, 1 irritability, 1 decreased appetite, 1 myalgia, 2 headache, 1 depression, 2 insomnia, 1 cough, dyspnoea, 1 dry skin, 2 rash | 9 out of 9 | |
| Paritaprevir/ABT‐072/dasabuvir | 12 anaemia, 14 neutropenia, 16 diarrhoea, 15 nausea, 6 vomiting, 4 asthenia, 11 chills, 29 fatigue, 14 influenza‐like illness, 8 irritability, 12 pyrexia, 4 decreased appetite, 9 arthralgia, 14 myalgia, 9 dizziness, 6 dysgeusia, 38 headache, 15 depression, 14 insomnia, 6 cough, 6 dyspnoea, 5 alopecia, 2 dry skin, 8 pruritus, 12 rash | 63 out of 63 | 1 anaemia, 2 neutropenia, 4 diarrhoea, 4 nausea, 1 vomiting, 1 asthenia, 6 fatigue, 1 influenza‐like illness, 1 irritability, 1 pyrexia, 2 decreased appetite, 1 arthralgia, 3 myalgia, 4 dizziness, 2 dysgeusia, 4 headache, 2 insomnia, 2 dyspnoea, 1 alopecia, 2 pruritus, 2 rash | 10 out of 11 | |
| Paritaprevir/ombitasvir | 24 anaemia, 65 diarrhoea, 112 nausea, 23 vomiting, 59 asthenia, 164 fatigue, 26 irritability, 37 decreased appetite, 23 arthralgia, 21 myalgia, 38 dizziness, 156 headache, 67 insomnia, 34 cough, 38 dyspnoea, 27 dry skin, 80 pruritus, 51 rash | 391 out of 473 | 11 diarrhoea, 22 nausea, 6 vomiting, 6 asthenia, 45 fatigue, 4 irritability, 5 decreased appetite, 9 arthralgia, 8 myalgia, 6 dizziness, 42 headache, 12 insomnia, 8 cough, 4 dyspnoea, 2 dry skin, 7 pruritus, 9 rash | 108 out of 158 | |
| Paritaprevir/ombitasvir | 19 anaemia, 47 diarrhoea, 72 nausea, 22 vomiting, 60 asthenia, 115 fatigue, 22 irritability, 24 decreased appetite, 21 arthralgia, 28 myalgia, 30 dizziness, 13 dysgeusia, 126 headache, 52 insomnia, 43 cough, 50 dyspnoea, 27 dry skin, 53 pruritus, 34 rash | 328 out of 394 | 12 diarrhoea, 17 nausea, 11 asthenia, 22 fatigue, 8 irritability, 2 decreased appetite, 7 arthralgia, 10 myalgia, 5 dizziness, 5 dysgeusia, 34 headache, 7 insomnia, 5 cough, 10 dyspnoea, 3 dry skin, 5 pruritus, 6 rash | 74 out of 97 | |
| PHX1766 | 1 nausea, 2 fatigue, 1 dizziness | Not specified | None reported | Not specified | |
| R1626 | 43 neutropenia, 42 diarrhoea, 49 nausea, 26 vomiting, 39 chills, 45 fatigue, 20 irritability, 29 pyrexia, 21 arthralgia, 23 myalgia, 15 dizziness, 47 headache, 27 insomnia, 15 cough, 11 pruritus, 20 rash | Not specified out of 84 | 5 diarrhoea, 10 nausea, 2 vomiting, 9 chills, 10 fatigue, 1 irritability, 8 pyrexia, 5 arthralgia, 11 myalgia, 3 dizziness, 11 headache, 6 insomnia, 4 cough, 6 pruritus, 2 rash | Not specified out of 20 | |
| Samatasvir | 4 nausea, 1 decreased appetite, 6 headache, 1 insomnia | 20 out of 48 | 1 nausea, 1 decreased appetite, 1 headache, 1 insomnia | 6 out of 12 | |
| Simeprevir | 40 anaemia, 37 neutropenia, 36 diarrhoea, 59 nausea, 18 vomiting, 57 asthenia, 17 chills, 87 fatigue, 78 influenza‐like illness, 63 pyrexia, 35 decreased appetite, 26 arthralgia, 39 myalgia, 14 dizziness, 12 dysgeusia, 87 headache, 22 depression, 49 insomnia, 34 cough, 26 dyspnoea, 26 alopecia, 24 dry skin, 16 pruritus, 33 rash | 245 out of 260 | 24 anaemia, 26 neutropenia, 22 diarrhoea, 26 nausea, 9 vomiting, 25 asthenia, 11 chills, 58 fatigue, 27 influenza‐like illness, 30 pyrexia, 24 decreased appetite, 12 arthralgia, 17 myalgia, 6 dizziness, 7 dysgeusia, 48 headache, 10 depression, 33 insomnia, 21 cough, 5 dyspnoea, 17 alopecia, 18 dry skin, 37 pruritus, 19 rash | 123 out of 133 | |
| Simeprevir | 63 anaemia, 75 neutropenia, 47 diarrhoea, 86 nausea, 22 vomiting, 63 asthenia, 25 chills, 107 fatigue, 98 influenza‐like illness, 11 irritability, 64 pyrexia, 17 decreased appetite, 53 arthralgia, 55 myalgia, 29 dizziness, 16 dysgeusia, 142 headache, 32 depression, 69 insomnia, 52 cough, 33 dyspnoea, 53 alopecia, 63 dry skin, 173 pruritus, 65 rash | 302 out of 309 | 16 anaemia, 16 neutropenia, 12 diarrhoea, 21 nausea, 5 vomiting, 16 asthenia, 8 chills, 37 fatigue, 29 influenza‐like illness, 8 irritability, 13 pyrexia, 6 decreased appetite, 11 arthralgia, 17 myalgia, 6 dizziness, 5 dysgeusia, 40 headache, 14 depression, 23 insomnia, 15 cough, 6 dyspnoea, 16 alopecia, 14 dry skin, 35 pruritus, 18 rash | 75 out of 77 | |
| Simeprevir | 24 anaemia, 13 diarrhoea,13 nausea, 6 vomiting, 4 chills, 2 fatigue, 42 pyrexia, 15 decreased appetite, 27 arthralgia, 15 myalgia, 3 dizziness, 6 dysgeusia, 41 headache, 2 depression, 23 insomnia, 8 cough, 25 alopecia, 5 dry skin, 15 pruritus, 47 rash | 79 out of 79 | 5 anaemia, 5 diarrhoea, 2 vomiting, 7 pyrexia, 3 decreased appetite, 2 arthralgia, 2 myalgia, 8 headache, 2 insomnia, 2 cough, 6 alopecia, 6 rash | 13 out of 13 | |
| Simeprevir | 70 anaemia, 8 neutropenia, 20 diarrhoea, 16 nausea, 6 vomiting, 13 fatigue, 75 pyrexia, 28 decreased appetite, 30 arthralgia, 9 myalgia, 4 dizziness, 20 dysgeusia, 54 headache, 27 insomnia, 11 cough, 44 alopecia, 8 dry skin, 35 pruritus, 57 rash | 123 out of 123 | 36 anaemia, 1 neutropenia, 20 diarrhoea, 16 nausea, 6 vomiting, 7 fatigue, 31 pyrexia, 20 decreased appetite, 14 arthralgia, 11 myalgia, 4 dizziness, 8 dysgeusia, 26 headache, 3 depression, 25 insomnia, 8 cough, 28 alopecia, 9 dry skin, 18 pruritus, 37 rash | 60 out of 60 | |
| Simeprevir | 82 anaemia, 59 neutropenia, 14 diarrhoea, 16 nausea, 15 asthenia, 63 fatigue, 39 influenza‐like illness, 67 pyrexia, 28 decreased appetite, 13 arthralgia, 36 myalgia, 39 headache, 17 insomnia, 16 cough, 47 alopecia, 40 pruritus, 57 rash | 298 out of 305 | 53 anaemia, 32 neutropenia, 7 diarrhoea, 10 nausea, 7 asthenia, 36 fatigue, 19 influenza‐like illness, 46 pyrexia, 16 decreased appetite, 4 arthralgia, 22 myalgia, 28 headache, 18 insomnia, 17 cough, 26 alopecia, 17 pruritus, 27 rash | 149 out of 152 | |
| Simeprevir | 44 anaemia, 54 neutropenia, 35 diarrhoea, 65 nausea, 23 vomiting, 25 asthenia, 33 chills, 111 fatigue, 62 influenza‐like illness, 51 pyrexia, 47 decreased appetite, 34 arthralgia, 39 myalgia, 23 dizziness, 16 dysgeusia, 88 headache, 23 depression, 56 insomnia, 25 cough, 23 dyspnoea, 30 alopecia, 33 dry skin, 68 pruritus, 60 rash | 252 out of 264 | 24 anaemia, 15 neutropenia, 19 diarrhoea, 32 nausea, 9 vomiting, 21 asthenia, 18 chills, 53 fatigue, 26 influenza‐like illness, 28 pyrexia, 19 decreased appetite, 21 arthralgia, 18 myalgia, 9 dizziness, 4 dysgeusia, 51 headache, 16 depression, 31 insomnia, 20 cough, 9 dyspnoea, 16 alopecia, 11 dry skin, 20 pruritus, 30 rash | 124 out of 130 | |
| Simeprevir | 16 anaemia, 26 neutropenia, 20 diarrhoea, 31 nausea, 9 vomiting, 26 asthenia, 6 chills, 35 fatigue, 24 influenza‐like illness, 10 irritability, 21 pyrexia, 7 decreased appetite, 20 arthralgia, 14 myalgia, 4 dizziness, 5 dysgeusia, 42 headache, 14 depression, 12 insomnia, 19 cough, 18 dyspnoea, 16 alopecia, 19 dry skin, 18 pruritus, 9 rash | 82 out of 83 | 4 anaemia, 4 neutropenia, 3 diarrhoea, 4 nausea, 3 vomiting, 7 asthenia, 5 chills, 13 fatigue, 5 influenza‐like illness, 4 irritability, 4 pyrexia, 2 decreased appetite, 3 arthralgia, 8 myalgia, 3 dizziness, 3 dysgeusia, 16 headache, 2 depression, 7 insomnia, 10 cough, 4 dyspnoea, 3 alopecia, 5 dry skin, 7 pruritus, 5 rash | 28 out of 28 | |
| Simeprevir | 46 anaemia, 49 neutropenia, 34 diarrhoea, 63 nausea, 17 vomiting, 59 asthenia, 21 chills, 95 fatigue, 66 influenza‐like illness, 80 pyrexia, 46 decreased appetite, 32 arthralgia, 58 myalgia, 21 dizziness, 101 headache, 29 depression, 51 insomnia, 32 cough, 23 dyspnoea, 43 alopecia, 28 dry skin, 65 pruritus, 46 rash | 243 out of 257 | 33 anaemia, 29 neutropenia, 12 diarrhoea, 24 nausea, 7 vomiting, 38 asthenia, 12 chills, 56 fatigue, 35 influenza‐like illness, 53 pyrexia, 21 decreased appetite, 14 arthralgia, 28 myalgia, 9 dizziness, 49 headache, 19 depression, 21 insomnia, 22 cough, 11 dyspnoea, 27 alopecia, 18 dry skin, 34 pruritus, 15 rash | 131 out of 134 | |
| Simeprevir | 1 anaemia, 1 diarrhoea, 6 nausea, 8 fatigue, 1 irritability, 2 myalgia, 7 headache, 3 insomnia, 6 pruritus, 10 rash | 46 out of 58 | 9 anaemia, 5 neutropenia, 2 diarrhoea, 7 nausea, 4 asthenia, 17 fatigue, 6 influenza‐like illness, 3 irritability, 4 myalgia, 8 headache, 6 insomnia, 4 pruritus, 3 rash | 22 out of 24 | |
| Simeprevir | 76 anaemia, 101 neutropenia, 59 diarrhoea, 95 nausea, 21 vomiting, 84 asthenia, 34 chills, 174 fatigue, 116 influenza‐like illness, 53 irritability, 69 pyrexia, 69 decreased appetite, 50 arthralgia, 64 myalgia, 29 dizziness, 22 dysgeusia, 138 headache, 45 depression, 79 insomnia, 76 cough, 49 dyspnoea, 31 alopecia, 72 dry skin, 135 pruritus, 61 rash | 380 out of 396 | 13 anaemia, 11 neutropenia, 13 diarrhoea, 14 nausea, 5 vomiting, 7 asthenia, 6 chills, 174 fatigue, 13 influenza‐like illness, 7 irritability, 9 pyrexia, 9 decreased appetite, 9 arthralgia, 12 myalgia, 6 dizziness, 3 dysgeusia, 24 headache, 6 depression, 9 insomnia, 8 cough, 4 dyspnoea, 5 alopecia, 10 dry skin, 11 pruritus, 9 rash | 63 out of 66 | |
| Sofosbuvir | 19 diarrhoea, 46 nausea, 12 vomiting, 91 fatigue, 19 irritability, 7 decreased appetite, 16 arthralgia, 19 dizziness, 43 headache, 15 depression, 39 insomnia, 11 cough, 19 dyspnoea, 23 pruritus, 18 rash | 184 out of 207 | 4 diarrhoea, 13 nausea, 5 vomiting, 17 fatigue, 1 irritability, 7 decreased appetite, 1 arthralgia, 5 dizziness, 14 headache, 1 depression, 3 insomnia, 2 cough, 1 dyspnoea, 6 pruritus, 6 rash | 55 out of 71 | |
| Sofosbuvir | 19 anaemia, 23 neutropenia, 18 diarrhoea, 38 nausea, 12 vomiting, 2 asthenia, 37 chills, 64 fatigue, 15 irritability, 22 pyrexia, 11 decreased appetite, 10 arthralgia, 17 myalgia, 11 dizziness, 9 dysgeusia, 37 headache, 12 depression, 24 insomnia, 14 cough, 11 dyspnoea, 10 alopecia, 12 dry skin, 13 pruritus, 29 rash | 117 out of 120 | 7 anaemia, 5 neutropenia, 2 diarrhoea, 9 nausea, 2 vomiting, 1 asthenia, 10 chills, 16 fatigue, 5 irritability, 2 pyrexia, 4 decreased appetite, 5 arthralgia, 6 myalgia, 3 dizziness, 15 headache, 3 depression, 9 insomnia, 3 cough, 4 dyspnoea, 2 alopecia, 3 dry skin, 3 pruritus, 4 rash | 26 out of 26 | |
| Sofosbuvir | 20 anaemia, 23 diarrhoea, 46 nausea, 17 vomiting, 7 chills, 92 fatigue, 7 influenza‐like illness, 25 irritability, 6 pyrexia, 17 decreased appetite, 15 arthralgia, 21 myalgia, 27 dizziness, 64 headache, 14 depression, 31 insomnia, 19 cough, 18 dyspnoea, 12 alopecia, 11 dry skin, 19 pruritus, 23 rash | 219 out of 256 | 28 anaemia, 30 neutropenia, 45 diarrhoea, 70 nausea, 23 vomiting, 44 chills, 134 fatigue, 44 influenza‐like illness, 40 irritability, 33 pyrexia, 44 decreased appetite, 35 arthralgia, 40 myalgia, 33 dizziness, 108 headache, 34 depression, 71 insomnia, 21 cough, 20 dyspnoea, 24 alopecia, 23 dry skin, 42 pruritus, 43 rash | 233 out of 243 | |
| Sofosbuvir | 7 anaemia, 17 nausea, 3 vomiting, 22 fatigue, 4 pyrexia, 7 decreased appetite, 12 arthralgia, 7 myalgia, 6 dizziness, 15 headache, 4 depression, 7 insomnia, 9 pruritus | 45 out of 49 | 1 anaemia, 5 nausea, 2 chills, 6 fatigue, 1 pyrexia, 1 decreased appetite, 1 myalgia, 2 dizziness, 2 headache, 2 insomnia,1 pruritus | 13 out of 14 | |
| Sofosbuvir/velpatasvir | 48 diarrhoea, 75 nausea, 41 asthenia, 126 fatigue, 40 arthralgia, 25 myalgia, 182 headache, 50 insomnia, 39 cough | 485 out of 624 | 8 diarrhoea, 13 nausea, 9 asthenia, 23 fatigue, 9 arthralgia, 6 myalgia, 33 headache, 11 insomnia, 4 cough | 89 out of 116 | |
| Telaprevir | 1 diarrhoea, 4 nausea, 1 vomiting, 6 asthenia, 4 fatigue, 10 influenza‐like illness, 3 headache, 2 insomnia, 1 dyspnoea, 1 dry skin, 3 pruritus | 16 out of 16 | 1 anaemia, 1 neutropenia, 3 asthenia, 4 influenza‐like illness, 1 decreased appetite, 1 headache, 1 insomnia, 1 cough, 1 dry skin, 2 pruritus, 2 rash | 8 out of 8 | |
| Telaprevir | 2 diarrhoea, 3 nausea, 1 chills, 5 myalgia, 2 dizziness, 5 headache, 3 dry skin, 3 rash | 14 out of 16 | 1 diarrhoea, 1 nausea, 1 asthenia, 2 chills, 2 myalgia, 1 dizziness, 2 headache, 1 dry skin | 4 out of 4 | |
| Telaprevir | 1 anaemia, 4 diarrhoea, 8 nausea, 5 vomiting, 9 asthenia, 1 chills, 5 fatigue, 11 influenza‐like illness, 1 irritability, 2 pyrexia, 1 arthralgia, 4 myalgia, 3 dizziness, 5 headache, 1 depression, 2 insomnia, 1 cough, 2 dyspnoea, 1 alopecia, 3 dry skin, 11 pruritus, 5 rash | 26 out of 31 | 1 neutropenia, 1 diarrhoea, 1 nausea, 5 asthenia, 3 chills, 2 fatigue, 7 influenza‐like illness, 5 pyrexia, 3 myalgia, 1 dysgeusia, 6 headache, 1 depression, 2 insomnia, 2 cough, 2 dyspnoea, 1 dry skin, 2 pruritus | 16 out of 18 | |
| Telaprevir | 44 anaemia, 11 neutropenia, 66 diarrhoea, 102 nausea, 22 vomiting, 110 asthenia, 12 chills, 70 fatigue, 92 influenza‐like illness, 22 irritability, 44 pyrexia, 30 decreased appetite, 36 arthralgia, 35 myalgia, 12 dizziness, 20 dysgeusia, 105 headache, 51 depression, 62 insomnia, 37 cough, 50 dyspnoea, 29 alopecia, 64 dry skin, 139 pruritus, 71 rash | 240 out of 241 | 14 anaemia, 14 neutropenia, 23 diarrhoea, 33 nausea, 12 vomiting, 26 asthenia, 10 chills, 30 fatigue, 43 influenza‐like illness, 11 irritability, 19 pyrexia, 16 decreased appetite, 14 arthralgia, 17 myalgia, 8 dizziness, 3 dysgeusia, 37 headache, 19 depression, 32 insomnia, 21 cough, 13 dyspnoea, 17 alopecia, 29 dry skin, 29 pruritus, 22 rash | 81 out of 82 | |
| Telaprevir | 276 anaemia, 217 diarrhoea, 302 nausea, 418 fatigue, 203 pyrexia, 304 headache, 233 insomnia, 346 pruritus, 262 rash | 723 out of 727 | 70 anaemia, 80 diarrhoea, 112 nausea, 206 fatigue, 87 pyrexia, 142 headache, 111 insomnia, 131 pruritus, 88 rash | 354 out of 361 | |
| Telaprevir | 58 anaemia, 30 neutropenia, 64 diarrhoea, 93 nausea, 38 vomiting, 29 chills, 127 fatigue, 75 influenza‐like illness, 23 irritability, 33 pyrexia, 22 decreased appetite, 34 arthralgia, 27 myalgia, 41 dizziness, 16 dysgeusia, 80 headache, 34 depression, 68 insomnia, 36 cough, 25 dyspnoea, 21 alopecia, 28 dry skin, 74 pruritus, 62 rash | 175 out of 175 | 20 anaemia, 18 neutropenia, 21 diarrhoea, 22 nausea, 9 vomiting, 14 chills, 57 fatigue, 32 influenza‐like illness, 22 irritability, 22 pyrexia, 9 decreased appetite, 16 arthralgia, 18 myalgia, 14 dizziness, 8 dysgeusia, 45 headache, 13 depression, 29 insomnia, 14 cough, 11 dyspnoea, 8 alopecia, 19 dry skin, 17 pruritus, 20 rash | 75 out of 75 | |
| Telaprevir | 69 anaemia, 31 neutropenia, 115 diarrhoea, 122 nausea, 37 vomiting, 57 chills, 197 fatigue, 93 influenza‐like illness, 63 irritability, 59 pyrexia, 20 decreased appetite, 51 arthralgia, 60 myalgia, 47 dizziness, 130 headache, 43 depression, 83 insomnia, 46 cough, 27 dyspnoea, 54 alopecia, 32 dry skin, 129 pruritus, 126 rash | 329 out of 339 | 9 anaemia, 7 neutropenia, 22 diarrhoea, 39 nausea, 13 vomiting, 15 chills, 64 fatigue, 36 influenza‐like illness, 25 irritability, 14 pyrexia, 12 decreased appetite, 21 arthralgia, 21 myalgia, 18 dizziness, 41 headache, 19 depression, 19 insomnia, 20 cough, 9 dyspnoea, 13 alopecia, 7 dry skin, 17 pruritus, 20 rash | 111 out of 114 | |
| Telaprevir | 35 anaemia, 26 neutropenia, 34 diarrhoea, 44 nausea, 27 vomiting, 22 asthenia, 15 chills, 50 fatigue, 24 influenza‐like illness, 18 irritability, 34 pyrexia, 30 decreased appetite, 9 arthralgia, 20 myalgia, 19 dizziness, 18 dysgeusia, 38 headache, 11 depression, 25 insomnia, 15 cough, 5 dyspnoea, 18 alopecia, 11 dry skin, 30 pruritus, 12 rash | 38 out of 38 | 8 anaemia, 2 neutropenia, 6 diarrhoea, 11 nausea, 5 vomiting, 9 asthenia, 5 chills, 12 fatigue, 13 influenza‐like illness, 5 irritability, 7 pyrexia, 6 decreased appetite, 2 arthralgia, 6 myalgia, 2 dizziness, 5 dysgeusia, 6 headache, 4 depression, 9 insomnia, 6 cough, 2 dyspnoea, 6 alopecia, 3 dry skin, 3 pruritus | 22 out of 22 | |
| Telaprevir | 171 anaemia, 73 neutropenia, 135 diarrhoea, 181 nausea, 68 vomiting, 111 asthenia, 73 chills, 276 fatigue, 179 influenza‐like illness, 74 irritability, 130 pyrexia, 40 decreased appetite, 67 arthralgia, 87 myalgia, 47 dizziness, 65 dysgeusia, 221 headache, 59 depression, 152 insomnia, 128 cough, 82 dyspnoea, 78 alopecia, 97 dry skin, 270 pruritus, 194 rash | 517 out of 530 | 19 anaemia, 14 neutropenia, 18 diarrhoea, 31 nausea, 11 vomiting, 38 asthenia, 73 chills, 53 fatigue, 33 influenza‐like illness, 21 irritability, 36 pyrexia, 9 decreased appetite, 20 arthralgia, 24 myalgia, 7 dizziness, 8 dysgeusia, 49 headache, 19 depression, 34 insomnia, 26 cough, 17 dyspnoea, 17 alopecia, 21 dry skin, 36 pruritus, 25 rash | 126 out of 132 | |
| Vaniprevir | 6 anaemia, 7 neutropenia, 16 diarrhoea, 26 nausea, 16 vomiting, 13 asthenia, 5 chills, 17 fatigue, 17influenza‐like illness, 4 irritability, 8 pyrexia, 13 decreased appetite, 8 arthralgia, 3 myalgia, 5 dizziness, 2 dysgeusia, 26 headache, 8 depression, 15 insomnia, 8 cough, 7 dyspnoea, 6 alopecia, 6 dry skin, 9 pruritus, 10 rash | 71 out of 75 | 3 anaemia, 2 neutropenia, 4 diarrhoea, 6 nausea, 4 asthenia, 2 chills, 7 fatigue, 4 influenza‐like illness, 3 irritability, 2 pyrexia, 2 decreased appetite, 2 arthralgia, 3 myalgia, 7 headache, 3 depression, 2 insomnia, 3 cough, 5 dyspnoea, 3 alopecia, 6 dry skin, 4 pruritus, 4 rash | 19 out of 19 | |
| Vaniprevir | 6 anaemia, 7 neutropenia, 16 diarrhoea, 26 nausea, 16 vomiting, 13 asthenia, 5 chills, 17 fatigue, 17 influenza‐like illness, 4 irritability, 8 pyrexia, 13 decreased appetite, 8 arthralgia, 3 myalgia, 5 dizziness, 2 dysgeusia, 26 headache, 8 depression, 15 insomnia, 8 cough, 7 dyspnoea, 6 alopecia, 6 dry skin, 9 pruritus, 10 rash | 71 out of 75 | 3 anaemia, 2 neutropenia, 4 diarrhoea, 6 nausea, 4 asthenia, 2 chills, 7 fatigue, 4 influenza‐like illness, 3 irritability, 2 pyrexia, 2 decreased appetite, 2 arthralgia, 3 myalgia, 7 headache, 3 depression, 2 insomnia, 3 cough, 5 dyspnoea, 3 alopecia, 6 dry skin, 4 pruritus, 4 rash | 19 out of 19 | |
| Vaniprevir | 43 anaemia, 34 neutropenia, 97 diarrhoea, 110 nausea, 59 vomiting, 50 asthenia, 16 chills, 92 fatigue, 54 influenza‐like illness, 24 irritability, 37 pyrexia, 40 decreased appetite, 37 arthralgia, 38 myalgia, 23 dizziness, 16 dysgeusia, 92 headache, 32 depression, 40 insomnia, 54 cough, 30 dyspnoea, 35 alopecia, 37 dry skin, 75 pruritus, 43 rash | 225 out of 229 | 8 anaemia, 3 neutropenia, 9 diarrhoea, 10 nausea, 3 vomiting, 11 asthenia, 1 chills, 18 fatigue, 12 influenza‐like illness, 8 irritability, 14 pyrexia, 5 decreased appetite, 11 arthralgia, 12 myalgia, 6 dizziness, 3 dysgeusia, 20 headache, 3 depression, 14 insomnia, 14 cough, 8 dyspnoea, 5 alopecia, 10 dry skin, 14 pruritus, 10 rash | 55 out of 56 | |
| Vaniprevir | 43 anaemia, 34 neutropenia, 97 diarrhoea, 110 nausea, 59 vomiting, 50 asthenia, 16 chills, 92 fatigue, 54 influenza‐like illness, 24 irritability, 37 pyrexia, 40 decreased appetite, 37 arthralgia, 38 myalgia, 23 dizziness, 16 dysgeusia, 92 headache, 32 depression, 40 insomnia, 54 cough, 30 dyspnoea, 35 alopecia, 37 dry skin, 75 pruritus, 43 rash | 225 out of 229 | 8 anaemia, 3 neutropenia, 9 diarrhoea, 10 nausea, 3 vomiting, 11 asthenia, 1 chills, 18 fatigue, 12 influenza‐like illness, 8 irritability, 14 pyrexia, 5 decreased appetite, 11 arthralgia, 12 myalgia, 6 dizziness, 3 dysgeusia, 20 headache, 3 depression, 14 insomnia, 14 cough, 8 dyspnoea, 5 alopecia, 10 dry skin, 14 pruritus, 10 rash | 55 out of 56 | |
| VCH‐759 | 18 diarrhoea, 3 nausea, 4 vomiting, 1 chills, 5 fatigue, 8 headache | 20 out of 23 | 5 diarrhoea, 1 nausea, 2 headache | 6 out of 9 | |
| Velpatasvir | 2 diarrhoea, 3 nausea, 4 vomiting, 6 headache, 2 cough | 18 out of 70 | None reported | 3 out of 17 |
| Outcome or subgroup title | No. of studies | No. of participants | Statistical method | Effect size |
| 1 Hepatitis C‐related morbidity or all‐cause mortality Show forest plot | 71 | Odds Ratio (M‐H, Fixed, 95% CI) | Totals not selected | |
| 2 Hepatitis C‐related morbidity or all‐cause mortality ‐ bias risk Show forest plot | 71 | Odds Ratio (M‐H, Fixed, 95% CI) | Totals not selected | |
| 2.1 Trials at high risk of bias | 71 | Odds Ratio (M‐H, Fixed, 95% CI) | 0.0 [0.0, 0.0] | |
| 2.2 Trials at low risk of bias | 0 | Odds Ratio (M‐H, Fixed, 95% CI) | 0.0 [0.0, 0.0] | |
| 3 Hepatitis C‐related morbidity or all‐cause mortality ‐ according to type of DAA Show forest plot | 71 | Odds Ratio (M‐H, Fixed, 95% CI) | Totals not selected | |
| 3.1 ABT‐072 | 0 | Odds Ratio (M‐H, Fixed, 95% CI) | 0.0 [0.0, 0.0] | |
| 3.2 ACH‐2684 | 0 | Odds Ratio (M‐H, Fixed, 95% CI) | 0.0 [0.0, 0.0] | |
| 3.3 Alisporivir | 3 | Odds Ratio (M‐H, Fixed, 95% CI) | 0.0 [0.0, 0.0] | |
| 3.4 ALS‐2200 | 0 | Odds Ratio (M‐H, Fixed, 95% CI) | 0.0 [0.0, 0.0] | |
| 3.5 Asunaprevir | 6 | Odds Ratio (M‐H, Fixed, 95% CI) | 0.0 [0.0, 0.0] | |
| 3.6 Balapiravir | 0 | Odds Ratio (M‐H, Fixed, 95% CI) | 0.0 [0.0, 0.0] | |
| 3.7 Beclabuvir | 3 | Odds Ratio (M‐H, Fixed, 95% CI) | 0.0 [0.0, 0.0] | |
| 3.8 BILB‐1941 | 0 | Odds Ratio (M‐H, Fixed, 95% CI) | 0.0 [0.0, 0.0] | |
| 3.9 BIT‐225 | 0 | Odds Ratio (M‐H, Fixed, 95% CI) | 0.0 [0.0, 0.0] | |
| 3.10 Boceprevir | 0 | Odds Ratio (M‐H, Fixed, 95% CI) | 0.0 [0.0, 0.0] | |
| 3.11 Ciluprevir | 0 | Odds Ratio (M‐H, Fixed, 95% CI) | 0.0 [0.0, 0.0] | |
| 3.12 Daclatasvir | 14 | Odds Ratio (M‐H, Fixed, 95% CI) | 0.0 [0.0, 0.0] | |
| 3.13 Danoprevir | 9 | Odds Ratio (M‐H, Fixed, 95% CI) | 0.0 [0.0, 0.0] | |
| 3.14 Dasabuvir | 0 | Odds Ratio (M‐H, Fixed, 95% CI) | 0.0 [0.0, 0.0] | |
| 3.15 Deleobuvir | 0 | Odds Ratio (M‐H, Fixed, 95% CI) | 0.0 [0.0, 0.0] | |
| 3.16 Faldaprevir | 0 | Odds Ratio (M‐H, Fixed, 95% CI) | 0.0 [0.0, 0.0] | |
| 3.17 Filibuvir | 0 | Odds Ratio (M‐H, Fixed, 95% CI) | 0.0 [0.0, 0.0] | |
| 3.18 Grazoprevir | 0 | Odds Ratio (M‐H, Fixed, 95% CI) | 0.0 [0.0, 0.0] | |
| 3.19 GS‐6620 | 0 | Odds Ratio (M‐H, Fixed, 95% CI) | 0.0 [0.0, 0.0] | |
| 3.20 GS‐9256 | 0 | Odds Ratio (M‐H, Fixed, 95% CI) | 0.0 [0.0, 0.0] | |
| 3.21 GS‐9451 | 1 | Odds Ratio (M‐H, Fixed, 95% CI) | 0.0 [0.0, 0.0] | |
| 3.22 GS‐9669 | 0 | Odds Ratio (M‐H, Fixed, 95% CI) | 0.0 [0.0, 0.0] | |
| 3.23 GS‐9851 | 0 | Odds Ratio (M‐H, Fixed, 95% CI) | 0.0 [0.0, 0.0] | |
| 3.24 GS‐9857 | 0 | Odds Ratio (M‐H, Fixed, 95% CI) | 0.0 [0.0, 0.0] | |
| 3.25 GSK2336805 | 2 | Odds Ratio (M‐H, Fixed, 95% CI) | 0.0 [0.0, 0.0] | |
| 3.26 GSK2878175 | 0 | Odds Ratio (M‐H, Fixed, 95% CI) | 0.0 [0.0, 0.0] | |
| 3.27 IDX‐184 | 0 | Odds Ratio (M‐H, Fixed, 95% CI) | 0.0 [0.0, 0.0] | |
| 3.28 INX‐08189 | 0 | Odds Ratio (M‐H, Fixed, 95% CI) | 0.0 [0.0, 0.0] | |
| 3.29 Ledispasvir | 0 | Odds Ratio (M‐H, Fixed, 95% CI) | 0.0 [0.0, 0.0] | |
| 3.30 Mericitabine | 3 | Odds Ratio (M‐H, Fixed, 95% CI) | 0.0 [0.0, 0.0] | |
| 3.31 Narlaprevir | 0 | Odds Ratio (M‐H, Fixed, 95% CI) | 0.0 [0.0, 0.0] | |
| 3.32 Nesbuvir | 0 | Odds Ratio (M‐H, Fixed, 95% CI) | 0.0 [0.0, 0.0] | |
| 3.33 Odalasavir | 0 | Odds Ratio (M‐H, Fixed, 95% CI) | 0.0 [0.0, 0.0] | |
| 3.34 Ombitasvir | 0 | Odds Ratio (M‐H, Fixed, 95% CI) | 0.0 [0.0, 0.0] | |
| 3.35 Paritaprevir | 0 | Odds Ratio (M‐H, Fixed, 95% CI) | 0.0 [0.0, 0.0] | |
| 3.36 PHX1766 | 0 | Odds Ratio (M‐H, Fixed, 95% CI) | 0.0 [0.0, 0.0] | |
| 3.37 PPI‐461 | 0 | Odds Ratio (M‐H, Fixed, 95% CI) | 0.0 [0.0, 0.0] | |
| 3.38 PSI‐352938 | 0 | Odds Ratio (M‐H, Fixed, 95% CI) | 0.0 [0.0, 0.0] | |
| 3.39 Samatasvir | 1 | Odds Ratio (M‐H, Fixed, 95% CI) | 0.0 [0.0, 0.0] | |
| 3.40 Setrobuvir | 0 | Odds Ratio (M‐H, Fixed, 95% CI) | 0.0 [0.0, 0.0] | |
| 3.41 Simeprevir | 14 | Odds Ratio (M‐H, Fixed, 95% CI) | 0.0 [0.0, 0.0] | |
| 3.42 Sofosbuvir | 0 | Odds Ratio (M‐H, Fixed, 95% CI) | 0.0 [0.0, 0.0] | |
| 3.43 Sovaprevir | 1 | Odds Ratio (M‐H, Fixed, 95% CI) | 0.0 [0.0, 0.0] | |
| 3.44 Tegobuvir | 0 | Odds Ratio (M‐H, Fixed, 95% CI) | 0.0 [0.0, 0.0] | |
| 3.45 Telaprevir | 0 | Odds Ratio (M‐H, Fixed, 95% CI) | 0.0 [0.0, 0.0] | |
| 3.46 Valopicitabine | 0 | Odds Ratio (M‐H, Fixed, 95% CI) | 0.0 [0.0, 0.0] | |
| 3.47 Vaniprevir | 9 | Odds Ratio (M‐H, Fixed, 95% CI) | 0.0 [0.0, 0.0] | |
| 3.48 VCH‐759 | 0 | Odds Ratio (M‐H, Fixed, 95% CI) | 0.0 [0.0, 0.0] | |
| 3.49 VCH‐916 | 0 | Odds Ratio (M‐H, Fixed, 95% CI) | 0.0 [0.0, 0.0] | |
| 3.50 Velpatasvir | 1 | Odds Ratio (M‐H, Fixed, 95% CI) | 0.0 [0.0, 0.0] | |
| 3.51 VX‐222 | 0 | Odds Ratio (M‐H, Fixed, 95% CI) | 0.0 [0.0, 0.0] | |
| 3.52 Mixed | 4 | Odds Ratio (M‐H, Fixed, 95% CI) | 0.0 [0.0, 0.0] | |
| 4 Hepatitis C‐related morbidity or all‐cause mortality ‐ according to group of DAA Show forest plot | 71 | Odds Ratio (M‐H, Fixed, 95% CI) | Totals not selected | |
| 4.1 Cyclophilin | 3 | Odds Ratio (M‐H, Fixed, 95% CI) | 0.0 [0.0, 0.0] | |
| 4.2 NS3/NS4A inhibitors | 41 | Odds Ratio (M‐H, Fixed, 95% CI) | 0.0 [0.0, 0.0] | |
| 4.3 NS5B inhibitors (NPI) | 3 | Odds Ratio (M‐H, Fixed, 95% CI) | 0.0 [0.0, 0.0] | |
| 4.4 NS5B inhibitors (NNPI) | 3 | Odds Ratio (M‐H, Fixed, 95% CI) | 0.0 [0.0, 0.0] | |
| 4.5 NS5A inhibitors | 18 | Odds Ratio (M‐H, Fixed, 95% CI) | 0.0 [0.0, 0.0] | |
| 4.6 VPU‐ion channel inhibitors | 0 | Odds Ratio (M‐H, Fixed, 95% CI) | 0.0 [0.0, 0.0] | |
| 4.7 Mixed | 3 | Odds Ratio (M‐H, Fixed, 95% CI) | 0.0 [0.0, 0.0] | |
| 5 Hepatitis C‐related morbidity or all‐cause mortality ‐ according to HIV‐infection Show forest plot | 71 | Odds Ratio (M‐H, Fixed, 95% CI) | Totals not selected | |
| 5.1 With HIV‐infection | 0 | Odds Ratio (M‐H, Fixed, 95% CI) | 0.0 [0.0, 0.0] | |
| 5.2 Without HIV‐infection | 69 | Odds Ratio (M‐H, Fixed, 95% CI) | 0.0 [0.0, 0.0] | |
| 5.3 Mixed (with and without HIV‐infection) | 0 | Odds Ratio (M‐H, Fixed, 95% CI) | 0.0 [0.0, 0.0] | |
| 5.4 Unclear | 2 | Odds Ratio (M‐H, Fixed, 95% CI) | 0.0 [0.0, 0.0] | |
| 6 Hepatitis C‐related morbidity or all‐cause mortality ‐ according to comorbidity Show forest plot | 71 | Odds Ratio (M‐H, Fixed, 95% CI) | Totals not selected | |
| 6.1 With comorbidity | 0 | Odds Ratio (M‐H, Fixed, 95% CI) | 0.0 [0.0, 0.0] | |
| 6.2 Without comorbidity | 0 | Odds Ratio (M‐H, Fixed, 95% CI) | 0.0 [0.0, 0.0] | |
| 6.3 Unclear | 71 | Odds Ratio (M‐H, Fixed, 95% CI) | 0.0 [0.0, 0.0] | |
| 7 Hepatitis C‐related morbidity or all‐cause mortality ‐ according to viral genotype Show forest plot | 71 | Odds Ratio (M‐H, Fixed, 95% CI) | Totals not selected | |
| 7.1 Genotype 1 | 57 | Odds Ratio (M‐H, Fixed, 95% CI) | 0.0 [0.0, 0.0] | |
| 7.2 Genotype 2 | 0 | Odds Ratio (M‐H, Fixed, 95% CI) | 0.0 [0.0, 0.0] | |
| 7.3 Genotype 3 | 0 | Odds Ratio (M‐H, Fixed, 95% CI) | 0.0 [0.0, 0.0] | |
| 7.4 Genotype 4 | 0 | Odds Ratio (M‐H, Fixed, 95% CI) | 0.0 [0.0, 0.0] | |
| 7.5 Mixed | 14 | Odds Ratio (M‐H, Fixed, 95% CI) | 0.0 [0.0, 0.0] | |
| 8 Hepatitis C‐related morbidity or all‐cause mortality ‐ according to human genotype (IL28b) Show forest plot | 71 | Odds Ratio (M‐H, Fixed, 95% CI) | Totals not selected | |
| 8.1 IL28b (CC) | 0 | Odds Ratio (M‐H, Fixed, 95% CI) | 0.0 [0.0, 0.0] | |
| 8.2 IL28B (CT) | 0 | Odds Ratio (M‐H, Fixed, 95% CI) | 0.0 [0.0, 0.0] | |
| 8.3 IL28B (TT) | 0 | Odds Ratio (M‐H, Fixed, 95% CI) | 0.0 [0.0, 0.0] | |
| 8.4 IL28B (CT + TT) | 0 | Odds Ratio (M‐H, Fixed, 95% CI) | 0.0 [0.0, 0.0] | |
| 8.5 Mixed | 71 | Odds Ratio (M‐H, Fixed, 95% CI) | 0.0 [0.0, 0.0] | |
| 9 Hepatitis C‐related morbidity or all‐cause mortality ‐ according to Asian‐region Show forest plot | 71 | Odds Ratio (M‐H, Fixed, 95% CI) | Totals not selected | |
| 9.1 From Asian region | 8 | Odds Ratio (M‐H, Fixed, 95% CI) | 0.0 [0.0, 0.0] | |
| 9.2 Not from Asian region | 52 | Odds Ratio (M‐H, Fixed, 95% CI) | 0.0 [0.0, 0.0] | |
| 9.3 Mixed | 11 | Odds Ratio (M‐H, Fixed, 95% CI) | 0.0 [0.0, 0.0] | |
| 9.4 Unclear | 0 | Odds Ratio (M‐H, Fixed, 95% CI) | 0.0 [0.0, 0.0] | |
| 10 Hepatitis C‐related morbidity or all‐cause mortality ‐ according to specific ethnicities Show forest plot | 71 | Odds Ratio (M‐H, Fixed, 95% CI) | Totals not selected | |
| 10.1 White | 1 | Odds Ratio (M‐H, Fixed, 95% CI) | 0.0 [0.0, 0.0] | |
| 10.2 Black | 0 | Odds Ratio (M‐H, Fixed, 95% CI) | 0.0 [0.0, 0.0] | |
| 10.3 Hispanic | 0 | Odds Ratio (M‐H, Fixed, 95% CI) | 0.0 [0.0, 0.0] | |
| 10.4 Mixed | 70 | Odds Ratio (M‐H, Fixed, 95% CI) | 0.0 [0.0, 0.0] | |
| 10.5 Unclear | 0 | Odds Ratio (M‐H, Fixed, 95% CI) | 0.0 [0.0, 0.0] | |
| 11 Hepatitis C‐related morbidity or all‐cause mortality ‐ according to reaching planned sample size Show forest plot | 71 | Odds Ratio (M‐H, Fixed, 95% CI) | Totals not selected | |
| 11.1 Trials reaching planned sample size | 10 | Odds Ratio (M‐H, Fixed, 95% CI) | 0.0 [0.0, 0.0] | |
| 11.2 Trials not reaching planned sample size | 3 | Odds Ratio (M‐H, Fixed, 95% CI) | 0.0 [0.0, 0.0] | |
| 11.3 Unclear | 58 | Odds Ratio (M‐H, Fixed, 95% CI) | 0.0 [0.0, 0.0] | |
| 12 Hepatitis C‐related morbidity or all‐cause mortality ‐ according to prior treatment Show forest plot | 71 | Odds Ratio (M‐H, Fixed, 95% CI) | Totals not selected | |
| 12.1 Treatment‐naive | 47 | Odds Ratio (M‐H, Fixed, 95% CI) | 0.0 [0.0, 0.0] | |
| 12.2 Treatment‐experienced | 16 | Odds Ratio (M‐H, Fixed, 95% CI) | 0.0 [0.0, 0.0] | |
| 12.3 Mixed | 8 | Odds Ratio (M‐H, Fixed, 95% CI) | 0.0 [0.0, 0.0] | |
| 12.4 Unclear | 0 | Odds Ratio (M‐H, Fixed, 95% CI) | 0.0 [0.0, 0.0] | |
| 13 Hepatitis C‐related morbidity or all‐cause mortality ‐ according to interferon Show forest plot | 71 | Odds Ratio (M‐H, Fixed, 95% CI) | Totals not selected | |
| 13.1 Trials where both groups received interferon | 52 | Odds Ratio (M‐H, Fixed, 95% CI) | 0.0 [0.0, 0.0] | |
| 13.2 Trials where neither group received interferon | 19 | Odds Ratio (M‐H, Fixed, 95% CI) | 0.0 [0.0, 0.0] | |
| 14 Hepatitis C‐related morbidity or all‐cause mortality ‐ according to ribavirin Show forest plot | 71 | Odds Ratio (M‐H, Fixed, 95% CI) | Totals not selected | |
| 14.1 Trials where both groups received ribavirin | 52 | Odds Ratio (M‐H, Fixed, 95% CI) | 0.0 [0.0, 0.0] | |
| 14.2 Trials where neither group received ribavirin | 19 | Odds Ratio (M‐H, Fixed, 95% CI) | 0.0 [0.0, 0.0] | |
| 15 Hepatitis C‐related morbidity or all‐cause mortality ‐ according to chronic kidney disease Show forest plot | 71 | Odds Ratio (M‐H, Fixed, 95% CI) | Totals not selected | |
| 15.1 With chronic kidney disease | 0 | Odds Ratio (M‐H, Fixed, 95% CI) | 0.0 [0.0, 0.0] | |
| 15.2 Without chronic kidney disease | 0 | Odds Ratio (M‐H, Fixed, 95% CI) | 0.0 [0.0, 0.0] | |
| 15.3 Unclear | 71 | Odds Ratio (M‐H, Fixed, 95% CI) | 0.0 [0.0, 0.0] | |
| 16 Hepatitis C‐related morbidity or all‐cause mortality ‐ according to cryoglobulinaemia Show forest plot | 71 | Odds Ratio (M‐H, Fixed, 95% CI) | Totals not selected | |
| 16.1 With cryoglobulinaemia | 0 | Odds Ratio (M‐H, Fixed, 95% CI) | 0.0 [0.0, 0.0] | |
| 16.2 Without cryoglobulinaemia | 0 | Odds Ratio (M‐H, Fixed, 95% CI) | 0.0 [0.0, 0.0] | |
| 16.3 Unclear | 71 | Odds Ratio (M‐H, Fixed, 95% CI) | 0.0 [0.0, 0.0] | |
| 17 Hepatitis C‐related morbidity or all‐cause mortality ‐ according to DAA group as co‐intervention Show forest plot | 71 | Odds Ratio (M‐H, Fixed, 95% CI) | Totals not selected | |
| 17.1 Trials where DAA were used as co‐intervention | 2 | Odds Ratio (M‐H, Fixed, 95% CI) | 0.0 [0.0, 0.0] | |
| 17.2 Trials where DAA were not a co‐intervention | 69 | Odds Ratio (M‐H, Fixed, 95% CI) | 0.0 [0.0, 0.0] | |
| 18 Hepatitis C‐related morbidity or all‐cause mortality ‐ according to median dose Show forest plot | 71 | Odds Ratio (M‐H, Fixed, 95% CI) | Totals not selected | |
| 18.1 Over or equal to median dose | 41 | Odds Ratio (M‐H, Fixed, 95% CI) | 0.0 [0.0, 0.0] | |
| 18.2 Under median dose | 27 | Odds Ratio (M‐H, Fixed, 95% CI) | 0.0 [0.0, 0.0] | |
| 18.3 Not available | 3 | Odds Ratio (M‐H, Fixed, 95% CI) | 0.0 [0.0, 0.0] | |
| Outcome or subgroup title | No. of studies | No. of participants | Statistical method | Effect size |
| 1 Serious adverse events Show forest plot | 101 | Odds Ratio (M‐H, Fixed, 95% CI) | Totals not selected | |
| 2 Serious adverse events ‐ bias risk Show forest plot | 101 | Odds Ratio (M‐H, Fixed, 95% CI) | Totals not selected | |
| 2.1 Trials at high risk of bias | 101 | Odds Ratio (M‐H, Fixed, 95% CI) | 0.0 [0.0, 0.0] | |
| 2.2 Trials at low risk of bias | 0 | Odds Ratio (M‐H, Fixed, 95% CI) | 0.0 [0.0, 0.0] | |
| 3 Serious adverse events ‐ according to type of DAA Show forest plot | 101 | Odds Ratio (M‐H, Fixed, 95% CI) | Totals not selected | |
| 3.1 ABT‐072 | 0 | Odds Ratio (M‐H, Fixed, 95% CI) | 0.0 [0.0, 0.0] | |
| 3.2 ACH‐2684 | 0 | Odds Ratio (M‐H, Fixed, 95% CI) | 0.0 [0.0, 0.0] | |
| 3.3 Alisporivir | 3 | Odds Ratio (M‐H, Fixed, 95% CI) | 0.0 [0.0, 0.0] | |
| 3.4 ALS‐2200 | 0 | Odds Ratio (M‐H, Fixed, 95% CI) | 0.0 [0.0, 0.0] | |
| 3.5 Asunaprevir | 6 | Odds Ratio (M‐H, Fixed, 95% CI) | 0.0 [0.0, 0.0] | |
| 3.6 Balapiravir | 0 | Odds Ratio (M‐H, Fixed, 95% CI) | 0.0 [0.0, 0.0] | |
| 3.7 Beclabuvir | 3 | Odds Ratio (M‐H, Fixed, 95% CI) | 0.0 [0.0, 0.0] | |
| 3.8 BILB‐1941 | 0 | Odds Ratio (M‐H, Fixed, 95% CI) | 0.0 [0.0, 0.0] | |
| 3.9 BIT‐225 | 0 | Odds Ratio (M‐H, Fixed, 95% CI) | 0.0 [0.0, 0.0] | |
| 3.10 Boceprevir | 0 | Odds Ratio (M‐H, Fixed, 95% CI) | 0.0 [0.0, 0.0] | |
| 3.11 Ciluprevir | 0 | Odds Ratio (M‐H, Fixed, 95% CI) | 0.0 [0.0, 0.0] | |
| 3.12 Daclatasvir | 14 | Odds Ratio (M‐H, Fixed, 95% CI) | 0.0 [0.0, 0.0] | |
| 3.13 Danoprevir | 9 | Odds Ratio (M‐H, Fixed, 95% CI) | 0.0 [0.0, 0.0] | |
| 3.14 Dasabuvir | 2 | Odds Ratio (M‐H, Fixed, 95% CI) | 0.0 [0.0, 0.0] | |
| 3.15 Deleobuvir | 0 | Odds Ratio (M‐H, Fixed, 95% CI) | 0.0 [0.0, 0.0] | |
| 3.16 Faldaprevir | 0 | Odds Ratio (M‐H, Fixed, 95% CI) | 0.0 [0.0, 0.0] | |
| 3.17 Filibuvir | 0 | Odds Ratio (M‐H, Fixed, 95% CI) | 0.0 [0.0, 0.0] | |
| 3.18 Grazoprevir | 0 | Odds Ratio (M‐H, Fixed, 95% CI) | 0.0 [0.0, 0.0] | |
| 3.19 GS‐6620 | 0 | Odds Ratio (M‐H, Fixed, 95% CI) | 0.0 [0.0, 0.0] | |
| 3.20 GS‐9256 | 0 | Odds Ratio (M‐H, Fixed, 95% CI) | 0.0 [0.0, 0.0] | |
| 3.21 GS‐9451 | 1 | Odds Ratio (M‐H, Fixed, 95% CI) | 0.0 [0.0, 0.0] | |
| 3.22 GS‐9669 | 0 | Odds Ratio (M‐H, Fixed, 95% CI) | 0.0 [0.0, 0.0] | |
| 3.23 GS‐9851 | 1 | Odds Ratio (M‐H, Fixed, 95% CI) | 0.0 [0.0, 0.0] | |
| 3.24 GS‐9857 | 0 | Odds Ratio (M‐H, Fixed, 95% CI) | 0.0 [0.0, 0.0] | |
| 3.25 GSK2336805 | 2 | Odds Ratio (M‐H, Fixed, 95% CI) | 0.0 [0.0, 0.0] | |
| 3.26 GSK2878175 | 0 | Odds Ratio (M‐H, Fixed, 95% CI) | 0.0 [0.0, 0.0] | |
| 3.27 IDX‐184 | 0 | Odds Ratio (M‐H, Fixed, 95% CI) | 0.0 [0.0, 0.0] | |
| 3.28 INX‐08189 | 0 | Odds Ratio (M‐H, Fixed, 95% CI) | 0.0 [0.0, 0.0] | |
| 3.29 Ledispasvir | 1 | Odds Ratio (M‐H, Fixed, 95% CI) | 0.0 [0.0, 0.0] | |
| 3.30 Mericitabine | 7 | Odds Ratio (M‐H, Fixed, 95% CI) | 0.0 [0.0, 0.0] | |
| 3.31 Narlaprevir | 2 | Odds Ratio (M‐H, Fixed, 95% CI) | 0.0 [0.0, 0.0] | |
| 3.32 Nesbuvir | 0 | Odds Ratio (M‐H, Fixed, 95% CI) | 0.0 [0.0, 0.0] | |
| 3.33 Odalasavir | 1 | Odds Ratio (M‐H, Fixed, 95% CI) | 0.0 [0.0, 0.0] | |
| 3.34 Ombitasvir | 1 | Odds Ratio (M‐H, Fixed, 95% CI) | 0.0 [0.0, 0.0] | |
| 3.35 Paritaprevir | 3 | Odds Ratio (M‐H, Fixed, 95% CI) | 0.0 [0.0, 0.0] | |
| 3.36 PHX1766 | 0 | Odds Ratio (M‐H, Fixed, 95% CI) | 0.0 [0.0, 0.0] | |
| 3.37 PPI‐461 | 3 | Odds Ratio (M‐H, Fixed, 95% CI) | 0.0 [0.0, 0.0] | |
| 3.38 PSI‐352938 | 0 | Odds Ratio (M‐H, Fixed, 95% CI) | 0.0 [0.0, 0.0] | |
| 3.39 Samatasvir | 1 | Odds Ratio (M‐H, Fixed, 95% CI) | 0.0 [0.0, 0.0] | |
| 3.40 Setrobuvir | 0 | Odds Ratio (M‐H, Fixed, 95% CI) | 0.0 [0.0, 0.0] | |
| 3.41 Simeprevir | 18 | Odds Ratio (M‐H, Fixed, 95% CI) | 0.0 [0.0, 0.0] | |
| 3.42 Sofosbuvir | 4 | Odds Ratio (M‐H, Fixed, 95% CI) | 0.0 [0.0, 0.0] | |
| 3.43 Sovaprevir | 1 | Odds Ratio (M‐H, Fixed, 95% CI) | 0.0 [0.0, 0.0] | |
| 3.44 Tegobuvir | 0 | Odds Ratio (M‐H, Fixed, 95% CI) | 0.0 [0.0, 0.0] | |
| 3.45 Telaprevir | 0 | Odds Ratio (M‐H, Fixed, 95% CI) | 0.0 [0.0, 0.0] | |
| 3.46 Valopicitabine | 0 | Odds Ratio (M‐H, Fixed, 95% CI) | 0.0 [0.0, 0.0] | |
| 3.47 Vaniprevir | 10 | Odds Ratio (M‐H, Fixed, 95% CI) | 0.0 [0.0, 0.0] | |
| 3.48 VCH‐759 | 0 | Odds Ratio (M‐H, Fixed, 95% CI) | 0.0 [0.0, 0.0] | |
| 3.49 VCH‐916 | 0 | Odds Ratio (M‐H, Fixed, 95% CI) | 0.0 [0.0, 0.0] | |
| 3.50 Velpatasvir | 1 | Odds Ratio (M‐H, Fixed, 95% CI) | 0.0 [0.0, 0.0] | |
| 3.51 VX‐222 | 0 | Odds Ratio (M‐H, Fixed, 95% CI) | 0.0 [0.0, 0.0] | |
| 3.52 Mixed | 7 | Odds Ratio (M‐H, Fixed, 95% CI) | 0.0 [0.0, 0.0] | |
| 4 Serious adverse events ‐ according to group of DAA Show forest plot | 101 | Odds Ratio (M‐H, Fixed, 95% CI) | Totals not selected | |
| 4.1 Cyclophilin | 3 | Odds Ratio (M‐H, Fixed, 95% CI) | 0.0 [0.0, 0.0] | |
| 4.2 NS3/NS4A inhibitors | 56 | Odds Ratio (M‐H, Fixed, 95% CI) | 0.0 [0.0, 0.0] | |
| 4.3 NS5B inhibitors (NPI) | 8 | Odds Ratio (M‐H, Fixed, 95% CI) | 0.0 [0.0, 0.0] | |
| 4.4 NS5B inhibitors (NNPI) | 5 | Odds Ratio (M‐H, Fixed, 95% CI) | 0.0 [0.0, 0.0] | |
| 4.5 NS5A inhibitors | 25 | Odds Ratio (M‐H, Fixed, 95% CI) | 0.0 [0.0, 0.0] | |
| 4.6 VPU‐ion channel inhibitors | 0 | Odds Ratio (M‐H, Fixed, 95% CI) | 0.0 [0.0, 0.0] | |
| 4.7 Mixed | 4 | Odds Ratio (M‐H, Fixed, 95% CI) | 0.0 [0.0, 0.0] | |
| 5 Serious adverse events ‐ according to HIV‐infection Show forest plot | 101 | Odds Ratio (M‐H, Fixed, 95% CI) | Totals not selected | |
| 5.1 With HIV‐infection | 0 | Odds Ratio (M‐H, Fixed, 95% CI) | 0.0 [0.0, 0.0] | |
| 5.2 Without HIV‐infection | 94 | Odds Ratio (M‐H, Fixed, 95% CI) | 0.0 [0.0, 0.0] | |
| 5.3 Mixed (with and without HIV‐infection) | 0 | Odds Ratio (M‐H, Fixed, 95% CI) | 0.0 [0.0, 0.0] | |
| 5.4 Unclear | 7 | Odds Ratio (M‐H, Fixed, 95% CI) | 0.0 [0.0, 0.0] | |
| 6 Serious adverse events ‐ according to comorbidity Show forest plot | 101 | Odds Ratio (M‐H, Fixed, 95% CI) | Totals not selected | |
| 6.1 With comorbidity | 0 | Odds Ratio (M‐H, Fixed, 95% CI) | 0.0 [0.0, 0.0] | |
| 6.2 Without comorbidity | 0 | Odds Ratio (M‐H, Fixed, 95% CI) | 0.0 [0.0, 0.0] | |
| 6.3 Unclear | 101 | Odds Ratio (M‐H, Fixed, 95% CI) | 0.0 [0.0, 0.0] | |
| 7 Serious adverse events ‐ according to viral genotype Show forest plot | 101 | Odds Ratio (M‐H, Fixed, 95% CI) | Totals not selected | |
| 7.1 Genotype 1 | 84 | Odds Ratio (M‐H, Fixed, 95% CI) | 0.0 [0.0, 0.0] | |
| 7.2 Genotype 2 | 0 | Odds Ratio (M‐H, Fixed, 95% CI) | 0.0 [0.0, 0.0] | |
| 7.3 Genotype 3 | 0 | Odds Ratio (M‐H, Fixed, 95% CI) | 0.0 [0.0, 0.0] | |
| 7.4 Genotype 4 | 0 | Odds Ratio (M‐H, Fixed, 95% CI) | 0.0 [0.0, 0.0] | |
| 7.5 Mixed | 17 | Odds Ratio (M‐H, Fixed, 95% CI) | 0.0 [0.0, 0.0] | |
| 8 Serious adverse events ‐ according to human genotype (IL28b) Show forest plot | 101 | Odds Ratio (M‐H, Fixed, 95% CI) | Totals not selected | |
| 8.1 IL28b (CC) | 0 | Odds Ratio (M‐H, Fixed, 95% CI) | 0.0 [0.0, 0.0] | |
| 8.2 IL28B (CT) | 0 | Odds Ratio (M‐H, Fixed, 95% CI) | 0.0 [0.0, 0.0] | |
| 8.3 IL28B (TT) | 0 | Odds Ratio (M‐H, Fixed, 95% CI) | 0.0 [0.0, 0.0] | |
| 8.4 IL28B (CT + TT) | 0 | Odds Ratio (M‐H, Fixed, 95% CI) | 0.0 [0.0, 0.0] | |
| 8.5 Mixed | 101 | Odds Ratio (M‐H, Fixed, 95% CI) | 0.0 [0.0, 0.0] | |
| 9 Serious adverse events ‐ according to Asian‐region Show forest plot | 101 | Odds Ratio (M‐H, Fixed, 95% CI) | Totals not selected | |
| 9.1 From Asian region | 10 | Odds Ratio (M‐H, Fixed, 95% CI) | 0.0 [0.0, 0.0] | |
| 9.2 Not from Asian region | 76 | Odds Ratio (M‐H, Fixed, 95% CI) | 0.0 [0.0, 0.0] | |
| 9.3 Mixed | 11 | Odds Ratio (M‐H, Fixed, 95% CI) | 0.0 [0.0, 0.0] | |
| 9.4 Unclear | 4 | Odds Ratio (M‐H, Fixed, 95% CI) | 0.0 [0.0, 0.0] | |
| 10 Serious adverse events ‐ according to specific ethnicities Show forest plot | 101 | Odds Ratio (M‐H, Fixed, 95% CI) | Totals not selected | |
| 10.1 White | 0 | Odds Ratio (M‐H, Fixed, 95% CI) | 0.0 [0.0, 0.0] | |
| 10.2 Black | 0 | Odds Ratio (M‐H, Fixed, 95% CI) | 0.0 [0.0, 0.0] | |
| 10.3 Hispanic | 0 | Odds Ratio (M‐H, Fixed, 95% CI) | 0.0 [0.0, 0.0] | |
| 10.4 Mixed | 101 | Odds Ratio (M‐H, Fixed, 95% CI) | 0.0 [0.0, 0.0] | |
| 10.5 Unclear | 0 | Odds Ratio (M‐H, Fixed, 95% CI) | 0.0 [0.0, 0.0] | |
| 11 Serious adverse events ‐ according to reaching planned sample size Show forest plot | 101 | Odds Ratio (M‐H, Fixed, 95% CI) | Totals not selected | |
| 11.1 Trials reaching planned sample size | 15 | Odds Ratio (M‐H, Fixed, 95% CI) | 0.0 [0.0, 0.0] | |
| 11.2 Trials not reaching planned sample size | 3 | Odds Ratio (M‐H, Fixed, 95% CI) | 0.0 [0.0, 0.0] | |
| 11.3 Unclear | 83 | Odds Ratio (M‐H, Fixed, 95% CI) | 0.0 [0.0, 0.0] | |
| 12 Serious adverse events ‐ according to prior treatment Show forest plot | 101 | Odds Ratio (M‐H, Fixed, 95% CI) | Totals not selected | |
| 12.1 Treatment‐naive | 72 | Odds Ratio (M‐H, Fixed, 95% CI) | 0.0 [0.0, 0.0] | |
| 12.2 Treatment‐experienced | 19 | Odds Ratio (M‐H, Fixed, 95% CI) | 0.0 [0.0, 0.0] | |
| 12.3 Mixed | 9 | Odds Ratio (M‐H, Fixed, 95% CI) | 0.0 [0.0, 0.0] | |
| 12.4 Unclear | 1 | Odds Ratio (M‐H, Fixed, 95% CI) | 0.0 [0.0, 0.0] | |
| 13 Serious adverse events ‐ according to interferon Show forest plot | 101 | Odds Ratio (M‐H, Fixed, 95% CI) | Totals not selected | |
| 13.1 Trials where both groups received interferon | 69 | Odds Ratio (M‐H, Fixed, 95% CI) | 0.0 [0.0, 0.0] | |
| 13.2 Trials where neither group received interferon | 29 | Odds Ratio (M‐H, Fixed, 95% CI) | 0.0 [0.0, 0.0] | |
| 13.3 Unclear | 3 | Odds Ratio (M‐H, Fixed, 95% CI) | 0.0 [0.0, 0.0] | |
| 14 Serious adverse events ‐ according to ribavirin Show forest plot | 101 | Odds Ratio (M‐H, Fixed, 95% CI) | Totals not selected | |
| 14.1 Trials where both groups received ribavirin | 73 | Odds Ratio (M‐H, Fixed, 95% CI) | 0.0 [0.0, 0.0] | |
| 14.2 Trials where neither group received ribavirin | 27 | Odds Ratio (M‐H, Fixed, 95% CI) | 0.0 [0.0, 0.0] | |
| 14.3 Unclear | 1 | Odds Ratio (M‐H, Fixed, 95% CI) | 0.0 [0.0, 0.0] | |
| 15 Serious adverse events ‐ according to chronic kidney disease Show forest plot | 101 | Odds Ratio (M‐H, Fixed, 95% CI) | Totals not selected | |
| 15.1 With chronic kidney disease | 0 | Odds Ratio (M‐H, Fixed, 95% CI) | 0.0 [0.0, 0.0] | |
| 15.2 Without chronic kidney disease | 0 | Odds Ratio (M‐H, Fixed, 95% CI) | 0.0 [0.0, 0.0] | |
| 15.3 Unclear | 101 | Odds Ratio (M‐H, Fixed, 95% CI) | 0.0 [0.0, 0.0] | |
| 16 Serious adverse events ‐ according to cryoglobulinaemia Show forest plot | 101 | Odds Ratio (M‐H, Fixed, 95% CI) | Totals not selected | |
| 16.1 With cryoglobulinaemia | 0 | Odds Ratio (M‐H, Fixed, 95% CI) | 0.0 [0.0, 0.0] | |
| 16.2 Without cryoglobulinaemia | 0 | Odds Ratio (M‐H, Fixed, 95% CI) | 0.0 [0.0, 0.0] | |
| 16.3 Unclear | 101 | Odds Ratio (M‐H, Fixed, 95% CI) | 0.0 [0.0, 0.0] | |
| 17 Serious adverse events ‐ according to DAA group as co‐intervention Show forest plot | 101 | Odds Ratio (M‐H, Fixed, 95% CI) | Totals not selected | |
| 17.1 Trials where DAA were used as co‐intervention | 2 | Odds Ratio (M‐H, Fixed, 95% CI) | 0.0 [0.0, 0.0] | |
| 17.2 Trials where DAA were not a co‐intervention | 99 | Odds Ratio (M‐H, Fixed, 95% CI) | 0.0 [0.0, 0.0] | |
| 18 Serious adverse events ‐ according to median dose Show forest plot | 101 | Odds Ratio (M‐H, Fixed, 95% CI) | Totals not selected | |
| 18.1 Over or equal to median dose | 58 | Odds Ratio (M‐H, Fixed, 95% CI) | 0.0 [0.0, 0.0] | |
| 18.2 Under median dose | 37 | Odds Ratio (M‐H, Fixed, 95% CI) | 0.0 [0.0, 0.0] | |
| 18.3 Not available | 6 | Odds Ratio (M‐H, Fixed, 95% CI) | 0.0 [0.0, 0.0] | |
| Outcome or subgroup title | No. of studies | No. of participants | Statistical method | Effect size |
| 1 Without sustained virological response Show forest plot | 61 | 7115 | Risk Ratio (M‐H, Random, 95% CI) | 0.44 [0.37, 0.52] |
| 2 Without sustained virological response ‐ bias risk Show forest plot | 61 | 7115 | Odds Ratio (M‐H, Fixed, 95% CI) | 0.24 [0.22, 0.27] |
| 2.1 Trials at high risk of bias | 61 | 7115 | Odds Ratio (M‐H, Fixed, 95% CI) | 0.24 [0.22, 0.27] |
| 2.2 Trials at low risk of bias | 0 | 0 | Odds Ratio (M‐H, Fixed, 95% CI) | 0.0 [0.0, 0.0] |
| 3 Without sustained virological response ‐ according to type of DAA Show forest plot | 61 | 7115 | Risk Ratio (M‐H, Random, 95% CI) | 0.44 [0.37, 0.52] |
| 3.1 ABT‐072 | 0 | 0 | Risk Ratio (M‐H, Random, 95% CI) | 0.0 [0.0, 0.0] |
| 3.2 ACH‐2684 | 0 | 0 | Risk Ratio (M‐H, Random, 95% CI) | 0.0 [0.0, 0.0] |
| 3.3 Alisporivir | 0 | 0 | Risk Ratio (M‐H, Random, 95% CI) | 0.0 [0.0, 0.0] |
| 3.4 ALS‐2200 | 0 | 0 | Risk Ratio (M‐H, Random, 95% CI) | 0.0 [0.0, 0.0] |
| 3.5 Asunaprevir | 4 | 285 | Risk Ratio (M‐H, Random, 95% CI) | 0.49 [0.29, 0.85] |
| 3.6 Balapiravir | 0 | 0 | Risk Ratio (M‐H, Random, 95% CI) | 0.0 [0.0, 0.0] |
| 3.7 Beclabuvir | 2 | 39 | Risk Ratio (M‐H, Random, 95% CI) | 0.78 [0.43, 1.40] |
| 3.8 BILB‐1941 | 0 | 0 | Risk Ratio (M‐H, Random, 95% CI) | 0.0 [0.0, 0.0] |
| 3.9 BIT‐225 | 1 | 23 | Risk Ratio (M‐H, Random, 95% CI) | 0.27 [0.03, 2.51] |
| 3.10 Boceprevir | 1 | 229 | Risk Ratio (M‐H, Random, 95% CI) | 0.42 [0.29, 0.61] |
| 3.11 Ciluprevir | 0 | 0 | Risk Ratio (M‐H, Random, 95% CI) | 0.0 [0.0, 0.0] |
| 3.12 Daclatasvir | 7 | 619 | Risk Ratio (M‐H, Random, 95% CI) | 0.60 [0.50, 0.73] |
| 3.13 Danoprevir | 5 | 642 | Risk Ratio (M‐H, Random, 95% CI) | 0.38 [0.28, 0.51] |
| 3.14 Dasabuvir | 0 | 0 | Risk Ratio (M‐H, Random, 95% CI) | 0.0 [0.0, 0.0] |
| 3.15 Deleobuvir | 0 | 0 | Risk Ratio (M‐H, Random, 95% CI) | 0.0 [0.0, 0.0] |
| 3.16 Faldaprevir | 0 | 0 | Risk Ratio (M‐H, Random, 95% CI) | 0.0 [0.0, 0.0] |
| 3.17 Filibuvir | 0 | 0 | Risk Ratio (M‐H, Random, 95% CI) | 0.0 [0.0, 0.0] |
| 3.18 Grazoprevir | 0 | 0 | Risk Ratio (M‐H, Random, 95% CI) | 0.0 [0.0, 0.0] |
| 3.19 GS‐6620 | 0 | 0 | Risk Ratio (M‐H, Random, 95% CI) | 0.0 [0.0, 0.0] |
| 3.20 GS‐9256 | 0 | 0 | Risk Ratio (M‐H, Random, 95% CI) | 0.0 [0.0, 0.0] |
| 3.21 GS‐9451 | 1 | 329 | Risk Ratio (M‐H, Random, 95% CI) | 0.42 [0.26, 0.67] |
| 3.22 GS‐9669 | 0 | 0 | Risk Ratio (M‐H, Random, 95% CI) | 0.0 [0.0, 0.0] |
| 3.23 GS‐9851 | 0 | 0 | Risk Ratio (M‐H, Random, 95% CI) | 0.0 [0.0, 0.0] |
| 3.24 GS‐9857 | 0 | 0 | Risk Ratio (M‐H, Random, 95% CI) | 0.0 [0.0, 0.0] |
| 3.25 GSK2336805 | 0 | 0 | Risk Ratio (M‐H, Random, 95% CI) | 0.0 [0.0, 0.0] |
| 3.26 GSK2878175 | 0 | 0 | Risk Ratio (M‐H, Random, 95% CI) | 0.0 [0.0, 0.0] |
| 3.27 IDX‐184 | 0 | 0 | Risk Ratio (M‐H, Random, 95% CI) | 0.0 [0.0, 0.0] |
| 3.28 INX‐08189 | 0 | 0 | Risk Ratio (M‐H, Random, 95% CI) | 0.0 [0.0, 0.0] |
| 3.29 Ledispasvir | 0 | 0 | Risk Ratio (M‐H, Random, 95% CI) | 0.0 [0.0, 0.0] |
| 3.30 Mericitabine | 4 | 725 | Risk Ratio (M‐H, Random, 95% CI) | 0.78 [0.49, 1.27] |
| 3.31 Narlaprevir | 2 | 40 | Risk Ratio (M‐H, Random, 95% CI) | 0.69 [0.43, 1.09] |
| 3.32 Nesbuvir | 0 | 0 | Risk Ratio (M‐H, Random, 95% CI) | 0.0 [0.0, 0.0] |
| 3.33 Odalasavir | 0 | 0 | Risk Ratio (M‐H, Random, 95% CI) | 0.0 [0.0, 0.0] |
| 3.34 Ombitasvir | 1 | 37 | Risk Ratio (M‐H, Random, 95% CI) | 0.64 [0.39, 1.07] |
| 3.35 Paritaprevir | 0 | 0 | Risk Ratio (M‐H, Random, 95% CI) | 0.0 [0.0, 0.0] |
| 3.36 PHX1766 | 0 | 0 | Risk Ratio (M‐H, Random, 95% CI) | 0.0 [0.0, 0.0] |
| 3.37 PPI‐461 | 0 | 0 | Risk Ratio (M‐H, Random, 95% CI) | 0.0 [0.0, 0.0] |
| 3.38 PSI‐352938 | 0 | 0 | Risk Ratio (M‐H, Random, 95% CI) | 0.0 [0.0, 0.0] |
| 3.39 Samatasvir | 0 | 0 | Risk Ratio (M‐H, Random, 95% CI) | 0.0 [0.0, 0.0] |
| 3.40 Setrobuvir | 0 | 0 | Risk Ratio (M‐H, Random, 95% CI) | 0.0 [0.0, 0.0] |
| 3.41 Simeprevir | 19 | 2898 | Risk Ratio (M‐H, Random, 95% CI) | 0.39 [0.33, 0.46] |
| 3.42 Sofosbuvir | 3 | 181 | Risk Ratio (M‐H, Random, 95% CI) | 0.34 [0.20, 0.58] |
| 3.43 Sovaprevir | 0 | 0 | Risk Ratio (M‐H, Random, 95% CI) | 0.0 [0.0, 0.0] |
| 3.44 Tegobuvir | 0 | 0 | Risk Ratio (M‐H, Random, 95% CI) | 0.0 [0.0, 0.0] |
| 3.45 Telaprevir | 0 | 0 | Risk Ratio (M‐H, Random, 95% CI) | 0.0 [0.0, 0.0] |
| 3.46 Valopicitabine | 0 | 0 | Risk Ratio (M‐H, Random, 95% CI) | 0.0 [0.0, 0.0] |
| 3.47 Vaniprevir | 9 | 333 | Risk Ratio (M‐H, Random, 95% CI) | 0.33 [0.25, 0.43] |
| 3.48 VCH‐759 | 0 | 0 | Risk Ratio (M‐H, Random, 95% CI) | 0.0 [0.0, 0.0] |
| 3.49 VCH‐916 | 0 | 0 | Risk Ratio (M‐H, Random, 95% CI) | 0.0 [0.0, 0.0] |
| 3.50 Velpatasvir | 0 | 0 | Risk Ratio (M‐H, Random, 95% CI) | 0.0 [0.0, 0.0] |
| 3.51 VX‐222 | 0 | 0 | Risk Ratio (M‐H, Random, 95% CI) | 0.0 [0.0, 0.0] |
| 3.52 Mixed | 2 | 735 | Risk Ratio (M‐H, Random, 95% CI) | 0.06 [0.00, 7.05] |
| 4 Without sustained virological response ‐ according to group of DAA Show forest plot | 61 | 7115 | Risk Ratio (M‐H, Random, 95% CI) | 0.44 [0.37, 0.52] |
| 4.1 Cyclophilin | 0 | 0 | Risk Ratio (M‐H, Random, 95% CI) | 0.0 [0.0, 0.0] |
| 4.2 NS3/NS4A inhibitors | 41 | 4756 | Risk Ratio (M‐H, Random, 95% CI) | 0.41 [0.36, 0.46] |
| 4.3 NS5B inhibitors (NPI) | 7 | 906 | Risk Ratio (M‐H, Random, 95% CI) | 0.57 [0.36, 0.90] |
| 4.4 NS5B inhibitors (NNPI) | 2 | 39 | Risk Ratio (M‐H, Random, 95% CI) | 0.78 [0.43, 1.40] |
| 4.5 NS5A inhibitors | 9 | 686 | Risk Ratio (M‐H, Random, 95% CI) | 0.59 [0.49, 0.69] |
| 4.6 VPU‐ion channel inhibitors | 1 | 23 | Risk Ratio (M‐H, Random, 95% CI) | 0.27 [0.03, 2.51] |
| 4.7 Mixed | 1 | 705 | Risk Ratio (M‐H, Random, 95% CI) | 0.01 [0.00, 0.02] |
| 5 Without sustained virological response ‐ according to HIV‐infection Show forest plot | 61 | 7115 | Risk Ratio (M‐H, Random, 95% CI) | 0.44 [0.37, 0.52] |
| 5.1 With HIV‐infection | 0 | 0 | Risk Ratio (M‐H, Random, 95% CI) | 0.0 [0.0, 0.0] |
| 5.2 Without HIV‐infection | 58 | 6726 | Risk Ratio (M‐H, Random, 95% CI) | 0.44 [0.37, 0.52] |
| 5.3 Mixed (with and without HIV‐infection) | 0 | 0 | Risk Ratio (M‐H, Random, 95% CI) | 0.0 [0.0, 0.0] |
| 5.4 Unclear | 3 | 389 | Risk Ratio (M‐H, Random, 95% CI) | 0.50 [0.35, 0.72] |
| 6 Without sustained virological response ‐ according to comorbidity Show forest plot | 61 | 7115 | Odds Ratio (M‐H, Fixed, 95% CI) | 0.24 [0.22, 0.27] |
| 6.1 With comorbidity | 0 | 0 | Odds Ratio (M‐H, Fixed, 95% CI) | 0.0 [0.0, 0.0] |
| 6.2 Without comorbidity | 61 | 7115 | Odds Ratio (M‐H, Fixed, 95% CI) | 0.24 [0.22, 0.27] |
| 6.3 Unclear | 0 | 0 | Odds Ratio (M‐H, Fixed, 95% CI) | 0.0 [0.0, 0.0] |
| 7 Without sustained virological response ‐ according to viral genotype Show forest plot | 58 | 7098 | Risk Ratio (M‐H, Random, 95% CI) | 0.43 [0.36, 0.51] |
| 7.1 Genotype 1 | 54 | 5984 | Risk Ratio (M‐H, Random, 95% CI) | 0.43 [0.37, 0.50] |
| 7.2 Genotype 2 | 3 | 185 | Risk Ratio (M‐H, Random, 95% CI) | 0.14 [0.01, 3.21] |
| 7.3 Genotype 3 | 2 | 80 | Risk Ratio (M‐H, Random, 95% CI) | 0.79 [0.43, 1.43] |
| 7.4 Genotype 4 | 5 | 226 | Risk Ratio (M‐H, Random, 95% CI) | 0.10 [0.02, 0.68] |
| 7.5 Genotype 6 | 1 | 49 | Risk Ratio (M‐H, Random, 95% CI) | 0.01 [0.00, 0.20] |
| 7.6 Mixed | 2 | 574 | Risk Ratio (M‐H, Random, 95% CI) | 0.92 [0.52, 1.62] |
| 8 Without sustained virological response ‐ according to human genotype (IL28b) Show forest plot | 58 | 6745 | Risk Ratio (M‐H, Random, 95% CI) | 0.46 [0.40, 0.54] |
| 8.1 IL28b (CC) | 25 | 1444 | Risk Ratio (M‐H, Random, 95% CI) | 0.42 [0.29, 0.61] |
| 8.2 IL28B (CT) | 10 | 1304 | Risk Ratio (M‐H, Random, 95% CI) | 0.52 [0.42, 0.66] |
| 8.3 IL28B (TT) | 10 | 359 | Risk Ratio (M‐H, Random, 95% CI) | 0.54 [0.44, 0.67] |
| 8.4 IL28B (CT + TT) | 14 | 1798 | Risk Ratio (M‐H, Random, 95% CI) | 0.37 [0.23, 0.57] |
| 8.5 Unclear | 7 | 147 | Risk Ratio (M‐H, Random, 95% CI) | 0.47 [0.33, 0.68] |
| 8.6 Mixed | 26 | 1693 | Risk Ratio (M‐H, Random, 95% CI) | 0.51 [0.40, 0.63] |
| 9 Without sustained virological response ‐ according to Asian‐region Show forest plot | 61 | 7115 | Risk Ratio (M‐H, Random, 95% CI) | 0.44 [0.37, 0.52] |
| 9.1 From Asian region | 10 | 1128 | Risk Ratio (M‐H, Random, 95% CI) | 0.34 [0.28, 0.42] |
| 9.2 Not from Asian region | 42 | 4910 | Risk Ratio (M‐H, Random, 95% CI) | 0.51 [0.43, 0.60] |
| 9.3 Mixed | 7 | 1010 | Risk Ratio (M‐H, Random, 95% CI) | 0.19 [0.03, 1.17] |
| 9.4 Unclear | 2 | 67 | Risk Ratio (M‐H, Random, 95% CI) | 0.53 [0.35, 0.79] |
| 10 Without sustained virological response ‐ according to specific ethnicities Show forest plot | 61 | 7115 | Odds Ratio (M‐H, Fixed, 95% CI) | 0.24 [0.22, 0.27] |
| 10.1 White | 2 | 412 | Odds Ratio (M‐H, Fixed, 95% CI) | 0.24 [0.15, 0.38] |
| 10.2 Black | 0 | 0 | Odds Ratio (M‐H, Fixed, 95% CI) | 0.0 [0.0, 0.0] |
| 10.3 Hispanic | 0 | 0 | Odds Ratio (M‐H, Fixed, 95% CI) | 0.0 [0.0, 0.0] |
| 10.4 Mixed | 48 | 5384 | Odds Ratio (M‐H, Fixed, 95% CI) | 0.23 [0.20, 0.27] |
| 10.5 Unclear | 9 | 862 | Odds Ratio (M‐H, Fixed, 95% CI) | 0.28 [0.20, 0.39] |
| 10.6 Asian | 2 | 457 | Odds Ratio (M‐H, Fixed, 95% CI) | 0.38 [0.23, 0.63] |
| 11 Without sustained virological response ‐ according to reaching planned sample size Show forest plot | 61 | 7115 | Odds Ratio (M‐H, Fixed, 95% CI) | 0.24 [0.22, 0.27] |
| 11.1 Trials reaching planned sample size | 13 | 3071 | Odds Ratio (M‐H, Fixed, 95% CI) | 0.21 [0.18, 0.25] |
| 11.2 Trials not reaching planned sample size | 0 | 0 | Odds Ratio (M‐H, Fixed, 95% CI) | 0.0 [0.0, 0.0] |
| 11.3 Unclear | 48 | 4044 | Odds Ratio (M‐H, Fixed, 95% CI) | 0.28 [0.23, 0.33] |
| 12 Without sustained virological response ‐ according to prior treatment Show forest plot | 61 | 7115 | Risk Ratio (M‐H, Random, 95% CI) | 0.44 [0.37, 0.52] |
| 12.1 Treatment‐naive | 44 | 4777 | Risk Ratio (M‐H, Random, 95% CI) | 0.48 [0.41, 0.56] |
| 12.2 Treatment‐experienced | 13 | 1274 | Risk Ratio (M‐H, Random, 95% CI) | 0.50 [0.36, 0.69] |
| 12.3 Mixed | 4 | 1064 | Risk Ratio (M‐H, Random, 95% CI) | 0.15 [0.02, 0.96] |
| 12.4 Unclear | 0 | 0 | Risk Ratio (M‐H, Random, 95% CI) | 0.0 [0.0, 0.0] |
| 13 Without sustained virological response ‐ according to interferon Show forest plot | 61 | 7115 | Risk Ratio (M‐H, Random, 95% CI) | 0.44 [0.37, 0.52] |
| 13.1 Trials where both groups received interferon | 57 | 6229 | Risk Ratio (M‐H, Random, 95% CI) | 0.47 [0.41, 0.54] |
| 13.2 Trials where neither group received interferon | 2 | 735 | Risk Ratio (M‐H, Random, 95% CI) | 0.06 [0.00, 7.05] |
| 13.3 Trials where only the experimental group received interferon | 0 | 0 | Risk Ratio (M‐H, Random, 95% CI) | 0.0 [0.0, 0.0] |
| 13.4 Trials where only the control group received interferon | 0 | 0 | Risk Ratio (M‐H, Random, 95% CI) | 0.0 [0.0, 0.0] |
| 13.5 Mixed | 2 | 151 | Risk Ratio (M‐H, Random, 95% CI) | 0.58 [0.15, 2.30] |
| 14 Without sustained virological response ‐ according to ribavirin Show forest plot | 61 | 7115 | Risk Ratio (M‐H, Random, 95% CI) | 0.44 [0.37, 0.52] |
| 14.1 Trials where both groups received ribavirin | 60 | 6410 | Risk Ratio (M‐H, Random, 95% CI) | 0.47 [0.41, 0.55] |
| 14.2 Trials where neither group received ribavirin | 1 | 705 | Risk Ratio (M‐H, Random, 95% CI) | 0.01 [0.00, 0.02] |
| 14.3 Trials where only the experimental group received ribavirin | 0 | 0 | Risk Ratio (M‐H, Random, 95% CI) | 0.0 [0.0, 0.0] |
| 14.4 Trials where only the control group received ribavirin | 0 | 0 | Risk Ratio (M‐H, Random, 95% CI) | 0.0 [0.0, 0.0] |
| 15 Without sustained virological response ‐ according to chronic kidney disease Show forest plot | 61 | 7115 | Odds Ratio (M‐H, Fixed, 95% CI) | 0.24 [0.22, 0.27] |
| 15.1 With chronic kidney disease | 0 | 0 | Odds Ratio (M‐H, Fixed, 95% CI) | 0.0 [0.0, 0.0] |
| 15.2 Without chronic kidney disease | 0 | 0 | Odds Ratio (M‐H, Fixed, 95% CI) | 0.0 [0.0, 0.0] |
| 15.3 Unclear | 61 | 7115 | Odds Ratio (M‐H, Fixed, 95% CI) | 0.24 [0.22, 0.27] |
| 16 Without sustained virological response ‐ according to cryoglobulinaemia Show forest plot | 61 | 7115 | Odds Ratio (M‐H, Fixed, 95% CI) | 0.24 [0.22, 0.27] |
| 16.1 With cryoglobulinaemia | 0 | 0 | Odds Ratio (M‐H, Fixed, 95% CI) | 0.0 [0.0, 0.0] |
| 16.2 Without cryoglobulinaemia | 0 | 0 | Odds Ratio (M‐H, Fixed, 95% CI) | 0.0 [0.0, 0.0] |
| 16.3 Unclear | 61 | 7115 | Odds Ratio (M‐H, Fixed, 95% CI) | 0.24 [0.22, 0.27] |
| 17 Without sustained virological response ‐ according to DAA group as co‐intervention Show forest plot | 61 | 7115 | Odds Ratio (M‐H, Fixed, 95% CI) | 0.24 [0.22, 0.27] |
| 17.1 Trials where DAA were used as co‐intervention | 3 | 480 | Odds Ratio (M‐H, Fixed, 95% CI) | 0.42 [0.27, 0.66] |
| 17.2 Trials where DAA were not a co‐intervention | 58 | 6635 | Odds Ratio (M‐H, Fixed, 95% CI) | 0.23 [0.21, 0.26] |
| 18 Without sustained virological response ‐ 'Best‐worst case' scenario Show forest plot | 61 | 7294 | Risk Ratio (M‐H, Random, 95% CI) | 0.41 [0.34, 0.49] |
| 19 Without sustained virological response ‐ 'Worst‐best case' scenario Show forest plot | 61 | 7294 | Risk Ratio (M‐H, Random, 95% CI) | 0.51 [0.43, 0.60] |
| 20 Without sustained virological response ‐ according to median dose Show forest plot | 61 | 7115 | Risk Ratio (M‐H, Random, 95% CI) | 0.44 [0.37, 0.52] |
| 20.1 Over or equal to median dose | 34 | 4154 | Risk Ratio (M‐H, Random, 95% CI) | 0.41 [0.32, 0.53] |
| 20.2 Under median dose | 23 | 2086 | Risk Ratio (M‐H, Random, 95% CI) | 0.46 [0.39, 0.55] |
| 20.3 Not available | 4 | 875 | Risk Ratio (M‐H, Random, 95% CI) | 0.62 [0.26, 1.47] |
| Outcome or subgroup title | No. of studies | No. of participants | Statistical method | Effect size |
| 1 Hepatitis C‐related morbidity or all‐cause mortality Show forest plot | 9 | 781 | Odds Ratio (M‐H, Fixed, 95% CI) | 0.56 [0.06, 5.19] |
| 2 Hepatitis C‐related morbidity or all‐cause mortality ‐ according to dose Show forest plot | 9 | 781 | Odds Ratio (M‐H, Fixed, 95% CI) | 0.56 [0.06, 5.19] |
| 2.1 Over or equal to median dose | 6 | 606 | Odds Ratio (M‐H, Fixed, 95% CI) | 0.56 [0.06, 5.19] |
| 2.2 Under median dose | 3 | 175 | Odds Ratio (M‐H, Fixed, 95% CI) | 0.0 [0.0, 0.0] |
| 2.3 Not available | 0 | 0 | Odds Ratio (M‐H, Fixed, 95% CI) | 0.0 [0.0, 0.0] |
| 3 Serious adverse events Show forest plot | 9 | Odds Ratio (M‐H, Fixed, 95% CI) | Totals not selected | |
| 4 Serious adverse events ‐ according to median dose Show forest plot | 9 | Odds Ratio (M‐H, Fixed, 95% CI) | Totals not selected | |
| 4.1 Over or equal to median dose | 6 | Odds Ratio (M‐H, Fixed, 95% CI) | 0.0 [0.0, 0.0] | |
| 4.2 Under median dose | 3 | Odds Ratio (M‐H, Fixed, 95% CI) | 0.0 [0.0, 0.0] | |
| 4.3 Not available | 0 | Odds Ratio (M‐H, Fixed, 95% CI) | 0.0 [0.0, 0.0] | |
| 5 Without sustained virological response Show forest plot | 5 | 642 | Odds Ratio (M‐H, Fixed, 95% CI) | 0.19 [0.12, 0.32] |
| 6 Without sustained virological response ‐ according to median dose Show forest plot | 5 | 642 | Odds Ratio (M‐H, Fixed, 95% CI) | 0.19 [0.12, 0.32] |
| 6.1 Over or equal to median dose | 4 | 537 | Odds Ratio (M‐H, Fixed, 95% CI) | 0.18 [0.11, 0.32] |
| 6.2 Under median dose | 1 | 105 | Odds Ratio (M‐H, Fixed, 95% CI) | 0.27 [0.07, 0.99] |
| 6.3 Not available | 0 | 0 | Odds Ratio (M‐H, Fixed, 95% CI) | 0.0 [0.0, 0.0] |
| Outcome or subgroup title | No. of studies | No. of participants | Statistical method | Effect size |
| 1 Hepatitis C‐related morbidity or all‐cause mortality Show forest plot | 95 | Odds Ratio (M‐H, Fixed, 95% CI) | Totals not selected | |
| 1.1 Trials assessing DAAs on or on the way to the market | 71 | Odds Ratio (M‐H, Fixed, 95% CI) | 0.0 [0.0, 0.0] | |
| 1.2 Trials assessing DAAs withdrawn from market | 22 | Odds Ratio (M‐H, Fixed, 95% CI) | 0.0 [0.0, 0.0] | |
| 1.3 Trials using other medical intervention as control group | 3 | Odds Ratio (M‐H, Fixed, 95% CI) | 0.0 [0.0, 0.0] | |
| 1.4 Trials using other medical intervention as experimental group | 1 | Odds Ratio (M‐H, Fixed, 95% CI) | 0.0 [0.0, 0.0] | |
| 2 Hepatitis C‐related morbidity or all‐cause mortality ‐ drugs not discontinued | 0 | 0 | Odds Ratio (M‐H, Fixed, 95% CI) | 0.0 [0.0, 0.0] |
| 2.1 Trials assessing discontinued drugs | 0 | 0 | Odds Ratio (M‐H, Fixed, 95% CI) | 0.0 [0.0, 0.0] |
| 2.2 Trials assessing drugs still used | 0 | 0 | Odds Ratio (M‐H, Fixed, 95% CI) | 0.0 [0.0, 0.0] |
| 3 Hepatitis C‐related morbidity or all‐cause mortality ‐ bias risk | 0 | 0 | Odds Ratio (M‐H, Fixed, 95% CI) | 0.0 [0.0, 0.0] |
| 3.1 Trials with a high risk of bias | 0 | 0 | Odds Ratio (M‐H, Fixed, 95% CI) | 0.0 [0.0, 0.0] |
| 3.2 Trials with a low risk of bias | 0 | 0 | Odds Ratio (M‐H, Fixed, 95% CI) | 0.0 [0.0, 0.0] |
| 4 Hepatitis C‐related morbidity or all‐cause mortality ‐ according to type of DAA | 0 | 0 | Odds Ratio (M‐H, Fixed, 95% CI) | 0.0 [0.0, 0.0] |
| 4.1 ABT‐072 | 0 | 0 | Odds Ratio (M‐H, Fixed, 95% CI) | 0.0 [0.0, 0.0] |
| 4.2 ACH‐2684 | 0 | 0 | Odds Ratio (M‐H, Fixed, 95% CI) | 0.0 [0.0, 0.0] |
| 4.3 Alisporivir | 0 | 0 | Odds Ratio (M‐H, Fixed, 95% CI) | 0.0 [0.0, 0.0] |
| 4.4 ALS‐2200 | 0 | 0 | Odds Ratio (M‐H, Fixed, 95% CI) | 0.0 [0.0, 0.0] |
| 4.5 Asunaprevir | 0 | 0 | Odds Ratio (M‐H, Fixed, 95% CI) | 0.0 [0.0, 0.0] |
| 4.6 Balapiravir | 0 | 0 | Odds Ratio (M‐H, Fixed, 95% CI) | 0.0 [0.0, 0.0] |
| 4.7 Beclabuvir | 0 | 0 | Odds Ratio (M‐H, Fixed, 95% CI) | 0.0 [0.0, 0.0] |
| 4.8 BILB‐1941 | 0 | 0 | Odds Ratio (M‐H, Fixed, 95% CI) | 0.0 [0.0, 0.0] |
| 4.9 BIT‐225 | 0 | 0 | Odds Ratio (M‐H, Fixed, 95% CI) | 0.0 [0.0, 0.0] |
| 4.10 Boceprevir | 0 | 0 | Odds Ratio (M‐H, Fixed, 95% CI) | 0.0 [0.0, 0.0] |
| 4.11 Ciluprevir | 0 | 0 | Odds Ratio (M‐H, Fixed, 95% CI) | 0.0 [0.0, 0.0] |
| 4.12 Daclatasvir | 0 | 0 | Odds Ratio (M‐H, Fixed, 95% CI) | 0.0 [0.0, 0.0] |
| 4.13 Danoprevir | 0 | 0 | Odds Ratio (M‐H, Fixed, 95% CI) | 0.0 [0.0, 0.0] |
| 4.14 Dasabuvir | 0 | 0 | Odds Ratio (M‐H, Fixed, 95% CI) | 0.0 [0.0, 0.0] |
| 4.15 Deleobuvir | 0 | 0 | Odds Ratio (M‐H, Fixed, 95% CI) | 0.0 [0.0, 0.0] |
| 4.16 Faldaprevir | 0 | 0 | Odds Ratio (M‐H, Fixed, 95% CI) | 0.0 [0.0, 0.0] |
| 4.17 Filibuvir | 0 | 0 | Odds Ratio (M‐H, Fixed, 95% CI) | 0.0 [0.0, 0.0] |
| 4.18 Grazoprevir | 0 | 0 | Odds Ratio (M‐H, Fixed, 95% CI) | 0.0 [0.0, 0.0] |
| 4.19 GS‐6620 | 0 | 0 | Odds Ratio (M‐H, Fixed, 95% CI) | 0.0 [0.0, 0.0] |
| 4.20 GS‐9256 | 0 | 0 | Odds Ratio (M‐H, Fixed, 95% CI) | 0.0 [0.0, 0.0] |
| 4.21 GS‐9451 | 0 | 0 | Odds Ratio (M‐H, Fixed, 95% CI) | 0.0 [0.0, 0.0] |
| 4.22 GS‐9669 | 0 | 0 | Odds Ratio (M‐H, Fixed, 95% CI) | 0.0 [0.0, 0.0] |
| 4.23 GS‐9851 | 0 | 0 | Odds Ratio (M‐H, Fixed, 95% CI) | 0.0 [0.0, 0.0] |
| 4.24 GS‐9857 | 0 | 0 | Odds Ratio (M‐H, Fixed, 95% CI) | 0.0 [0.0, 0.0] |
| 4.25 GSK2336805 | 0 | 0 | Odds Ratio (M‐H, Fixed, 95% CI) | 0.0 [0.0, 0.0] |
| 4.26 GSK2878175 | 0 | 0 | Odds Ratio (M‐H, Fixed, 95% CI) | 0.0 [0.0, 0.0] |
| 4.27 IDX‐184 | 0 | 0 | Odds Ratio (M‐H, Fixed, 95% CI) | 0.0 [0.0, 0.0] |
| 4.28 INX‐08189 | 0 | 0 | Odds Ratio (M‐H, Fixed, 95% CI) | 0.0 [0.0, 0.0] |
| 4.29 Ledispasvir | 0 | 0 | Odds Ratio (M‐H, Fixed, 95% CI) | 0.0 [0.0, 0.0] |
| 4.30 Mericitabine | 0 | 0 | Odds Ratio (M‐H, Fixed, 95% CI) | 0.0 [0.0, 0.0] |
| 4.31 Narlaprevir | 0 | 0 | Odds Ratio (M‐H, Fixed, 95% CI) | 0.0 [0.0, 0.0] |
| 4.32 Nesbuvir | 0 | 0 | Odds Ratio (M‐H, Fixed, 95% CI) | 0.0 [0.0, 0.0] |
| 4.33 Odalasavir | 0 | 0 | Odds Ratio (M‐H, Fixed, 95% CI) | 0.0 [0.0, 0.0] |
| 4.34 Ombitasvir | 0 | 0 | Odds Ratio (M‐H, Fixed, 95% CI) | 0.0 [0.0, 0.0] |
| 4.35 Paritaprevir | 0 | 0 | Odds Ratio (M‐H, Fixed, 95% CI) | 0.0 [0.0, 0.0] |
| 4.36 PHX1766 | 0 | 0 | Odds Ratio (M‐H, Fixed, 95% CI) | 0.0 [0.0, 0.0] |
| 4.37 PPI‐461 | 0 | 0 | Odds Ratio (M‐H, Fixed, 95% CI) | 0.0 [0.0, 0.0] |
| 4.38 PSI‐352938 | 0 | 0 | Odds Ratio (M‐H, Fixed, 95% CI) | 0.0 [0.0, 0.0] |
| 4.39 Samatasvir | 0 | 0 | Odds Ratio (M‐H, Fixed, 95% CI) | 0.0 [0.0, 0.0] |
| 4.40 Setrobuvir | 0 | 0 | Odds Ratio (M‐H, Fixed, 95% CI) | 0.0 [0.0, 0.0] |
| 4.41 Simeprevir | 0 | 0 | Odds Ratio (M‐H, Fixed, 95% CI) | 0.0 [0.0, 0.0] |
| 4.42 Sofosbuvir | 0 | 0 | Odds Ratio (M‐H, Fixed, 95% CI) | 0.0 [0.0, 0.0] |
| 4.43 Sovaprevir | 0 | 0 | Odds Ratio (M‐H, Fixed, 95% CI) | 0.0 [0.0, 0.0] |
| 4.44 Tegobuvir | 0 | 0 | Odds Ratio (M‐H, Fixed, 95% CI) | 0.0 [0.0, 0.0] |
| 4.45 Telaprevir | 0 | 0 | Odds Ratio (M‐H, Fixed, 95% CI) | 0.0 [0.0, 0.0] |
| 4.46 Valopicitabine | 0 | 0 | Odds Ratio (M‐H, Fixed, 95% CI) | 0.0 [0.0, 0.0] |
| 4.47 Vaniprevir | 0 | 0 | Odds Ratio (M‐H, Fixed, 95% CI) | 0.0 [0.0, 0.0] |
| 4.48 VCH‐759 | 0 | 0 | Odds Ratio (M‐H, Fixed, 95% CI) | 0.0 [0.0, 0.0] |
| 4.49 VCH‐916 | 0 | 0 | Odds Ratio (M‐H, Fixed, 95% CI) | 0.0 [0.0, 0.0] |
| 4.50 Velpatasvir | 0 | 0 | Odds Ratio (M‐H, Fixed, 95% CI) | 0.0 [0.0, 0.0] |
| 4.51 VX‐222 | 0 | 0 | Odds Ratio (M‐H, Fixed, 95% CI) | 0.0 [0.0, 0.0] |
| 4.52 Mixed | 0 | 0 | Odds Ratio (M‐H, Fixed, 95% CI) | 0.0 [0.0, 0.0] |
| 5 Hepatitis C‐related morbidity or all‐cause mortality ‐ according to group of DAA | 0 | 0 | Odds Ratio (M‐H, Fixed, 95% CI) | 0.0 [0.0, 0.0] |
| 5.1 Cyclophilin | 0 | 0 | Odds Ratio (M‐H, Fixed, 95% CI) | 0.0 [0.0, 0.0] |
| 5.2 NS3/NS4A inhibitors | 0 | 0 | Odds Ratio (M‐H, Fixed, 95% CI) | 0.0 [0.0, 0.0] |
| 5.3 NS5B inhibitors (NPI) | 0 | 0 | Odds Ratio (M‐H, Fixed, 95% CI) | 0.0 [0.0, 0.0] |
| 5.4 NS5B inhibitors (NNPI) | 0 | 0 | Odds Ratio (M‐H, Fixed, 95% CI) | 0.0 [0.0, 0.0] |
| 5.5 NS5A inhibitors | 0 | 0 | Odds Ratio (M‐H, Fixed, 95% CI) | 0.0 [0.0, 0.0] |
| 5.6 VPU‐ion channel inhibitors | 0 | 0 | Odds Ratio (M‐H, Fixed, 95% CI) | 0.0 [0.0, 0.0] |
| 5.7 Mixed | 0 | 0 | Odds Ratio (M‐H, Fixed, 95% CI) | 0.0 [0.0, 0.0] |
| 6 Hepatitis C‐related morbidity or all‐cause mortality ‐ according to HIV‐infection | 0 | 0 | Odds Ratio (M‐H, Fixed, 95% CI) | 0.0 [0.0, 0.0] |
| 6.1 With HIV‐infection | 0 | 0 | Odds Ratio (M‐H, Fixed, 95% CI) | 0.0 [0.0, 0.0] |
| 6.2 Without HIV‐infection | 0 | 0 | Odds Ratio (M‐H, Fixed, 95% CI) | 0.0 [0.0, 0.0] |
| 6.3 Mixed (with and without HIV‐infection) | 0 | 0 | Odds Ratio (M‐H, Fixed, 95% CI) | 0.0 [0.0, 0.0] |
| 6.4 Unclear | 0 | 0 | Odds Ratio (M‐H, Fixed, 95% CI) | 0.0 [0.0, 0.0] |
| 7 Hepatitis C‐related morbidity or all‐cause mortality ‐ according to comorbidity | 0 | 0 | Odds Ratio (M‐H, Fixed, 95% CI) | 0.0 [0.0, 0.0] |
| 7.1 With comorbidity | 0 | 0 | Odds Ratio (M‐H, Fixed, 95% CI) | 0.0 [0.0, 0.0] |
| 7.2 Without comorbidity | 0 | 0 | Odds Ratio (M‐H, Fixed, 95% CI) | 0.0 [0.0, 0.0] |
| 7.3 Unclear | 0 | 0 | Odds Ratio (M‐H, Fixed, 95% CI) | 0.0 [0.0, 0.0] |
| 8 Hepatitis C‐related morbidity or all‐cause mortality ‐ according to viral genotype | 0 | 0 | Odds Ratio (M‐H, Fixed, 95% CI) | 0.0 [0.0, 0.0] |
| 8.1 Genotype 1 | 0 | 0 | Odds Ratio (M‐H, Fixed, 95% CI) | 0.0 [0.0, 0.0] |
| 8.2 Genotype 2 | 0 | 0 | Odds Ratio (M‐H, Fixed, 95% CI) | 0.0 [0.0, 0.0] |
| 8.3 Genotype 3 | 0 | 0 | Odds Ratio (M‐H, Fixed, 95% CI) | 0.0 [0.0, 0.0] |
| 8.4 Genotype 4 | 0 | 0 | Odds Ratio (M‐H, Fixed, 95% CI) | 0.0 [0.0, 0.0] |
| 8.5 Unclear | 0 | 0 | Odds Ratio (M‐H, Fixed, 95% CI) | 0.0 [0.0, 0.0] |
| 9 Hepatitis C‐related morbidity or all‐cause mortality ‐ according to human genotype (IL28b) | 0 | 0 | Odds Ratio (M‐H, Fixed, 95% CI) | 0.0 [0.0, 0.0] |
| 9.1 IL28b (CC) | 0 | 0 | Odds Ratio (M‐H, Fixed, 95% CI) | 0.0 [0.0, 0.0] |
| 9.2 IL28B (CT) | 0 | 0 | Odds Ratio (M‐H, Fixed, 95% CI) | 0.0 [0.0, 0.0] |
| 9.3 IL28B (TT) | 0 | 0 | Odds Ratio (M‐H, Fixed, 95% CI) | 0.0 [0.0, 0.0] |
| 9.4 IL28B (CT + TT) | 0 | 0 | Odds Ratio (M‐H, Fixed, 95% CI) | 0.0 [0.0, 0.0] |
| 9.5 Unclear | 0 | 0 | Odds Ratio (M‐H, Fixed, 95% CI) | 0.0 [0.0, 0.0] |
| 10 Hepatitis C‐related morbidity or all‐cause mortality ‐ according to Asian‐region | 0 | 0 | Odds Ratio (M‐H, Fixed, 95% CI) | 0.0 [0.0, 0.0] |
| 10.1 From Asian region | 0 | 0 | Odds Ratio (M‐H, Fixed, 95% CI) | 0.0 [0.0, 0.0] |
| 10.2 Not from Asian region | 0 | 0 | Odds Ratio (M‐H, Fixed, 95% CI) | 0.0 [0.0, 0.0] |
| 10.3 Mixed | 0 | 0 | Odds Ratio (M‐H, Fixed, 95% CI) | 0.0 [0.0, 0.0] |
| 10.4 Unclear | 0 | 0 | Odds Ratio (M‐H, Fixed, 95% CI) | 0.0 [0.0, 0.0] |
| 11 Hepatitis C‐related morbidity or all‐cause mortality ‐ according to specific ethnicities | 0 | 0 | Odds Ratio (M‐H, Fixed, 95% CI) | 0.0 [0.0, 0.0] |
| 11.1 White | 0 | 0 | Odds Ratio (M‐H, Fixed, 95% CI) | 0.0 [0.0, 0.0] |
| 11.2 Black | 0 | 0 | Odds Ratio (M‐H, Fixed, 95% CI) | 0.0 [0.0, 0.0] |
| 11.3 Hispanic | 0 | 0 | Odds Ratio (M‐H, Fixed, 95% CI) | 0.0 [0.0, 0.0] |
| 11.4 Mixed | 0 | 0 | Odds Ratio (M‐H, Fixed, 95% CI) | 0.0 [0.0, 0.0] |
| 11.5 Unclear | 0 | 0 | Odds Ratio (M‐H, Fixed, 95% CI) | 0.0 [0.0, 0.0] |
| 12 Hepatitis C‐related morbidity or all‐cause mortality ‐ according to reaching planned sample size | 0 | 0 | Odds Ratio (M‐H, Fixed, 95% CI) | 0.0 [0.0, 0.0] |
| 12.1 Trials reaching planned sample size | 0 | 0 | Odds Ratio (M‐H, Fixed, 95% CI) | 0.0 [0.0, 0.0] |
| 12.2 Trials not reaching planned sample size | 0 | 0 | Odds Ratio (M‐H, Fixed, 95% CI) | 0.0 [0.0, 0.0] |
| 12.3 Unclear | 0 | 0 | Odds Ratio (M‐H, Fixed, 95% CI) | 0.0 [0.0, 0.0] |
| 13 Hepatitis C‐related morbidity or all‐cause mortality ‐ according to prior treatment | 0 | 0 | Odds Ratio (M‐H, Fixed, 95% CI) | 0.0 [0.0, 0.0] |
| 13.1 Treatment‐naive | 0 | 0 | Odds Ratio (M‐H, Fixed, 95% CI) | 0.0 [0.0, 0.0] |
| 13.2 Treatment‐experienced | 0 | 0 | Odds Ratio (M‐H, Fixed, 95% CI) | 0.0 [0.0, 0.0] |
| 13.3 Mixed | 0 | 0 | Odds Ratio (M‐H, Fixed, 95% CI) | 0.0 [0.0, 0.0] |
| 13.4 Unclear | 0 | 0 | Odds Ratio (M‐H, Fixed, 95% CI) | 0.0 [0.0, 0.0] |
| 14 Hepatitis C‐related morbidity or all‐cause mortality ‐ according to interferon | 0 | 0 | Odds Ratio (M‐H, Fixed, 95% CI) | 0.0 [0.0, 0.0] |
| 14.1 Trials where both groups received interferon | 0 | 0 | Odds Ratio (M‐H, Fixed, 95% CI) | 0.0 [0.0, 0.0] |
| 14.2 Trials where neither group received interferon | 0 | 0 | Odds Ratio (M‐H, Fixed, 95% CI) | 0.0 [0.0, 0.0] |
| 14.3 Trials where only the experimental group received interferon | 0 | 0 | Odds Ratio (M‐H, Fixed, 95% CI) | 0.0 [0.0, 0.0] |
| 14.4 Trials where only the control group received interferon | 0 | 0 | Odds Ratio (M‐H, Fixed, 95% CI) | 0.0 [0.0, 0.0] |
| 15 Hepatitis C‐related morbidity or all‐cause mortality ‐ according to ribavirin | 0 | 0 | Odds Ratio (M‐H, Fixed, 95% CI) | 0.0 [0.0, 0.0] |
| 15.1 Trials where both groups received ribavirin | 0 | 0 | Odds Ratio (M‐H, Fixed, 95% CI) | 0.0 [0.0, 0.0] |
| 15.2 Trials where neither group received ribavirin | 0 | 0 | Odds Ratio (M‐H, Fixed, 95% CI) | 0.0 [0.0, 0.0] |
| 15.3 Trials where only the experimental group received ribavirin | 0 | 0 | Odds Ratio (M‐H, Fixed, 95% CI) | 0.0 [0.0, 0.0] |
| 15.4 Trials where only the control group received ribavirin | 0 | 0 | Odds Ratio (M‐H, Fixed, 95% CI) | 0.0 [0.0, 0.0] |
| 16 Hepatitis C‐related morbidity or all‐cause mortality ‐ according to chronic kidney disease | 0 | 0 | Odds Ratio (M‐H, Fixed, 95% CI) | 0.0 [0.0, 0.0] |
| 16.1 With chronic kidney disease | 0 | 0 | Odds Ratio (M‐H, Fixed, 95% CI) | 0.0 [0.0, 0.0] |
| 16.2 Without chronic kidney disease | 0 | 0 | Odds Ratio (M‐H, Fixed, 95% CI) | 0.0 [0.0, 0.0] |
| 16.3 Unclear | 0 | 0 | Odds Ratio (M‐H, Fixed, 95% CI) | 0.0 [0.0, 0.0] |
| 17 Hepatitis C‐related morbidity or all‐cause mortality ‐ according to cryoglobulinaemia | 0 | 0 | Odds Ratio (M‐H, Fixed, 95% CI) | 0.0 [0.0, 0.0] |
| 17.1 With cryoglobulinaemia | 0 | 0 | Odds Ratio (M‐H, Fixed, 95% CI) | 0.0 [0.0, 0.0] |
| 17.2 Without cryoglobulinaemia | 0 | 0 | Odds Ratio (M‐H, Fixed, 95% CI) | 0.0 [0.0, 0.0] |
| 17.3 Unclear | 0 | 0 | Odds Ratio (M‐H, Fixed, 95% CI) | 0.0 [0.0, 0.0] |
| 18 Hepatitis C‐related morbidity or all‐cause mortality ‐ according to DAA group as co‐intervention | 0 | 0 | Odds Ratio (M‐H, Fixed, 95% CI) | 0.0 [0.0, 0.0] |
| 18.1 Trials where DAA were used as co‐intervention | 0 | 0 | Odds Ratio (M‐H, Fixed, 95% CI) | 0.0 [0.0, 0.0] |
| 18.2 Trials where DAA were not a co‐intervention | 0 | 0 | Odds Ratio (M‐H, Fixed, 95% CI) | 0.0 [0.0, 0.0] |
| Outcome or subgroup title | No. of studies | No. of participants | Statistical method | Effect size |
| 1 Serious adverse events Show forest plot | 167 | Odds Ratio (M‐H, Fixed, 95% CI) | Totals not selected | |
| 1.1 Trials assessing DAAs on or on the way to the market | 101 | Odds Ratio (M‐H, Fixed, 95% CI) | 0.0 [0.0, 0.0] | |
| 1.2 Trials assessing DAAs withdrawn from market | 62 | Odds Ratio (M‐H, Fixed, 95% CI) | 0.0 [0.0, 0.0] | |
| 1.3 Trials using other medical intervention as control group | 3 | Odds Ratio (M‐H, Fixed, 95% CI) | 0.0 [0.0, 0.0] | |
| 1.4 Trials using other medical intervention as experimental group | 1 | Odds Ratio (M‐H, Fixed, 95% CI) | 0.0 [0.0, 0.0] | |
| 2 Serious adverse events ‐ bias risk Show forest plot | 167 | Odds Ratio (M‐H, Fixed, 95% CI) | Totals not selected | |
| 2.1 Trials with a high risk of bias | 167 | Odds Ratio (M‐H, Fixed, 95% CI) | 0.0 [0.0, 0.0] | |
| 2.2 Trials with a low risk of bias | 0 | Odds Ratio (M‐H, Fixed, 95% CI) | 0.0 [0.0, 0.0] | |
| 3 Serious adverse events ‐ according to type of DAA Show forest plot | 167 | Odds Ratio (M‐H, Fixed, 95% CI) | Totals not selected | |
| 3.1 ABT‐072 | 3 | Odds Ratio (M‐H, Fixed, 95% CI) | 0.0 [0.0, 0.0] | |
| 3.2 ACH‐2684 | 0 | Odds Ratio (M‐H, Fixed, 95% CI) | 0.0 [0.0, 0.0] | |
| 3.3 Alisporivir | 3 | Odds Ratio (M‐H, Fixed, 95% CI) | 0.0 [0.0, 0.0] | |
| 3.4 ALS‐2200 | 0 | Odds Ratio (M‐H, Fixed, 95% CI) | 0.0 [0.0, 0.0] | |
| 3.5 Asunaprevir | 6 | Odds Ratio (M‐H, Fixed, 95% CI) | 0.0 [0.0, 0.0] | |
| 3.6 Balapiravir | 9 | Odds Ratio (M‐H, Fixed, 95% CI) | 0.0 [0.0, 0.0] | |
| 3.7 Beclabuvir | 3 | Odds Ratio (M‐H, Fixed, 95% CI) | 0.0 [0.0, 0.0] | |
| 3.8 BILB‐1941 | 1 | Odds Ratio (M‐H, Fixed, 95% CI) | 0.0 [0.0, 0.0] | |
| 3.9 BIT‐225 | 0 | Odds Ratio (M‐H, Fixed, 95% CI) | 0.0 [0.0, 0.0] | |
| 3.10 Boceprevir | 13 | Odds Ratio (M‐H, Fixed, 95% CI) | 0.0 [0.0, 0.0] | |
| 3.11 Ciluprevir | 1 | Odds Ratio (M‐H, Fixed, 95% CI) | 0.0 [0.0, 0.0] | |
| 3.12 Daclatasvir | 14 | Odds Ratio (M‐H, Fixed, 95% CI) | 0.0 [0.0, 0.0] | |
| 3.13 Danoprevir | 9 | Odds Ratio (M‐H, Fixed, 95% CI) | 0.0 [0.0, 0.0] | |
| 3.14 Dasabuvir | 2 | Odds Ratio (M‐H, Fixed, 95% CI) | 0.0 [0.0, 0.0] | |
| 3.15 Deleobuvir | 1 | Odds Ratio (M‐H, Fixed, 95% CI) | 0.0 [0.0, 0.0] | |
| 3.16 Faldaprevir | 13 | Odds Ratio (M‐H, Fixed, 95% CI) | 0.0 [0.0, 0.0] | |
| 3.17 Filibuvir | 3 | Odds Ratio (M‐H, Fixed, 95% CI) | 0.0 [0.0, 0.0] | |
| 3.18 Grazoprevir | 0 | Odds Ratio (M‐H, Fixed, 95% CI) | 0.0 [0.0, 0.0] | |
| 3.19 GS‐6620 | 0 | Odds Ratio (M‐H, Fixed, 95% CI) | 0.0 [0.0, 0.0] | |
| 3.20 GS‐9256 | 0 | Odds Ratio (M‐H, Fixed, 95% CI) | 0.0 [0.0, 0.0] | |
| 3.21 GS‐9451 | 1 | Odds Ratio (M‐H, Fixed, 95% CI) | 0.0 [0.0, 0.0] | |
| 3.22 GS‐9669 | 0 | Odds Ratio (M‐H, Fixed, 95% CI) | 0.0 [0.0, 0.0] | |
| 3.23 GS‐9851 | 1 | Odds Ratio (M‐H, Fixed, 95% CI) | 0.0 [0.0, 0.0] | |
| 3.24 GS‐9857 | 0 | Odds Ratio (M‐H, Fixed, 95% CI) | 0.0 [0.0, 0.0] | |
| 3.25 GSK2336805 | 2 | Odds Ratio (M‐H, Fixed, 95% CI) | 0.0 [0.0, 0.0] | |
| 3.26 GSK2878175 | 0 | Odds Ratio (M‐H, Fixed, 95% CI) | 0.0 [0.0, 0.0] | |
| 3.27 IDX‐184 | 2 | Odds Ratio (M‐H, Fixed, 95% CI) | 0.0 [0.0, 0.0] | |
| 3.28 INX‐08189 | 0 | Odds Ratio (M‐H, Fixed, 95% CI) | 0.0 [0.0, 0.0] | |
| 3.29 Ledispasvir | 1 | Odds Ratio (M‐H, Fixed, 95% CI) | 0.0 [0.0, 0.0] | |
| 3.30 Mericitabine | 7 | Odds Ratio (M‐H, Fixed, 95% CI) | 0.0 [0.0, 0.0] | |
| 3.31 Narlaprevir | 2 | Odds Ratio (M‐H, Fixed, 95% CI) | 0.0 [0.0, 0.0] | |
| 3.32 Nesbuvir | 0 | Odds Ratio (M‐H, Fixed, 95% CI) | 0.0 [0.0, 0.0] | |
| 3.33 Odalasavir | 1 | Odds Ratio (M‐H, Fixed, 95% CI) | 0.0 [0.0, 0.0] | |
| 3.34 Ombitasvir | 1 | Odds Ratio (M‐H, Fixed, 95% CI) | 0.0 [0.0, 0.0] | |
| 3.35 Paritaprevir | 3 | Odds Ratio (M‐H, Fixed, 95% CI) | 0.0 [0.0, 0.0] | |
| 3.36 PHX1766 | 0 | Odds Ratio (M‐H, Fixed, 95% CI) | 0.0 [0.0, 0.0] | |
| 3.37 PPI‐461 | 3 | Odds Ratio (M‐H, Fixed, 95% CI) | 0.0 [0.0, 0.0] | |
| 3.38 PSI‐352938 | 1 | Odds Ratio (M‐H, Fixed, 95% CI) | 0.0 [0.0, 0.0] | |
| 3.39 Samatasvir | 1 | Odds Ratio (M‐H, Fixed, 95% CI) | 0.0 [0.0, 0.0] | |
| 3.40 Setrobuvir | 1 | Odds Ratio (M‐H, Fixed, 95% CI) | 0.0 [0.0, 0.0] | |
| 3.41 Simeprevir | 19 | Odds Ratio (M‐H, Fixed, 95% CI) | 0.0 [0.0, 0.0] | |
| 3.42 Sofosbuvir | 6 | Odds Ratio (M‐H, Fixed, 95% CI) | 0.0 [0.0, 0.0] | |
| 3.43 Sovaprevir | 1 | Odds Ratio (M‐H, Fixed, 95% CI) | 0.0 [0.0, 0.0] | |
| 3.44 Tegobuvir | 1 | Odds Ratio (M‐H, Fixed, 95% CI) | 0.0 [0.0, 0.0] | |
| 3.45 Telaprevir | 13 | Odds Ratio (M‐H, Fixed, 95% CI) | 0.0 [0.0, 0.0] | |
| 3.46 Valopicitabine | 0 | Odds Ratio (M‐H, Fixed, 95% CI) | 0.0 [0.0, 0.0] | |
| 3.47 Vaniprevir | 10 | Odds Ratio (M‐H, Fixed, 95% CI) | 0.0 [0.0, 0.0] | |
| 3.48 VCH‐759 | 0 | Odds Ratio (M‐H, Fixed, 95% CI) | 0.0 [0.0, 0.0] | |
| 3.49 VCH‐916 | 0 | Odds Ratio (M‐H, Fixed, 95% CI) | 0.0 [0.0, 0.0] | |
| 3.50 Velpatasvir | 1 | Odds Ratio (M‐H, Fixed, 95% CI) | 0.0 [0.0, 0.0] | |
| 3.51 VX‐222 | 0 | Odds Ratio (M‐H, Fixed, 95% CI) | 0.0 [0.0, 0.0] | |
| 3.52 Mixed | 8 | Odds Ratio (M‐H, Fixed, 95% CI) | 0.0 [0.0, 0.0] | |
| 4 Serious adverse events ‐ according to group of DAA Show forest plot | 167 | Odds Ratio (M‐H, Fixed, 95% CI) | Totals not selected | |
| 4.1 Cyclophilin | 3 | Odds Ratio (M‐H, Fixed, 95% CI) | 0.0 [0.0, 0.0] | |
| 4.2 NS3/NS4A inhibitors | 92 | Odds Ratio (M‐H, Fixed, 95% CI) | 0.0 [0.0, 0.0] | |
| 4.3 NS5B inhibitors (NPI) | 24 | Odds Ratio (M‐H, Fixed, 95% CI) | 0.0 [0.0, 0.0] | |
| 4.4 NS5B inhibitors (NNPI) | 14 | Odds Ratio (M‐H, Fixed, 95% CI) | 0.0 [0.0, 0.0] | |
| 4.5 NS5A inhibitors | 27 | Odds Ratio (M‐H, Fixed, 95% CI) | 0.0 [0.0, 0.0] | |
| 4.6 VPU‐ion channel inhibitors | 0 | Odds Ratio (M‐H, Fixed, 95% CI) | 0.0 [0.0, 0.0] | |
| 4.7 Mixed | 7 | Odds Ratio (M‐H, Fixed, 95% CI) | 0.0 [0.0, 0.0] | |
| 5 Serious adverse events ‐ according to HIV‐infection Show forest plot | 167 | Odds Ratio (M‐H, Fixed, 95% CI) | Totals not selected | |
| 5.1 With HIV‐infection | 2 | Odds Ratio (M‐H, Fixed, 95% CI) | 0.0 [0.0, 0.0] | |
| 5.2 Without HIV‐infection | 154 | Odds Ratio (M‐H, Fixed, 95% CI) | 0.0 [0.0, 0.0] | |
| 5.3 Mixed (with and without HIV‐infection) | 0 | Odds Ratio (M‐H, Fixed, 95% CI) | 0.0 [0.0, 0.0] | |
| 5.4 Unclear | 11 | Odds Ratio (M‐H, Fixed, 95% CI) | 0.0 [0.0, 0.0] | |
| 6 Serious adverse events ‐ according to comorbidity Show forest plot | 167 | Odds Ratio (M‐H, Fixed, 95% CI) | Totals not selected | |
| 6.1 With comorbidity | 0 | Odds Ratio (M‐H, Fixed, 95% CI) | 0.0 [0.0, 0.0] | |
| 6.2 Without comorbidity | 0 | Odds Ratio (M‐H, Fixed, 95% CI) | 0.0 [0.0, 0.0] | |
| 6.3 Unclear | 167 | Odds Ratio (M‐H, Fixed, 95% CI) | 0.0 [0.0, 0.0] | |
| 7 Serious adverse events ‐ according to viral genotype Show forest plot | 167 | Odds Ratio (M‐H, Fixed, 95% CI) | Totals not selected | |
| 7.1 Genotype 1 | 138 | Odds Ratio (M‐H, Fixed, 95% CI) | 0.0 [0.0, 0.0] | |
| 7.2 Genotype 2 | 1 | Odds Ratio (M‐H, Fixed, 95% CI) | 0.0 [0.0, 0.0] | |
| 7.3 Genotype 3 | 0 | Odds Ratio (M‐H, Fixed, 95% CI) | 0.0 [0.0, 0.0] | |
| 7.4 Genotype 4 | 2 | Odds Ratio (M‐H, Fixed, 95% CI) | 0.0 [0.0, 0.0] | |
| 7.5 Mixed | 26 | Odds Ratio (M‐H, Fixed, 95% CI) | 0.0 [0.0, 0.0] | |
| 8 Serious adverse events ‐ according to human genotype (IL28b) Show forest plot | 167 | Odds Ratio (M‐H, Fixed, 95% CI) | Totals not selected | |
| 8.1 IL28b (CC) | 0 | Odds Ratio (M‐H, Fixed, 95% CI) | 0.0 [0.0, 0.0] | |
| 8.2 IL28B (CT) | 0 | Odds Ratio (M‐H, Fixed, 95% CI) | 0.0 [0.0, 0.0] | |
| 8.3 IL28B (TT) | 0 | Odds Ratio (M‐H, Fixed, 95% CI) | 0.0 [0.0, 0.0] | |
| 8.4 IL28B (CT + TT) | 0 | Odds Ratio (M‐H, Fixed, 95% CI) | 0.0 [0.0, 0.0] | |
| 8.5 Unclear | 79 | Odds Ratio (M‐H, Fixed, 95% CI) | 0.0 [0.0, 0.0] | |
| 8.6 Mixed IL28b | 88 | Odds Ratio (M‐H, Fixed, 95% CI) | 0.0 [0.0, 0.0] | |
| 9 Serious adverse events ‐ according to Asian‐region Show forest plot | 167 | Odds Ratio (M‐H, Fixed, 95% CI) | Totals not selected | |
| 9.1 From Asian region | 12 | Odds Ratio (M‐H, Fixed, 95% CI) | 0.0 [0.0, 0.0] | |
| 9.2 Not from Asian region | 119 | Odds Ratio (M‐H, Fixed, 95% CI) | 0.0 [0.0, 0.0] | |
| 9.3 Mixed | 31 | Odds Ratio (M‐H, Fixed, 95% CI) | 0.0 [0.0, 0.0] | |
| 9.4 Unclear | 5 | Odds Ratio (M‐H, Fixed, 95% CI) | 0.0 [0.0, 0.0] | |
| 10 Serious adverse events ‐ according to specific ethnicities Show forest plot | 167 | Odds Ratio (M‐H, Fixed, 95% CI) | Totals not selected | |
| 10.1 White | 3 | Odds Ratio (M‐H, Fixed, 95% CI) | 0.0 [0.0, 0.0] | |
| 10.2 Black | 0 | Odds Ratio (M‐H, Fixed, 95% CI) | 0.0 [0.0, 0.0] | |
| 10.3 Hispanic | 0 | Odds Ratio (M‐H, Fixed, 95% CI) | 0.0 [0.0, 0.0] | |
| 10.4 Mixed | 133 | Odds Ratio (M‐H, Fixed, 95% CI) | 0.0 [0.0, 0.0] | |
| 10.5 Unclear | 31 | Odds Ratio (M‐H, Fixed, 95% CI) | 0.0 [0.0, 0.0] | |
| 11 Serious adverse events ‐ according to reaching planned sample size | 0 | Odds Ratio (M‐H, Fixed, 95% CI) | Totals not selected | |
| 11.1 Trials reaching planned sample size | 0 | Odds Ratio (M‐H, Fixed, 95% CI) | 0.0 [0.0, 0.0] | |
| 11.2 Trials not reaching planned sample size | 0 | Odds Ratio (M‐H, Fixed, 95% CI) | 0.0 [0.0, 0.0] | |
| 11.3 Unclear | 0 | Odds Ratio (M‐H, Fixed, 95% CI) | 0.0 [0.0, 0.0] | |
| 12 Serious adverse events ‐ according to prior treatment Show forest plot | 167 | Odds Ratio (M‐H, Fixed, 95% CI) | Totals not selected | |
| 12.1 Treatment‐naive | 122 | Odds Ratio (M‐H, Fixed, 95% CI) | 0.0 [0.0, 0.0] | |
| 12.2 Treatment‐experienced | 27 | Odds Ratio (M‐H, Fixed, 95% CI) | 0.0 [0.0, 0.0] | |
| 12.3 Mixed | 18 | Odds Ratio (M‐H, Fixed, 95% CI) | 0.0 [0.0, 0.0] | |
| 12.4 Unclear | 0 | Odds Ratio (M‐H, Fixed, 95% CI) | 0.0 [0.0, 0.0] | |
| 13 Serious adverse events ‐ according to interferon Show forest plot | 167 | Odds Ratio (M‐H, Fixed, 95% CI) | Totals not selected | |
| 13.1 Trials where both groups received interferon | 126 | Odds Ratio (M‐H, Fixed, 95% CI) | 0.0 [0.0, 0.0] | |
| 13.2 Trials where neither group received interferon | 40 | Odds Ratio (M‐H, Fixed, 95% CI) | 0.0 [0.0, 0.0] | |
| 13.3 Trials where only the experimental group received interferon | 0 | Odds Ratio (M‐H, Fixed, 95% CI) | 0.0 [0.0, 0.0] | |
| 13.4 Trials where only the control group received interferon | 1 | Odds Ratio (M‐H, Fixed, 95% CI) | 0.0 [0.0, 0.0] | |
| 14 Serious adverse events ‐ according to ribavirin Show forest plot | 167 | Odds Ratio (M‐H, Fixed, 95% CI) | Totals not selected | |
| 14.1 Trials where both groups received ribavirin | 127 | Odds Ratio (M‐H, Fixed, 95% CI) | 0.0 [0.0, 0.0] | |
| 14.2 Trials where neither group received ribavirin | 37 | Odds Ratio (M‐H, Fixed, 95% CI) | 0.0 [0.0, 0.0] | |
| 14.3 Trials where only the experimental group received ribavirin | 1 | Odds Ratio (M‐H, Fixed, 95% CI) | 0.0 [0.0, 0.0] | |
| 14.4 Trials where only the control group received ribavirin | 2 | Odds Ratio (M‐H, Fixed, 95% CI) | 0.0 [0.0, 0.0] | |
| 15 Serious adverse events ‐ according to chronic kidney disease Show forest plot | 167 | Odds Ratio (M‐H, Fixed, 95% CI) | Totals not selected | |
| 15.1 With chronic kidney disease | 0 | Odds Ratio (M‐H, Fixed, 95% CI) | 0.0 [0.0, 0.0] | |
| 15.2 Without chronic kidney disease | 0 | Odds Ratio (M‐H, Fixed, 95% CI) | 0.0 [0.0, 0.0] | |
| 15.3 Unclear | 167 | Odds Ratio (M‐H, Fixed, 95% CI) | 0.0 [0.0, 0.0] | |
| 16 Serious adverse events ‐ according to cryoglobulinaemia Show forest plot | 167 | Odds Ratio (M‐H, Fixed, 95% CI) | Totals not selected | |
| 16.1 With cryoglobulinaemia | 0 | Odds Ratio (M‐H, Fixed, 95% CI) | 0.0 [0.0, 0.0] | |
| 16.2 Without cryoglobulinaemia | 0 | Odds Ratio (M‐H, Fixed, 95% CI) | 0.0 [0.0, 0.0] | |
| 16.3 Unclear | 167 | Odds Ratio (M‐H, Fixed, 95% CI) | 0.0 [0.0, 0.0] | |
| 17 Serious adverse events ‐ according to DAA group as co‐intervention Show forest plot | 167 | Odds Ratio (M‐H, Fixed, 95% CI) | Totals not selected | |
| 17.1 Trials where DAA were used as co‐intervention | 2 | Odds Ratio (M‐H, Fixed, 95% CI) | 0.0 [0.0, 0.0] | |
| 17.2 Trials where DAA were not a co‐intervention | 165 | Odds Ratio (M‐H, Fixed, 95% CI) | 0.0 [0.0, 0.0] | |
| Outcome or subgroup title | No. of studies | No. of participants | Statistical method | Effect size |
| 1 Without sustained virological response Show forest plot | 107 | 17101 | Risk Ratio (M‐H, Random, 95% CI) | 0.53 [0.48, 0.59] |
| 1.1 Trials assessing DAAs on or on the way to the market | 60 | 6886 | Risk Ratio (M‐H, Random, 95% CI) | 0.44 [0.37, 0.52] |
| 1.2 Trials assessing DAAs withdrawn from market | 43 | 9075 | Risk Ratio (M‐H, Random, 95% CI) | 0.61 [0.55, 0.69] |
| 1.3 Trials using other medical intervention as control group | 3 | 862 | Risk Ratio (M‐H, Random, 95% CI) | 0.81 [0.36, 1.82] |
| 1.4 Trials using other medical intervention as experimental group | 1 | 278 | Risk Ratio (M‐H, Random, 95% CI) | 0.23 [0.17, 0.29] |
| Outcome or subgroup title | No. of studies | No. of participants | Statistical method | Effect size |
| 1 SF‐36 physical score Show forest plot | 1 | 215 | Mean Difference (IV, Fixed, 95% CI) | ‐1.17 [‐3.65, 1.31] |
| 2 SF‐36 mental score Show forest plot | 1 | 215 | Mean Difference (IV, Fixed, 95% CI) | 1.36 [‐1.53, 4.25] |
| Outcome or subgroup title | No. of studies | No. of participants | Statistical method | Effect size |
| 1 Hepatitis C‐related morbidity or all‐cause mortality Show forest plot | 14 | 666 | Odds Ratio (M‐H, Fixed, 95% CI) | 1.25 [0.06, 26.65] |
| 2 Hepatitis C‐related morbidity or all‐cause mortality ‐ according to dose Show forest plot | 14 | 666 | Odds Ratio (M‐H, Fixed, 95% CI) | 1.25 [0.06, 26.65] |
| 2.1 Over or equal to median dose | 7 | 374 | Odds Ratio (M‐H, Fixed, 95% CI) | 0.0 [0.0, 0.0] |
| 2.2 Under median dose | 7 | 292 | Odds Ratio (M‐H, Fixed, 95% CI) | 1.25 [0.06, 26.65] |
| 2.3 Not available | 0 | 0 | Odds Ratio (M‐H, Fixed, 95% CI) | 0.0 [0.0, 0.0] |
| 3 Serious adverse events Show forest plot | 13 | Odds Ratio (M‐H, Fixed, 95% CI) | Totals not selected | |
| 4 Serious adverse events ‐ according to median dose Show forest plot | 14 | Odds Ratio (M‐H, Fixed, 95% CI) | Totals not selected | |
| 4.1 Over or equal to median dose | 7 | Odds Ratio (M‐H, Fixed, 95% CI) | 0.0 [0.0, 0.0] | |
| 4.2 Under median dose | 8 | Odds Ratio (M‐H, Fixed, 95% CI) | 0.0 [0.0, 0.0] | |
| 4.3 Not available | 0 | Odds Ratio (M‐H, Fixed, 95% CI) | 0.0 [0.0, 0.0] | |
| 5 Without sustained virological response Show forest plot | 7 | 619 | Odds Ratio (M‐H, Fixed, 95% CI) | 0.40 [0.27, 0.59] |
| 6 Without sustained virological response ‐ according to median dose Show forest plot | 7 | 619 | Odds Ratio (M‐H, Fixed, 95% CI) | 0.40 [0.27, 0.59] |
| 6.1 Over or equal to median dose | 4 | 360 | Odds Ratio (M‐H, Fixed, 95% CI) | 0.43 [0.26, 0.70] |
| 6.2 Under median dose | 3 | 259 | Odds Ratio (M‐H, Fixed, 95% CI) | 0.36 [0.19, 0.68] |
| 6.3 Not available | 0 | 0 | Odds Ratio (M‐H, Fixed, 95% CI) | 0.0 [0.0, 0.0] |
| Outcome or subgroup title | No. of studies | No. of participants | Statistical method | Effect size |
| 1 Hepatitis C‐related morbidity or all‐cause mortality Show forest plot | 14 | 1589 | Odds Ratio (M‐H, Fixed, 95% CI) | 0.49 [0.08, 2.96] |
| 2 Hepatitis C‐related morbidity or all‐cause mortality ‐ according to dose Show forest plot | 14 | 1589 | Odds Ratio (M‐H, Fixed, 95% CI) | 0.49 [0.08, 2.96] |
| 2.1 Over or equal to median dose | 4 | 441 | Odds Ratio (M‐H, Fixed, 95% CI) | 0.51 [0.03, 8.21] |
| 2.2 Under median dose | 8 | 705 | Odds Ratio (M‐H, Fixed, 95% CI) | 0.41 [0.01, 12.22] |
| 2.3 Not available | 2 | 443 | Odds Ratio (M‐H, Fixed, 95% CI) | 0.55 [0.02, 13.62] |
| 3 Serious adverse events Show forest plot | 18 | Odds Ratio (M‐H, Fixed, 95% CI) | Totals not selected | |
| 4 Serious adverse events ‐ according to median dose Show forest plot | 18 | Odds Ratio (M‐H, Fixed, 95% CI) | Totals not selected | |
| 4.1 Over or equal to median dose | 7 | Odds Ratio (M‐H, Fixed, 95% CI) | 0.0 [0.0, 0.0] | |
| 4.2 Under median dose | 9 | Odds Ratio (M‐H, Fixed, 95% CI) | 0.0 [0.0, 0.0] | |
| 4.3 Not available | 2 | Odds Ratio (M‐H, Fixed, 95% CI) | 0.0 [0.0, 0.0] | |
| 5 Without sustained virological response Show forest plot | 19 | 2898 | Odds Ratio (M‐H, Fixed, 95% CI) | 0.22 [0.19, 0.27] |
| 6 Without sustained virological response ‐ according to median dose Show forest plot | 19 | 2898 | Odds Ratio (M‐H, Fixed, 95% CI) | 0.22 [0.19, 0.27] |
| 6.1 Over or equal to median dose | 9 | 1765 | Odds Ratio (M‐H, Fixed, 95% CI) | 0.25 [0.20, 0.32] |
| 6.2 Under median dose | 8 | 696 | Odds Ratio (M‐H, Fixed, 95% CI) | 0.19 [0.13, 0.29] |
| 6.3 Not available | 2 | 437 | Odds Ratio (M‐H, Fixed, 95% CI) | 0.13 [0.07, 0.24] |
| Outcome or subgroup title | No. of studies | No. of participants | Statistical method | Effect size |
| 1 Hepatitis C‐related morbidity or all‐cause mortality Show forest plot | 9 | 379 | Odds Ratio (M‐H, Fixed, 95% CI) | 0.76 [0.03, 18.90] |
| 2 Hepatitis C‐related morbidity or all‐cause mortality ‐ according to dose Show forest plot | 9 | 379 | Odds Ratio (M‐H, Fixed, 95% CI) | 0.76 [0.03, 18.90] |
| 2.1 Over or equal to median dose | 6 | 313 | Odds Ratio (M‐H, Fixed, 95% CI) | 0.76 [0.03, 18.90] |
| 2.2 Under median dose | 3 | 66 | Odds Ratio (M‐H, Fixed, 95% CI) | 0.0 [0.0, 0.0] |
| 2.3 Not available | 0 | 0 | Odds Ratio (M‐H, Fixed, 95% CI) | 0.0 [0.0, 0.0] |
| 3 Serious adverse events Show forest plot | 10 | Odds Ratio (M‐H, Fixed, 95% CI) | Totals not selected | |
| 4 Serious adverse events ‐ according to median dose Show forest plot | 10 | Odds Ratio (M‐H, Fixed, 95% CI) | Totals not selected | |
| 4.1 Over or equal to median dose | 6 | Odds Ratio (M‐H, Fixed, 95% CI) | 0.0 [0.0, 0.0] | |
| 4.2 Under median dose | 4 | Odds Ratio (M‐H, Fixed, 95% CI) | 0.0 [0.0, 0.0] | |
| 4.3 Not available | 0 | Odds Ratio (M‐H, Fixed, 95% CI) | 0.0 [0.0, 0.0] | |
| 5 Without sustained virological response Show forest plot | 9 | 333 | Odds Ratio (M‐H, Fixed, 95% CI) | 0.12 [0.06, 0.22] |
| 6 Without sustained virological response ‐ according to median dose Show forest plot | 9 | 333 | Odds Ratio (M‐H, Fixed, 95% CI) | 0.12 [0.06, 0.22] |
| 6.1 Over or equal to median dose | 6 | 280 | Odds Ratio (M‐H, Fixed, 95% CI) | 0.10 [0.05, 0.20] |
| 6.2 Under median dose | 3 | 53 | Odds Ratio (M‐H, Fixed, 95% CI) | 0.26 [0.06, 1.04] |
| 6.3 Not available | 0 | 0 | Odds Ratio (M‐H, Fixed, 95% CI) | 0.0 [0.0, 0.0] |
| Outcome or subgroup title | No. of studies | No. of participants | Statistical method | Effect size |
| 1 Without significant reductions in ALT/AST serum levels Show forest plot | 11 | 2099 | Risk Ratio (M‐H, Random, 95% CI) | 0.79 [0.68, 0.92] |
| 2 Without significant reductions in ALT/AST serum levels ‐ according to DAA status Show forest plot | 11 | 2099 | Risk Ratio (M‐H, Random, 95% CI) | 0.79 [0.68, 0.92] |
| 2.1 Trials assessing DAAs on or on the way to the market | 0 | 0 | Risk Ratio (M‐H, Random, 95% CI) | 0.0 [0.0, 0.0] |
| 2.2 Trials assessing DAAs withdrawn from market | 11 | 2099 | Risk Ratio (M‐H, Random, 95% CI) | 0.79 [0.68, 0.92] |
| 3 Without significant reductions in ALT/AST serum levels ‐ according to type of drug Show forest plot | 11 | 2099 | Risk Ratio (M‐H, Random, 95% CI) | 0.79 [0.68, 0.92] |
| 3.1 Faldaprevir | 8 | 2019 | Risk Ratio (M‐H, Random, 95% CI) | 0.81 [0.69, 0.96] |
| 3.2 Balaparavir | 3 | 80 | Risk Ratio (M‐H, Random, 95% CI) | 0.61 [0.41, 0.92] |