Antivirales de acción directa para la hepatitis C crónica
Información
- DOI:
- https://doi.org/10.1002/14651858.CD012143.pub3Copiar DOI

- Base de datos:
-
- Cochrane Database of Systematic Reviews
- Versión publicada:
-
- 18 septiembre 2017see what's new
- Tipo:
-
- Intervention
- Etapa:
-
- Review
- Grupo Editorial Cochrane:
-
Grupo Cochrane de Hepatobiliar
- Copyright:
-
- Copyright © 2017 The Cochrane Collaboration. Published by John Wiley & Sons, Ltd.
Cifras del artículo
Altmetric:
Citado por:
Autores
Contributions of authors
JCJ wrote the first draft of the protocol. All remaining authors contributed with comments for revisions. All authors reviewed the final version of the protocol and approved its validity for publication.
Fifteen review authors (EN, JF, KF, KK, GH, GP, SD, KW, MB, GB, SK, JP, DN, RK, JCJ) independently and in pairs assessed all identified articles for inclusion and exclusion, ensuring that an article was assessed by at least two authors. If a trial was identified as relevant by one author, but not by another, the authors discussed the reasoning behind their decision. If they still disagreed JCJ or CG served as arbitrator. Twelve review authors (EN, JF, KF, KK, GH, GP, SD, KW, MB, GB, SK, DN) independently and in pairs extracted and validated data. We used data extraction forms that were designed for the purpose. The twelve authors discussed any disagreement concerning the extracted data. If the authors still disagreed, JCJ or CG served as arbitrator.
JCJ wrote the first draft of the review. All remaining authors contributed with comments for revisions. All authors reviewed the final version of the review and approved its validity for publication.
Sources of support
Internal sources
-
The Copenhagen Trial Unit, Centre for Clinical Intervention Research, Rigshospitalet, Copenhagen, Denmark.
Salary for the review authors, use of offices and equipment, access to literature.
-
The Cochrane Hepato‐Biliary Group, Rigshospitalet, Copenhagen, Denmark.
Salary for the review authors, use of offices and equipment, access to literature.
-
Department of Cardiology, Holbaek Hospital, Holbaek, Denmark.
Salary for the review author, use of offices and equipment, access to literature.
-
Department of Gastroenterology, Clinical Hospital Centre Rijeka, Rijeka, Croatia.
Salary for the review authors, use of offices and equipment, access to literature.
-
Internal Medicine IV, University Hospital Heidelberg, Heidelberg, Germany.
Salary for the review authors, use of offices and equipment, access to literature.
-
Medical faculty, University of Nis, Nis, Serbia.
No support.
-
Department of Internal Medicine, Medical Faculty, University of Nis, Nis, Serbia.
Salary for the review author, use of offices and equipment, access to literature.
-
Centre for Evidence‐Based Chinese Medicine, Beijing University of Chinese Medicine, Beijing, China.
Salary for the review author, use of offices and equipment, access to literature.
External sources
-
Dr Koretz receives ongoing support from Giissues Inc., a 501 (c) (3) non‐profit organization that promotes the use and dissemination of evidence‐based medicine. While no particular funds were used for this particular project, Giissues Inc. will support Dr Koretz's academic travel, society memberships, and other academic activities that have some relationship to the mission of the promulgation of evidence‐based medicine. Giissues Inc. does not provide any salary support for Dr Koretz, USA.
Declarations of interest
JCJ: none declared.
EN: none declared.
JF: none declared.
KK: none declared.
KF: none declared.
GH: none declared.
GP: none declared.
SD: none declared.
KW: none declared.
MB: none declared.
GB: none declared.
SK: none declared.
JP: none declared.
DN: none declared.
RK: none declared.
CG: none declared.
Acknowledgements
Cochrane Review Group funding acknowledgement: the Danish State is the largest single funder of Cochrane Hepato‐Biliary through its investment in the Copenhagen Trial Unit, Centre for Clinical Intervention Research, Rigshospitalet, Copenhagen University Hospital, Denmark. Disclaimer: the views and opinions expressed in this review are those of the authors and do not necessarily reflect those of the Danish State or The Copenhagen Trial Unit.
Peer reviewers for the protocol: Thomas Baumert, France; Domenico Sansonno, Italy.
Contact editor for the protocol: Norberto C Chavez‐Tapia, Mexico.
Peer reviewers for the review: Thomas Baumert, France; Lauren A. Beste, USA.
Contact editor for the review: Norberto C Chavez‐Tapia, Mexico.
Sign‐off editor for the review: Toby J Lasserson, UK.
Version history
| Published | Title | Stage | Authors | Version |
| 2017 Sep 18 | Direct‐acting antivirals for chronic hepatitis C | Review | Janus C Jakobsen, Emil Eik Nielsen, Joshua Feinberg, Kiran Kumar Katakam, Kristina Fobian, Goran Hauser, Goran Poropat, Snezana Djurisic, Karl Heinz Weiss, Milica Bjelakovic, Goran Bjelakovic, Sarah Louise Klingenberg, Jian Ping Liu, Dimitrinka Nikolova, Ronald L Koretz, Christian Gluud | |
| 2017 Jun 06 | Direct‐acting antivirals for chronic hepatitis C | Review | Janus C Jakobsen, Emil Eik Nielsen, Joshua Feinberg, Kiran Kumar Katakam, Kristina Fobian, Goran Hauser, Goran Poropat, Snezana Djurisic, Karl Heinz Weiss, Milica Bjelakovic, Goran Bjelakovic, Sarah Louise Klingenberg, Jian Ping Liu, Dimitrinka Nikolova, Ronald L Koretz, Christian Gluud | |
| 2016 Apr 05 | Direct‐acting antivirals for chronic hepatitis C | Protocol | Janus C Jakobsen, Emil Eik Nielsen, Joshua Feinberg, Kristina Fobian, Kiran Kumar Katakam, Goran Hauser, Goran Poropat, Snezana Djurisic, Karl Heinz Weiss, Milica Bjelakovic, Goran Bjelakovic, Sarah Louise Klingenberg, Jian Ping Liu, Dimitrinka Nikolova, Ronald L Koretz, Christian Gluud | |
Differences between protocol and review
Because of the unbalanced data, the large number of zero events, and the rare incidence of events in the control groups, we used reciprocal zero cell correction and fixed meta‐analysis when analysing all‐cause mortality and serious adverse events (STATA 14; www.stata.com) (Sweeting 2004; Deeks 2011). Otherwise, there are no differences between the planned methodology and the methodology used in this present review.
Keywords
MeSH
Medical Subject Headings (MeSH) Keywords
- Antiviral Agents [adverse effects, *therapeutic use];
- Cause of Death;
- Hepacivirus [drug effects];
- Hepatitis C, Chronic [complications, *drug therapy, mortality];
- Nucleic Acid Synthesis Inhibitors [adverse effects, therapeutic use];
- Placebos [therapeutic use];
- Protease Inhibitors [adverse effects, therapeutic use];
- Randomized Controlled Trials as Topic;
- Safety‐Based Drug Withdrawals;
- Simeprevir [adverse effects, therapeutic use];
Medical Subject Headings Check Words
Humans;
PICO


Study flow diagram
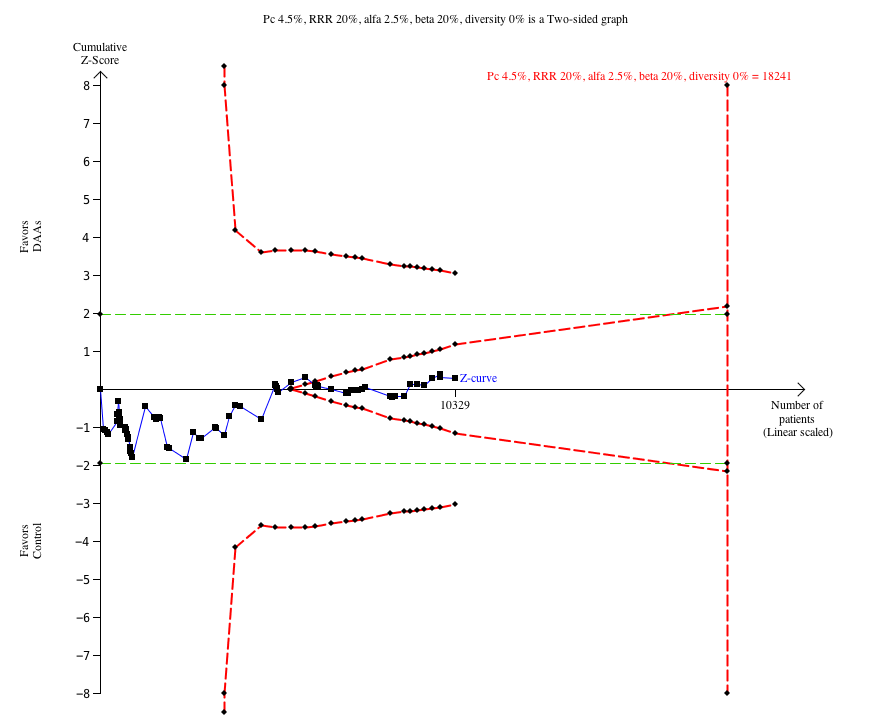
Trial Sequential Analysis of the effects of direct‐acting antivirals on the market or under development versus placebo or no intervention on risk of serious adverse events. The analysis was based on a proportion in the control group (Pc) of 4.5%, a relative risk reduction (RRR) of 20%, and alfa of 2.5%, a beta of 20%, and a diversity of 0%. The cumulative Z‐curve enters the futility area after the randomisation of about 6000 participants.

Trial Sequential Analysis of the effects of simeprevir versus placebo or no intervention on risk of serious adverse events. The analysis was based on a proportion in the control group (Pc) of 8.4%, a relative risk reduction (RRR) of 20%, and alfa of 2.5%, a beta of 20%, and a diversity of 0%. The cumulative Z‐curve crosses the naive type I error level of 5%, but it does not cross the trial monitoring boundary for benefit.

Trial Sequential Analysis of the effects of direct‐acting antivirals on the market or under development versus placebo or no intervention on risk of no sustained virological response. The analysis was based on a proportion in the control group (Pc) of 60.2%, a RRR of 20%, and alfa of 2.5%, a beta of 20%, and a diversity of 83%. After randomisation of about 1000 participants, the cumulative Z‐curve crosses the trial sequential monitoring boundary for benefit.

Trial Sequential Analysis of the effects of withdrawn direct‐acting antivirals versus placebo or no intervention on risk of serious adverse events. The analysis was based on a proportion in the control group (Pc) of 7.5%, a RRR of 20%, and alfa of 2.5%, a beta of 20%, and a diversity of 0%. After randomisation of about 5000 participants, the cumulative Z‐curve crosses the trial sequential monitoring boundary for harm.

Funnel plot of comparison: 3 DAA on or on the way to the market versus placebo/no intervention (sustained virological response), outcome: 3.1 Without sustained virological response.
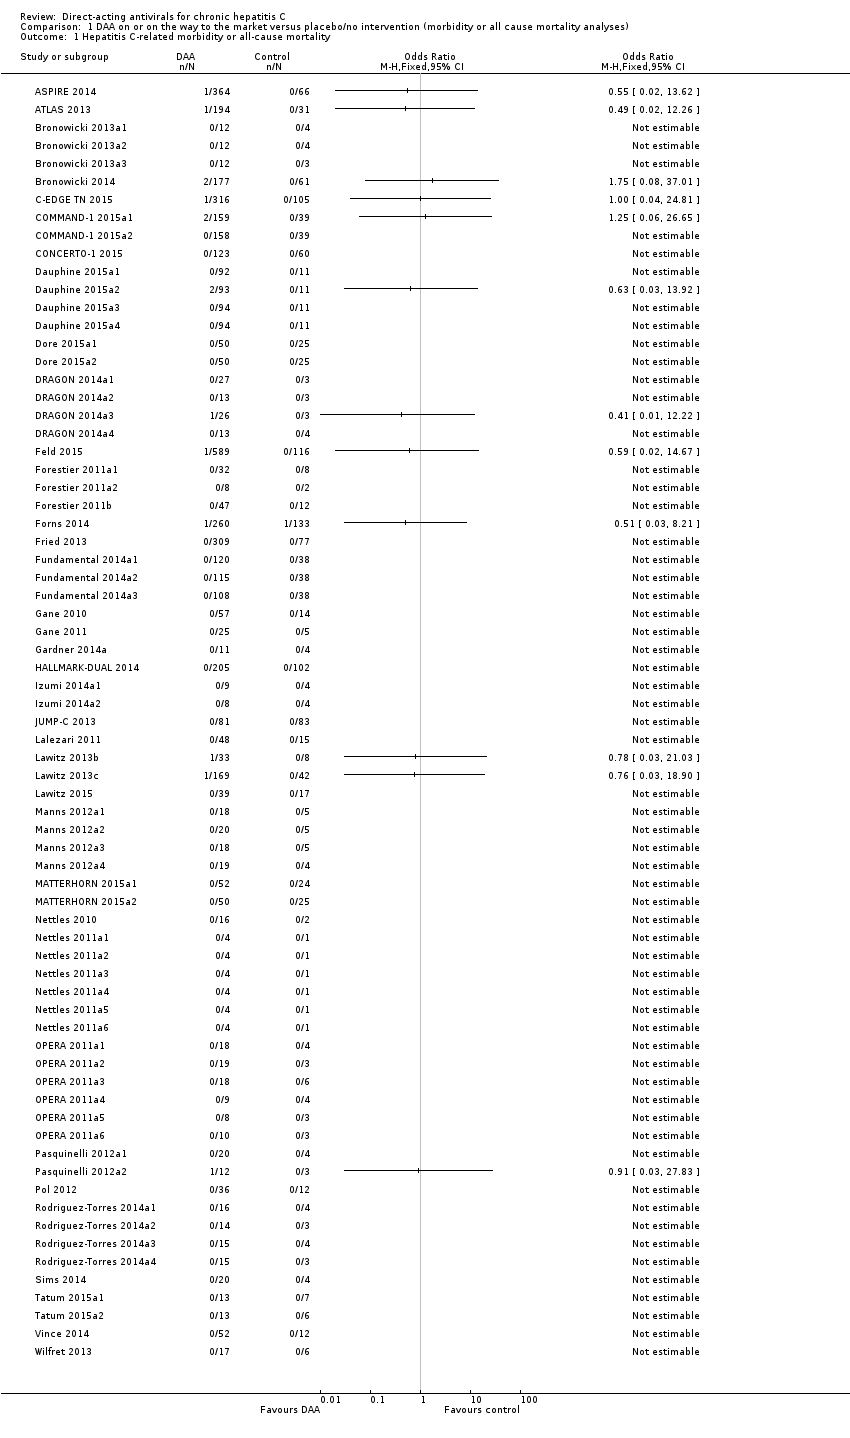
Comparison 1 DAA on or on the way to the market versus placebo/no intervention (morbidity or all cause mortality analyses), Outcome 1 Hepatitis C‐related morbidity or all‐cause mortality.

Comparison 1 DAA on or on the way to the market versus placebo/no intervention (morbidity or all cause mortality analyses), Outcome 2 Hepatitis C‐related morbidity or all‐cause mortality ‐ bias risk.

Comparison 1 DAA on or on the way to the market versus placebo/no intervention (morbidity or all cause mortality analyses), Outcome 3 Hepatitis C‐related morbidity or all‐cause mortality ‐ according to type of DAA.

Comparison 1 DAA on or on the way to the market versus placebo/no intervention (morbidity or all cause mortality analyses), Outcome 4 Hepatitis C‐related morbidity or all‐cause mortality ‐ according to group of DAA.

Comparison 1 DAA on or on the way to the market versus placebo/no intervention (morbidity or all cause mortality analyses), Outcome 5 Hepatitis C‐related morbidity or all‐cause mortality ‐ according to HIV‐infection.

Comparison 1 DAA on or on the way to the market versus placebo/no intervention (morbidity or all cause mortality analyses), Outcome 6 Hepatitis C‐related morbidity or all‐cause mortality ‐ according to comorbidity.

Comparison 1 DAA on or on the way to the market versus placebo/no intervention (morbidity or all cause mortality analyses), Outcome 7 Hepatitis C‐related morbidity or all‐cause mortality ‐ according to viral genotype.

Comparison 1 DAA on or on the way to the market versus placebo/no intervention (morbidity or all cause mortality analyses), Outcome 8 Hepatitis C‐related morbidity or all‐cause mortality ‐ according to human genotype (IL28b).

Comparison 1 DAA on or on the way to the market versus placebo/no intervention (morbidity or all cause mortality analyses), Outcome 9 Hepatitis C‐related morbidity or all‐cause mortality ‐ according to Asian‐region.

Comparison 1 DAA on or on the way to the market versus placebo/no intervention (morbidity or all cause mortality analyses), Outcome 10 Hepatitis C‐related morbidity or all‐cause mortality ‐ according to specific ethnicities.

Comparison 1 DAA on or on the way to the market versus placebo/no intervention (morbidity or all cause mortality analyses), Outcome 11 Hepatitis C‐related morbidity or all‐cause mortality ‐ according to reaching planned sample size.

Comparison 1 DAA on or on the way to the market versus placebo/no intervention (morbidity or all cause mortality analyses), Outcome 12 Hepatitis C‐related morbidity or all‐cause mortality ‐ according to prior treatment.

Comparison 1 DAA on or on the way to the market versus placebo/no intervention (morbidity or all cause mortality analyses), Outcome 13 Hepatitis C‐related morbidity or all‐cause mortality ‐ according to interferon.
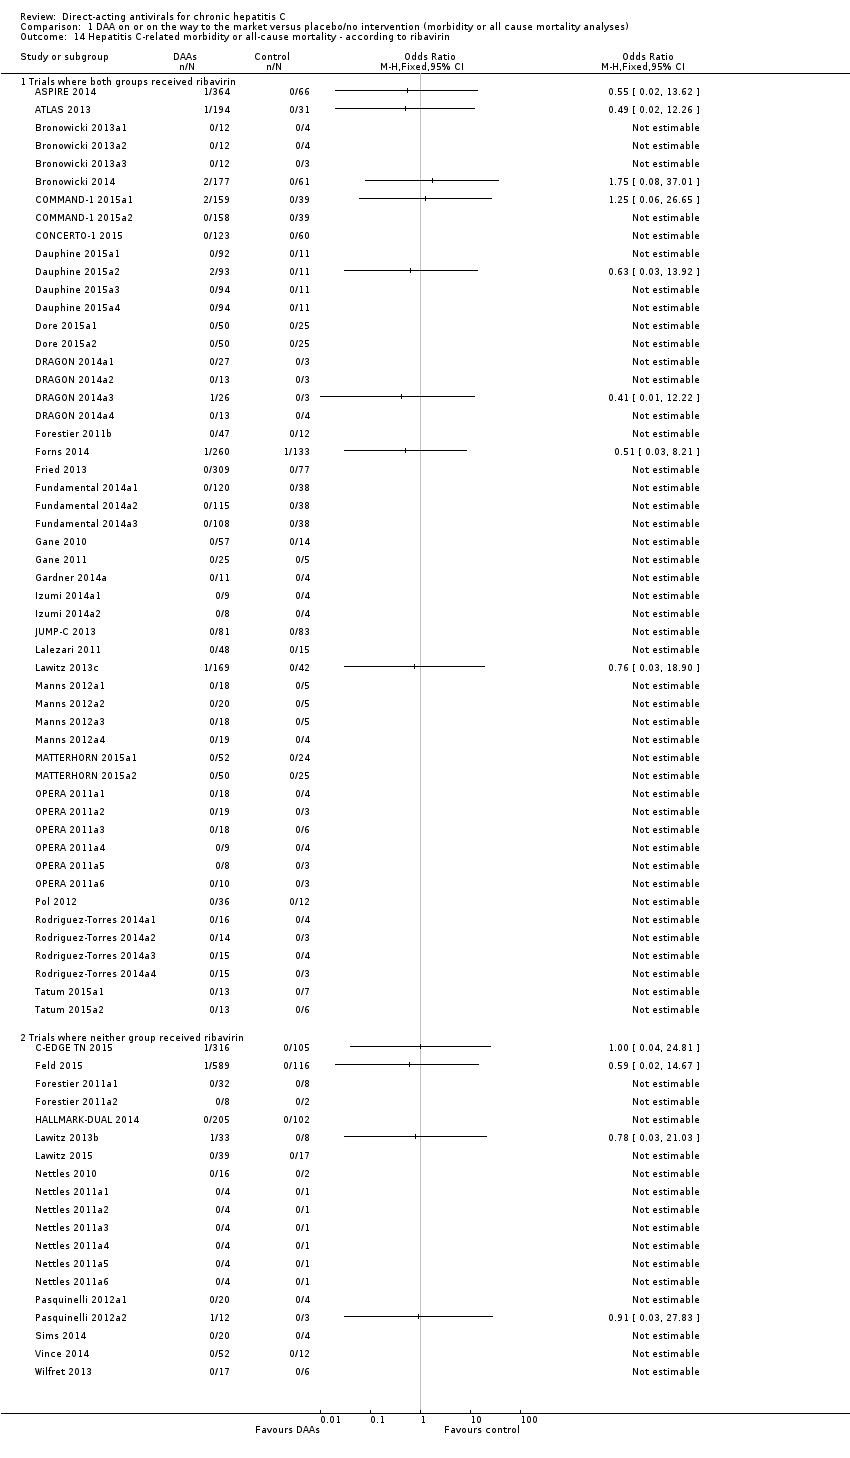
Comparison 1 DAA on or on the way to the market versus placebo/no intervention (morbidity or all cause mortality analyses), Outcome 14 Hepatitis C‐related morbidity or all‐cause mortality ‐ according to ribavirin.

Comparison 1 DAA on or on the way to the market versus placebo/no intervention (morbidity or all cause mortality analyses), Outcome 15 Hepatitis C‐related morbidity or all‐cause mortality ‐ according to chronic kidney disease.

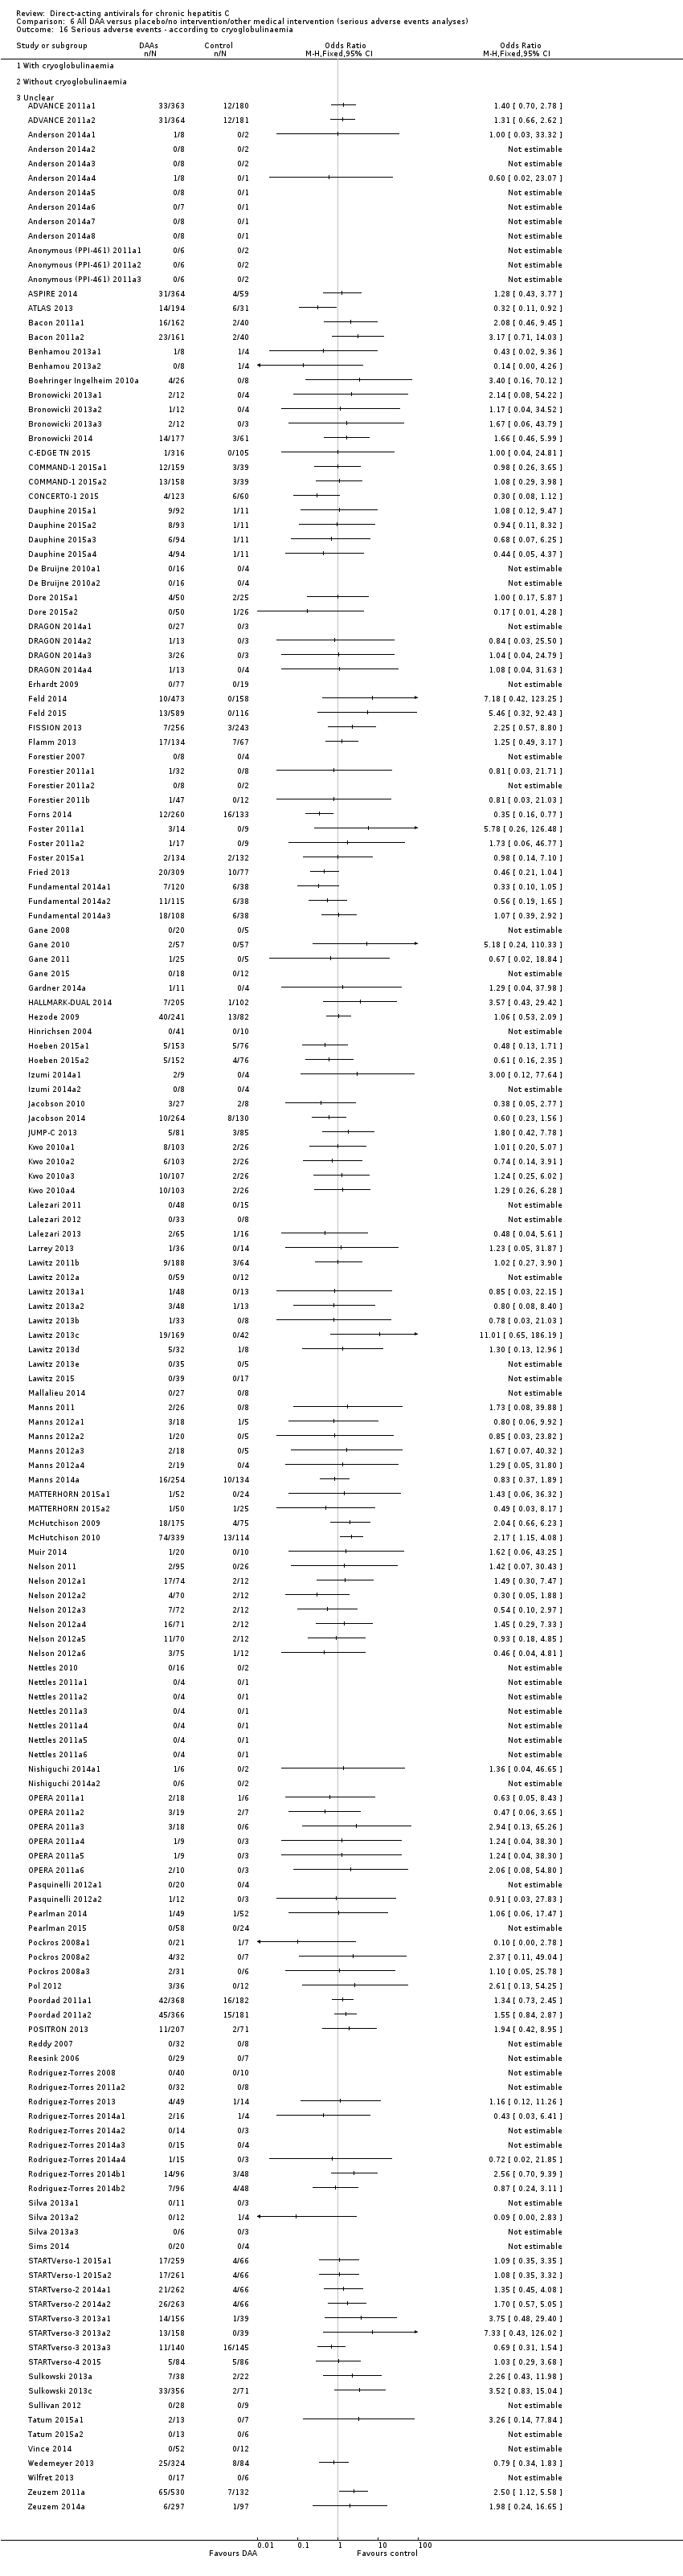
Comparison 1 DAA on or on the way to the market versus placebo/no intervention (morbidity or all cause mortality analyses), Outcome 16 Hepatitis C‐related morbidity or all‐cause mortality ‐ according to cryoglobulinaemia.

Comparison 1 DAA on or on the way to the market versus placebo/no intervention (morbidity or all cause mortality analyses), Outcome 17 Hepatitis C‐related morbidity or all‐cause mortality ‐ according to DAA group as co‐intervention.

Comparison 1 DAA on or on the way to the market versus placebo/no intervention (morbidity or all cause mortality analyses), Outcome 18 Hepatitis C‐related morbidity or all‐cause mortality ‐ according to median dose.

Comparison 2 DAA on or on the way to the market versus placebo/no intervention (serious adverse events analyses), Outcome 1 Serious adverse events.

Comparison 2 DAA on or on the way to the market versus placebo/no intervention (serious adverse events analyses), Outcome 2 Serious adverse events ‐ bias risk.

Comparison 2 DAA on or on the way to the market versus placebo/no intervention (serious adverse events analyses), Outcome 3 Serious adverse events ‐ according to type of DAA.

Comparison 2 DAA on or on the way to the market versus placebo/no intervention (serious adverse events analyses), Outcome 4 Serious adverse events ‐ according to group of DAA.

Comparison 2 DAA on or on the way to the market versus placebo/no intervention (serious adverse events analyses), Outcome 5 Serious adverse events ‐ according to HIV‐infection.

Comparison 2 DAA on or on the way to the market versus placebo/no intervention (serious adverse events analyses), Outcome 6 Serious adverse events ‐ according to comorbidity.

Comparison 2 DAA on or on the way to the market versus placebo/no intervention (serious adverse events analyses), Outcome 7 Serious adverse events ‐ according to viral genotype.

Comparison 2 DAA on or on the way to the market versus placebo/no intervention (serious adverse events analyses), Outcome 8 Serious adverse events ‐ according to human genotype (IL28b).

Comparison 2 DAA on or on the way to the market versus placebo/no intervention (serious adverse events analyses), Outcome 9 Serious adverse events ‐ according to Asian‐region.

Comparison 2 DAA on or on the way to the market versus placebo/no intervention (serious adverse events analyses), Outcome 10 Serious adverse events ‐ according to specific ethnicities.

Comparison 2 DAA on or on the way to the market versus placebo/no intervention (serious adverse events analyses), Outcome 11 Serious adverse events ‐ according to reaching planned sample size.

Comparison 2 DAA on or on the way to the market versus placebo/no intervention (serious adverse events analyses), Outcome 12 Serious adverse events ‐ according to prior treatment.

Comparison 2 DAA on or on the way to the market versus placebo/no intervention (serious adverse events analyses), Outcome 13 Serious adverse events ‐ according to interferon.

Comparison 2 DAA on or on the way to the market versus placebo/no intervention (serious adverse events analyses), Outcome 14 Serious adverse events ‐ according to ribavirin.

Comparison 2 DAA on or on the way to the market versus placebo/no intervention (serious adverse events analyses), Outcome 15 Serious adverse events ‐ according to chronic kidney disease.

Comparison 2 DAA on or on the way to the market versus placebo/no intervention (serious adverse events analyses), Outcome 16 Serious adverse events ‐ according to cryoglobulinaemia.

Comparison 2 DAA on or on the way to the market versus placebo/no intervention (serious adverse events analyses), Outcome 17 Serious adverse events ‐ according to DAA group as co‐intervention.

Comparison 2 DAA on or on the way to the market versus placebo/no intervention (serious adverse events analyses), Outcome 18 Serious adverse events ‐ according to median dose.

Comparison 3 DAA on or on the way to the market versus placebo/no intervention (sustained virological response), Outcome 1 Without sustained virological response.

Comparison 3 DAA on or on the way to the market versus placebo/no intervention (sustained virological response), Outcome 2 Without sustained virological response ‐ bias risk.

Comparison 3 DAA on or on the way to the market versus placebo/no intervention (sustained virological response), Outcome 3 Without sustained virological response ‐ according to type of DAA.

Comparison 3 DAA on or on the way to the market versus placebo/no intervention (sustained virological response), Outcome 4 Without sustained virological response ‐ according to group of DAA.

Comparison 3 DAA on or on the way to the market versus placebo/no intervention (sustained virological response), Outcome 5 Without sustained virological response ‐ according to HIV‐infection.

Comparison 3 DAA on or on the way to the market versus placebo/no intervention (sustained virological response), Outcome 6 Without sustained virological response ‐ according to comorbidity.

Comparison 3 DAA on or on the way to the market versus placebo/no intervention (sustained virological response), Outcome 7 Without sustained virological response ‐ according to viral genotype.
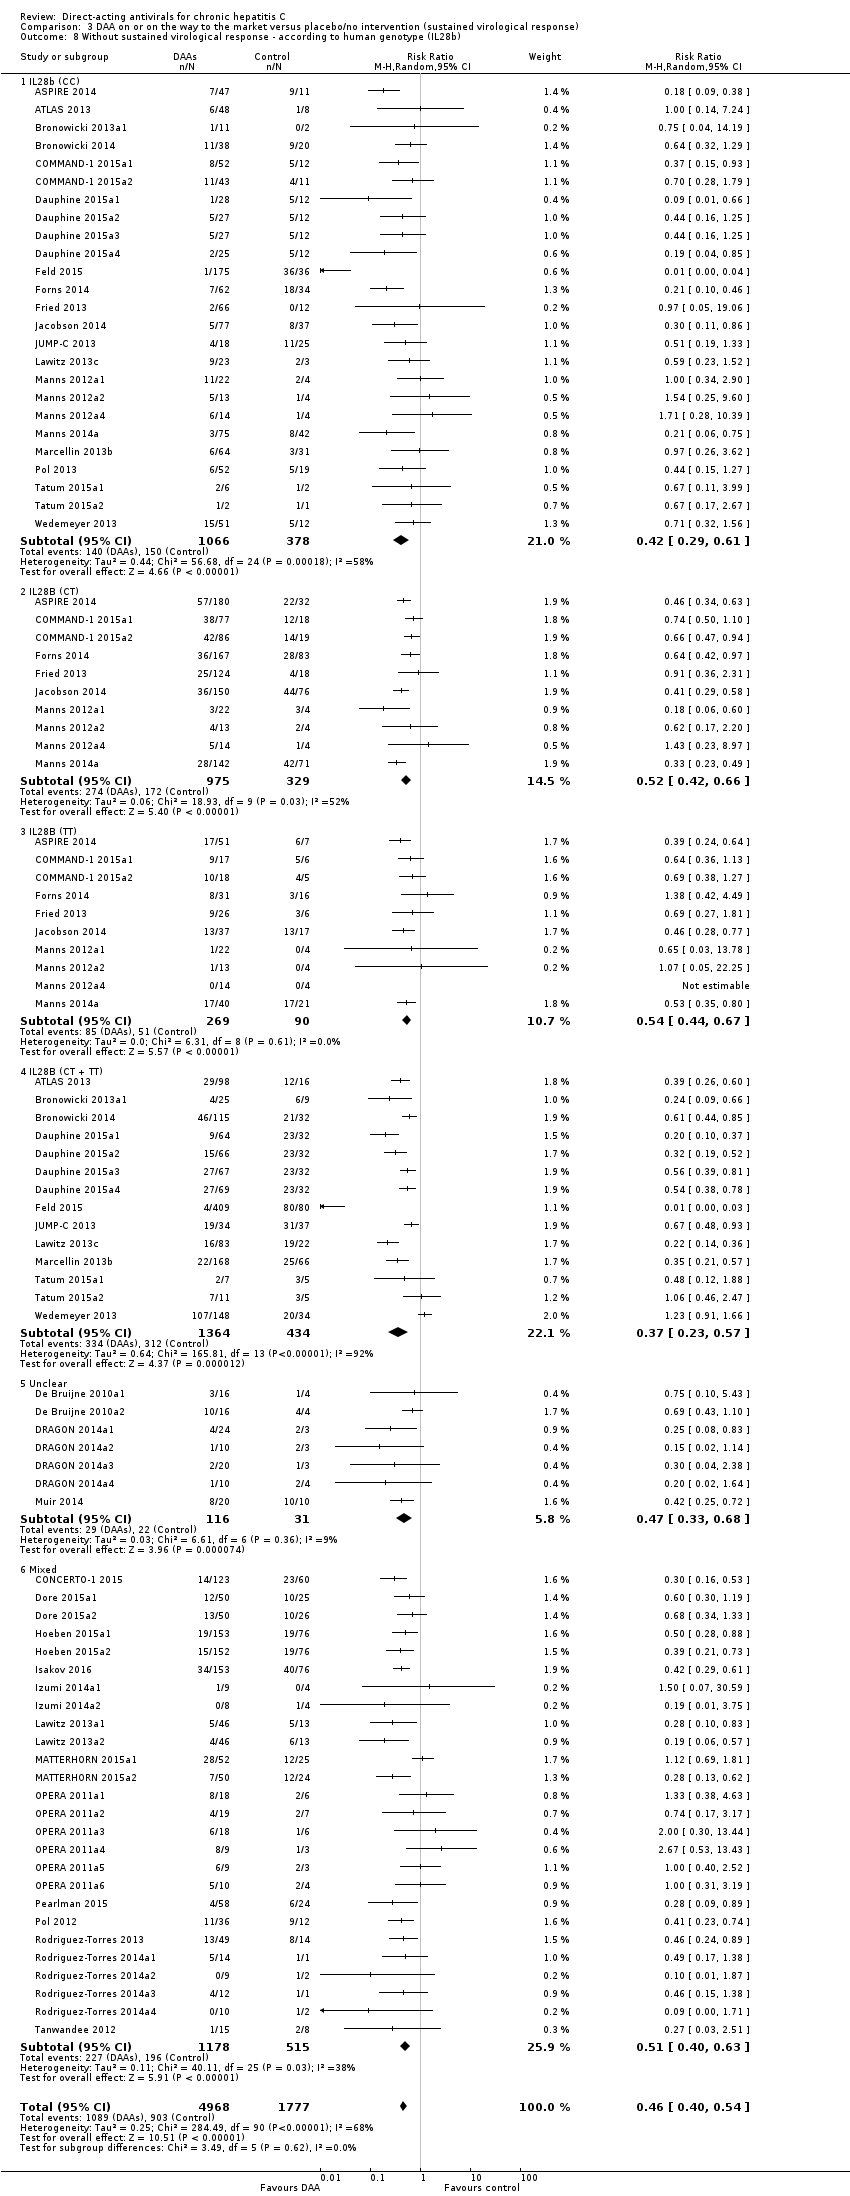
Comparison 3 DAA on or on the way to the market versus placebo/no intervention (sustained virological response), Outcome 8 Without sustained virological response ‐ according to human genotype (IL28b).

Comparison 3 DAA on or on the way to the market versus placebo/no intervention (sustained virological response), Outcome 9 Without sustained virological response ‐ according to Asian‐region.

Comparison 3 DAA on or on the way to the market versus placebo/no intervention (sustained virological response), Outcome 10 Without sustained virological response ‐ according to specific ethnicities.
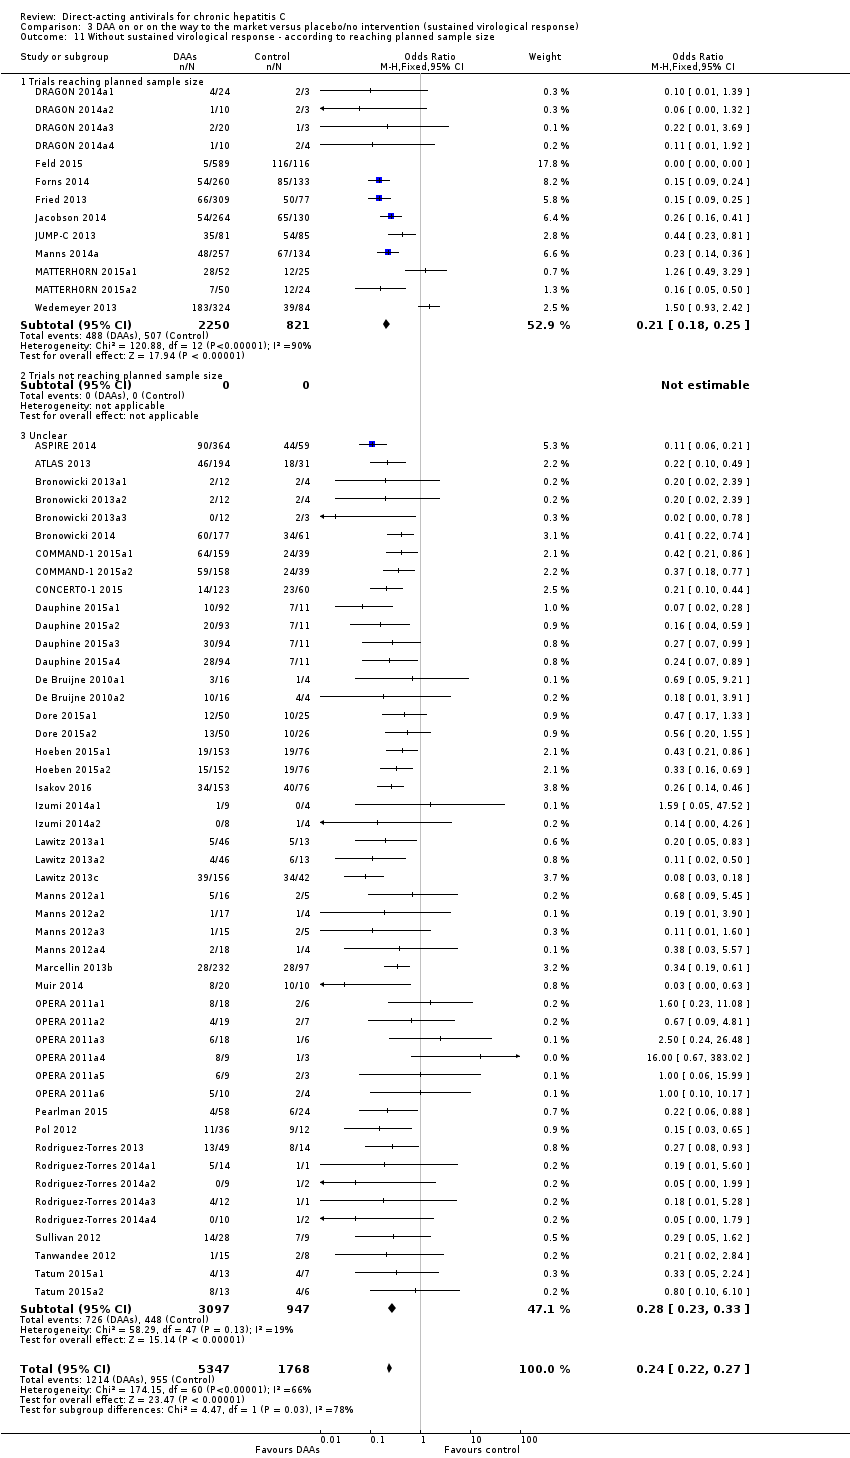
Comparison 3 DAA on or on the way to the market versus placebo/no intervention (sustained virological response), Outcome 11 Without sustained virological response ‐ according to reaching planned sample size.

Comparison 3 DAA on or on the way to the market versus placebo/no intervention (sustained virological response), Outcome 12 Without sustained virological response ‐ according to prior treatment.

Comparison 3 DAA on or on the way to the market versus placebo/no intervention (sustained virological response), Outcome 13 Without sustained virological response ‐ according to interferon.

Comparison 3 DAA on or on the way to the market versus placebo/no intervention (sustained virological response), Outcome 14 Without sustained virological response ‐ according to ribavirin.

Comparison 3 DAA on or on the way to the market versus placebo/no intervention (sustained virological response), Outcome 15 Without sustained virological response ‐ according to chronic kidney disease.

Comparison 3 DAA on or on the way to the market versus placebo/no intervention (sustained virological response), Outcome 16 Without sustained virological response ‐ according to cryoglobulinaemia.

Comparison 3 DAA on or on the way to the market versus placebo/no intervention (sustained virological response), Outcome 17 Without sustained virological response ‐ according to DAA group as co‐intervention.

Comparison 3 DAA on or on the way to the market versus placebo/no intervention (sustained virological response), Outcome 18 Without sustained virological response ‐ 'Best‐worst case' scenario.

Comparison 3 DAA on or on the way to the market versus placebo/no intervention (sustained virological response), Outcome 19 Without sustained virological response ‐ 'Worst‐best case' scenario.

Comparison 3 DAA on or on the way to the market versus placebo/no intervention (sustained virological response), Outcome 20 Without sustained virological response ‐ according to median dose.

Comparison 4 Danoprevir versus placebo/no intervention, Outcome 1 Hepatitis C‐related morbidity or all‐cause mortality.

Comparison 4 Danoprevir versus placebo/no intervention, Outcome 2 Hepatitis C‐related morbidity or all‐cause mortality ‐ according to dose.

Comparison 4 Danoprevir versus placebo/no intervention, Outcome 3 Serious adverse events.

Comparison 4 Danoprevir versus placebo/no intervention, Outcome 4 Serious adverse events ‐ according to median dose.

Comparison 4 Danoprevir versus placebo/no intervention, Outcome 5 Without sustained virological response.

Comparison 4 Danoprevir versus placebo/no intervention, Outcome 6 Without sustained virological response ‐ according to median dose.

Comparison 5 All DAA versus placebo/no intervention/other medical intervention (morbidity or all‐cause mortality analyses), Outcome 1 Hepatitis C‐related morbidity or all‐cause mortality.

Comparison 6 All DAA versus placebo/no intervention/other medical intervention (serious adverse events analyses), Outcome 1 Serious adverse events.

Comparison 6 All DAA versus placebo/no intervention/other medical intervention (serious adverse events analyses), Outcome 2 Serious adverse events ‐ bias risk.

Comparison 6 All DAA versus placebo/no intervention/other medical intervention (serious adverse events analyses), Outcome 3 Serious adverse events ‐ according to type of DAA.

Comparison 6 All DAA versus placebo/no intervention/other medical intervention (serious adverse events analyses), Outcome 4 Serious adverse events ‐ according to group of DAA.

Comparison 6 All DAA versus placebo/no intervention/other medical intervention (serious adverse events analyses), Outcome 5 Serious adverse events ‐ according to HIV‐infection.

Comparison 6 All DAA versus placebo/no intervention/other medical intervention (serious adverse events analyses), Outcome 6 Serious adverse events ‐ according to comorbidity.

Comparison 6 All DAA versus placebo/no intervention/other medical intervention (serious adverse events analyses), Outcome 7 Serious adverse events ‐ according to viral genotype.

Comparison 6 All DAA versus placebo/no intervention/other medical intervention (serious adverse events analyses), Outcome 8 Serious adverse events ‐ according to human genotype (IL28b).

Comparison 6 All DAA versus placebo/no intervention/other medical intervention (serious adverse events analyses), Outcome 9 Serious adverse events ‐ according to Asian‐region.

Comparison 6 All DAA versus placebo/no intervention/other medical intervention (serious adverse events analyses), Outcome 10 Serious adverse events ‐ according to specific ethnicities.

Comparison 6 All DAA versus placebo/no intervention/other medical intervention (serious adverse events analyses), Outcome 12 Serious adverse events ‐ according to prior treatment.

Comparison 6 All DAA versus placebo/no intervention/other medical intervention (serious adverse events analyses), Outcome 13 Serious adverse events ‐ according to interferon.

Comparison 6 All DAA versus placebo/no intervention/other medical intervention (serious adverse events analyses), Outcome 14 Serious adverse events ‐ according to ribavirin.

Comparison 6 All DAA versus placebo/no intervention/other medical intervention (serious adverse events analyses), Outcome 15 Serious adverse events ‐ according to chronic kidney disease.
Comparison 6 All DAA versus placebo/no intervention/other medical intervention (serious adverse events analyses), Outcome 16 Serious adverse events ‐ according to cryoglobulinaemia.

Comparison 6 All DAA versus placebo/no intervention/other medical intervention (serious adverse events analyses), Outcome 17 Serious adverse events ‐ according to DAA group as co‐intervention.

Comparison 7 All DAA versus placebo/no intervention/other medical intervention (sustained virological response analyses), Outcome 1 Without sustained virological response.

Comparison 8 All DAA versus placebo/no intervention/other medical intervention (quality of life scores), Outcome 1 SF‐36 physical score.
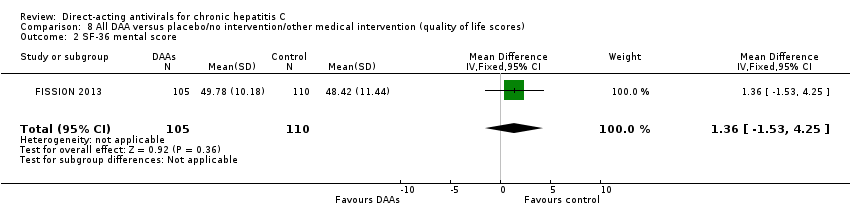
Comparison 8 All DAA versus placebo/no intervention/other medical intervention (quality of life scores), Outcome 2 SF‐36 mental score.
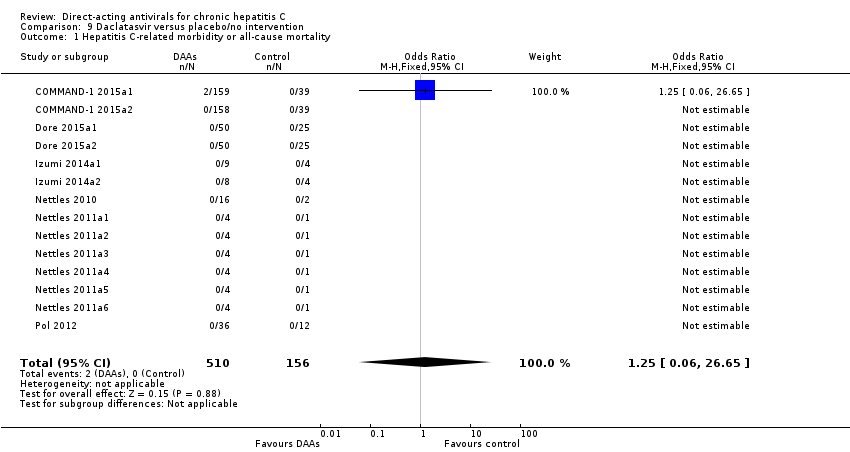
Comparison 9 Daclatasvir versus placebo/no intervention, Outcome 1 Hepatitis C‐related morbidity or all‐cause mortality.

Comparison 9 Daclatasvir versus placebo/no intervention, Outcome 2 Hepatitis C‐related morbidity or all‐cause mortality ‐ according to dose.

Comparison 9 Daclatasvir versus placebo/no intervention, Outcome 3 Serious adverse events.

Comparison 9 Daclatasvir versus placebo/no intervention, Outcome 4 Serious adverse events ‐ according to median dose.

Comparison 9 Daclatasvir versus placebo/no intervention, Outcome 5 Without sustained virological response.

Comparison 9 Daclatasvir versus placebo/no intervention, Outcome 6 Without sustained virological response ‐ according to median dose.

Comparison 10 Simeprevir versus placebo/no intervention, Outcome 1 Hepatitis C‐related morbidity or all‐cause mortality.

Comparison 10 Simeprevir versus placebo/no intervention, Outcome 2 Hepatitis C‐related morbidity or all‐cause mortality ‐ according to dose.

Comparison 10 Simeprevir versus placebo/no intervention, Outcome 3 Serious adverse events.

Comparison 10 Simeprevir versus placebo/no intervention, Outcome 4 Serious adverse events ‐ according to median dose.
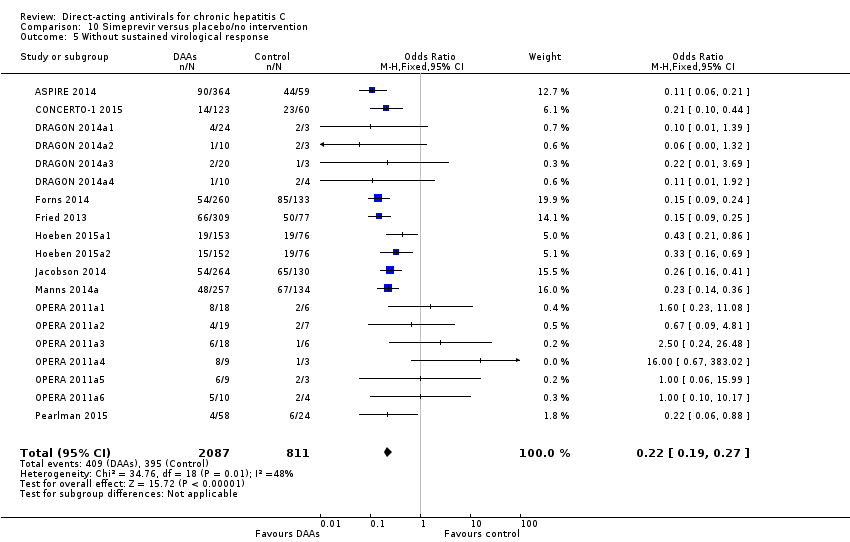
Comparison 10 Simeprevir versus placebo/no intervention, Outcome 5 Without sustained virological response.

Comparison 10 Simeprevir versus placebo/no intervention, Outcome 6 Without sustained virological response ‐ according to median dose.

Comparison 11 Vaniprevir versus placebo/no intervention, Outcome 1 Hepatitis C‐related morbidity or all‐cause mortality.

Comparison 11 Vaniprevir versus placebo/no intervention, Outcome 2 Hepatitis C‐related morbidity or all‐cause mortality ‐ according to dose.

Comparison 11 Vaniprevir versus placebo/no intervention, Outcome 3 Serious adverse events.

Comparison 11 Vaniprevir versus placebo/no intervention, Outcome 4 Serious adverse events ‐ according to median dose.

Comparison 11 Vaniprevir versus placebo/no intervention, Outcome 5 Without sustained virological response.

Comparison 11 Vaniprevir versus placebo/no intervention, Outcome 6 Without sustained virological response ‐ according to median dose.

Comparison 12 All DAA versus placebo/no intervention, Outcome 1 Without significant reductions in ALT/AST serum levels.

Comparison 12 All DAA versus placebo/no intervention, Outcome 2 Without significant reductions in ALT/AST serum levels ‐ according to DAA status.
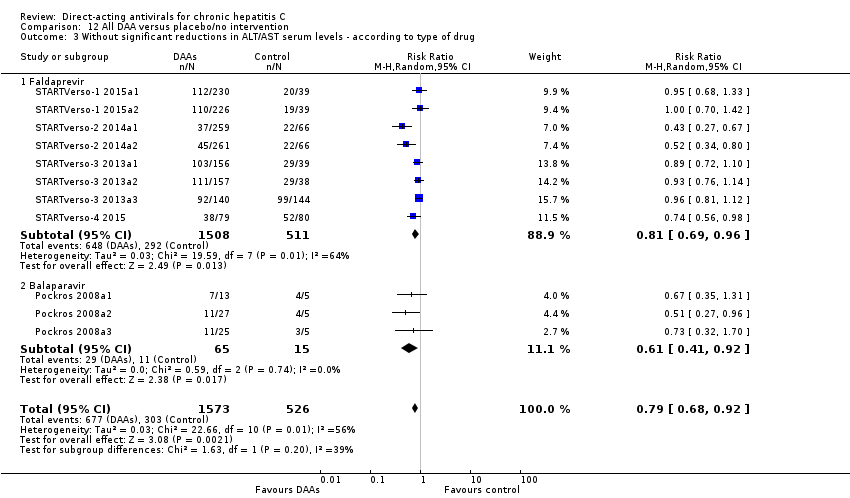
Comparison 12 All DAA versus placebo/no intervention, Outcome 3 Without significant reductions in ALT/AST serum levels ‐ according to type of drug.
| Direct‐acting antivirals versus control | ||||||
| Patient or population: adults with chronic hepatitis C | ||||||
| Outcomes | Anticipated absolute effects* (95% CI) | Relative effect (TSA‐adjusted CI) | № of participants | Quality of the evidence | Comments | |
| Risk with placebo or no intervention | Risk with direct‐acting antivirals | |||||
| All‐cause mortality at maximum follow‐up | 2 per 1000 | 7 per 1000 | OR 3.72 (‐) | 2996 | ⊕⊝⊝⊝ | It was not possible to perform Trial Sequential Analysis because of limited data and too few events |
| Proportion of participants with one or more serious adverse event at maximum follow‐up | 56 per 1000 | 52 per 1000 | OR 0.93 (TSA CI 0.71 to 1.33) | 15,817 | ⊕⊝⊝⊝ | Trial Sequential Analysis showed that the boundary for futility was crossed. This leads us to conclude that any possible intervention effect, if any, is less than 20% |
| Proportion of participants with no sustained virological response at maximum follow‐up | 541 per 1000 | 238 per 1000 | RR 0.44 (TSA CI 0.42 to 0.55) | 6886 | ⊕⊕⊝⊝ Low3 | Trial Sequential Analysis showed that the boundary for benefit was crossed. This indicates that DAAs seem to decrease the risk of no sustained virological response by at least 20% if risk of bias and other threats to the validity can be disregarded |
| *The risk in the intervention group (and its 95% confidence interval) is based on the observed risk in the comparison group and the relative effect of the intervention (and its 95% CI). | ||||||
| GRADE Working Group grades of evidence | ||||||
| 1Downgraded two levels because of very serious risk of bias in the included trials (see Figure 1) and two levels due to very serious imprecision (none of the TSA boundaries are crossed, so the information size is too low). | ||||||
| Direct‐acting antivirals withdrawn from the market versus control | ||||||
| Patient or population: adults with chronic hepatitis C | ||||||
| Outcomes | Anticipated absolute effects* (95% CI) | Relative effect (TSA‐adjusted CI) | № of participants | Quality of the evidence | Comments | |
| Risk with placebo or no intervention | Risk with direct‐acting antivirals | |||||
| All‐cause mortality at maximum follow‐up | 7 per 1000 | 5 per 1000 | OR 0.64 (‐) | 3045 | ⊕⊝⊝⊝ | It was not possible to perform Trial Sequential Analysis because of limited data and too few events |
| Proportion of participants with one or more serious adverse event at maximum follow‐up | 75 per 1000 | 108 per 1000 | OR 1.45 (TSA 1.16 to 1.82) | 9229 | ⊕⊝⊝⊝ | Trial Sequential Analysis showed that the boundary for harm was crossed. This shows that there is firm evidence that withdrawn DAAs increase the risk of a serious adverse event by at least 20% |
| Proportion of participants with no sustained virological response at maximum follow‐up | 586 per 1000 | 356 per 1000 | RR 0.61 (0.55, 0.69) (TSA CI 0.42 to 0.55) | 9075 | ⊕⊕⊝⊝ Low3 | Trial Sequential Analysis not performed |
| *The risk in the intervention group (and its 95% confidence interval) is based on the observed risk in the comparison group and the relative effect of the intervention (and its 95% CI). CI: confidence interval; DAA: direct‐acting antivirals; OR: odds ratio; RCTs: randomised clinical trials; RR: risk ratio; TSA: Trial Sequential Analysis | ||||||
| GRADE Working Group grades of evidence | ||||||
| 1Downgraded two levels because of very serious risk of bias in the included trials (see Figure 1) and two levels due to very serious imprecision (none of the TSA boundaries are crossed so the information size is too low). | ||||||
| Direct‐acting antiviral agents (DAAs) | |||
| NS3/NS4A inhibitors | NS5B inhibitors | NS5A inhibitors | |
| NPI | NNPI | ||
| ACH‐2684 | ALS2200/VX135 | ABT‐072 | ACH‐2928 |
| Asunaprevir | BILB1941 | Beclabuvir | Daclatasvir |
| Boceprevir | GS0938/PSI352938 | BI201127 | Elbasvir |
| Celuprevir | GS6620 | Dasabuvir | GSK2336805 |
| Danoprevir | GS9851(PSI7851) | Deleobuvir | Ledipasvir |
| Faldaprevir | IDX184 | Filibuvir | MK‐8408 |
| Grazoprevir | INX189/BMS986094 | GSK2878175/GSK175 | Odalasvir |
| GS9256 | Mericitabine | IDX375 | Ombitasvir |
| GS9857 | MK‐3682 | MK‐3281 | PPI461 |
| IDX320 | Sofosbuvir | Nesbuvir | Ravidasvir |
| Narlaprevir | VX‐135 | Radalbuvir | Samatasvir |
| Paritaprevir | ‐ | Setrobuvir | Velpatasvir |
| PHX1766 | ‐ | Tegobuvir | ‐ |
| Simperevir | ‐ | TMC‐647055 | ‐ |
| Sovaprevir | ‐ | VCH‐759 | ‐ |
| Telaprevir | ‐ | VCH‐916 | ‐ |
| Vaniprevir | ‐ | VX222 | ‐ |
| Vedroprevir | ‐ | ‐ | ‐ |
| The table presents a list of 58 direct‐acting antiviral agents (DAAs). We have listed the DAAs according to the DAA class they belong to (see Background section). When a DAA has not been assigned a generic or brand name, we have presented it with its experimental compound number prefix. | |||
| Trial | Experimental intervention | Type and number of serious adverse events (experimental group) | Proportion of participants with a serious adverse event (experimental group) | Type and number of serious adverse events (control group) | Proportion of participants with a serious adverse event (control group) |
| Asunaprevir | 1 abdominal pain, 1 lung neoplasm malignant, 1 cytolytic hepatitis, and 2 unspecified events | 5 out of 36 | None reported | 0 out of 11 | |
| Asunaprevir | 2 deaths and 14 unspecified events | 16 out of 177 | 3 unspecified events | 3 out of 61 | |
| Balapiravir | Many events but only a few were specified: 3 deaths, 10 haematological, 10 infection, 8 eye disorders | 49 out of 432 | Many events but not all were specified: 2 infections, 1 death | 9 out of 72 | |
| Beclabuvir | 1 anaemia, 1 constipation, 1 febrile neutropenia, 1 leukopenia | 1 out of 26 | 1 serotonin syndrome | 1 out of 13 | |
| Boceprevir | 5 anaemia, 1 angina pectoris, 1 atrial fibrillation, 1 coronary artery disease, 1 myocardial infarction, 1 myopericarditis, 2 abdominal pain, 1 constipation, 1 diarrhoea, 1 gastritis, 1 irritable bowel syndrome, 1 oesophageal varices haemorrhage, 1 pancreatitis acute, 1 pancreatitis necrotising, 1 peptic ulcer, 1 asthenia, 3 chest pain, 1 oedema peripheral, 1 pyrexia, 1 cholecystitis, 3 appendicitis, 1 bronchopneumonia, 1 catheter site infection, 1 gastroenteritis viral, 1 pneumonia, 1 lower limb fracture, 1 overdose, 1 decreased appetite, 1 dehydration, 1 hyperglycaemia, 1 back pain, 2 intervertebral disc protrusion, 1 pain in extremity, 1 hepatic neoplasm malignant, 1 hepatic encephalopathy, 1 sciatica, 1 syncope, 1 bipolar disorder, 1 completed suicide, 4 depression, 2 homicidal ideation, 5 suicidal ideation, 2 dyspnoea, 1 pleuritic pain, 1 pneumothorax, 1 abdominal hernia repair, 1 deep vein thrombosis, 1 phlebitis | 39 out of 323 | 2 chest pain, 1 cholelithiasis, 1 gastroenteritis | 4 out of 80 | |
| Boceprevir | 1 coronary artery disease, 1 diarrhoea, 1 asthenia, 1 pyrexia, 2 pneumonia, 2 syncope, 1 suicidal ideation, 1 deep vein thrombosis, 1 neutropenia, 1 thrombocytopenia, 1 cardiac failure, 1 upper gastrointestinal haemorrhage , 1 multi‐organ failure, 1 bronchitis, 1 cellulitis, 1 chlamydia infection, 1 influenza, 1 pneumonia staphylococcal, 1 staphylococcal bacteraemia, 1 staphylococcal infection, 1 urosepsis, 1 gun shot wound, 2 hyponatraemia, 1 lethargy, 1 subarachnoid haemorrhage, 1 mental status changes | 18 out of 134 | 1 chest pain, 1 intervertebral disc protrusion, 1 abnormal behaviour, 1 irritability, 1 osteotomy, 1 foreign body, 1 neuralgia, 1 anxiety, 1 renal colic | 7 out of 67 | |
| Boceprevir | 14 neutropenia, 1 intestinal obstruction, 1 osteomyelitis chronic, 1 pneumonia, 1 diabetic ketoacidosis, 1 intervertebral disc protrusion, 1 transient ischaemic attack | 17 out of 159 | 4 neutropenia, 1 general disorders, 1 accidental overdose, 1 prostatitis, 2 hypertension | 9 out of 78 | |
| Boceprevir | 1 anaemia, 1 abdominal pain, 2 asthenia, 2 pyrexia, 2 pneumonia, 1 decreased appetite, 1 dehydration, 2 depression, 2 homicidal ideation, 3 suicidal ideation, 1 dyspnoea, 1 deep vein thrombosis, 3 nausea, 1 vomiting, 3 neutropenia, 1 multi‐organ failure, 2 cellulitis, 2 abdominal pain upper, 1 headache, 1 suicide attempt, 1 accidental overdose, 1 fall, 1 pulmonary embolism, 1 gastroenteritis, 1 erysipelas, 1 panic attack, 1 fatigue, 1 supraventricular tachycardia, 3 pancreatitis, 1 cerebrovascular accident, 1 hypoaesthesia, 1 anxiety, 1 retinal ischaemia, 1 neuropathy peripheral, 1 aggression, 1 scotoma, 1 hypovolaemia, 1 vulval abscess, 1 retinopathy, 1 inguinal hernia, 1 cervix carcinoma, 1 pericarditis, 1 paranoia, 1 neutrophil count decreased, 1 paraesthesia, 1 peritoneal haemorrhage, 1 deafness unilateral, 1 periodontal disease, 1 corneal infection, 1 pneumonia streptococcal, 1 drug toxicity, 1 blood amylase increased, 1 lipase increased, 1 basal cell carcinoma, 1 renal cell carcinoma | 40 out of 527 | 1 suicidal ideation, 1 breast cancer, 1 parathyroid tumour benign, 1 muscle spasms, 1 rib fracture, 1 contusion, 1 inguinal hernia, 1 diplopia, 1 staphylococcal sepsis, 1 animal bite, 1 hand fracture, 1 third nerve paralysis, 1 alcoholism, 1 dependence | 8 out of 104 | |
| Boceprevir | 1 anaemia | 1 out of 49 | 1 anaemia | 1 out of 52 | |
| Boceprevir | 7 anaemia, 1 atrial fibrillation, 1 coronary artery disease, 2 abdominal pain, 1 gastritis, 1 pancreatitis acute, 5 chest pain, 4 pyrexia, 1 cholecystitis, 4 pneumonia, 1 overdose, 1 dehydration, 1 back pain, 1 intervertebral disc protrusion, 5 syncope, 1 completed suicide, 2 depression, 4 suicidal ideation, 1 dyspnoea, 1 nausea, 2 vomiting, 3 neutropenia, 3 thrombocytopenia, 2 bronchitis, 3 cellulitis, 1 staphylococcal infection, 1 hyponatraemia, 1 pancytopenia, 1 breast cancer, 1 malaise, 1 pneumonia pneumococcal, 1 haemoptysis, 1 road traffic accident, 1 suicide attempt, 1 pruritus, 1 rash erythematous, 1 dizziness, 2 pulmonary embolism, 1 haemorrhoids, 4 gastroenteritis, 1 general physical health deterioration, 1 hypertensive crisis, 1 colon cancer, 1 drug abuse, 2 hypokalaemia, 2 chest discomfort, 1 fatigue, 1 perirectal abscess, 1 acute myocardial infarction, 1 gastrointestinal haemorrhage, 1 aplasia pure red cell, 2 leukopenia, 1 atrial flutter, 1 cardiac arrest, 1 hypertrophic cardiomyopathy, 1 tachycardia, 1 deafness, 1 conjunctivitis, 1 optic neuropathy, 1 papilledema, 1 abdominal pain lower, 1 colonic polyp, 1 gastroesophageal reflux disease, 1 hematemesis, 1 haemorrhoidal haemorrhage, 1 Mallory‐weiss syndrome, 1 umbilical hernia, 1 sarcoidosis, 1 abscess, 1 abscess limb, 1 bacteraemia, 1 epiglottitis, 1 infected bites, 1 injection site infection, 1 scrotal abscess, 1 tracheobronchitis, 1 post procedural complication, 1 transfusion reaction, 1 vascular pseudoaneurysm, 1 wound dehiscence, 1 flank pain, 1 groin pain, 1 musculoskeletal chest pain, 1 bladder cancer, 1 pancreatic carcinoma, 1 prostate cancer, 1 carotid artery stenosis, 1 cerebral ischaemia, 1 motor neurone disease, 1 muscle spasticity, 1 affective disorder, 1 alcohol abuse, 1 anxiety, 1 psychiatric decompensation, 1 scrotal pain, 2 cough, 1 pleural fibrosis, 1 alcohol use, 1 laryngeal operation, 1 accelerated hypertension, 1 arterial thrombosis limb, 2 hypotension | 87 out of 734 | 1 anaemia, 1 myocardial infarction, 1 abdominal pain, 2 pyrexia, 1 cholecystitis, 1 appendicitis, 1 pneumonia, 1 hepatic neoplasm malignant, 1 completed suicide, 1 depression, 1 suicidal ideation, 1 pneumothorax, 2 cholelithiasis, 1 nausea, 1 vomiting, 1 cellulitis, 1 breast cancer, 1 colitis, 1 upper respiratory tract infection, 1 suicide attempt, 2 death, 1 accidental overdose, 1 dizziness, 1 loss of consciousness, 1 cholecystitis acute, 1 sinusitis, 2 pancreatitis, 1 leukocytosis, 1 cardiac arrest, 1 cardio‐respiratory arrest, 1 hypothyroidism, 1 cholelithiasis obstructive, 1 atypical mycobacterial infection, 1 diverticulitis, 1 enterocolitis infectious, 1 alcohol poisoning, 1 spinal fracture, 1 white blood cell count decreased, 1 lung adenocarcinoma, 1 prostate cancer, 1 hypoaesthesia, 1 affective disorder, 1 bipolar disorder, 1 drug dependence, 1 intentional self‐injury, 1 personality disorder, 1 glomerulonephritis minimal lesion, 1 renal tubular necrosis, 1 physical assault, 1 cholecystectomy, 1 skin neoplasm excision | 31 out of 363 | |
| Boceprevir | None reported | 0 out of 28 | 1 atrial fibrillation | 1 out of 10 | |
| Boceprevir | 3 anaemia, 2 pneumonia, 1 syncope, 1 depression, 1 deep vein thrombosis, 1 lymphadenopathy, 1 renal failure acute, 2 pulmonary embolism, 1 arthralgia, 1 sinusitis, 1 urinary tract infection, 1 lung infection pseudomonal, 1 pelvic inflammatory disease, 1 pulmonary hypertension, 1 suicide attempt | 11 out of 64 | 2 anaemia, 1 overdose, 1 cholelithiasis, 1 abdominal pain upper, 1 meniscus lesion, 1 pancreatitis, 1 post procedural infection, 1 renal failure, 1 cholecystectomy, 1 vulval abscess, 1 ventricular fibrillation, 1 ligament rupture, 1 lactic acidosis, 1 respiratory failure | 7 out of 34 | |
| Daclatasvir | 1 hepatic neoplasm malignant, 1 rectal ulcer haemorrhage, 1 gastrointestinal inflammation, 1 adhesion, 1 biliary colic, 1 hyperbilirubinaemia, 1 appendiceal abscess, 1 tonsil cancer | 6 out of 196 | 1 abdominal pain upper, 1 epicondylitis, 1 conversion disorder | 3 out of 100 | |
| Daclatasvir | 1 anaemia, 1 abdominal pain, 1 gastritis, 1 chest pain, 2 pneumonia, 1 overdose, 1 syncope, 2 depression, 2 suicidal ideation, 1 dyspnoea, 1 bronchitis, 1 peritonitis, 1 rash generalised, 1 febrile neutropenia, 1 aplastic anaemia, 1 auricular perichondritis, 2 gastric ulcer haemorrhage, 1 death, 1 bile duct stone, 1 clostridium difficile, 1 furuncle, 1 carbuncle, 1 oral herpes, 1 accidental overdose, 2 falls, 1 bursitis, 1 rhabdomyolysis, 1 muscle spasms, 1 costochondritis, 1 dizziness, 1 loss of consciousness, 1 adjustment disorder, 1 hypomania, 1 mental disorder, 1 substance‐induced psychotic disorder, 1 schizophrenia, paranoid type | 25 out of 317 | 2 anaemia, 1 atrial fibrillation, 1 pneumonia, 1 pyelonephritis, 1 haemoglobin decreased, 1 epistaxis, 1 electrocardiogram change, 1 neutrophil count decreased, 1 myalgia, 1 aphasia, 1 paraesthesia | 6 out of 78 | |
| Daclatasvir | 1 pancreatitis acute, 1 back pain | 2 out of 34 | None reported | 0 out of 8 | |
| Daclatasvir | 1 anaemia, 1 chest pain, 2 syncope, 1 bronchitis, 1 epistaxis | 3 out of 36 | None reported | 0 out of 12 | |
| Danoprevir | 28 unspecified SAEs and 2 deaths | 29 out of 373 | 1 unspecified SAE | 1 out of 44 | |
| Danoprevir | 1 benign paroxysmal vertigo | 1 out of 40 | None reported | 0 out of 8 | |
| Danoprevir | 1 gastroenteritis viral | 1 out of 47 | None reported | 0 out of 12 | |
| Danoprevir | 1 altered mood | 1 out of 25 | None reported | 0 out of 5 | |
| Danoprevir | 14 SAEs but not specified, 1 death | 15 out of 194 | 6 SAEs but not specified | 6 out of 31 | |
| Deleobuvir | 1 drug eruption | 1 out of 46 | None reported | 0 out of 14 | |
| Deleobuvir | 1 syncope, 1 rash maculo‐papular, 1 umbilical hernia | 3 out of 49 | None reported | 0 out of 8 | |
| Faldaprevir | 2 anaemia, 1 angina pectoris, 2 diarrhoea, 1 oesophageal varices haemorrhage, 1 cholecystitis, 2 pneumonia, 1 dehydration, 1 back pain, 1 intervertebral disc protrusion, 1 bipolar disorder, 1 depression, 1 suicidal ideation, 1 dyspnoea, 2 nausea, 3 vomiting, 2 neutropenia, 1 thrombocytopenia, 1 cellulitis, 1 mental status changes, 1 pancytopenia, 1 breast cancer, 1 malaise, 2 rash, 2 sepsis, 1 suicide attempt, 1 renal failure acute, 1 rash maculo‐papular, 1 accidental overdose, 1 muscle spasm, 1 tibia fracture, 1 contusion, 1 pulmonary embolism, 2 abortion spontaneous, 1 hypokalaemia, 1 subcutaneous abscess, 1 acute myocardial infarction, 1 pancreatitis, 1 umbilical hernia, 1 diverticulitis, 1 cerebral ischaemia, 1 drug dependence, 1 personality disorder, 1 epidermolysis, 1 ascites, 1 duodenal ulcer haemorrhage, 1 large intestine perforation, 1 hepatic cirrhosis, 2 hepatic failure, 1 hypersensitivity, 1 infective chondritis, 1 vulval abscess, 1 fibula fracture, 1 jaw fracture, 1 ligament sprain, 1 hypocalcaemia, 1 hyponatraemia, 1 hepatocellular carcinoma, 1 papillary thyroid cancer | 47 out of 525 | 1 anaemia, 2 depression, 1 suicidal ideation, 1 bile duct stone, 1 subcutaneous abscess, 1 optic ischaemic neuropathy, 1 laceration, 1 mental status change | 8 out of 132 | |
| Faldaprevir | 3 anaemia, 1 atrial fibrillation, 1 myocardial infarction, 1 asthenia, 1 chest pain, 1 pyrexia, 1 bronchopneumonia, 1 pneumonia, 1 sciatica, 2 vomiting, 1 thrombocytopenia, 1 pancytopenia, 1 headache, 2 rash, 1 drug eruption, 1 dizziness, 1 haemorrhoids, 1 psychotic disorder, 1 urinary tract infection, 1 diabetes mellitus, 1 parapsoriasis, 1 pancreatitis, 1 histiocytosis haematophagic, 1 cerebrovascular accident, 1 muscular weakness, 1 epistaxis, 1 leukopenia, 1 sarcoidosis, 1 hypotension, 1 idiopathic thrombocytopenic purpura, 1 optic ischaemic neuropathy, 1 hypersensitivity, 1 hypoparathyroidism, 1 retinopathy, 1 subdural hematoma, 1 cervix carcinoma, 1 cubital tunnel syndrome, 1 dyspnoea exertional | 34 out of 520 | 1 anaemia, 1 cholecystitis, 1 gun shot wound, 1 rash maculo‐papular, 1 diverticulitis, 1 inguinal hernia, 1 hepatic lesion, 1 polymyositis, 1 blister | 8 out of 132 | |
| Faldaprevir | 5 anaemia, 1 atrial fibrillation, 1 abdominal pain, 5 diarrhoea, 1 pancreatitis acute, 1 asthenia, 1 chest pain, 8 pyrexia, 2 appendicitis, 1 gastroenteritis viral, 2 pneumonia, 1 decreased appetite, 1 dehydration, 1 back pain, 1 hepatic neoplasm malignant, 2 cholelithiasis, 1 biliary colic, 2 hyperbilirubinaemia, 3 nausea, 2 vomiting, 1 thrombocytopenia, 1 cellulitis, 1 bradycardia, 2 presyncope, 2 malaise, 2 headache, 2 sepsis, 1 rash erythematous, 1 rash generalised, 1 fall, 1 multiple injuries, 1 haematochezia, 1 peritonitis bacterial, 1 congestive cardiac failure, 1 gastroenteritis, 1 hypertensive crisis, 1 hypokalaemia, 1 fatigue, 1 pancreatitis, 1 coma, 1 renal colic, 1 leukopenia, 1 cardio‐respiratory arrest, 1 anxiety, 1 psychiatric decompensation, 2 hypotension, 1 viral infection, 2 ascites, 1 hepatic failure, 1 hypoglycaemia, 1 haemolytic anaemia, 1 keratosis follicular, 1 oral lichen planus, 1 peritoneal haemorrhage, 1 salivary gland calculus, 1 hepatorenal failure, 2 jaundice, 1 streptococcal infection, 1 blood lactate dehydrogenase increased, 1 international normalised ratio abnormal, 1 metabolic acidosis, 1 fasciitis, 1 joint instability, 1 musculoskeletal discomfort, 1 haemothorax, 1 venous thrombosis | 54 out of 599 | 1 depression, 1 pleural effusion | 1 out of 78 | |
| Faldaprevir | 1 abdominal pain upper | 1 out of 35 | 1 abdominal pain | 1 out of 8 | |
| Faldaprevir | 1 asthenia, 1 cataract , 1 hypoalbuminaemia, 1 metabolic disorder, 1 ascites | 4 out of 88 | None reported | 0 out of 8 | |
| Faldeprevir | 4 anaemia, 1 angina pectoris, 1 myocardial infarction, 1 diarrhoea, 1 asthenia, 1 chest pain, 1 oedema peripheral, 4 pyrexia, 1 cholecystitis, 1 pneumonia, 2 dehydration, 1 intervertebral disc protrusion, 2 syncope, 1 depression, 1 nausea, 2 vomiting, 1 thrombocytopenia, 1 upper gastrointestinal haemorrhage, 1 influenza, 1 lower respiratory tract infection, 2 photosensitivity reaction, 1 upper respiratory tract infection, 2 headache, 1 rash, 1 road traffic accident, 2 suicide attempt, 3 drug eruption, 2 rash maculo‐papular, 1 rash erythematous, 2 febrile neutropenia, 1 oral herpes, 1 pulmonary embolism, 1 pyelonephritis, 1 cataract, 1 anaemia haemolytic autoimmune, 1 lymphopenia, 1 microvascular angina, 1 prinzmetal angina, 1 anal fistula, 1 haemorrhoids, 1 mouth ulceration, 1 rectal haemorrhage, 1 chest discomfort, 1 fatigue, 1 mucosal inflammation, 1 gallbladder polyp, 1 cryoglobulinaemia, 1 anal abscess, 1 ear infection, 2 H1N1 influenza, 1 infected skin ulcer, 1 lymphangitis, 1 perirectal abscess, 1 pharyngitis, 1 subcutaneous abscess, 1 superinfection bacterial, 1 urinary tract infection, 1 diabetes mellitus, 1 ischaemic stroke, 1 acute psychosis, 1 depressed mood, 1 calculus ureteric, 1 endometrial hyperplasia, 1 dermatitis atopic, 1 eczema, 1 erythema multiforme, 1 lichen planus, 1 palmar‐plantar erythrodysaesthesia syndrome, 1 parapsoriasis, 1 pruritus allergic, 1 rash pruritic, 1 appendicectomy | 61 out of 641 | 1 headache, 1 photophobia, 1 cyst, 1 benign salivary gland neoplasm, 1 migraine | 2 out of 71 | |
| Filibuvir | 1 blood creatinine increased, 1 chronic obstructive pulmonary disease, 1 pulmonary embolism | 3 out of 27 | 1 thyroiditis, 1 gait disturbance | 2 out of 8 | |
| Filibuvir | 1 anaemia, 1 appendicitis, 1 rectal ulcer haemorrhage, 1 craniocerebral injury, 1 vertigo, 1 vestibular disorder, 1 haematochezia, 1 peritonitis bacterial, 1 lymph node tuberculosis, 1 scapula fracture, 1 blood urea nitrogen/creatinine increased, 1 gastric cancer, 1 rectal cancer, 1 abortion spontaneous, 1 cardiac necrosis, 1 pyoderma gangrenosum, 1 depression, 1 breast cancer, 1 chronic obstructive pulmonary disease, 1 lung neoplasm malignant, 1 fall, 1 loss of consciousness, 1 bacterial abscess CNS, 1 actinomyces test positive, 1 pulmonary calcification | 20 out of 192 | 1 neutropenia, 1 sepsis, 1 pulmonary embolism, 1 cerebral haemorrhage, 1 ecchymosis, 1 Appendicitis perforated | 6 out of 96 | |
| GS‐9451 | 1 death, 1 heroin overdose | 1 out of 33 | None reported | 0 out of 8 | |
| GSK2336805 | 1 pneumonia, 1 upper lobe cavitary lesion | 1 out of 11 | None reported | 0 out of 4 | |
| IDX‐184 | 1 pancreatitis, 1 acute cholecystitis | 2 out of 65 | 1 agitation | 1 out of 16 | |
| Mericitabine/danoprevir | 1 multiple drug overdose, 1 ankle fracture | 2 out of 73 | None reported | 0 out of 14 | |
| Mericitabine | 1 nephrolithiasis, 1 porphyria non‐acute | 2 out of 102 | 1 arthritis infective | 1 out of 49 | |
| Mericitabine | 6 SAEs but not specified | 5 out of 81 | 4 SAEs but not specified | 3 out of 85 | |
| Narlaprevir | 1 pyrexia, 1 elevated CRP | 1 out of 32 | None reported | 0 out of 8 | |
| Odalasvir (ACH‐3102) and sovaprevir | 1 non‐cardiac chest pain | 1 out of 20 | None reported | 0 out of 10 | |
| Paritaprevir (ABT‐450)/r–ombitasvir | 1 pneumonia, 1 nausea, 1 vomiting, 1 bradycardia, 1 chronic obstructive pulmonary disease, 1 renal failure acute, | 9 out of 393 | 1 atrial fibrillation | 1 out of 97 | |
| Paritaprevir/ABT‐072/dasabuvir | 1 haemorrhoids, 1 malignant melanoma | 2 out of 63 | None reported | 0 out of 11 | |
| Paritaprevir/ombitasvir | 1 anaemia, 1 abdominal pain, 1 diarrhoea, 1 cholecystitis, 1 appendicitis, 1 overdose, 1 sinus tachycardia, 1 ventricular extrasystoles, 1 nausea, 1 vomiting, 1 chills, 1 non‐cardiac chest pain, 1 lobar pneumonia, 1 postoperative wound infection, 1 lumbar vertebral fracture, 1 non‐small cell lung cancer, 1 encephalopathy, 1 acute respiratory failure, 1 hypoxia, 1 mediastinal mass, 1 aortic stenosis, 1 biliary colic, 1 subcutaneous abscess | 12 out of 630 | None reported | 0 out of 158 | |
| R1626 | 6 SAEs but not specified | 6 out of 84 | 1 SAE but not specified | 1 out of 20 | |
| Simeprevir | 1 abdominal pain, 1 pyrexia, 1 appendicitis, 2 pneumonia, 1 depression, 1 dyspnoea, 1 cholelithiasis, 1 anaemia haemolytic autoimmune, 1 pancytopenia, 1 angina pectoris, 1 bradycardia, 1 myocardial ischaemia, 1 hepatitis, 1 endocarditis, 1 lower respiratory tract infection, 1 septic shock, 1 breast cancer, 1 Guillain‐Barre syndrome, 1 presyncope, 1 confusional state, 1 vaginal haemorrhage, 1 chronic obstructive pulmonary disease, 1 respiratory acidosis, 1 photosensitivity reaction | 14 out of 260 | 1 atrial fibrillation, 1 depression, 1 bronchitis, 1 hypercalcaemia, 1 head injury, 1 bacterial prostatitis, 1 pericarditis, 1 infection, 1 inguinal hernia, 1 neuropathy peripheral, 1 arthritis infective, 1 headache | 11 out of 133 | |
| Simeprevir | 1 cholecystitis, 1 intervertebral disc protrusion, 1 depression, 1 nausea, 1 breast cancer, 1 hyperthyroidism, 1 ocular vasculitis, 1 abdominal pain upper, 1 colitis, 1 small intestinal obstruction, 1 malaise, 1 incision site cellulitis, 1 necrotising fasciitis, 1 perihepatic abscess, 1 pneumonia pneumococcal, 1 upper respiratory tract infection, 1 post‐procedural bile leak, 1 malnutrition, 1 type 1 diabetes mellitus, 1 spinal disorder, 1 parathyroid tumour benign, 1 headache, 1 haemoptysis, 1 cutaneous vasculitis, 1 hypertension | 20 out of 309 | 1 myocardial infarction, 1 myopericarditis, 1 asthenia, 1 appendicitis, 1 vomiting, 1 chronic obstructive pulmonary disease, 1 headache, 1 subcutaneous abscess, 1 vulval abscess, 1 myositis, 1 ovarian neoplasm | 10 out of 77 | |
| Simeprevir | 1 subarachnoid haemorrhage, 1 malaise, 1 cerebral infarction, 1 vulvar erosion, 1 rash, 1 incorrect dose administered | 5 out of 79 | None reported | 0 out of 13 | |
| Simeprevir | 1 depression, 1 non‐cardiac chest pain, 1 angina unstable, 1 nephrolithiasis, 1 ureteric stenosis, 1 colitis ischaemic, 1 incision site infection, 1 craniocerebral injury, 1 foot fracture, 1 meniscus lesion, 1 multiple injuries, 1 rib fracture, 1 tibia fracture, 1 traumatic lung injury, 1 wound, 1 cholesterosis, 1 type 2 diabetes mellitus, 1 shock haemorrhagic | 10 out of 305 | 1 anaemia, 1 decreased appetite, 1 cholelithiasis, 1 contusion, 1 supraventricular tachycardia, 1 ligament sprain, 1 pain, 1 atypical pneumonia, 1 chronic hepatitis C, 1 pulmonary tuberculosis, 1 undifferentiated connective tissue disease, 1 brain neoplasm | 9 out of 152 | |
| Simeprevir | 1 sinus arrest, 1 erysipelas, 1 type 1 diabetes mellitus, 1 psychotic disorder, 1 drug abuse, 1 bronchitis, 1 exostosis, 1 toe deformity, 1 hyperthyroidism, 1 Bowen's disease, 1 neutropenia, 1 thrombocytopenia, 1 breast cancer, 1 sepsis, 1 cupulolithiasis, 1 pneumonia escherichia, 1 panic reaction | 13 out of 88 | 1 pneumonia, 1 sinusitis, 1 panic attack, 1 social stay hospitalisation, 1 pneumonia escherichia | 3 out of 28 | |
| Simeprevir | 2 anaemia, 1 back pain, 1 syncope, 1 hyperthyroidism, 1 death, 1 muscle spasms, 1 colon cancer, 1 anal abscess, 1 urinary tract infection, 1 mixed deafness, 1 hyphaema, 1 visual impairment, 1 enterocutaneous fistula, 1 autoimmune hepatitis, 1 lymphadenitis bacteria, 1 fluid overload, 1 epilepsy, 1 memory impairment, 1 aggression | 16 out of 257 | 1 anaemia, 1 pancreatitis acute, 1 dehydration, 1 vomiting, 1 pancytopenia, 1 loss of consciousness, 1 angina unstable, 1 meniscus lesion, 1 pulmonary embolism, 1 cholecystitis acute, 1 drug abuse, 1 retinal ischaemia, 1 respiratory tract infection viral, 1 viral infection, 1 neuropathy peripheral, 1 thoracic outlet syndrome | 10 out of 134 | |
| Simeprevir | None reported | 0 out of 58 | 1 liver decompensation | 1 out of 24 | |
| Simeprevir | 1 anaemia, 1 abdominal pain, 1 diarrhoea, 1 oedema peripheral, 2 cholecystitis, 1 pneumonia, 1 overdose, 2 | 31 out of 396 | 1 sciatica, 1 nausea, 1 vomiting, 1 lower respiratory tract infection, 1 haemorrhoids, 1 weight decreased, 1 histiocytosis haematophagic, 1 tuberculosis | 4 out of 66 | |
| Sofosbuvir | 1 drug withdrawal syndrome, 1 non‐cardiac chest pain, 1 oedema peripheral, 1 pyrexia, 1 hypersensitivity, 1 abdominal abscess, 1 cellulitis, 2 overdose, 1 injury, 1 road traffic accident, 1 spinal compression fracture, 1 hypoglycaemia, 1 hepatic neoplasm malignant, 1 abnormal behaviour, 1 eczema | 11 out of 207 | 1 pancreatitis, 1 bile duct stone, 1 bronchitis | 2 out of 71 | |
| Sofosbuvir | 1 retinal vein occlusion, 1 depression, 1 suicidal ideation, 1 lymphangitis, 1 acute myocardial infarction | 4 out of 95 | 1 chest pain, 1 electrocardiogram ST segment elevation | 1 out of 26 | |
| Sofosbuvir | 1 anaemia, 1 chest pain, 1 cellulitis, 1 chronic obstructive pulmonary disease, 1 urinary tract infection, 1 allergy to anthropod sting, 1 osteomyelitis chronic , 1 toxicity to various agents | 7 out of 256 | 1 pneumothorax, 1 breast cancer, 1 infection, 1 atrioventricular shock, 1 clavicle fracture, 1 rib fracture | 3 out of 243 | |
| Sofosbuvir | 1 anaemia, 1 depression, 1 peripheral ischaemia, 1 pancreatitis acute | 4 out of 49 | 1 abdominal pain | 1 out of 14 | |
| Sofosbuvir/velpatasvir | 1 bronchitis, 1 cellulitis, 1 influenza, 1 chronic obstructive pulmonary disease, 1 death, 1 gastroenteritis, 1 acute myocardial infarct, 1 ligament sprain, 1 foot abscess, 1 foot necrosis, 1 recurring appendicitis, 1 epileptic seizure, 1 rotator cuff syndrome, 1 lung cancer, 1 mania, 1 palpitations, 1 small bowel obstruction, 1 upper limb fracture, 1 vestibular neuronitis | 15 out of 624 | None reported | 0 out of 116 | |
| Telaprevir | 1 cholelithiasis | 1 out of 16 | None reported | 0 out of 8 | |
| Telaprevir | 5 anaemia, 2 abdominal pain, 1 asthenia, 1 pyrexia, 1 back pain, 3 syncope, 3 depression, 2 dyspnoea, 1 nausea, 1 chills, 1 pancytopenia, 5 rash, 1 lymphadenopathy, 1 hydrocele, 1 retinal haemorrhage, 1 catheter‐related complication, 1 bacterial sepsis, 1 pneumonia, 1 herpes viral, 1 sepsis, 1 road traffic accident, 1 tendon rupture, 1 lung neoplasm malignant, 1 speech disorder, 1 disorientation, 1 emotional distress, 1 suicide attempt, 1 renal failure, 1 acute testicular swelling, 3 pruritis, 2 drug eruption, 2 rash maculo‐papular, 1 rash erythematous, 1 rash generalised, 1 toxic skin eruption, 1 urticaria, 1 splenectomy | 36 out of 241 | 2 anaemia, 1 angina pectoris, 1 syncope, 1 hyperthyroidism, 1 gastroenteritis, 1 haemorrhagic anaemia, 1 alcoholic pancreatitis, 1 paranoia, 1 uterine polyp | 8 out of 82 | |
| Telaprevir | 18 anaemia, 3 pneumonia, 3 syncope, 2 cellulitis, 5 rash, 3 psychiatric disorder, 2 musculoskeletal disorder, 2 cardiac disorder, 2 eye disorder, 3 hepatobiliary disorders, 2 vascular disorder | 64 out of 727 | 4 anaemia, 1 cellulitis, 3 psychiatric disorder, 3 musculoskeletal disorder, 2 cardiac disorder, 4 renal and urinary disorder, 1 eye disorder, 1 vascular disorder | 24 out of 361 | |
| Telaprevir | 2 anaemia, 1 gastroenteritis viral, 1 dehydration, 2 depression, 1 non‐cardiac chest pain, 1 chronic obstructive pulmonary disease, 1 rash, 1 rash generalised, 1 furuncle, 1 colitis ischaemic, 1 acute myocardial infarction, 1 adrenal disorder, 2 scotoma, 1 retinal exudates, 1 retinal infarction, 1 bronchitis bacterial, 1 incisional hernia, 1 lumbar radiculopathy, 1 exfoliative rash | 18 out of 175 | 1 lobar pneumonia, 1 pancytopenia, 1 anxiety, 1 lymphadenitis bacteria, 1 deafness neurosensory | 4 out of 75 | |
| Telaprevir | 6 anaemia, 1 pancreatitis acute, 1 gastroenteritis viral, 1 pneumonia, 1 dehydration, 1 back pain, 1 suicidal ideation, 2 cholelithiasis, 1 postoperative wound infection, 1 upper gastrointestinal haemorrhage, 1 confusional state, 2 small intestinal obstruction, 1 necrotising fasciitis, 1 pneumonia pneumococcal, 1 post‐procedural bile leak, 1 rash, 1 renal failure acute, 1 retinal detachment, 9 gastroenteritis, 1 cholecystitis acute, 1 sinusitis, 1 hypokalaemia, 1 eczema, 2 pancreatitis, 1 dermatitis, 1 diverticulitis, 1 alcohol abuse, 1 hypotension, 1 haemorrhagic anaemia, 1 idiopathic thrombocytopenic purpura, 1 cardiomyopathy, 1 diverticular perforation, 1 gastritis erosive, 1 abscess intestinal, 1 cholecystitis infective, 1 infected insect bite, 1 sepsis syndrome, 1 hypovolaemia, 1 B‐cell unclassifiable lymphoma low grade, 1 migraine with aura, 1 ruptured cerebral aneurysm, 1 neurogenic bladder, 1 lichenoid keratosis, 1 rash macular | 28 out of 339 | 1 anaemia, 1 pneumonia, 2 dehydration, 1 syncope, 1 depression, 1 non‐small cell lung cancer, 1 headache, 2 rash, 1 renal failure acute, 2 gastroenteritis, 1 renal tubular acidosis, 1 decubitus ulcer, 1 hematoma | 9 out of 114 | |
| Telaprevir | 1 myocardial infarction, 1 staphylococcal infection, 1 pyelonephritis acute, 1 haemolytic anaemia, 1 groin infection, 1 cellulitis staphylococcal, 1 staphylococcal abscess, 1 hypokalaemia, 1 hyponatraemia, 1 epididymitis, 1 non‐ cardiac chest pain | 7 out of 38 | 1 anaemia, 1 appendicitis, 1 peritonitis | 2 out of 22 | |
| Telaprevir | 13 anaemia, 1 febrile neutropenia, 2 pancytopenia, 1 thrombocytopenia , 3 acute myocardial infarction, 2 atrial fibrillation, 1 cardiac valve disease, 1 myocardial infarction, 1 supraventricular tachycardia, 1 sudden hearing loss, 1 Basedow's disease, 1 retinal detachment, 1 abdominal pain, 1 anal fissure, 1 caecitis, 1 gastrointestinal haemorrhage, 1 pancreatitis, 2 pancreatitis acute, 1 general physical health deterioration, 1 pyrexia, 1 appendicitis, 2 bronchitis, 1 erysipelas, 1 folliculitis, 1 Helicobacter gastritis, 1 pneumonia, 1 post‐procedural infection, 1 rectal abscess, 2 sepsis, 1 sinusitis, 1 tooth abscess, 2 urinary tract infection, 1 injection site reaction, 1 animal scratch, 1 ankle fracture, 1 femoral neck fracture, 1 multiple drug overdose, 1 blood corticotrophin decreased, 1 weight decreased, 1 anorexia, 1 diabetes mellitus, 1 bronchial carcinoma, 2 gastric cancer, 2 hepatic neoplasm malignant, 1 histiocytosis haematophagic, 1 lung neoplasm malignant, 1 lethargy, 1 subarachnoid haemorrhage, 2 syncope, 1 delirium, 1 depression, 1 insomnia, 1 substance abuse, 1 renal cyst, 1 renal failure, 1 urinary bladder polyp, 1 prostatitis, 1 pulmonary embolism, 1 dermatitis, 1 eczema , 1 erythema multiforme, 1 pruritus 1 pustular psoriasis, 1 rash, 2 toxic skin eruption, 1 orthostatic hypotension, 1 peripheral artery aneurysm | 65 out of 530 | 1 anaemia, 1 atrial fibrillation, 1 abdominal pain, 1 pneumonia, 1 colitis, 1 pyelonephritis, 1 cerebral thrombosis, 1 coma | 7 out of 132 | |
| Vaniprevir | 1 appendicitis, 1 lobar pneumonia, 1 septic shock, 1 confusional state, 1 gastroenteritis, 1 cholecystitis acute, 1 empyema, 1 haemoglobin decreased, 1 myopathy | 8 out of 75 | 1 colon cancer | 1 out of 19 | |
| Vaniprevir | 1 anaemia, 1 pneumonia, 1 syncope, 1 upper gastrointestinal haemorrhage, 1 cellulitis, 1 confusional state, 1 dizziness, 1 nephrolithiasis, 1 malignant melanoma, 3 retinal detachment, 1 joint dislocation, 1 congestive cardiac failure, 2 gastroenteritis, 1 femur fracture, 1 hyperglycaemia, 1 dermatomyositis, 1 retinal vascular thrombosis, 1 general physical health deterioration, 1 anaphylactic reaction, 1 pyelonephritis, 1 pyelonephritis acute, 1 carbon monoxide poisoning, 1 arthralgia, 1 arthritis infective, 1 completed suicide | 22 out of 229 | 1 hypertensive crisis | 1 out of 56 | |
| SAE: serious adverse events. | |||||
| Trial | Experimental intervention | Type and number of participants with a non‐serious adverse events (experimental group) | Proportion of participants with a non‐serious adverse event (experimental group) | Type and number of participants with a non‐serious adverse events (control group) | Proportion of participants with a non‐serious adverse event (control group) |
| Asunaprevir | 18 diarrhoea, 13 nausea, 10 asthenia, 21 fatigue, 14 influenza‐like illness, 7 irritability, 12 decreased appetite, 4 arthralgia, 9 myalgia, 13 headache, 9 depression, 10 insomnia, 7 cough, 10 dyspnoea, 7 alopecia, 11 dry skin, 10 pruritus, 6 rash | 36 out of 36 | 1 diarrhoea, 2 nausea, 4 asthenia, 5 fatigue, 5 influenza‐like illness, 4 irritability, 3 decreased appetite, 4 arthralgia, 1 myalgia, 6 headache, 1 depression, 1 insomnia, 3 cough, 3 dyspnoea, 3 alopecia, 1 dry skin, 2 pruritus, 3 rash | 11 out of 11 | |
| Asunaprevir | 8 anaemia, 63 asthenia, 62 fatigue, 37 influenza‐like illness, 43 decreased appetite, 66 headache, 41 pruritus | 173 out of 177 | 3 anaemia, 1 asthenia, 62 fatigue, 23 influenza‐like illness, 22 decreased appetite, 26 headache, 16 pruritus | 57 out of 61 | |
| Asunaprevir | 1 nausea, 3 headache, 1 flatulence | Not specified out of 20 | None reported | Not specified out of 4 | |
| Asunaprevir | 1 nausea, 3 headache | Not specified out of 12 | 1 nausea, 1 flatulence | Not specified out of 3 | |
| Balapiravir | 120 anaemia, 41 neutropenia, 115 diarrhoea, 162 nausea, 138 chills, 231 fatigue, 117 pyrexia, 100 arthralgia, 156 myalgia, 82 dizziness, 241 headache, 90 depression, 174 insomnia, 86 cough, 88 alopecia, 60 dry skin, 108 pruritus, 90 rash | Not specified out of 432 | 6 anaemia, 3 neutropenia, 16 diarrhoea, 25 nausea, 30 chills, 43 fatigue, 19 pyrexia, 16 arthralgia, 33 myalgia, 15 dizziness, 42 headache, 17 depression, 24 insomnia, 11 cough, 11 alopecia, 16 dry skin, 15 pruritus, 13 rash | Not specified out of 72 | |
| Beclabuvir | 5 anaemia, 5 neutropenia, 5 diarrhoea, 9 nausea, 3 chills, 12 fatigue, 6 influenza‐like illness, 7 irritability, 3 pyrexia, 7 decreased appetite, 4 arthralgia, 5 myalgia, 12 headache, 6 depression, 9 insomnia, 6 cough, 5 pruritus, 2 rash | Not specified out of 26 | 5 anaemia, 1 neutropenia, 1 diarrhoea, 2 nausea, 5 fatigue, 7 influenza‐like illness, 3 irritability, 1 pyrexia, 2 decreased appetite, 3 headache, 3 depression, 3 insomnia, 3 cough, 4 pruritus, 4 rash | Not specified out of 13 | |
| BILB‐1941 | 25 diarrhoea, 7 nausea, 2 vomiting | 30 out of 77 | 2 diarrhoea | 3 out of 19 | |
| BMS‐791325 | 1 diarrhoea, 1 nausea, 1 vomiting, 1 headache, 1 pruritus | 9 out of 20 | 1 nausea, 1 vomiting, 1 headache | 1 out of 4 | |
| Boceprevir | 145 anaemia, 46 neutropenia, 78 diarrhoea, 140 nausea, 47 vomiting, 68 asthenia, 106 chills, 179 fatigue, 79 influenza‐like illness, 67 irritability, 93 pyrexia, 83 decreased appetite, 73 arthralgia, 81 myalgia, 52 dizziness, 142 dysgeusia, 133 headache, 46 depression, 97 insomnia, 70 cough, 69 dyspnoea, 71 alopecia, 72 dry skin, 62 pruritus, 51 rash | 319 out of 323 | 16 anaemia, 8 neutropenia, 13 diarrhoea, 30 nausea, 6 vomiting, 13 asthenia, 24 chills, 40 fatigue, 20 influenza‐like illness, 10 irritability, 20 pyrexia, 13 decreased appetite, 13 arthralgia, 19 myalgia, 8 dizziness, 9 dysgeusia, 39 headache, 12 depression, 19 insomnia, 14 cough, 14 dyspnoea, 13 alopecia, 7 dry skin, 14 pruritus, 5 rash | 77 out of 80 | |
| Boceprevir | 67 anaemia, 41 neutropenia, 33 diarrhoea, 52 nausea, 16 vomiting, 29 asthenia, 14 chills, 67 fatigue, 35 influenza‐like illness, 29 irritability, 18 pyrexia, 27 decreased appetite, 16 arthralgia, 25 myalgia, 17 dizziness, 52 dysgeusia, 37 headache, 22 depression, 32 insomnia, 26 cough, 26 dyspnoea, 22 alopecia, 20 dry skin, 18 pruritus, 31 rash | 133 out of 134 | 22 anaemia, 12 neutropenia, 5 diarrhoea, 18 nausea, 12 asthenia, 8 chills, 36 fatigue, 18 influenza‐like illness, 16 irritability, 8 pyrexia, 12 decreased appetite, 12 arthralgia, 5 myalgia, 10 dizziness, 10 dysgeusia, 21 headache, 6 depression, 20 insomnia, 14 cough, 17 dyspnoea, 5 alopecia, 11 dry skin, 8 pruritus, 5 rash | 67 out of 67 | |
| Boceprevir | 105 anaemia, 103 leukopenia, 141 neutropenia, 16 thrombocytopenia, 22 diarrhoea, 13 dry mouth, 59 nausea, 12 vomiting, 63 asthenia, 24 chills, 40 fatigue, 51 hyperthermia, 356 influenza‐like illness, 9 injection site erythema, 18 irritability, 217 pyrexia, 14 body temperature increased, 33 weight decreased, 10 decreased appetite, 16 arthralgia, 33 myalgia, 9 dizziness, 69 dysgeusia, 89 headache, 2 sleep disorder, 38 cough, 7 dyspnoea, 33 alopecia, 12 dry skin, 20 pruritus, 17 rash | 153 out of 159 | 31 anaemia, 35 leukopenia, 45 neutropenia, 7 thrombocytopenia, 3 diarrhoea, 5 dry mouth, 15 nausea, 2 vomiting, 23 asthenia, 2 chills, 18 fatigue, 12 hyperthermia, 72 influenza‐like illness, 2 injection site erythema, 11 irritability, 124 pyrexia, 2 body temperature increased, 9 weight decreased, 7 decreased appetite, 4 arthralgia, 8 myalgia, 7 dizziness, 5 dysgeusia, 51 headache, 4 sleep disorder, 14 cough, 7 dyspnoea, 16 alopecia, 3 dry skin, 6 pruritus, 2 rash | 71 out of 78 | |
| Boceprevir | 226 anaemia, 96 neutropenia, 109 diarrhoea, 186 nausea, 81 vomiting, 53 asthenia, 130 chills, 259 fatigue, 79 influenza‐like illness, 91 irritability, 129 pyrexia, 49 decreased appetite, 76 arthralgia, 99 myalgia, 70 dizziness, 111 dysgeusia, 190 headache, 91 depression, 146 insomnia, 76 cough, 66 dyspnoea, 131 alopecia, 60 dry skin, 80 pruritus, 27 rash | 413 out of 416 | 35 anaemia, 12 neutropenia, 23 diarrhoea, 45 nausea, 5 vomiting, 14 asthenia, 35 chills, 57 fatigue, 25 influenza‐like illness, 23 irritability, 35 pyrexia, 12 decreased appetite, 21 arthralgia, 17 myalgia, 16 dizziness, 9 dysgeusia, 45 headache, 22 depression, 40 insomnia, 20 cough, 15 dyspnoea, 27 alopecia, 17 dry skin, 16 pruritus, 6 rash | 102 out of 104 | |
| Boceprevir | 361 anaemia, 184 neutropenia, 180 diarrhoea, 334 nausea, 145 vomiting, 125 asthenia, 255 chills, 405 fatigue, 174 influenza‐like illness, 164 irritability, 240 pyrexia, 186 decreased appetite, 141 arthralgia, 170 myalgia, 146 dizziness, 293 dysgeusia, 335 headache, 151 depression, 239 insomnia, 130 cough, 152 dyspnoea, 179 alopecia, 153 dry skin, 181 pruritus, 181 rash | 728 out of 734 | 107 anaemia, 77 neutropenia, 79 diarrhoea, 153 nausea, 57 vomiting, 70 asthenia, 102 chills, 217 fatigue, 93 influenza‐like illness, 86 irritability, 120 pyrexia, 90 decreased appetite, 66 arthralgia, 94 myalgia, 59 dizziness, 64 dysgeusia, 153 headache, 78 depression, 118 insomnia, 76 cough, 59 dyspnoea, 99 alopecia, 66 dry skin, 98 pruritus, 83 rash | 353 out of 363 | |
| Boceprevir | 26 anaemia, 12 neutropenia, 21 diarrhoea, 26 nausea, 18 vomiting, 22 asthenia, 5 chills, 25 fatigue, 16 influenza‐like illness, 10 irritability, 24 pyrexia, 22 decreased appetite, 7 arthralgia, 9 myalgia, 8 dizziness, 18 dysgeusia, 18 headache, 11 depression, 15 insomnia, 9 cough, 5 dyspnoea, 12 alopecia, 8 dry skin, 13 pruritus, 5 rash | 62 out of 64 | 8 anaemia, 2 neutropenia, 6 diarrhoea, 11 nausea, 5 vomiting, 9 asthenia, 5 chills, 12 fatigue, 13 influenza‐like illness, 5 irritability, 7 pyrexia, 6 decreased appetite, 2 arthralgia, 6 myalgia, 2 dizziness, 5 dysgeusia, 6 headache, 4 depression, 9 insomnia, 6 cough, 2 dyspnoea, 6 alopecia, 3 dry skin, 3 pruritus | 33 out of 34 | |
| Daclatasvir | 7 anaemia, 9 neutropenia, 10 diarrhoea, 22 nausea, 4 vomiting, 13 asthenia, 4 chills, 35 fatigue, 19 influenza‐like illness, 17 irritability, 7 pyrexia, 12 decreased appetite, 11 arthralgia, 14 myalgia, 6 dizziness, 5 dysgeusia, 30 headache, 11 depression, 19 insomnia, 8 cough, 12 dyspnoea, 12 alopecia, 13 dry skin, 27 pruritus, 25 rash | 98 out of 100 | 5 anaemia, 8 neutropenia, 3 diarrhoea, 8 nausea, 4 vomiting, 7 asthenia, 19 fatigue, 7 influenza‐like illness, 6 irritability, 2 pyrexia, 8 decreased appetite, 9 arthralgia, 11 myalgia, 6 dizziness, 3 dysgeusia, 9 headache, 9 depression, 17 insomnia, 8 cough, 6 dyspnoea, 5 alopecia, 6 dry skin, 14 pruritus, 12 rash | 48 out of 51 | |
| Daclatasvir | 53 anaemia, 43 neutropenia, 73 diarrhoea, 109 nausea, 34 vomiting, 32 asthenia, 49 chills, 174 fatigue, 94 influenza‐like illness, 72 irritability, 48 pyrexia, 67 decreased appetite, 55 arthralgia, 88 myalgia, 46 dizziness, 25 dysgeusia, 136 headache, 45 depression, 102 insomnia, 54 cough, 58 dyspnoea, 80 alopecia, 88 dry skin, 119 pruritus, 94 rash | 311 out of 317 | 9 anaemia, 9 neutropenia, 14 diarrhoea, 20 nausea, 11 vomiting, 7 asthenia, 16 chills, 46 fatigue, 16 influenza‐like illness, 22 irritability, 15 pyrexia, 17 decreased appetite, 19 arthralgia, 24 myalgia, 9 dizziness, 4 dysgeusia, 36 headache, 10 depression, 30 insomnia, 18 cough, 11 dyspnoea, 13 alopecia, 15 dry skin, 26 pruritus, 25 rash | 76 out of 78 | |
| Daclatasvir | 11 anaemia, 7 neutropenia, 2 diarrhoea, 4 nausea, 6 fatigue, 1 irritability, 11 pyrexia, 7 decreased appetite, 4 arthralgia, 1 myalgia, 1 dizziness, 4 dysgeusia, 3 headache, 7 insomnia, 4 cough, 2 dyspnoea, 8 alopecia, 1 dry skin, 6 pruritus, 7 rash | 34 out of 34 | 5 anaemia, 4 neutropenia, 3 diarrhoea, 2 nausea, 3 vomiting, 4 chills, 4 fatigue, 2 influenza‐like illness, 5 pyrexia, 5 decreased appetite, 2 arthralgia, 2 myalgia, 1 dizziness, 1 dysgeusia, 4 headache, 2 insomnia, 1 cough, 6 alopecia, 1 dry skin, 3 pruritus, 3 rash | 8 out of 8 | |
| Daclatasvir | 14 anaemia, 9 neutropenia, 5 diarrhoea, 13 nausea, 7 vomiting, 9 asthenia, 4 chills, 19 fatigue, 11 influenza‐like illness, 12 irritability, 7 pyrexia, 9 decreased appetite, 2 arthralgia, 8 myalgia, 5 dizziness, 2 dysgeusia, 19 headache, 7 depression, 9 insomnia, 9 cough, 6 dyspnoea, 8 alopecia, 2 dry skin, 12 pruritus, 10 rash | 36 out of 36 | 5 anaemia, 5 neutropenia, 3 diarrhoea, 6 nausea, 1 asthenia, 2 chills, 9 fatigue, 4 influenza‐like illness, 2 irritability, 3 pyrexia, 3 decreased appetite, 3 myalgia, 1 dizziness, 1 dysgeusia, 3 headache, 3 depression, 6 insomnia, 3 cough, 2 dyspnoea, 2 alopecia, 1 dry skin, 3 pruritus, 3 rash | 12 out of 12 | |
| Daclatasvir | 1 diarrhoea, 1 nausea, 4 headache | 7 out of 16 | None reported | 0 out of 2 | |
| Daclatasvir | 2 diarrhoea, 3 fatigue, 1 arthralgia, 1 dizziness, 5 headache, 2 insomnia, 1 dry skin | 16 out of 24 | 1 nausea, 1 vomiting, 2 headache | 4 out of 6 | |
| Danoprevir | 115 diarrhoea, 106 nausea, 77 asthenia, 89 chills, 158 fatigue, 125 pyrexia, 88 decreased appetite, 72 arthralgia, 93 myalgia,158 headache, 102 insomnia, 62 cough, 54 alopecia, 83 pruritus, 78 rash | 364 out of 373 | 5 diarrhoea, 13 nausea, 9 asthenia, 8 chills, 17 fatigue, 15 pyrexia, 6 decreased appetite, 9 arthralgia, 13 myalgia, 24 headache, 16 insomnia, 12 cough, 4 alopecia, 14 pruritus, 6 rash | 42 out of 44 | |
| Danoprevir | 2 diarrhoea, 3 myalgia, 5 headache | 21 out of 40 | 1 diarrhoea, 2 headache | 3 out of 10 | |
| Danoprevir | 6 neutropenia, 5 diarrhoea, 4 nausea, 3 asthenia, 5 chills, 8 fatigue, 4 influenza‐like illness, 2 pyrexia, 2 arthralgia, 17 myalgia, 6 dizziness, 23 headache, 2 depression, 6 insomnia, 3 pruritus | 42 out of 47 | 2 neutropenia, 2 diarrhoea, 1 nausea, 1 chills, 3 fatigue, 1 influenza‐like illness, 1 arthralgia, 5 myalgia, 1 dizziness, 4 headache, 1 depression, 2 insomnia | 12 out of 12 | |
| Danoprevir | 4 diarrhoea, 5 nausea, 5 fatigue, 3 influenza‐like illness, 5 irritability, 5 arthralgia, 5 myalgia, 11 headache, 4 insomnia, 6 rash | 24 out of 25 | 1 diarrhoea, 3 nausea, 1 fatigue, 2 myalgia, 4 headache, 2 insomnia | 5 out of 5 | |
| Danoprevir | 53 anaemia, 70 neutropenia, 56 diarrhoea, 85 nausea, 29 vomiting, 57 chills, 109 fatigue, 38 irritability, 51 pyrexia, 34 decreased appetite, 29 arthralgia, 60 myalgia, 92 headache, 42 depression, 69 insomnia, 31 alopecia, 46 pruritus, 42 rash | Not specified out of 194 | 13 anaemia, 11 neutropenia, 7 diarrhoea, 10 nausea, 4 vomiting, 13 chills, 14 fatigue, 7 irritability, 5 pyrexia, 4 decreased appetite, 9 arthralgia, 11 myalgia, 18 headache, 4 depression, 9 insomnia, 5 alopecia, 6 pruritus, 8 rash | Not specified out of 31 | |
| Deleobuvir | 1 anaemia, 19 diarrhoea, 19 nausea, 11 vomiting, 16 asthenia, 3 chills, 12 fatigue, 14 influenza‐like illness, 7 irritability, 6 pyrexia, 14 decreased appetite, 4 arthralgia, 4 myalgia, 6 dizziness, 4 dysgeusia, 20 headache, 15 insomnia, 6 cough, 3 dyspnoea, 1 alopecia, 6 dry skin, 5 pruritus, 8 rash | 49 out of 49 | 1 nausea, 1 asthenia, 1 chills, 2 fatigue, 1 influenza‐like illness, 2 irritability, 1 decreased appetite, 2 headache, 1 dry skin, 1 pruritus, 2 rash | 7 out of 8 | |
| Faldaprevir | 114 anaemia, 59 neutropenia, 160 diarrhoea, 249 nausea, 110 vomiting, 29 asthenia, 78 chills, 246 fatigue, 39 influenza‐like illness, 67 irritability, 79 pyrexia, 117 decreased appetite, 72 arthralgia, 100 myalgia, 80 dizziness, 31 dysgeusia, 165 headache, 68 depression, 137 insomnia, 89 cough, 53 dyspnoea, 96 alopecia, 67 dry skin, 164 pruritus, 298 rash | 513 out of 525 | 27 anaemia, 14 neutropenia, 23 diarrhoea, 52 nausea, 11 vomiting, 6 asthenia, 25 chills, 70 fatigue, 15 influenza‐like illness, 27 irritability, 20 pyrexia, 26 decreased appetite, 22 arthralgia, 37 myalgia, 25 dizziness, 3 dysgeusia, 45 headache, 11 depression, 38 insomnia, 21 cough, 20 dyspnoea, 22 alopecia, 15 dry skin, 37 pruritus, 41 rash | 130 out of 132 | |
| Faldaprevir | 89 anaemia, 57 neutropenia, 121 diarrhoea, 168 nausea, 79 vomiting, 96 asthenia, 143 fatigue, 92 influenza‐like illness, 37 irritability, 110 pyrexia, 87 decreased appetite, 39 arthralgia, 41 myalgia, 38 dizziness, 23 dysgeusia, 146 headache, 32 depression, 70 insomnia, 58 cough, 36 dyspnoea, 49 alopecia, 80 dry skin, 160 pruritus, 139 rash | 496 out of 520 | 26 anaemia, 18 neutropenia, 17 diarrhoea, 19 nausea, 6 vomiting, 27 asthenia, 35 fatigue, 21 influenza‐like illness, 9 irritability, 32 pyrexia, 22 decreased appetite, 14 arthralgia, 20 myalgia, 13 dizziness, 5 dysgeusia, 40 headache, 8 depression, 22 insomnia, 20 cough, 16 dyspnoea, 15 alopecia, 17 dry skin, 41 pruritus, 25 rash | 120 out of 132 | |
| Faldaprevir | 98 anaemia, 65 neutropenia, 190 diarrhoea, 318 nausea, 171 vomiting, 108 asthenia, 32 chills, 204 fatigue, 107 influenza‐like illness, 49 irritability, 113 pyrexia, 128 decreased appetite, 60 arthralgia, 72 myalgia, 37 dizziness, 39 dysgeusia, 182 headache, 52 depression, 118 insomnia, 99 cough, 47 dyspnoea, 53 alopecia, 108 dry skin, 225 pruritus, 160 rash | 585 out of 599 | 8 anaemia, 12 neutropenia, 10 diarrhoea, 18 nausea, 5 vomiting, 21 asthenia, 5 chills, 16 fatigue, 15 influenza‐like illness, 11 irritability, 14 pyrexia, 10 decreased appetite, 7 arthralgia, 8 myalgia, 6 dizziness, 4 dysgeusia, 22 headache, 10 depression, 13 insomnia, 16 cough, 7 dyspnoea, 4 alopecia, 12 dry skin, 23 pruritus, 16 rash | 74 out of 78 | |
| Faldaprevir | 2 anaemia, 1 neutropenia, 4 diarrhoea, 7 nausea, 10 asthenia, 2 chills, 2 fatigue, 4 influenza‐like illness, 4 irritability, 2 pyrexia, 1 decreased appetite, 7 myalgia, 1 dizziness, 6 headache, 2 depression, 5 insomnia, 2 cough, 1 alopecia, 5 dry skin, 3 pruritis, 1 rash | 32 out of 26 | 1 diarrhoea, 2 nausea, 2 asthenia, 2 headache, 1 depression, 1 insomnia, 1 cough | 5 out of 8 | |
| Faldaprevir | 1 neutropenia, 3 diarrhoea, 3 nausea, 3 vomiting, 2 influenza‐like illness, 8 pyrexia, 2 decreased appetite, 2 arthralgia, 4 dizziness, 1 dysgeusia, 7 headache, 1 depression, 5 insomnia, 1 cough, 3 alopecia, 1 dry skin, 6 pruritus, 6 rash | 33 out of 35 | 2 nausea, 2 vomiting, 1 influenza‐like illness, 1 pyrexia, 1 decreased appetite, 1 headache, 1 insomnia, 1 dyspnoea, 2 dry skin, 3 pruritus, 1 rash | 6 out of 8 | |
| Faldeprevir | 85 anaemia, 49 neutropenia, 188 diarrhoea, 239 nausea, 105 vomiting, 122 asthenia, 54 chills, 194 fatigue, 217 influenza‐like illness, 82 irritability, 86 pyrexia, 133 decreased appetite, 72 arthralgia, 133 myalgia, 48 dizziness, 25 dysgeusia, 243 headache, 68 depression, 107 insomnia, 100 cough, 73 dyspnoea, 106 alopecia, 122 dry skin, 227 pruritus, 163 rash | 620 out of 641 | 12 anaemia, 8 neutropenia, 13 diarrhoea, 14 nausea, 4 vomiting, 15 asthenia, 8 chills, 24 fatigue, 34 influenza‐like illness, 10 irritability, 11 pyrexia, 11 decreased appetite, 5 arthralgia, 12 myalgia, 5 dizziness, 27 headache, 7 depression, 17 insomnia, 9 cough, 11 dyspnoea, 8 alopecia, 10 dry skin, 12 pruritus, 12 rash | 65 out of 71 | |
| Filibuvir | 13 anaemia,4 neutropenia ,6 diarrhoea, 13 nausea, 3 vomiting, 4 chills, 13 fatigue, 3 influenza‐like illness, 2 irritability, 2 pyrexia, 3 decreased appetite, 2 arthralgia, 4 myalgia, 4 dizziness, 14 headache, 5 depression, 11 insomnia, 5 cough, 2 dyspnoea, 2 alopecia, 3 dry skin, 2 pruritus, 3 rash | 27 out of 27 | 3 anaemia, 3 diarrhoea, 4 nausea, 1 vomiting, 1 chills, 5 fatigue, 2 influenza‐like illness, 2 decreased appetite, 2 arthralgia, 2 headache, 3 depression, 2 insomnia, 2 cough, 2 dyspnoea, 1 alopecia, 2 dry skin, 3 pruritus, 1 rash | 8 out of 8 | |
| Filibuvir | 26 anaemia, 26 neutropenia, 24 diarrhoea, 55 nausea, 20 vomiting, 35 asthenia, 25 chills, 73 fatigue, 29 influenza‐like illness, 33 irritability, 28 pyrexia, 36 decreased appetite, 30 arthralgia, 37 myalgia, 20 dizziness, 40 dysgeusia, 61 headache, 32 depression, 55 insomnia, 33 cough, 18 dyspnoea, 34 alopecia, 33 dry skin, 56 pruritus, 34 rash | 174 out of 192 | anaemia, neutropenia, diarrhoea, nausea, vomiting, asthenia, chills, fatigue, influenza‐like illness, irritability, pyrexia, decreased appetite, arthralgia, myalgia, dizziness, dysgeusia, headache, depression, insomnia, cough, dyspnoea, alopecia, dry skin, pruritus, rash. The authors did not report number of adverse events in the control group | 90 out of 96 | |
| Grazoprevir | 9 diarrhoea, 2 nausea, 1 vomiting, 7 fatigue, 1 dysgeusia, 16 headache, 1 insomnia, 2 pruritis | 34 out of 76 | 1 headache | 2 out of 15 | |
| GSK2336805 | 3 anaemia, 3 neutropenia, 4 nausea, 2 vomiting, 2 chills, 5 fatigue, 2 cough | 11 out of 11 | 1 fatigue | 4 out of 4 | |
| IDX‐184 | 1 diarrhoea, 2 fatigue, 1 dizziness, 4 headache | 8 out of 33 | 1 diarrhoea, 1 fatigue, 1 dizziness, 1 headache | 4 out of 8 | |
| IDX‐184 | 6 neutropenia, 7 diarrhoea, 22 nausea, 5 vomiting, 15 chills, 36 fatigue, 10 irritability, 9 pyrexia, 5 decreased appetite, 19 myalgia, 27 headache, 4 depression, 10 insomnia, 6 pruritus | 59 out of 65 | 4 neutropenia, 2 diarrhoea, 3 nausea, 5 chills, 9 fatigue, 4 irritability, 3 decreased appetite, 5 myalgia, 7 headache, 3 depression, 5 insomnia, 2 pruritus | 12 out of 16 | |
| IDX320 | 1 diarrhoea, 1 myalgia, 4 headache | Not specified out of 30 | None reported | 0 out of 8 | |
| Ledispasvir | 2 nausea, 6 headache, 2 rash | 18 out of 59 | 1 nausea | 4 out of 11 | |
| Mericitabine/danoprevir | 7 diarrhoea, 9 nausea, 36 headache, 9 rash | Not specified out of 73 | 1 diarrhoea, 2 nausea, 8 headache, 1 rash | Not specified out of 14 | |
| Mericitabine | 25 diarrhoea, 16 nausea, 6 chills, 47 fatigue, 14 irritability, 16 pyrexia, 12 arthralgia, 19 myalgia, 43 headache, 27 insomnia, 21 cough, 15 pruritus | Not specified out of 102 | 12 diarrhoea, 14 nausea, 12 chills, 25 fatigue, 10 irritability, 14 pyrexia, 11 arthralgia, 18 myalgia, 28 headache, 11 insomnia, 11 cough, 11 pruritus | Not specified out of 49 | |
| Mericitabine | 18 diarrhoea, 33 nausea, 31 chills, 58 fatigue, 21 irritability, 20 pyrexia, 25 decreased appetite, 18 arthralgia, 24 myalgia, 19 dizziness, 42 headache, 31 insomnia, 17 cough, 14 alopecia, 15 pruritus, 17 rash | Not specified out of 81 | 20 diarrhoea, 34 nausea, 33 chills, 58 fatigue, 25 irritability, 27 pyrexia, 22 decreased appetite, 21 arthralgia, 24 myalgia, 20 dizziness, 38 headache, 28 insomnia, 22 cough, 17 alopecia, 28 pruritus, 28 rash | Not specified out of 85 | |
| Narlaprevir | 10 diarrhoea, 8 nausea, 30 influenza‐like illness, 6 dizziness, 11 headache | 32 out of 32 | 1 nausea, 6 influenza‐like illness, 1 dizziness | 7 out of 8 | |
| Narlaprevir | 87 anaemia, 84 diarrhoea, 131 nausea, 54 vomiting, 44 chills, 123 fatigue, 106 influenza‐like illness, 58 irritability, 58 pyrexia, 61 decreased appetite, 60 arthralgia, 39 myalgia, 58 dizziness, 83 headache, 33 depression, 80 insomnia, 28 pruritus, 31 rash | Not specified out of 93 | 6 anaemia, 17 diarrhoea, 50 nausea, 28 vomiting, 17 chills, 56 fatigue, 44 influenza‐like illness, 28 irritability, 17 pyrexia, 44 decreased appetite, 28 arthralgia, 6 dizziness, 39 headache, 22 depression, 39 insomnia, 33 pruritus, 11 rash | Not specified out of 18 | |
| Odalasvir/sovaprevir | 5 anaemia, 2 diarrhoea, 5 fatigue, 2 influenza‐like illness, 2 irritability, 1 decreased appetite, 2 arthralgia, 3 myalgia, 1 dizziness, 1 dysgeusia, 6 headache, 2 insomnia, 4 cough, 1 dyspnoea, 1 pruritus, 1 rash | 20 out of 20 | 2 diarrhoea, 4 fatigue, 1 myalgia, 1 dizziness, 1 headache, 1 cough, pruritus | 10 out of 10 | |
| Ombitasvir | 6 anaemia, 5 neutropenia, 4 diarrhoea, 9 nausea, 7 vomiting, 6 chills, 18 fatigue, 1 influenza‐like illness, 1 irritability, 3 pyrexia, 5 decreased appetite, 2 arthralgia, 2 myalgia, 2 dizziness, 9 headache, 4 depression, 4 insomnia, 3 cough, 2 dyspnoea, 5 dry skin, 3 pruritus, 6 rash | 26 out of 28 | 1 neutropenia, 1 diarrhoea, 3 nausea, 2 vomiting, 6 fatigue, 2 influenza‐like illness, 1 irritability, 1 decreased appetite, 1 myalgia, 2 headache, 1 depression, 2 insomnia, 1 cough, dyspnoea, 1 dry skin, 2 rash | 9 out of 9 | |
| Paritaprevir/ABT‐072/dasabuvir | 12 anaemia, 14 neutropenia, 16 diarrhoea, 15 nausea, 6 vomiting, 4 asthenia, 11 chills, 29 fatigue, 14 influenza‐like illness, 8 irritability, 12 pyrexia, 4 decreased appetite, 9 arthralgia, 14 myalgia, 9 dizziness, 6 dysgeusia, 38 headache, 15 depression, 14 insomnia, 6 cough, 6 dyspnoea, 5 alopecia, 2 dry skin, 8 pruritus, 12 rash | 63 out of 63 | 1 anaemia, 2 neutropenia, 4 diarrhoea, 4 nausea, 1 vomiting, 1 asthenia, 6 fatigue, 1 influenza‐like illness, 1 irritability, 1 pyrexia, 2 decreased appetite, 1 arthralgia, 3 myalgia, 4 dizziness, 2 dysgeusia, 4 headache, 2 insomnia, 2 dyspnoea, 1 alopecia, 2 pruritus, 2 rash | 10 out of 11 | |
| Paritaprevir/ombitasvir | 24 anaemia, 65 diarrhoea, 112 nausea, 23 vomiting, 59 asthenia, 164 fatigue, 26 irritability, 37 decreased appetite, 23 arthralgia, 21 myalgia, 38 dizziness, 156 headache, 67 insomnia, 34 cough, 38 dyspnoea, 27 dry skin, 80 pruritus, 51 rash | 391 out of 473 | 11 diarrhoea, 22 nausea, 6 vomiting, 6 asthenia, 45 fatigue, 4 irritability, 5 decreased appetite, 9 arthralgia, 8 myalgia, 6 dizziness, 42 headache, 12 insomnia, 8 cough, 4 dyspnoea, 2 dry skin, 7 pruritus, 9 rash | 108 out of 158 | |
| Paritaprevir/ombitasvir | 19 anaemia, 47 diarrhoea, 72 nausea, 22 vomiting, 60 asthenia, 115 fatigue, 22 irritability, 24 decreased appetite, 21 arthralgia, 28 myalgia, 30 dizziness, 13 dysgeusia, 126 headache, 52 insomnia, 43 cough, 50 dyspnoea, 27 dry skin, 53 pruritus, 34 rash | 328 out of 394 | 12 diarrhoea, 17 nausea, 11 asthenia, 22 fatigue, 8 irritability, 2 decreased appetite, 7 arthralgia, 10 myalgia, 5 dizziness, 5 dysgeusia, 34 headache, 7 insomnia, 5 cough, 10 dyspnoea, 3 dry skin, 5 pruritus, 6 rash | 74 out of 97 | |
| PHX1766 | 1 nausea, 2 fatigue, 1 dizziness | Not specified | None reported | Not specified | |
| R1626 | 43 neutropenia, 42 diarrhoea, 49 nausea, 26 vomiting, 39 chills, 45 fatigue, 20 irritability, 29 pyrexia, 21 arthralgia, 23 myalgia, 15 dizziness, 47 headache, 27 insomnia, 15 cough, 11 pruritus, 20 rash | Not specified out of 84 | 5 diarrhoea, 10 nausea, 2 vomiting, 9 chills, 10 fatigue, 1 irritability, 8 pyrexia, 5 arthralgia, 11 myalgia, 3 dizziness, 11 headache, 6 insomnia, 4 cough, 6 pruritus, 2 rash | Not specified out of 20 | |
| Samatasvir | 4 nausea, 1 decreased appetite, 6 headache, 1 insomnia | 20 out of 48 | 1 nausea, 1 decreased appetite, 1 headache, 1 insomnia | 6 out of 12 | |
| Simeprevir | 40 anaemia, 37 neutropenia, 36 diarrhoea, 59 nausea, 18 vomiting, 57 asthenia, 17 chills, 87 fatigue, 78 influenza‐like illness, 63 pyrexia, 35 decreased appetite, 26 arthralgia, 39 myalgia, 14 dizziness, 12 dysgeusia, 87 headache, 22 depression, 49 insomnia, 34 cough, 26 dyspnoea, 26 alopecia, 24 dry skin, 16 pruritus, 33 rash | 245 out of 260 | 24 anaemia, 26 neutropenia, 22 diarrhoea, 26 nausea, 9 vomiting, 25 asthenia, 11 chills, 58 fatigue, 27 influenza‐like illness, 30 pyrexia, 24 decreased appetite, 12 arthralgia, 17 myalgia, 6 dizziness, 7 dysgeusia, 48 headache, 10 depression, 33 insomnia, 21 cough, 5 dyspnoea, 17 alopecia, 18 dry skin, 37 pruritus, 19 rash | 123 out of 133 | |
| Simeprevir | 63 anaemia, 75 neutropenia, 47 diarrhoea, 86 nausea, 22 vomiting, 63 asthenia, 25 chills, 107 fatigue, 98 influenza‐like illness, 11 irritability, 64 pyrexia, 17 decreased appetite, 53 arthralgia, 55 myalgia, 29 dizziness, 16 dysgeusia, 142 headache, 32 depression, 69 insomnia, 52 cough, 33 dyspnoea, 53 alopecia, 63 dry skin, 173 pruritus, 65 rash | 302 out of 309 | 16 anaemia, 16 neutropenia, 12 diarrhoea, 21 nausea, 5 vomiting, 16 asthenia, 8 chills, 37 fatigue, 29 influenza‐like illness, 8 irritability, 13 pyrexia, 6 decreased appetite, 11 arthralgia, 17 myalgia, 6 dizziness, 5 dysgeusia, 40 headache, 14 depression, 23 insomnia, 15 cough, 6 dyspnoea, 16 alopecia, 14 dry skin, 35 pruritus, 18 rash | 75 out of 77 | |
| Simeprevir | 24 anaemia, 13 diarrhoea,13 nausea, 6 vomiting, 4 chills, 2 fatigue, 42 pyrexia, 15 decreased appetite, 27 arthralgia, 15 myalgia, 3 dizziness, 6 dysgeusia, 41 headache, 2 depression, 23 insomnia, 8 cough, 25 alopecia, 5 dry skin, 15 pruritus, 47 rash | 79 out of 79 | 5 anaemia, 5 diarrhoea, 2 vomiting, 7 pyrexia, 3 decreased appetite, 2 arthralgia, 2 myalgia, 8 headache, 2 insomnia, 2 cough, 6 alopecia, 6 rash | 13 out of 13 | |
| Simeprevir | 70 anaemia, 8 neutropenia, 20 diarrhoea, 16 nausea, 6 vomiting, 13 fatigue, 75 pyrexia, 28 decreased appetite, 30 arthralgia, 9 myalgia, 4 dizziness, 20 dysgeusia, 54 headache, 27 insomnia, 11 cough, 44 alopecia, 8 dry skin, 35 pruritus, 57 rash | 123 out of 123 | 36 anaemia, 1 neutropenia, 20 diarrhoea, 16 nausea, 6 vomiting, 7 fatigue, 31 pyrexia, 20 decreased appetite, 14 arthralgia, 11 myalgia, 4 dizziness, 8 dysgeusia, 26 headache, 3 depression, 25 insomnia, 8 cough, 28 alopecia, 9 dry skin, 18 pruritus, 37 rash | 60 out of 60 | |
| Simeprevir | 82 anaemia, 59 neutropenia, 14 diarrhoea, 16 nausea, 15 asthenia, 63 fatigue, 39 influenza‐like illness, 67 pyrexia, 28 decreased appetite, 13 arthralgia, 36 myalgia, 39 headache, 17 insomnia, 16 cough, 47 alopecia, 40 pruritus, 57 rash | 298 out of 305 | 53 anaemia, 32 neutropenia, 7 diarrhoea, 10 nausea, 7 asthenia, 36 fatigue, 19 influenza‐like illness, 46 pyrexia, 16 decreased appetite, 4 arthralgia, 22 myalgia, 28 headache, 18 insomnia, 17 cough, 26 alopecia, 17 pruritus, 27 rash | 149 out of 152 | |
| Simeprevir | 44 anaemia, 54 neutropenia, 35 diarrhoea, 65 nausea, 23 vomiting, 25 asthenia, 33 chills, 111 fatigue, 62 influenza‐like illness, 51 pyrexia, 47 decreased appetite, 34 arthralgia, 39 myalgia, 23 dizziness, 16 dysgeusia, 88 headache, 23 depression, 56 insomnia, 25 cough, 23 dyspnoea, 30 alopecia, 33 dry skin, 68 pruritus, 60 rash | 252 out of 264 | 24 anaemia, 15 neutropenia, 19 diarrhoea, 32 nausea, 9 vomiting, 21 asthenia, 18 chills, 53 fatigue, 26 influenza‐like illness, 28 pyrexia, 19 decreased appetite, 21 arthralgia, 18 myalgia, 9 dizziness, 4 dysgeusia, 51 headache, 16 depression, 31 insomnia, 20 cough, 9 dyspnoea, 16 alopecia, 11 dry skin, 20 pruritus, 30 rash | 124 out of 130 | |
| Simeprevir | 16 anaemia, 26 neutropenia, 20 diarrhoea, 31 nausea, 9 vomiting, 26 asthenia, 6 chills, 35 fatigue, 24 influenza‐like illness, 10 irritability, 21 pyrexia, 7 decreased appetite, 20 arthralgia, 14 myalgia, 4 dizziness, 5 dysgeusia, 42 headache, 14 depression, 12 insomnia, 19 cough, 18 dyspnoea, 16 alopecia, 19 dry skin, 18 pruritus, 9 rash | 82 out of 83 | 4 anaemia, 4 neutropenia, 3 diarrhoea, 4 nausea, 3 vomiting, 7 asthenia, 5 chills, 13 fatigue, 5 influenza‐like illness, 4 irritability, 4 pyrexia, 2 decreased appetite, 3 arthralgia, 8 myalgia, 3 dizziness, 3 dysgeusia, 16 headache, 2 depression, 7 insomnia, 10 cough, 4 dyspnoea, 3 alopecia, 5 dry skin, 7 pruritus, 5 rash | 28 out of 28 | |
| Simeprevir | 46 anaemia, 49 neutropenia, 34 diarrhoea, 63 nausea, 17 vomiting, 59 asthenia, 21 chills, 95 fatigue, 66 influenza‐like illness, 80 pyrexia, 46 decreased appetite, 32 arthralgia, 58 myalgia, 21 dizziness, 101 headache, 29 depression, 51 insomnia, 32 cough, 23 dyspnoea, 43 alopecia, 28 dry skin, 65 pruritus, 46 rash | 243 out of 257 | 33 anaemia, 29 neutropenia, 12 diarrhoea, 24 nausea, 7 vomiting, 38 asthenia, 12 chills, 56 fatigue, 35 influenza‐like illness, 53 pyrexia, 21 decreased appetite, 14 arthralgia, 28 myalgia, 9 dizziness, 49 headache, 19 depression, 21 insomnia, 22 cough, 11 dyspnoea, 27 alopecia, 18 dry skin, 34 pruritus, 15 rash | 131 out of 134 | |
| Simeprevir | 1 anaemia, 1 diarrhoea, 6 nausea, 8 fatigue, 1 irritability, 2 myalgia, 7 headache, 3 insomnia, 6 pruritus, 10 rash | 46 out of 58 | 9 anaemia, 5 neutropenia, 2 diarrhoea, 7 nausea, 4 asthenia, 17 fatigue, 6 influenza‐like illness, 3 irritability, 4 myalgia, 8 headache, 6 insomnia, 4 pruritus, 3 rash | 22 out of 24 | |
| Simeprevir | 76 anaemia, 101 neutropenia, 59 diarrhoea, 95 nausea, 21 vomiting, 84 asthenia, 34 chills, 174 fatigue, 116 influenza‐like illness, 53 irritability, 69 pyrexia, 69 decreased appetite, 50 arthralgia, 64 myalgia, 29 dizziness, 22 dysgeusia, 138 headache, 45 depression, 79 insomnia, 76 cough, 49 dyspnoea, 31 alopecia, 72 dry skin, 135 pruritus, 61 rash | 380 out of 396 | 13 anaemia, 11 neutropenia, 13 diarrhoea, 14 nausea, 5 vomiting, 7 asthenia, 6 chills, 174 fatigue, 13 influenza‐like illness, 7 irritability, 9 pyrexia, 9 decreased appetite, 9 arthralgia, 12 myalgia, 6 dizziness, 3 dysgeusia, 24 headache, 6 depression, 9 insomnia, 8 cough, 4 dyspnoea, 5 alopecia, 10 dry skin, 11 pruritus, 9 rash | 63 out of 66 | |
| Sofosbuvir | 19 diarrhoea, 46 nausea, 12 vomiting, 91 fatigue, 19 irritability, 7 decreased appetite, 16 arthralgia, 19 dizziness, 43 headache, 15 depression, 39 insomnia, 11 cough, 19 dyspnoea, 23 pruritus, 18 rash | 184 out of 207 | 4 diarrhoea, 13 nausea, 5 vomiting, 17 fatigue, 1 irritability, 7 decreased appetite, 1 arthralgia, 5 dizziness, 14 headache, 1 depression, 3 insomnia, 2 cough, 1 dyspnoea, 6 pruritus, 6 rash | 55 out of 71 | |
| Sofosbuvir | 19 anaemia, 23 neutropenia, 18 diarrhoea, 38 nausea, 12 vomiting, 2 asthenia, 37 chills, 64 fatigue, 15 irritability, 22 pyrexia, 11 decreased appetite, 10 arthralgia, 17 myalgia, 11 dizziness, 9 dysgeusia, 37 headache, 12 depression, 24 insomnia, 14 cough, 11 dyspnoea, 10 alopecia, 12 dry skin, 13 pruritus, 29 rash | 117 out of 120 | 7 anaemia, 5 neutropenia, 2 diarrhoea, 9 nausea, 2 vomiting, 1 asthenia, 10 chills, 16 fatigue, 5 irritability, 2 pyrexia, 4 decreased appetite, 5 arthralgia, 6 myalgia, 3 dizziness, 15 headache, 3 depression, 9 insomnia, 3 cough, 4 dyspnoea, 2 alopecia, 3 dry skin, 3 pruritus, 4 rash | 26 out of 26 | |
| Sofosbuvir | 20 anaemia, 23 diarrhoea, 46 nausea, 17 vomiting, 7 chills, 92 fatigue, 7 influenza‐like illness, 25 irritability, 6 pyrexia, 17 decreased appetite, 15 arthralgia, 21 myalgia, 27 dizziness, 64 headache, 14 depression, 31 insomnia, 19 cough, 18 dyspnoea, 12 alopecia, 11 dry skin, 19 pruritus, 23 rash | 219 out of 256 | 28 anaemia, 30 neutropenia, 45 diarrhoea, 70 nausea, 23 vomiting, 44 chills, 134 fatigue, 44 influenza‐like illness, 40 irritability, 33 pyrexia, 44 decreased appetite, 35 arthralgia, 40 myalgia, 33 dizziness, 108 headache, 34 depression, 71 insomnia, 21 cough, 20 dyspnoea, 24 alopecia, 23 dry skin, 42 pruritus, 43 rash | 233 out of 243 | |
| Sofosbuvir | 7 anaemia, 17 nausea, 3 vomiting, 22 fatigue, 4 pyrexia, 7 decreased appetite, 12 arthralgia, 7 myalgia, 6 dizziness, 15 headache, 4 depression, 7 insomnia, 9 pruritus | 45 out of 49 | 1 anaemia, 5 nausea, 2 chills, 6 fatigue, 1 pyrexia, 1 decreased appetite, 1 myalgia, 2 dizziness, 2 headache, 2 insomnia,1 pruritus | 13 out of 14 | |
| Sofosbuvir/velpatasvir | 48 diarrhoea, 75 nausea, 41 asthenia, 126 fatigue, 40 arthralgia, 25 myalgia, 182 headache, 50 insomnia, 39 cough | 485 out of 624 | 8 diarrhoea, 13 nausea, 9 asthenia, 23 fatigue, 9 arthralgia, 6 myalgia, 33 headache, 11 insomnia, 4 cough | 89 out of 116 | |
| Telaprevir | 1 diarrhoea, 4 nausea, 1 vomiting, 6 asthenia, 4 fatigue, 10 influenza‐like illness, 3 headache, 2 insomnia, 1 dyspnoea, 1 dry skin, 3 pruritus | 16 out of 16 | 1 anaemia, 1 neutropenia, 3 asthenia, 4 influenza‐like illness, 1 decreased appetite, 1 headache, 1 insomnia, 1 cough, 1 dry skin, 2 pruritus, 2 rash | 8 out of 8 | |
| Telaprevir | 2 diarrhoea, 3 nausea, 1 chills, 5 myalgia, 2 dizziness, 5 headache, 3 dry skin, 3 rash | 14 out of 16 | 1 diarrhoea, 1 nausea, 1 asthenia, 2 chills, 2 myalgia, 1 dizziness, 2 headache, 1 dry skin | 4 out of 4 | |
| Telaprevir | 1 anaemia, 4 diarrhoea, 8 nausea, 5 vomiting, 9 asthenia, 1 chills, 5 fatigue, 11 influenza‐like illness, 1 irritability, 2 pyrexia, 1 arthralgia, 4 myalgia, 3 dizziness, 5 headache, 1 depression, 2 insomnia, 1 cough, 2 dyspnoea, 1 alopecia, 3 dry skin, 11 pruritus, 5 rash | 26 out of 31 | 1 neutropenia, 1 diarrhoea, 1 nausea, 5 asthenia, 3 chills, 2 fatigue, 7 influenza‐like illness, 5 pyrexia, 3 myalgia, 1 dysgeusia, 6 headache, 1 depression, 2 insomnia, 2 cough, 2 dyspnoea, 1 dry skin, 2 pruritus | 16 out of 18 | |
| Telaprevir | 44 anaemia, 11 neutropenia, 66 diarrhoea, 102 nausea, 22 vomiting, 110 asthenia, 12 chills, 70 fatigue, 92 influenza‐like illness, 22 irritability, 44 pyrexia, 30 decreased appetite, 36 arthralgia, 35 myalgia, 12 dizziness, 20 dysgeusia, 105 headache, 51 depression, 62 insomnia, 37 cough, 50 dyspnoea, 29 alopecia, 64 dry skin, 139 pruritus, 71 rash | 240 out of 241 | 14 anaemia, 14 neutropenia, 23 diarrhoea, 33 nausea, 12 vomiting, 26 asthenia, 10 chills, 30 fatigue, 43 influenza‐like illness, 11 irritability, 19 pyrexia, 16 decreased appetite, 14 arthralgia, 17 myalgia, 8 dizziness, 3 dysgeusia, 37 headache, 19 depression, 32 insomnia, 21 cough, 13 dyspnoea, 17 alopecia, 29 dry skin, 29 pruritus, 22 rash | 81 out of 82 | |
| Telaprevir | 276 anaemia, 217 diarrhoea, 302 nausea, 418 fatigue, 203 pyrexia, 304 headache, 233 insomnia, 346 pruritus, 262 rash | 723 out of 727 | 70 anaemia, 80 diarrhoea, 112 nausea, 206 fatigue, 87 pyrexia, 142 headache, 111 insomnia, 131 pruritus, 88 rash | 354 out of 361 | |
| Telaprevir | 58 anaemia, 30 neutropenia, 64 diarrhoea, 93 nausea, 38 vomiting, 29 chills, 127 fatigue, 75 influenza‐like illness, 23 irritability, 33 pyrexia, 22 decreased appetite, 34 arthralgia, 27 myalgia, 41 dizziness, 16 dysgeusia, 80 headache, 34 depression, 68 insomnia, 36 cough, 25 dyspnoea, 21 alopecia, 28 dry skin, 74 pruritus, 62 rash | 175 out of 175 | 20 anaemia, 18 neutropenia, 21 diarrhoea, 22 nausea, 9 vomiting, 14 chills, 57 fatigue, 32 influenza‐like illness, 22 irritability, 22 pyrexia, 9 decreased appetite, 16 arthralgia, 18 myalgia, 14 dizziness, 8 dysgeusia, 45 headache, 13 depression, 29 insomnia, 14 cough, 11 dyspnoea, 8 alopecia, 19 dry skin, 17 pruritus, 20 rash | 75 out of 75 | |
| Telaprevir | 69 anaemia, 31 neutropenia, 115 diarrhoea, 122 nausea, 37 vomiting, 57 chills, 197 fatigue, 93 influenza‐like illness, 63 irritability, 59 pyrexia, 20 decreased appetite, 51 arthralgia, 60 myalgia, 47 dizziness, 130 headache, 43 depression, 83 insomnia, 46 cough, 27 dyspnoea, 54 alopecia, 32 dry skin, 129 pruritus, 126 rash | 329 out of 339 | 9 anaemia, 7 neutropenia, 22 diarrhoea, 39 nausea, 13 vomiting, 15 chills, 64 fatigue, 36 influenza‐like illness, 25 irritability, 14 pyrexia, 12 decreased appetite, 21 arthralgia, 21 myalgia, 18 dizziness, 41 headache, 19 depression, 19 insomnia, 20 cough, 9 dyspnoea, 13 alopecia, 7 dry skin, 17 pruritus, 20 rash | 111 out of 114 | |
| Telaprevir | 35 anaemia, 26 neutropenia, 34 diarrhoea, 44 nausea, 27 vomiting, 22 asthenia, 15 chills, 50 fatigue, 24 influenza‐like illness, 18 irritability, 34 pyrexia, 30 decreased appetite, 9 arthralgia, 20 myalgia, 19 dizziness, 18 dysgeusia, 38 headache, 11 depression, 25 insomnia, 15 cough, 5 dyspnoea, 18 alopecia, 11 dry skin, 30 pruritus, 12 rash | 38 out of 38 | 8 anaemia, 2 neutropenia, 6 diarrhoea, 11 nausea, 5 vomiting, 9 asthenia, 5 chills, 12 fatigue, 13 influenza‐like illness, 5 irritability, 7 pyrexia, 6 decreased appetite, 2 arthralgia, 6 myalgia, 2 dizziness, 5 dysgeusia, 6 headache, 4 depression, 9 insomnia, 6 cough, 2 dyspnoea, 6 alopecia, 3 dry skin, 3 pruritus | 22 out of 22 | |
| Telaprevir | 171 anaemia, 73 neutropenia, 135 diarrhoea, 181 nausea, 68 vomiting, 111 asthenia, 73 chills, 276 fatigue, 179 influenza‐like illness, 74 irritability, 130 pyrexia, 40 decreased appetite, 67 arthralgia, 87 myalgia, 47 dizziness, 65 dysgeusia, 221 headache, 59 depression, 152 insomnia, 128 cough, 82 dyspnoea, 78 alopecia, 97 dry skin, 270 pruritus, 194 rash | 517 out of 530 | 19 anaemia, 14 neutropenia, 18 diarrhoea, 31 nausea, 11 vomiting, 38 asthenia, 73 chills, 53 fatigue, 33 influenza‐like illness, 21 irritability, 36 pyrexia, 9 decreased appetite, 20 arthralgia, 24 myalgia, 7 dizziness, 8 dysgeusia, 49 headache, 19 depression, 34 insomnia, 26 cough, 17 dyspnoea, 17 alopecia, 21 dry skin, 36 pruritus, 25 rash | 126 out of 132 | |
| Vaniprevir | 6 anaemia, 7 neutropenia, 16 diarrhoea, 26 nausea, 16 vomiting, 13 asthenia, 5 chills, 17 fatigue, 17influenza‐like illness, 4 irritability, 8 pyrexia, 13 decreased appetite, 8 arthralgia, 3 myalgia, 5 dizziness, 2 dysgeusia, 26 headache, 8 depression, 15 insomnia, 8 cough, 7 dyspnoea, 6 alopecia, 6 dry skin, 9 pruritus, 10 rash | 71 out of 75 | 3 anaemia, 2 neutropenia, 4 diarrhoea, 6 nausea, 4 asthenia, 2 chills, 7 fatigue, 4 influenza‐like illness, 3 irritability, 2 pyrexia, 2 decreased appetite, 2 arthralgia, 3 myalgia, 7 headache, 3 depression, 2 insomnia, 3 cough, 5 dyspnoea, 3 alopecia, 6 dry skin, 4 pruritus, 4 rash | 19 out of 19 | |
| Vaniprevir | 6 anaemia, 7 neutropenia, 16 diarrhoea, 26 nausea, 16 vomiting, 13 asthenia, 5 chills, 17 fatigue, 17 influenza‐like illness, 4 irritability, 8 pyrexia, 13 decreased appetite, 8 arthralgia, 3 myalgia, 5 dizziness, 2 dysgeusia, 26 headache, 8 depression, 15 insomnia, 8 cough, 7 dyspnoea, 6 alopecia, 6 dry skin, 9 pruritus, 10 rash | 71 out of 75 | 3 anaemia, 2 neutropenia, 4 diarrhoea, 6 nausea, 4 asthenia, 2 chills, 7 fatigue, 4 influenza‐like illness, 3 irritability, 2 pyrexia, 2 decreased appetite, 2 arthralgia, 3 myalgia, 7 headache, 3 depression, 2 insomnia, 3 cough, 5 dyspnoea, 3 alopecia, 6 dry skin, 4 pruritus, 4 rash | 19 out of 19 | |
| Vaniprevir | 43 anaemia, 34 neutropenia, 97 diarrhoea, 110 nausea, 59 vomiting, 50 asthenia, 16 chills, 92 fatigue, 54 influenza‐like illness, 24 irritability, 37 pyrexia, 40 decreased appetite, 37 arthralgia, 38 myalgia, 23 dizziness, 16 dysgeusia, 92 headache, 32 depression, 40 insomnia, 54 cough, 30 dyspnoea, 35 alopecia, 37 dry skin, 75 pruritus, 43 rash | 225 out of 229 | 8 anaemia, 3 neutropenia, 9 diarrhoea, 10 nausea, 3 vomiting, 11 asthenia, 1 chills, 18 fatigue, 12 influenza‐like illness, 8 irritability, 14 pyrexia, 5 decreased appetite, 11 arthralgia, 12 myalgia, 6 dizziness, 3 dysgeusia, 20 headache, 3 depression, 14 insomnia, 14 cough, 8 dyspnoea, 5 alopecia, 10 dry skin, 14 pruritus, 10 rash | 55 out of 56 | |
| Vaniprevir | 43 anaemia, 34 neutropenia, 97 diarrhoea, 110 nausea, 59 vomiting, 50 asthenia, 16 chills, 92 fatigue, 54 influenza‐like illness, 24 irritability, 37 pyrexia, 40 decreased appetite, 37 arthralgia, 38 myalgia, 23 dizziness, 16 dysgeusia, 92 headache, 32 depression, 40 insomnia, 54 cough, 30 dyspnoea, 35 alopecia, 37 dry skin, 75 pruritus, 43 rash | 225 out of 229 | 8 anaemia, 3 neutropenia, 9 diarrhoea, 10 nausea, 3 vomiting, 11 asthenia, 1 chills, 18 fatigue, 12 influenza‐like illness, 8 irritability, 14 pyrexia, 5 decreased appetite, 11 arthralgia, 12 myalgia, 6 dizziness, 3 dysgeusia, 20 headache, 3 depression, 14 insomnia, 14 cough, 8 dyspnoea, 5 alopecia, 10 dry skin, 14 pruritus, 10 rash | 55 out of 56 | |
| VCH‐759 | 18 diarrhoea, 3 nausea, 4 vomiting, 1 chills, 5 fatigue, 8 headache | 20 out of 23 | 5 diarrhoea, 1 nausea, 2 headache | 6 out of 9 | |
| Velpatasvir | 2 diarrhoea, 3 nausea, 4 vomiting, 6 headache, 2 cough | 18 out of 70 | None reported | 3 out of 17 |
| Outcome or subgroup title | No. of studies | No. of participants | Statistical method | Effect size |
| 1 Hepatitis C‐related morbidity or all‐cause mortality Show forest plot | 71 | Odds Ratio (M‐H, Fixed, 95% CI) | Totals not selected | |
| 2 Hepatitis C‐related morbidity or all‐cause mortality ‐ bias risk Show forest plot | 71 | Odds Ratio (M‐H, Fixed, 95% CI) | Totals not selected | |
| 2.1 Trials at high risk of bias | 71 | Odds Ratio (M‐H, Fixed, 95% CI) | 0.0 [0.0, 0.0] | |
| 2.2 Trials at low risk of bias | 0 | Odds Ratio (M‐H, Fixed, 95% CI) | 0.0 [0.0, 0.0] | |
| 3 Hepatitis C‐related morbidity or all‐cause mortality ‐ according to type of DAA Show forest plot | 71 | Odds Ratio (M‐H, Fixed, 95% CI) | Totals not selected | |
| 3.1 ABT‐072 | 0 | Odds Ratio (M‐H, Fixed, 95% CI) | 0.0 [0.0, 0.0] | |
| 3.2 ACH‐2684 | 0 | Odds Ratio (M‐H, Fixed, 95% CI) | 0.0 [0.0, 0.0] | |
| 3.3 Alisporivir | 3 | Odds Ratio (M‐H, Fixed, 95% CI) | 0.0 [0.0, 0.0] | |
| 3.4 ALS‐2200 | 0 | Odds Ratio (M‐H, Fixed, 95% CI) | 0.0 [0.0, 0.0] | |
| 3.5 Asunaprevir | 6 | Odds Ratio (M‐H, Fixed, 95% CI) | 0.0 [0.0, 0.0] | |
| 3.6 Balapiravir | 0 | Odds Ratio (M‐H, Fixed, 95% CI) | 0.0 [0.0, 0.0] | |
| 3.7 Beclabuvir | 3 | Odds Ratio (M‐H, Fixed, 95% CI) | 0.0 [0.0, 0.0] | |
| 3.8 BILB‐1941 | 0 | Odds Ratio (M‐H, Fixed, 95% CI) | 0.0 [0.0, 0.0] | |
| 3.9 BIT‐225 | 0 | Odds Ratio (M‐H, Fixed, 95% CI) | 0.0 [0.0, 0.0] | |
| 3.10 Boceprevir | 0 | Odds Ratio (M‐H, Fixed, 95% CI) | 0.0 [0.0, 0.0] | |
| 3.11 Ciluprevir | 0 | Odds Ratio (M‐H, Fixed, 95% CI) | 0.0 [0.0, 0.0] | |
| 3.12 Daclatasvir | 14 | Odds Ratio (M‐H, Fixed, 95% CI) | 0.0 [0.0, 0.0] | |
| 3.13 Danoprevir | 9 | Odds Ratio (M‐H, Fixed, 95% CI) | 0.0 [0.0, 0.0] | |
| 3.14 Dasabuvir | 0 | Odds Ratio (M‐H, Fixed, 95% CI) | 0.0 [0.0, 0.0] | |
| 3.15 Deleobuvir | 0 | Odds Ratio (M‐H, Fixed, 95% CI) | 0.0 [0.0, 0.0] | |
| 3.16 Faldaprevir | 0 | Odds Ratio (M‐H, Fixed, 95% CI) | 0.0 [0.0, 0.0] | |
| 3.17 Filibuvir | 0 | Odds Ratio (M‐H, Fixed, 95% CI) | 0.0 [0.0, 0.0] | |
| 3.18 Grazoprevir | 0 | Odds Ratio (M‐H, Fixed, 95% CI) | 0.0 [0.0, 0.0] | |
| 3.19 GS‐6620 | 0 | Odds Ratio (M‐H, Fixed, 95% CI) | 0.0 [0.0, 0.0] | |
| 3.20 GS‐9256 | 0 | Odds Ratio (M‐H, Fixed, 95% CI) | 0.0 [0.0, 0.0] | |
| 3.21 GS‐9451 | 1 | Odds Ratio (M‐H, Fixed, 95% CI) | 0.0 [0.0, 0.0] | |
| 3.22 GS‐9669 | 0 | Odds Ratio (M‐H, Fixed, 95% CI) | 0.0 [0.0, 0.0] | |
| 3.23 GS‐9851 | 0 | Odds Ratio (M‐H, Fixed, 95% CI) | 0.0 [0.0, 0.0] | |
| 3.24 GS‐9857 | 0 | Odds Ratio (M‐H, Fixed, 95% CI) | 0.0 [0.0, 0.0] | |
| 3.25 GSK2336805 | 2 | Odds Ratio (M‐H, Fixed, 95% CI) | 0.0 [0.0, 0.0] | |
| 3.26 GSK2878175 | 0 | Odds Ratio (M‐H, Fixed, 95% CI) | 0.0 [0.0, 0.0] | |
| 3.27 IDX‐184 | 0 | Odds Ratio (M‐H, Fixed, 95% CI) | 0.0 [0.0, 0.0] | |
| 3.28 INX‐08189 | 0 | Odds Ratio (M‐H, Fixed, 95% CI) | 0.0 [0.0, 0.0] | |
| 3.29 Ledispasvir | 0 | Odds Ratio (M‐H, Fixed, 95% CI) | 0.0 [0.0, 0.0] | |
| 3.30 Mericitabine | 3 | Odds Ratio (M‐H, Fixed, 95% CI) | 0.0 [0.0, 0.0] | |
| 3.31 Narlaprevir | 0 | Odds Ratio (M‐H, Fixed, 95% CI) | 0.0 [0.0, 0.0] | |
| 3.32 Nesbuvir | 0 | Odds Ratio (M‐H, Fixed, 95% CI) | 0.0 [0.0, 0.0] | |
| 3.33 Odalasavir | 0 | Odds Ratio (M‐H, Fixed, 95% CI) | 0.0 [0.0, 0.0] | |
| 3.34 Ombitasvir | 0 | Odds Ratio (M‐H, Fixed, 95% CI) | 0.0 [0.0, 0.0] | |
| 3.35 Paritaprevir | 0 | Odds Ratio (M‐H, Fixed, 95% CI) | 0.0 [0.0, 0.0] | |
| 3.36 PHX1766 | 0 | Odds Ratio (M‐H, Fixed, 95% CI) | 0.0 [0.0, 0.0] | |
| 3.37 PPI‐461 | 0 | Odds Ratio (M‐H, Fixed, 95% CI) | 0.0 [0.0, 0.0] | |
| 3.38 PSI‐352938 | 0 | Odds Ratio (M‐H, Fixed, 95% CI) | 0.0 [0.0, 0.0] | |
| 3.39 Samatasvir | 1 | Odds Ratio (M‐H, Fixed, 95% CI) | 0.0 [0.0, 0.0] | |
| 3.40 Setrobuvir | 0 | Odds Ratio (M‐H, Fixed, 95% CI) | 0.0 [0.0, 0.0] | |
| 3.41 Simeprevir | 14 | Odds Ratio (M‐H, Fixed, 95% CI) | 0.0 [0.0, 0.0] | |
| 3.42 Sofosbuvir | 0 | Odds Ratio (M‐H, Fixed, 95% CI) | 0.0 [0.0, 0.0] | |
| 3.43 Sovaprevir | 1 | Odds Ratio (M‐H, Fixed, 95% CI) | 0.0 [0.0, 0.0] | |
| 3.44 Tegobuvir | 0 | Odds Ratio (M‐H, Fixed, 95% CI) | 0.0 [0.0, 0.0] | |
| 3.45 Telaprevir | 0 | Odds Ratio (M‐H, Fixed, 95% CI) | 0.0 [0.0, 0.0] | |
| 3.46 Valopicitabine | 0 | Odds Ratio (M‐H, Fixed, 95% CI) | 0.0 [0.0, 0.0] | |
| 3.47 Vaniprevir | 9 | Odds Ratio (M‐H, Fixed, 95% CI) | 0.0 [0.0, 0.0] | |
| 3.48 VCH‐759 | 0 | Odds Ratio (M‐H, Fixed, 95% CI) | 0.0 [0.0, 0.0] | |
| 3.49 VCH‐916 | 0 | Odds Ratio (M‐H, Fixed, 95% CI) | 0.0 [0.0, 0.0] | |
| 3.50 Velpatasvir | 1 | Odds Ratio (M‐H, Fixed, 95% CI) | 0.0 [0.0, 0.0] | |
| 3.51 VX‐222 | 0 | Odds Ratio (M‐H, Fixed, 95% CI) | 0.0 [0.0, 0.0] | |
| 3.52 Mixed | 4 | Odds Ratio (M‐H, Fixed, 95% CI) | 0.0 [0.0, 0.0] | |
| 4 Hepatitis C‐related morbidity or all‐cause mortality ‐ according to group of DAA Show forest plot | 71 | Odds Ratio (M‐H, Fixed, 95% CI) | Totals not selected | |
| 4.1 Cyclophilin | 3 | Odds Ratio (M‐H, Fixed, 95% CI) | 0.0 [0.0, 0.0] | |
| 4.2 NS3/NS4A inhibitors | 41 | Odds Ratio (M‐H, Fixed, 95% CI) | 0.0 [0.0, 0.0] | |
| 4.3 NS5B inhibitors (NPI) | 3 | Odds Ratio (M‐H, Fixed, 95% CI) | 0.0 [0.0, 0.0] | |
| 4.4 NS5B inhibitors (NNPI) | 3 | Odds Ratio (M‐H, Fixed, 95% CI) | 0.0 [0.0, 0.0] | |
| 4.5 NS5A inhibitors | 18 | Odds Ratio (M‐H, Fixed, 95% CI) | 0.0 [0.0, 0.0] | |
| 4.6 VPU‐ion channel inhibitors | 0 | Odds Ratio (M‐H, Fixed, 95% CI) | 0.0 [0.0, 0.0] | |
| 4.7 Mixed | 3 | Odds Ratio (M‐H, Fixed, 95% CI) | 0.0 [0.0, 0.0] | |
| 5 Hepatitis C‐related morbidity or all‐cause mortality ‐ according to HIV‐infection Show forest plot | 71 | Odds Ratio (M‐H, Fixed, 95% CI) | Totals not selected | |
| 5.1 With HIV‐infection | 0 | Odds Ratio (M‐H, Fixed, 95% CI) | 0.0 [0.0, 0.0] | |
| 5.2 Without HIV‐infection | 69 | Odds Ratio (M‐H, Fixed, 95% CI) | 0.0 [0.0, 0.0] | |
| 5.3 Mixed (with and without HIV‐infection) | 0 | Odds Ratio (M‐H, Fixed, 95% CI) | 0.0 [0.0, 0.0] | |
| 5.4 Unclear | 2 | Odds Ratio (M‐H, Fixed, 95% CI) | 0.0 [0.0, 0.0] | |
| 6 Hepatitis C‐related morbidity or all‐cause mortality ‐ according to comorbidity Show forest plot | 71 | Odds Ratio (M‐H, Fixed, 95% CI) | Totals not selected | |
| 6.1 With comorbidity | 0 | Odds Ratio (M‐H, Fixed, 95% CI) | 0.0 [0.0, 0.0] | |
| 6.2 Without comorbidity | 0 | Odds Ratio (M‐H, Fixed, 95% CI) | 0.0 [0.0, 0.0] | |
| 6.3 Unclear | 71 | Odds Ratio (M‐H, Fixed, 95% CI) | 0.0 [0.0, 0.0] | |
| 7 Hepatitis C‐related morbidity or all‐cause mortality ‐ according to viral genotype Show forest plot | 71 | Odds Ratio (M‐H, Fixed, 95% CI) | Totals not selected | |
| 7.1 Genotype 1 | 57 | Odds Ratio (M‐H, Fixed, 95% CI) | 0.0 [0.0, 0.0] | |
| 7.2 Genotype 2 | 0 | Odds Ratio (M‐H, Fixed, 95% CI) | 0.0 [0.0, 0.0] | |
| 7.3 Genotype 3 | 0 | Odds Ratio (M‐H, Fixed, 95% CI) | 0.0 [0.0, 0.0] | |
| 7.4 Genotype 4 | 0 | Odds Ratio (M‐H, Fixed, 95% CI) | 0.0 [0.0, 0.0] | |
| 7.5 Mixed | 14 | Odds Ratio (M‐H, Fixed, 95% CI) | 0.0 [0.0, 0.0] | |
| 8 Hepatitis C‐related morbidity or all‐cause mortality ‐ according to human genotype (IL28b) Show forest plot | 71 | Odds Ratio (M‐H, Fixed, 95% CI) | Totals not selected | |
| 8.1 IL28b (CC) | 0 | Odds Ratio (M‐H, Fixed, 95% CI) | 0.0 [0.0, 0.0] | |
| 8.2 IL28B (CT) | 0 | Odds Ratio (M‐H, Fixed, 95% CI) | 0.0 [0.0, 0.0] | |
| 8.3 IL28B (TT) | 0 | Odds Ratio (M‐H, Fixed, 95% CI) | 0.0 [0.0, 0.0] | |
| 8.4 IL28B (CT + TT) | 0 | Odds Ratio (M‐H, Fixed, 95% CI) | 0.0 [0.0, 0.0] | |
| 8.5 Mixed | 71 | Odds Ratio (M‐H, Fixed, 95% CI) | 0.0 [0.0, 0.0] | |
| 9 Hepatitis C‐related morbidity or all‐cause mortality ‐ according to Asian‐region Show forest plot | 71 | Odds Ratio (M‐H, Fixed, 95% CI) | Totals not selected | |
| 9.1 From Asian region | 8 | Odds Ratio (M‐H, Fixed, 95% CI) | 0.0 [0.0, 0.0] | |
| 9.2 Not from Asian region | 52 | Odds Ratio (M‐H, Fixed, 95% CI) | 0.0 [0.0, 0.0] | |
| 9.3 Mixed | 11 | Odds Ratio (M‐H, Fixed, 95% CI) | 0.0 [0.0, 0.0] | |
| 9.4 Unclear | 0 | Odds Ratio (M‐H, Fixed, 95% CI) | 0.0 [0.0, 0.0] | |
| 10 Hepatitis C‐related morbidity or all‐cause mortality ‐ according to specific ethnicities Show forest plot | 71 | Odds Ratio (M‐H, Fixed, 95% CI) | Totals not selected | |
| 10.1 White | 1 | Odds Ratio (M‐H, Fixed, 95% CI) | 0.0 [0.0, 0.0] | |
| 10.2 Black | 0 | Odds Ratio (M‐H, Fixed, 95% CI) | 0.0 [0.0, 0.0] | |
| 10.3 Hispanic | 0 | Odds Ratio (M‐H, Fixed, 95% CI) | 0.0 [0.0, 0.0] | |
| 10.4 Mixed | 70 | Odds Ratio (M‐H, Fixed, 95% CI) | 0.0 [0.0, 0.0] | |
| 10.5 Unclear | 0 | Odds Ratio (M‐H, Fixed, 95% CI) | 0.0 [0.0, 0.0] | |
| 11 Hepatitis C‐related morbidity or all‐cause mortality ‐ according to reaching planned sample size Show forest plot | 71 | Odds Ratio (M‐H, Fixed, 95% CI) | Totals not selected | |
| 11.1 Trials reaching planned sample size | 10 | Odds Ratio (M‐H, Fixed, 95% CI) | 0.0 [0.0, 0.0] | |
| 11.2 Trials not reaching planned sample size | 3 | Odds Ratio (M‐H, Fixed, 95% CI) | 0.0 [0.0, 0.0] | |
| 11.3 Unclear | 58 | Odds Ratio (M‐H, Fixed, 95% CI) | 0.0 [0.0, 0.0] | |
| 12 Hepatitis C‐related morbidity or all‐cause mortality ‐ according to prior treatment Show forest plot | 71 | Odds Ratio (M‐H, Fixed, 95% CI) | Totals not selected | |
| 12.1 Treatment‐naive | 47 | Odds Ratio (M‐H, Fixed, 95% CI) | 0.0 [0.0, 0.0] | |
| 12.2 Treatment‐experienced | 16 | Odds Ratio (M‐H, Fixed, 95% CI) | 0.0 [0.0, 0.0] | |
| 12.3 Mixed | 8 | Odds Ratio (M‐H, Fixed, 95% CI) | 0.0 [0.0, 0.0] | |
| 12.4 Unclear | 0 | Odds Ratio (M‐H, Fixed, 95% CI) | 0.0 [0.0, 0.0] | |
| 13 Hepatitis C‐related morbidity or all‐cause mortality ‐ according to interferon Show forest plot | 71 | Odds Ratio (M‐H, Fixed, 95% CI) | Totals not selected | |
| 13.1 Trials where both groups received interferon | 52 | Odds Ratio (M‐H, Fixed, 95% CI) | 0.0 [0.0, 0.0] | |
| 13.2 Trials where neither group received interferon | 19 | Odds Ratio (M‐H, Fixed, 95% CI) | 0.0 [0.0, 0.0] | |
| 14 Hepatitis C‐related morbidity or all‐cause mortality ‐ according to ribavirin Show forest plot | 71 | Odds Ratio (M‐H, Fixed, 95% CI) | Totals not selected | |
| 14.1 Trials where both groups received ribavirin | 52 | Odds Ratio (M‐H, Fixed, 95% CI) | 0.0 [0.0, 0.0] | |
| 14.2 Trials where neither group received ribavirin | 19 | Odds Ratio (M‐H, Fixed, 95% CI) | 0.0 [0.0, 0.0] | |
| 15 Hepatitis C‐related morbidity or all‐cause mortality ‐ according to chronic kidney disease Show forest plot | 71 | Odds Ratio (M‐H, Fixed, 95% CI) | Totals not selected | |
| 15.1 With chronic kidney disease | 0 | Odds Ratio (M‐H, Fixed, 95% CI) | 0.0 [0.0, 0.0] | |
| 15.2 Without chronic kidney disease | 0 | Odds Ratio (M‐H, Fixed, 95% CI) | 0.0 [0.0, 0.0] | |
| 15.3 Unclear | 71 | Odds Ratio (M‐H, Fixed, 95% CI) | 0.0 [0.0, 0.0] | |
| 16 Hepatitis C‐related morbidity or all‐cause mortality ‐ according to cryoglobulinaemia Show forest plot | 71 | Odds Ratio (M‐H, Fixed, 95% CI) | Totals not selected | |
| 16.1 With cryoglobulinaemia | 0 | Odds Ratio (M‐H, Fixed, 95% CI) | 0.0 [0.0, 0.0] | |
| 16.2 Without cryoglobulinaemia | 0 | Odds Ratio (M‐H, Fixed, 95% CI) | 0.0 [0.0, 0.0] | |
| 16.3 Unclear | 71 | Odds Ratio (M‐H, Fixed, 95% CI) | 0.0 [0.0, 0.0] | |
| 17 Hepatitis C‐related morbidity or all‐cause mortality ‐ according to DAA group as co‐intervention Show forest plot | 71 | Odds Ratio (M‐H, Fixed, 95% CI) | Totals not selected | |
| 17.1 Trials where DAA were used as co‐intervention | 2 | Odds Ratio (M‐H, Fixed, 95% CI) | 0.0 [0.0, 0.0] | |
| 17.2 Trials where DAA were not a co‐intervention | 69 | Odds Ratio (M‐H, Fixed, 95% CI) | 0.0 [0.0, 0.0] | |
| 18 Hepatitis C‐related morbidity or all‐cause mortality ‐ according to median dose Show forest plot | 71 | Odds Ratio (M‐H, Fixed, 95% CI) | Totals not selected | |
| 18.1 Over or equal to median dose | 41 | Odds Ratio (M‐H, Fixed, 95% CI) | 0.0 [0.0, 0.0] | |
| 18.2 Under median dose | 27 | Odds Ratio (M‐H, Fixed, 95% CI) | 0.0 [0.0, 0.0] | |
| 18.3 Not available | 3 | Odds Ratio (M‐H, Fixed, 95% CI) | 0.0 [0.0, 0.0] | |
| Outcome or subgroup title | No. of studies | No. of participants | Statistical method | Effect size |
| 1 Serious adverse events Show forest plot | 101 | Odds Ratio (M‐H, Fixed, 95% CI) | Totals not selected | |
| 2 Serious adverse events ‐ bias risk Show forest plot | 101 | Odds Ratio (M‐H, Fixed, 95% CI) | Totals not selected | |
| 2.1 Trials at high risk of bias | 101 | Odds Ratio (M‐H, Fixed, 95% CI) | 0.0 [0.0, 0.0] | |
| 2.2 Trials at low risk of bias | 0 | Odds Ratio (M‐H, Fixed, 95% CI) | 0.0 [0.0, 0.0] | |
| 3 Serious adverse events ‐ according to type of DAA Show forest plot | 101 | Odds Ratio (M‐H, Fixed, 95% CI) | Totals not selected | |
| 3.1 ABT‐072 | 0 | Odds Ratio (M‐H, Fixed, 95% CI) | 0.0 [0.0, 0.0] | |
| 3.2 ACH‐2684 | 0 | Odds Ratio (M‐H, Fixed, 95% CI) | 0.0 [0.0, 0.0] | |
| 3.3 Alisporivir | 3 | Odds Ratio (M‐H, Fixed, 95% CI) | 0.0 [0.0, 0.0] | |
| 3.4 ALS‐2200 | 0 | Odds Ratio (M‐H, Fixed, 95% CI) | 0.0 [0.0, 0.0] | |
| 3.5 Asunaprevir | 6 | Odds Ratio (M‐H, Fixed, 95% CI) | 0.0 [0.0, 0.0] | |
| 3.6 Balapiravir | 0 | Odds Ratio (M‐H, Fixed, 95% CI) | 0.0 [0.0, 0.0] | |
| 3.7 Beclabuvir | 3 | Odds Ratio (M‐H, Fixed, 95% CI) | 0.0 [0.0, 0.0] | |
| 3.8 BILB‐1941 | 0 | Odds Ratio (M‐H, Fixed, 95% CI) | 0.0 [0.0, 0.0] | |
| 3.9 BIT‐225 | 0 | Odds Ratio (M‐H, Fixed, 95% CI) | 0.0 [0.0, 0.0] | |
| 3.10 Boceprevir | 0 | Odds Ratio (M‐H, Fixed, 95% CI) | 0.0 [0.0, 0.0] | |
| 3.11 Ciluprevir | 0 | Odds Ratio (M‐H, Fixed, 95% CI) | 0.0 [0.0, 0.0] | |
| 3.12 Daclatasvir | 14 | Odds Ratio (M‐H, Fixed, 95% CI) | 0.0 [0.0, 0.0] | |
| 3.13 Danoprevir | 9 | Odds Ratio (M‐H, Fixed, 95% CI) | 0.0 [0.0, 0.0] | |
| 3.14 Dasabuvir | 2 | Odds Ratio (M‐H, Fixed, 95% CI) | 0.0 [0.0, 0.0] | |
| 3.15 Deleobuvir | 0 | Odds Ratio (M‐H, Fixed, 95% CI) | 0.0 [0.0, 0.0] | |
| 3.16 Faldaprevir | 0 | Odds Ratio (M‐H, Fixed, 95% CI) | 0.0 [0.0, 0.0] | |
| 3.17 Filibuvir | 0 | Odds Ratio (M‐H, Fixed, 95% CI) | 0.0 [0.0, 0.0] | |
| 3.18 Grazoprevir | 0 | Odds Ratio (M‐H, Fixed, 95% CI) | 0.0 [0.0, 0.0] | |
| 3.19 GS‐6620 | 0 | Odds Ratio (M‐H, Fixed, 95% CI) | 0.0 [0.0, 0.0] | |
| 3.20 GS‐9256 | 0 | Odds Ratio (M‐H, Fixed, 95% CI) | 0.0 [0.0, 0.0] | |
| 3.21 GS‐9451 | 1 | Odds Ratio (M‐H, Fixed, 95% CI) | 0.0 [0.0, 0.0] | |
| 3.22 GS‐9669 | 0 | Odds Ratio (M‐H, Fixed, 95% CI) | 0.0 [0.0, 0.0] | |
| 3.23 GS‐9851 | 1 | Odds Ratio (M‐H, Fixed, 95% CI) | 0.0 [0.0, 0.0] | |
| 3.24 GS‐9857 | 0 | Odds Ratio (M‐H, Fixed, 95% CI) | 0.0 [0.0, 0.0] | |
| 3.25 GSK2336805 | 2 | Odds Ratio (M‐H, Fixed, 95% CI) | 0.0 [0.0, 0.0] | |
| 3.26 GSK2878175 | 0 | Odds Ratio (M‐H, Fixed, 95% CI) | 0.0 [0.0, 0.0] | |
| 3.27 IDX‐184 | 0 | Odds Ratio (M‐H, Fixed, 95% CI) | 0.0 [0.0, 0.0] | |
| 3.28 INX‐08189 | 0 | Odds Ratio (M‐H, Fixed, 95% CI) | 0.0 [0.0, 0.0] | |
| 3.29 Ledispasvir | 1 | Odds Ratio (M‐H, Fixed, 95% CI) | 0.0 [0.0, 0.0] | |
| 3.30 Mericitabine | 7 | Odds Ratio (M‐H, Fixed, 95% CI) | 0.0 [0.0, 0.0] | |
| 3.31 Narlaprevir | 2 | Odds Ratio (M‐H, Fixed, 95% CI) | 0.0 [0.0, 0.0] | |
| 3.32 Nesbuvir | 0 | Odds Ratio (M‐H, Fixed, 95% CI) | 0.0 [0.0, 0.0] | |
| 3.33 Odalasavir | 1 | Odds Ratio (M‐H, Fixed, 95% CI) | 0.0 [0.0, 0.0] | |
| 3.34 Ombitasvir | 1 | Odds Ratio (M‐H, Fixed, 95% CI) | 0.0 [0.0, 0.0] | |
| 3.35 Paritaprevir | 3 | Odds Ratio (M‐H, Fixed, 95% CI) | 0.0 [0.0, 0.0] | |
| 3.36 PHX1766 | 0 | Odds Ratio (M‐H, Fixed, 95% CI) | 0.0 [0.0, 0.0] | |
| 3.37 PPI‐461 | 3 | Odds Ratio (M‐H, Fixed, 95% CI) | 0.0 [0.0, 0.0] | |
| 3.38 PSI‐352938 | 0 | Odds Ratio (M‐H, Fixed, 95% CI) | 0.0 [0.0, 0.0] | |
| 3.39 Samatasvir | 1 | Odds Ratio (M‐H, Fixed, 95% CI) | 0.0 [0.0, 0.0] | |
| 3.40 Setrobuvir | 0 | Odds Ratio (M‐H, Fixed, 95% CI) | 0.0 [0.0, 0.0] | |
| 3.41 Simeprevir | 18 | Odds Ratio (M‐H, Fixed, 95% CI) | 0.0 [0.0, 0.0] | |
| 3.42 Sofosbuvir | 4 | Odds Ratio (M‐H, Fixed, 95% CI) | 0.0 [0.0, 0.0] | |
| 3.43 Sovaprevir | 1 | Odds Ratio (M‐H, Fixed, 95% CI) | 0.0 [0.0, 0.0] | |
| 3.44 Tegobuvir | 0 | Odds Ratio (M‐H, Fixed, 95% CI) | 0.0 [0.0, 0.0] | |
| 3.45 Telaprevir | 0 | Odds Ratio (M‐H, Fixed, 95% CI) | 0.0 [0.0, 0.0] | |
| 3.46 Valopicitabine | 0 | Odds Ratio (M‐H, Fixed, 95% CI) | 0.0 [0.0, 0.0] | |
| 3.47 Vaniprevir | 10 | Odds Ratio (M‐H, Fixed, 95% CI) | 0.0 [0.0, 0.0] | |
| 3.48 VCH‐759 | 0 | Odds Ratio (M‐H, Fixed, 95% CI) | 0.0 [0.0, 0.0] | |
| 3.49 VCH‐916 | 0 | Odds Ratio (M‐H, Fixed, 95% CI) | 0.0 [0.0, 0.0] | |
| 3.50 Velpatasvir | 1 | Odds Ratio (M‐H, Fixed, 95% CI) | 0.0 [0.0, 0.0] | |
| 3.51 VX‐222 | 0 | Odds Ratio (M‐H, Fixed, 95% CI) | 0.0 [0.0, 0.0] | |
| 3.52 Mixed | 7 | Odds Ratio (M‐H, Fixed, 95% CI) | 0.0 [0.0, 0.0] | |
| 4 Serious adverse events ‐ according to group of DAA Show forest plot | 101 | Odds Ratio (M‐H, Fixed, 95% CI) | Totals not selected | |
| 4.1 Cyclophilin | 3 | Odds Ratio (M‐H, Fixed, 95% CI) | 0.0 [0.0, 0.0] | |
| 4.2 NS3/NS4A inhibitors | 56 | Odds Ratio (M‐H, Fixed, 95% CI) | 0.0 [0.0, 0.0] | |
| 4.3 NS5B inhibitors (NPI) | 8 | Odds Ratio (M‐H, Fixed, 95% CI) | 0.0 [0.0, 0.0] | |
| 4.4 NS5B inhibitors (NNPI) | 5 | Odds Ratio (M‐H, Fixed, 95% CI) | 0.0 [0.0, 0.0] | |
| 4.5 NS5A inhibitors | 25 | Odds Ratio (M‐H, Fixed, 95% CI) | 0.0 [0.0, 0.0] | |
| 4.6 VPU‐ion channel inhibitors | 0 | Odds Ratio (M‐H, Fixed, 95% CI) | 0.0 [0.0, 0.0] | |
| 4.7 Mixed | 4 | Odds Ratio (M‐H, Fixed, 95% CI) | 0.0 [0.0, 0.0] | |
| 5 Serious adverse events ‐ according to HIV‐infection Show forest plot | 101 | Odds Ratio (M‐H, Fixed, 95% CI) | Totals not selected | |
| 5.1 With HIV‐infection | 0 | Odds Ratio (M‐H, Fixed, 95% CI) | 0.0 [0.0, 0.0] | |
| 5.2 Without HIV‐infection | 94 | Odds Ratio (M‐H, Fixed, 95% CI) | 0.0 [0.0, 0.0] | |
| 5.3 Mixed (with and without HIV‐infection) | 0 | Odds Ratio (M‐H, Fixed, 95% CI) | 0.0 [0.0, 0.0] | |
| 5.4 Unclear | 7 | Odds Ratio (M‐H, Fixed, 95% CI) | 0.0 [0.0, 0.0] | |
| 6 Serious adverse events ‐ according to comorbidity Show forest plot | 101 | Odds Ratio (M‐H, Fixed, 95% CI) | Totals not selected | |
| 6.1 With comorbidity | 0 | Odds Ratio (M‐H, Fixed, 95% CI) | 0.0 [0.0, 0.0] | |
| 6.2 Without comorbidity | 0 | Odds Ratio (M‐H, Fixed, 95% CI) | 0.0 [0.0, 0.0] | |
| 6.3 Unclear | 101 | Odds Ratio (M‐H, Fixed, 95% CI) | 0.0 [0.0, 0.0] | |
| 7 Serious adverse events ‐ according to viral genotype Show forest plot | 101 | Odds Ratio (M‐H, Fixed, 95% CI) | Totals not selected | |
| 7.1 Genotype 1 | 84 | Odds Ratio (M‐H, Fixed, 95% CI) | 0.0 [0.0, 0.0] | |
| 7.2 Genotype 2 | 0 | Odds Ratio (M‐H, Fixed, 95% CI) | 0.0 [0.0, 0.0] | |
| 7.3 Genotype 3 | 0 | Odds Ratio (M‐H, Fixed, 95% CI) | 0.0 [0.0, 0.0] | |
| 7.4 Genotype 4 | 0 | Odds Ratio (M‐H, Fixed, 95% CI) | 0.0 [0.0, 0.0] | |
| 7.5 Mixed | 17 | Odds Ratio (M‐H, Fixed, 95% CI) | 0.0 [0.0, 0.0] | |
| 8 Serious adverse events ‐ according to human genotype (IL28b) Show forest plot | 101 | Odds Ratio (M‐H, Fixed, 95% CI) | Totals not selected | |
| 8.1 IL28b (CC) | 0 | Odds Ratio (M‐H, Fixed, 95% CI) | 0.0 [0.0, 0.0] | |
| 8.2 IL28B (CT) | 0 | Odds Ratio (M‐H, Fixed, 95% CI) | 0.0 [0.0, 0.0] | |
| 8.3 IL28B (TT) | 0 | Odds Ratio (M‐H, Fixed, 95% CI) | 0.0 [0.0, 0.0] | |
| 8.4 IL28B (CT + TT) | 0 | Odds Ratio (M‐H, Fixed, 95% CI) | 0.0 [0.0, 0.0] | |
| 8.5 Mixed | 101 | Odds Ratio (M‐H, Fixed, 95% CI) | 0.0 [0.0, 0.0] | |
| 9 Serious adverse events ‐ according to Asian‐region Show forest plot | 101 | Odds Ratio (M‐H, Fixed, 95% CI) | Totals not selected | |
| 9.1 From Asian region | 10 | Odds Ratio (M‐H, Fixed, 95% CI) | 0.0 [0.0, 0.0] | |
| 9.2 Not from Asian region | 76 | Odds Ratio (M‐H, Fixed, 95% CI) | 0.0 [0.0, 0.0] | |
| 9.3 Mixed | 11 | Odds Ratio (M‐H, Fixed, 95% CI) | 0.0 [0.0, 0.0] | |
| 9.4 Unclear | 4 | Odds Ratio (M‐H, Fixed, 95% CI) | 0.0 [0.0, 0.0] | |
| 10 Serious adverse events ‐ according to specific ethnicities Show forest plot | 101 | Odds Ratio (M‐H, Fixed, 95% CI) | Totals not selected | |
| 10.1 White | 0 | Odds Ratio (M‐H, Fixed, 95% CI) | 0.0 [0.0, 0.0] | |
| 10.2 Black | 0 | Odds Ratio (M‐H, Fixed, 95% CI) | 0.0 [0.0, 0.0] | |
| 10.3 Hispanic | 0 | Odds Ratio (M‐H, Fixed, 95% CI) | 0.0 [0.0, 0.0] | |
| 10.4 Mixed | 101 | Odds Ratio (M‐H, Fixed, 95% CI) | 0.0 [0.0, 0.0] | |
| 10.5 Unclear | 0 | Odds Ratio (M‐H, Fixed, 95% CI) | 0.0 [0.0, 0.0] | |
| 11 Serious adverse events ‐ according to reaching planned sample size Show forest plot | 101 | Odds Ratio (M‐H, Fixed, 95% CI) | Totals not selected | |
| 11.1 Trials reaching planned sample size | 15 | Odds Ratio (M‐H, Fixed, 95% CI) | 0.0 [0.0, 0.0] | |
| 11.2 Trials not reaching planned sample size | 3 | Odds Ratio (M‐H, Fixed, 95% CI) | 0.0 [0.0, 0.0] | |
| 11.3 Unclear | 83 | Odds Ratio (M‐H, Fixed, 95% CI) | 0.0 [0.0, 0.0] | |
| 12 Serious adverse events ‐ according to prior treatment Show forest plot | 101 | Odds Ratio (M‐H, Fixed, 95% CI) | Totals not selected | |
| 12.1 Treatment‐naive | 72 | Odds Ratio (M‐H, Fixed, 95% CI) | 0.0 [0.0, 0.0] | |
| 12.2 Treatment‐experienced | 19 | Odds Ratio (M‐H, Fixed, 95% CI) | 0.0 [0.0, 0.0] | |
| 12.3 Mixed | 9 | Odds Ratio (M‐H, Fixed, 95% CI) | 0.0 [0.0, 0.0] | |
| 12.4 Unclear | 1 | Odds Ratio (M‐H, Fixed, 95% CI) | 0.0 [0.0, 0.0] | |
| 13 Serious adverse events ‐ according to interferon Show forest plot | 101 | Odds Ratio (M‐H, Fixed, 95% CI) | Totals not selected | |
| 13.1 Trials where both groups received interferon | 69 | Odds Ratio (M‐H, Fixed, 95% CI) | 0.0 [0.0, 0.0] | |
| 13.2 Trials where neither group received interferon | 29 | Odds Ratio (M‐H, Fixed, 95% CI) | 0.0 [0.0, 0.0] | |
| 13.3 Unclear | 3 | Odds Ratio (M‐H, Fixed, 95% CI) | 0.0 [0.0, 0.0] | |
| 14 Serious adverse events ‐ according to ribavirin Show forest plot | 101 | Odds Ratio (M‐H, Fixed, 95% CI) | Totals not selected | |
| 14.1 Trials where both groups received ribavirin | 73 | Odds Ratio (M‐H, Fixed, 95% CI) | 0.0 [0.0, 0.0] | |
| 14.2 Trials where neither group received ribavirin | 27 | Odds Ratio (M‐H, Fixed, 95% CI) | 0.0 [0.0, 0.0] | |
| 14.3 Unclear | 1 | Odds Ratio (M‐H, Fixed, 95% CI) | 0.0 [0.0, 0.0] | |
| 15 Serious adverse events ‐ according to chronic kidney disease Show forest plot | 101 | Odds Ratio (M‐H, Fixed, 95% CI) | Totals not selected | |
| 15.1 With chronic kidney disease | 0 | Odds Ratio (M‐H, Fixed, 95% CI) | 0.0 [0.0, 0.0] | |
| 15.2 Without chronic kidney disease | 0 | Odds Ratio (M‐H, Fixed, 95% CI) | 0.0 [0.0, 0.0] | |
| 15.3 Unclear | 101 | Odds Ratio (M‐H, Fixed, 95% CI) | 0.0 [0.0, 0.0] | |
| 16 Serious adverse events ‐ according to cryoglobulinaemia Show forest plot | 101 | Odds Ratio (M‐H, Fixed, 95% CI) | Totals not selected | |
| 16.1 With cryoglobulinaemia | 0 | Odds Ratio (M‐H, Fixed, 95% CI) | 0.0 [0.0, 0.0] | |
| 16.2 Without cryoglobulinaemia | 0 | Odds Ratio (M‐H, Fixed, 95% CI) | 0.0 [0.0, 0.0] | |
| 16.3 Unclear | 101 | Odds Ratio (M‐H, Fixed, 95% CI) | 0.0 [0.0, 0.0] | |
| 17 Serious adverse events ‐ according to DAA group as co‐intervention Show forest plot | 101 | Odds Ratio (M‐H, Fixed, 95% CI) | Totals not selected | |
| 17.1 Trials where DAA were used as co‐intervention | 2 | Odds Ratio (M‐H, Fixed, 95% CI) | 0.0 [0.0, 0.0] | |
| 17.2 Trials where DAA were not a co‐intervention | 99 | Odds Ratio (M‐H, Fixed, 95% CI) | 0.0 [0.0, 0.0] | |
| 18 Serious adverse events ‐ according to median dose Show forest plot | 101 | Odds Ratio (M‐H, Fixed, 95% CI) | Totals not selected | |
| 18.1 Over or equal to median dose | 58 | Odds Ratio (M‐H, Fixed, 95% CI) | 0.0 [0.0, 0.0] | |
| 18.2 Under median dose | 37 | Odds Ratio (M‐H, Fixed, 95% CI) | 0.0 [0.0, 0.0] | |
| 18.3 Not available | 6 | Odds Ratio (M‐H, Fixed, 95% CI) | 0.0 [0.0, 0.0] | |
| Outcome or subgroup title | No. of studies | No. of participants | Statistical method | Effect size |
| 1 Without sustained virological response Show forest plot | 61 | 7115 | Risk Ratio (M‐H, Random, 95% CI) | 0.44 [0.37, 0.52] |
| 2 Without sustained virological response ‐ bias risk Show forest plot | 61 | 7115 | Odds Ratio (M‐H, Fixed, 95% CI) | 0.24 [0.22, 0.27] |
| 2.1 Trials at high risk of bias | 61 | 7115 | Odds Ratio (M‐H, Fixed, 95% CI) | 0.24 [0.22, 0.27] |
| 2.2 Trials at low risk of bias | 0 | 0 | Odds Ratio (M‐H, Fixed, 95% CI) | 0.0 [0.0, 0.0] |
| 3 Without sustained virological response ‐ according to type of DAA Show forest plot | 61 | 7115 | Risk Ratio (M‐H, Random, 95% CI) | 0.44 [0.37, 0.52] |
| 3.1 ABT‐072 | 0 | 0 | Risk Ratio (M‐H, Random, 95% CI) | 0.0 [0.0, 0.0] |
| 3.2 ACH‐2684 | 0 | 0 | Risk Ratio (M‐H, Random, 95% CI) | 0.0 [0.0, 0.0] |
| 3.3 Alisporivir | 0 | 0 | Risk Ratio (M‐H, Random, 95% CI) | 0.0 [0.0, 0.0] |
| 3.4 ALS‐2200 | 0 | 0 | Risk Ratio (M‐H, Random, 95% CI) | 0.0 [0.0, 0.0] |
| 3.5 Asunaprevir | 4 | 285 | Risk Ratio (M‐H, Random, 95% CI) | 0.49 [0.29, 0.85] |
| 3.6 Balapiravir | 0 | 0 | Risk Ratio (M‐H, Random, 95% CI) | 0.0 [0.0, 0.0] |
| 3.7 Beclabuvir | 2 | 39 | Risk Ratio (M‐H, Random, 95% CI) | 0.78 [0.43, 1.40] |
| 3.8 BILB‐1941 | 0 | 0 | Risk Ratio (M‐H, Random, 95% CI) | 0.0 [0.0, 0.0] |
| 3.9 BIT‐225 | 1 | 23 | Risk Ratio (M‐H, Random, 95% CI) | 0.27 [0.03, 2.51] |
| 3.10 Boceprevir | 1 | 229 | Risk Ratio (M‐H, Random, 95% CI) | 0.42 [0.29, 0.61] |
| 3.11 Ciluprevir | 0 | 0 | Risk Ratio (M‐H, Random, 95% CI) | 0.0 [0.0, 0.0] |
| 3.12 Daclatasvir | 7 | 619 | Risk Ratio (M‐H, Random, 95% CI) | 0.60 [0.50, 0.73] |
| 3.13 Danoprevir | 5 | 642 | Risk Ratio (M‐H, Random, 95% CI) | 0.38 [0.28, 0.51] |
| 3.14 Dasabuvir | 0 | 0 | Risk Ratio (M‐H, Random, 95% CI) | 0.0 [0.0, 0.0] |
| 3.15 Deleobuvir | 0 | 0 | Risk Ratio (M‐H, Random, 95% CI) | 0.0 [0.0, 0.0] |
| 3.16 Faldaprevir | 0 | 0 | Risk Ratio (M‐H, Random, 95% CI) | 0.0 [0.0, 0.0] |
| 3.17 Filibuvir | 0 | 0 | Risk Ratio (M‐H, Random, 95% CI) | 0.0 [0.0, 0.0] |
| 3.18 Grazoprevir | 0 | 0 | Risk Ratio (M‐H, Random, 95% CI) | 0.0 [0.0, 0.0] |
| 3.19 GS‐6620 | 0 | 0 | Risk Ratio (M‐H, Random, 95% CI) | 0.0 [0.0, 0.0] |
| 3.20 GS‐9256 | 0 | 0 | Risk Ratio (M‐H, Random, 95% CI) | 0.0 [0.0, 0.0] |
| 3.21 GS‐9451 | 1 | 329 | Risk Ratio (M‐H, Random, 95% CI) | 0.42 [0.26, 0.67] |
| 3.22 GS‐9669 | 0 | 0 | Risk Ratio (M‐H, Random, 95% CI) | 0.0 [0.0, 0.0] |
| 3.23 GS‐9851 | 0 | 0 | Risk Ratio (M‐H, Random, 95% CI) | 0.0 [0.0, 0.0] |
| 3.24 GS‐9857 | 0 | 0 | Risk Ratio (M‐H, Random, 95% CI) | 0.0 [0.0, 0.0] |
| 3.25 GSK2336805 | 0 | 0 | Risk Ratio (M‐H, Random, 95% CI) | 0.0 [0.0, 0.0] |
| 3.26 GSK2878175 | 0 | 0 | Risk Ratio (M‐H, Random, 95% CI) | 0.0 [0.0, 0.0] |
| 3.27 IDX‐184 | 0 | 0 | Risk Ratio (M‐H, Random, 95% CI) | 0.0 [0.0, 0.0] |
| 3.28 INX‐08189 | 0 | 0 | Risk Ratio (M‐H, Random, 95% CI) | 0.0 [0.0, 0.0] |
| 3.29 Ledispasvir | 0 | 0 | Risk Ratio (M‐H, Random, 95% CI) | 0.0 [0.0, 0.0] |
| 3.30 Mericitabine | 4 | 725 | Risk Ratio (M‐H, Random, 95% CI) | 0.78 [0.49, 1.27] |
| 3.31 Narlaprevir | 2 | 40 | Risk Ratio (M‐H, Random, 95% CI) | 0.69 [0.43, 1.09] |
| 3.32 Nesbuvir | 0 | 0 | Risk Ratio (M‐H, Random, 95% CI) | 0.0 [0.0, 0.0] |
| 3.33 Odalasavir | 0 | 0 | Risk Ratio (M‐H, Random, 95% CI) | 0.0 [0.0, 0.0] |
| 3.34 Ombitasvir | 1 | 37 | Risk Ratio (M‐H, Random, 95% CI) | 0.64 [0.39, 1.07] |
| 3.35 Paritaprevir | 0 | 0 | Risk Ratio (M‐H, Random, 95% CI) | 0.0 [0.0, 0.0] |
| 3.36 PHX1766 | 0 | 0 | Risk Ratio (M‐H, Random, 95% CI) | 0.0 [0.0, 0.0] |
| 3.37 PPI‐461 | 0 | 0 | Risk Ratio (M‐H, Random, 95% CI) | 0.0 [0.0, 0.0] |
| 3.38 PSI‐352938 | 0 | 0 | Risk Ratio (M‐H, Random, 95% CI) | 0.0 [0.0, 0.0] |
| 3.39 Samatasvir | 0 | 0 | Risk Ratio (M‐H, Random, 95% CI) | 0.0 [0.0, 0.0] |
| 3.40 Setrobuvir | 0 | 0 | Risk Ratio (M‐H, Random, 95% CI) | 0.0 [0.0, 0.0] |
| 3.41 Simeprevir | 19 | 2898 | Risk Ratio (M‐H, Random, 95% CI) | 0.39 [0.33, 0.46] |
| 3.42 Sofosbuvir | 3 | 181 | Risk Ratio (M‐H, Random, 95% CI) | 0.34 [0.20, 0.58] |
| 3.43 Sovaprevir | 0 | 0 | Risk Ratio (M‐H, Random, 95% CI) | 0.0 [0.0, 0.0] |
| 3.44 Tegobuvir | 0 | 0 | Risk Ratio (M‐H, Random, 95% CI) | 0.0 [0.0, 0.0] |
| 3.45 Telaprevir | 0 | 0 | Risk Ratio (M‐H, Random, 95% CI) | 0.0 [0.0, 0.0] |
| 3.46 Valopicitabine | 0 | 0 | Risk Ratio (M‐H, Random, 95% CI) | 0.0 [0.0, 0.0] |
| 3.47 Vaniprevir | 9 | 333 | Risk Ratio (M‐H, Random, 95% CI) | 0.33 [0.25, 0.43] |
| 3.48 VCH‐759 | 0 | 0 | Risk Ratio (M‐H, Random, 95% CI) | 0.0 [0.0, 0.0] |
| 3.49 VCH‐916 | 0 | 0 | Risk Ratio (M‐H, Random, 95% CI) | 0.0 [0.0, 0.0] |
| 3.50 Velpatasvir | 0 | 0 | Risk Ratio (M‐H, Random, 95% CI) | 0.0 [0.0, 0.0] |
| 3.51 VX‐222 | 0 | 0 | Risk Ratio (M‐H, Random, 95% CI) | 0.0 [0.0, 0.0] |
| 3.52 Mixed | 2 | 735 | Risk Ratio (M‐H, Random, 95% CI) | 0.06 [0.00, 7.05] |
| 4 Without sustained virological response ‐ according to group of DAA Show forest plot | 61 | 7115 | Risk Ratio (M‐H, Random, 95% CI) | 0.44 [0.37, 0.52] |
| 4.1 Cyclophilin | 0 | 0 | Risk Ratio (M‐H, Random, 95% CI) | 0.0 [0.0, 0.0] |
| 4.2 NS3/NS4A inhibitors | 41 | 4756 | Risk Ratio (M‐H, Random, 95% CI) | 0.41 [0.36, 0.46] |
| 4.3 NS5B inhibitors (NPI) | 7 | 906 | Risk Ratio (M‐H, Random, 95% CI) | 0.57 [0.36, 0.90] |
| 4.4 NS5B inhibitors (NNPI) | 2 | 39 | Risk Ratio (M‐H, Random, 95% CI) | 0.78 [0.43, 1.40] |
| 4.5 NS5A inhibitors | 9 | 686 | Risk Ratio (M‐H, Random, 95% CI) | 0.59 [0.49, 0.69] |
| 4.6 VPU‐ion channel inhibitors | 1 | 23 | Risk Ratio (M‐H, Random, 95% CI) | 0.27 [0.03, 2.51] |
| 4.7 Mixed | 1 | 705 | Risk Ratio (M‐H, Random, 95% CI) | 0.01 [0.00, 0.02] |
| 5 Without sustained virological response ‐ according to HIV‐infection Show forest plot | 61 | 7115 | Risk Ratio (M‐H, Random, 95% CI) | 0.44 [0.37, 0.52] |
| 5.1 With HIV‐infection | 0 | 0 | Risk Ratio (M‐H, Random, 95% CI) | 0.0 [0.0, 0.0] |
| 5.2 Without HIV‐infection | 58 | 6726 | Risk Ratio (M‐H, Random, 95% CI) | 0.44 [0.37, 0.52] |
| 5.3 Mixed (with and without HIV‐infection) | 0 | 0 | Risk Ratio (M‐H, Random, 95% CI) | 0.0 [0.0, 0.0] |
| 5.4 Unclear | 3 | 389 | Risk Ratio (M‐H, Random, 95% CI) | 0.50 [0.35, 0.72] |
| 6 Without sustained virological response ‐ according to comorbidity Show forest plot | 61 | 7115 | Odds Ratio (M‐H, Fixed, 95% CI) | 0.24 [0.22, 0.27] |
| 6.1 With comorbidity | 0 | 0 | Odds Ratio (M‐H, Fixed, 95% CI) | 0.0 [0.0, 0.0] |
| 6.2 Without comorbidity | 61 | 7115 | Odds Ratio (M‐H, Fixed, 95% CI) | 0.24 [0.22, 0.27] |
| 6.3 Unclear | 0 | 0 | Odds Ratio (M‐H, Fixed, 95% CI) | 0.0 [0.0, 0.0] |
| 7 Without sustained virological response ‐ according to viral genotype Show forest plot | 58 | 7098 | Risk Ratio (M‐H, Random, 95% CI) | 0.43 [0.36, 0.51] |
| 7.1 Genotype 1 | 54 | 5984 | Risk Ratio (M‐H, Random, 95% CI) | 0.43 [0.37, 0.50] |
| 7.2 Genotype 2 | 3 | 185 | Risk Ratio (M‐H, Random, 95% CI) | 0.14 [0.01, 3.21] |
| 7.3 Genotype 3 | 2 | 80 | Risk Ratio (M‐H, Random, 95% CI) | 0.79 [0.43, 1.43] |
| 7.4 Genotype 4 | 5 | 226 | Risk Ratio (M‐H, Random, 95% CI) | 0.10 [0.02, 0.68] |
| 7.5 Genotype 6 | 1 | 49 | Risk Ratio (M‐H, Random, 95% CI) | 0.01 [0.00, 0.20] |
| 7.6 Mixed | 2 | 574 | Risk Ratio (M‐H, Random, 95% CI) | 0.92 [0.52, 1.62] |
| 8 Without sustained virological response ‐ according to human genotype (IL28b) Show forest plot | 58 | 6745 | Risk Ratio (M‐H, Random, 95% CI) | 0.46 [0.40, 0.54] |
| 8.1 IL28b (CC) | 25 | 1444 | Risk Ratio (M‐H, Random, 95% CI) | 0.42 [0.29, 0.61] |
| 8.2 IL28B (CT) | 10 | 1304 | Risk Ratio (M‐H, Random, 95% CI) | 0.52 [0.42, 0.66] |
| 8.3 IL28B (TT) | 10 | 359 | Risk Ratio (M‐H, Random, 95% CI) | 0.54 [0.44, 0.67] |
| 8.4 IL28B (CT + TT) | 14 | 1798 | Risk Ratio (M‐H, Random, 95% CI) | 0.37 [0.23, 0.57] |
| 8.5 Unclear | 7 | 147 | Risk Ratio (M‐H, Random, 95% CI) | 0.47 [0.33, 0.68] |
| 8.6 Mixed | 26 | 1693 | Risk Ratio (M‐H, Random, 95% CI) | 0.51 [0.40, 0.63] |
| 9 Without sustained virological response ‐ according to Asian‐region Show forest plot | 61 | 7115 | Risk Ratio (M‐H, Random, 95% CI) | 0.44 [0.37, 0.52] |
| 9.1 From Asian region | 10 | 1128 | Risk Ratio (M‐H, Random, 95% CI) | 0.34 [0.28, 0.42] |
| 9.2 Not from Asian region | 42 | 4910 | Risk Ratio (M‐H, Random, 95% CI) | 0.51 [0.43, 0.60] |
| 9.3 Mixed | 7 | 1010 | Risk Ratio (M‐H, Random, 95% CI) | 0.19 [0.03, 1.17] |
| 9.4 Unclear | 2 | 67 | Risk Ratio (M‐H, Random, 95% CI) | 0.53 [0.35, 0.79] |
| 10 Without sustained virological response ‐ according to specific ethnicities Show forest plot | 61 | 7115 | Odds Ratio (M‐H, Fixed, 95% CI) | 0.24 [0.22, 0.27] |
| 10.1 White | 2 | 412 | Odds Ratio (M‐H, Fixed, 95% CI) | 0.24 [0.15, 0.38] |
| 10.2 Black | 0 | 0 | Odds Ratio (M‐H, Fixed, 95% CI) | 0.0 [0.0, 0.0] |
| 10.3 Hispanic | 0 | 0 | Odds Ratio (M‐H, Fixed, 95% CI) | 0.0 [0.0, 0.0] |
| 10.4 Mixed | 48 | 5384 | Odds Ratio (M‐H, Fixed, 95% CI) | 0.23 [0.20, 0.27] |
| 10.5 Unclear | 9 | 862 | Odds Ratio (M‐H, Fixed, 95% CI) | 0.28 [0.20, 0.39] |
| 10.6 Asian | 2 | 457 | Odds Ratio (M‐H, Fixed, 95% CI) | 0.38 [0.23, 0.63] |
| 11 Without sustained virological response ‐ according to reaching planned sample size Show forest plot | 61 | 7115 | Odds Ratio (M‐H, Fixed, 95% CI) | 0.24 [0.22, 0.27] |
| 11.1 Trials reaching planned sample size | 13 | 3071 | Odds Ratio (M‐H, Fixed, 95% CI) | 0.21 [0.18, 0.25] |
| 11.2 Trials not reaching planned sample size | 0 | 0 | Odds Ratio (M‐H, Fixed, 95% CI) | 0.0 [0.0, 0.0] |
| 11.3 Unclear | 48 | 4044 | Odds Ratio (M‐H, Fixed, 95% CI) | 0.28 [0.23, 0.33] |
| 12 Without sustained virological response ‐ according to prior treatment Show forest plot | 61 | 7115 | Risk Ratio (M‐H, Random, 95% CI) | 0.44 [0.37, 0.52] |
| 12.1 Treatment‐naive | 44 | 4777 | Risk Ratio (M‐H, Random, 95% CI) | 0.48 [0.41, 0.56] |
| 12.2 Treatment‐experienced | 13 | 1274 | Risk Ratio (M‐H, Random, 95% CI) | 0.50 [0.36, 0.69] |
| 12.3 Mixed | 4 | 1064 | Risk Ratio (M‐H, Random, 95% CI) | 0.15 [0.02, 0.96] |
| 12.4 Unclear | 0 | 0 | Risk Ratio (M‐H, Random, 95% CI) | 0.0 [0.0, 0.0] |
| 13 Without sustained virological response ‐ according to interferon Show forest plot | 61 | 7115 | Risk Ratio (M‐H, Random, 95% CI) | 0.44 [0.37, 0.52] |
| 13.1 Trials where both groups received interferon | 57 | 6229 | Risk Ratio (M‐H, Random, 95% CI) | 0.47 [0.41, 0.54] |
| 13.2 Trials where neither group received interferon | 2 | 735 | Risk Ratio (M‐H, Random, 95% CI) | 0.06 [0.00, 7.05] |
| 13.3 Trials where only the experimental group received interferon | 0 | 0 | Risk Ratio (M‐H, Random, 95% CI) | 0.0 [0.0, 0.0] |
| 13.4 Trials where only the control group received interferon | 0 | 0 | Risk Ratio (M‐H, Random, 95% CI) | 0.0 [0.0, 0.0] |
| 13.5 Mixed | 2 | 151 | Risk Ratio (M‐H, Random, 95% CI) | 0.58 [0.15, 2.30] |
| 14 Without sustained virological response ‐ according to ribavirin Show forest plot | 61 | 7115 | Risk Ratio (M‐H, Random, 95% CI) | 0.44 [0.37, 0.52] |
| 14.1 Trials where both groups received ribavirin | 60 | 6410 | Risk Ratio (M‐H, Random, 95% CI) | 0.47 [0.41, 0.55] |
| 14.2 Trials where neither group received ribavirin | 1 | 705 | Risk Ratio (M‐H, Random, 95% CI) | 0.01 [0.00, 0.02] |
| 14.3 Trials where only the experimental group received ribavirin | 0 | 0 | Risk Ratio (M‐H, Random, 95% CI) | 0.0 [0.0, 0.0] |
| 14.4 Trials where only the control group received ribavirin | 0 | 0 | Risk Ratio (M‐H, Random, 95% CI) | 0.0 [0.0, 0.0] |
| 15 Without sustained virological response ‐ according to chronic kidney disease Show forest plot | 61 | 7115 | Odds Ratio (M‐H, Fixed, 95% CI) | 0.24 [0.22, 0.27] |
| 15.1 With chronic kidney disease | 0 | 0 | Odds Ratio (M‐H, Fixed, 95% CI) | 0.0 [0.0, 0.0] |
| 15.2 Without chronic kidney disease | 0 | 0 | Odds Ratio (M‐H, Fixed, 95% CI) | 0.0 [0.0, 0.0] |
| 15.3 Unclear | 61 | 7115 | Odds Ratio (M‐H, Fixed, 95% CI) | 0.24 [0.22, 0.27] |
| 16 Without sustained virological response ‐ according to cryoglobulinaemia Show forest plot | 61 | 7115 | Odds Ratio (M‐H, Fixed, 95% CI) | 0.24 [0.22, 0.27] |
| 16.1 With cryoglobulinaemia | 0 | 0 | Odds Ratio (M‐H, Fixed, 95% CI) | 0.0 [0.0, 0.0] |
| 16.2 Without cryoglobulinaemia | 0 | 0 | Odds Ratio (M‐H, Fixed, 95% CI) | 0.0 [0.0, 0.0] |
| 16.3 Unclear | 61 | 7115 | Odds Ratio (M‐H, Fixed, 95% CI) | 0.24 [0.22, 0.27] |
| 17 Without sustained virological response ‐ according to DAA group as co‐intervention Show forest plot | 61 | 7115 | Odds Ratio (M‐H, Fixed, 95% CI) | 0.24 [0.22, 0.27] |
| 17.1 Trials where DAA were used as co‐intervention | 3 | 480 | Odds Ratio (M‐H, Fixed, 95% CI) | 0.42 [0.27, 0.66] |
| 17.2 Trials where DAA were not a co‐intervention | 58 | 6635 | Odds Ratio (M‐H, Fixed, 95% CI) | 0.23 [0.21, 0.26] |
| 18 Without sustained virological response ‐ 'Best‐worst case' scenario Show forest plot | 61 | 7294 | Risk Ratio (M‐H, Random, 95% CI) | 0.41 [0.34, 0.49] |
| 19 Without sustained virological response ‐ 'Worst‐best case' scenario Show forest plot | 61 | 7294 | Risk Ratio (M‐H, Random, 95% CI) | 0.51 [0.43, 0.60] |
| 20 Without sustained virological response ‐ according to median dose Show forest plot | 61 | 7115 | Risk Ratio (M‐H, Random, 95% CI) | 0.44 [0.37, 0.52] |
| 20.1 Over or equal to median dose | 34 | 4154 | Risk Ratio (M‐H, Random, 95% CI) | 0.41 [0.32, 0.53] |
| 20.2 Under median dose | 23 | 2086 | Risk Ratio (M‐H, Random, 95% CI) | 0.46 [0.39, 0.55] |
| 20.3 Not available | 4 | 875 | Risk Ratio (M‐H, Random, 95% CI) | 0.62 [0.26, 1.47] |
| Outcome or subgroup title | No. of studies | No. of participants | Statistical method | Effect size |
| 1 Hepatitis C‐related morbidity or all‐cause mortality Show forest plot | 9 | 781 | Odds Ratio (M‐H, Fixed, 95% CI) | 0.56 [0.06, 5.19] |
| 2 Hepatitis C‐related morbidity or all‐cause mortality ‐ according to dose Show forest plot | 9 | 781 | Odds Ratio (M‐H, Fixed, 95% CI) | 0.56 [0.06, 5.19] |
| 2.1 Over or equal to median dose | 6 | 606 | Odds Ratio (M‐H, Fixed, 95% CI) | 0.56 [0.06, 5.19] |
| 2.2 Under median dose | 3 | 175 | Odds Ratio (M‐H, Fixed, 95% CI) | 0.0 [0.0, 0.0] |
| 2.3 Not available | 0 | 0 | Odds Ratio (M‐H, Fixed, 95% CI) | 0.0 [0.0, 0.0] |
| 3 Serious adverse events Show forest plot | 9 | Odds Ratio (M‐H, Fixed, 95% CI) | Totals not selected | |
| 4 Serious adverse events ‐ according to median dose Show forest plot | 9 | Odds Ratio (M‐H, Fixed, 95% CI) | Totals not selected | |
| 4.1 Over or equal to median dose | 6 | Odds Ratio (M‐H, Fixed, 95% CI) | 0.0 [0.0, 0.0] | |
| 4.2 Under median dose | 3 | Odds Ratio (M‐H, Fixed, 95% CI) | 0.0 [0.0, 0.0] | |
| 4.3 Not available | 0 | Odds Ratio (M‐H, Fixed, 95% CI) | 0.0 [0.0, 0.0] | |
| 5 Without sustained virological response Show forest plot | 5 | 642 | Odds Ratio (M‐H, Fixed, 95% CI) | 0.19 [0.12, 0.32] |
| 6 Without sustained virological response ‐ according to median dose Show forest plot | 5 | 642 | Odds Ratio (M‐H, Fixed, 95% CI) | 0.19 [0.12, 0.32] |
| 6.1 Over or equal to median dose | 4 | 537 | Odds Ratio (M‐H, Fixed, 95% CI) | 0.18 [0.11, 0.32] |
| 6.2 Under median dose | 1 | 105 | Odds Ratio (M‐H, Fixed, 95% CI) | 0.27 [0.07, 0.99] |
| 6.3 Not available | 0 | 0 | Odds Ratio (M‐H, Fixed, 95% CI) | 0.0 [0.0, 0.0] |
| Outcome or subgroup title | No. of studies | No. of participants | Statistical method | Effect size |
| 1 Hepatitis C‐related morbidity or all‐cause mortality Show forest plot | 95 | Odds Ratio (M‐H, Fixed, 95% CI) | Totals not selected | |
| 1.1 Trials assessing DAAs on or on the way to the market | 71 | Odds Ratio (M‐H, Fixed, 95% CI) | 0.0 [0.0, 0.0] | |
| 1.2 Trials assessing DAAs withdrawn from market | 22 | Odds Ratio (M‐H, Fixed, 95% CI) | 0.0 [0.0, 0.0] | |
| 1.3 Trials using other medical intervention as control group | 3 | Odds Ratio (M‐H, Fixed, 95% CI) | 0.0 [0.0, 0.0] | |
| 1.4 Trials using other medical intervention as experimental group | 1 | Odds Ratio (M‐H, Fixed, 95% CI) | 0.0 [0.0, 0.0] | |
| 2 Hepatitis C‐related morbidity or all‐cause mortality ‐ drugs not discontinued | 0 | 0 | Odds Ratio (M‐H, Fixed, 95% CI) | 0.0 [0.0, 0.0] |
| 2.1 Trials assessing discontinued drugs | 0 | 0 | Odds Ratio (M‐H, Fixed, 95% CI) | 0.0 [0.0, 0.0] |
| 2.2 Trials assessing drugs still used | 0 | 0 | Odds Ratio (M‐H, Fixed, 95% CI) | 0.0 [0.0, 0.0] |
| 3 Hepatitis C‐related morbidity or all‐cause mortality ‐ bias risk | 0 | 0 | Odds Ratio (M‐H, Fixed, 95% CI) | 0.0 [0.0, 0.0] |
| 3.1 Trials with a high risk of bias | 0 | 0 | Odds Ratio (M‐H, Fixed, 95% CI) | 0.0 [0.0, 0.0] |
| 3.2 Trials with a low risk of bias | 0 | 0 | Odds Ratio (M‐H, Fixed, 95% CI) | 0.0 [0.0, 0.0] |
| 4 Hepatitis C‐related morbidity or all‐cause mortality ‐ according to type of DAA | 0 | 0 | Odds Ratio (M‐H, Fixed, 95% CI) | 0.0 [0.0, 0.0] |
| 4.1 ABT‐072 | 0 | 0 | Odds Ratio (M‐H, Fixed, 95% CI) | 0.0 [0.0, 0.0] |
| 4.2 ACH‐2684 | 0 | 0 | Odds Ratio (M‐H, Fixed, 95% CI) | 0.0 [0.0, 0.0] |
| 4.3 Alisporivir | 0 | 0 | Odds Ratio (M‐H, Fixed, 95% CI) | 0.0 [0.0, 0.0] |
| 4.4 ALS‐2200 | 0 | 0 | Odds Ratio (M‐H, Fixed, 95% CI) | 0.0 [0.0, 0.0] |
| 4.5 Asunaprevir | 0 | 0 | Odds Ratio (M‐H, Fixed, 95% CI) | 0.0 [0.0, 0.0] |
| 4.6 Balapiravir | 0 | 0 | Odds Ratio (M‐H, Fixed, 95% CI) | 0.0 [0.0, 0.0] |
| 4.7 Beclabuvir | 0 | 0 | Odds Ratio (M‐H, Fixed, 95% CI) | 0.0 [0.0, 0.0] |
| 4.8 BILB‐1941 | 0 | 0 | Odds Ratio (M‐H, Fixed, 95% CI) | 0.0 [0.0, 0.0] |
| 4.9 BIT‐225 | 0 | 0 | Odds Ratio (M‐H, Fixed, 95% CI) | 0.0 [0.0, 0.0] |
| 4.10 Boceprevir | 0 | 0 | Odds Ratio (M‐H, Fixed, 95% CI) | 0.0 [0.0, 0.0] |
| 4.11 Ciluprevir | 0 | 0 | Odds Ratio (M‐H, Fixed, 95% CI) | 0.0 [0.0, 0.0] |
| 4.12 Daclatasvir | 0 | 0 | Odds Ratio (M‐H, Fixed, 95% CI) | 0.0 [0.0, 0.0] |
| 4.13 Danoprevir | 0 | 0 | Odds Ratio (M‐H, Fixed, 95% CI) | 0.0 [0.0, 0.0] |
| 4.14 Dasabuvir | 0 | 0 | Odds Ratio (M‐H, Fixed, 95% CI) | 0.0 [0.0, 0.0] |
| 4.15 Deleobuvir | 0 | 0 | Odds Ratio (M‐H, Fixed, 95% CI) | 0.0 [0.0, 0.0] |
| 4.16 Faldaprevir | 0 | 0 | Odds Ratio (M‐H, Fixed, 95% CI) | 0.0 [0.0, 0.0] |
| 4.17 Filibuvir | 0 | 0 | Odds Ratio (M‐H, Fixed, 95% CI) | 0.0 [0.0, 0.0] |
| 4.18 Grazoprevir | 0 | 0 | Odds Ratio (M‐H, Fixed, 95% CI) | 0.0 [0.0, 0.0] |
| 4.19 GS‐6620 | 0 | 0 | Odds Ratio (M‐H, Fixed, 95% CI) | 0.0 [0.0, 0.0] |
| 4.20 GS‐9256 | 0 | 0 | Odds Ratio (M‐H, Fixed, 95% CI) | 0.0 [0.0, 0.0] |
| 4.21 GS‐9451 | 0 | 0 | Odds Ratio (M‐H, Fixed, 95% CI) | 0.0 [0.0, 0.0] |
| 4.22 GS‐9669 | 0 | 0 | Odds Ratio (M‐H, Fixed, 95% CI) | 0.0 [0.0, 0.0] |
| 4.23 GS‐9851 | 0 | 0 | Odds Ratio (M‐H, Fixed, 95% CI) | 0.0 [0.0, 0.0] |
| 4.24 GS‐9857 | 0 | 0 | Odds Ratio (M‐H, Fixed, 95% CI) | 0.0 [0.0, 0.0] |
| 4.25 GSK2336805 | 0 | 0 | Odds Ratio (M‐H, Fixed, 95% CI) | 0.0 [0.0, 0.0] |
| 4.26 GSK2878175 | 0 | 0 | Odds Ratio (M‐H, Fixed, 95% CI) | 0.0 [0.0, 0.0] |
| 4.27 IDX‐184 | 0 | 0 | Odds Ratio (M‐H, Fixed, 95% CI) | 0.0 [0.0, 0.0] |
| 4.28 INX‐08189 | 0 | 0 | Odds Ratio (M‐H, Fixed, 95% CI) | 0.0 [0.0, 0.0] |
| 4.29 Ledispasvir | 0 | 0 | Odds Ratio (M‐H, Fixed, 95% CI) | 0.0 [0.0, 0.0] |
| 4.30 Mericitabine | 0 | 0 | Odds Ratio (M‐H, Fixed, 95% CI) | 0.0 [0.0, 0.0] |
| 4.31 Narlaprevir | 0 | 0 | Odds Ratio (M‐H, Fixed, 95% CI) | 0.0 [0.0, 0.0] |
| 4.32 Nesbuvir | 0 | 0 | Odds Ratio (M‐H, Fixed, 95% CI) | 0.0 [0.0, 0.0] |
| 4.33 Odalasavir | 0 | 0 | Odds Ratio (M‐H, Fixed, 95% CI) | 0.0 [0.0, 0.0] |
| 4.34 Ombitasvir | 0 | 0 | Odds Ratio (M‐H, Fixed, 95% CI) | 0.0 [0.0, 0.0] |
| 4.35 Paritaprevir | 0 | 0 | Odds Ratio (M‐H, Fixed, 95% CI) | 0.0 [0.0, 0.0] |
| 4.36 PHX1766 | 0 | 0 | Odds Ratio (M‐H, Fixed, 95% CI) | 0.0 [0.0, 0.0] |
| 4.37 PPI‐461 | 0 | 0 | Odds Ratio (M‐H, Fixed, 95% CI) | 0.0 [0.0, 0.0] |
| 4.38 PSI‐352938 | 0 | 0 | Odds Ratio (M‐H, Fixed, 95% CI) | 0.0 [0.0, 0.0] |
| 4.39 Samatasvir | 0 | 0 | Odds Ratio (M‐H, Fixed, 95% CI) | 0.0 [0.0, 0.0] |
| 4.40 Setrobuvir | 0 | 0 | Odds Ratio (M‐H, Fixed, 95% CI) | 0.0 [0.0, 0.0] |
| 4.41 Simeprevir | 0 | 0 | Odds Ratio (M‐H, Fixed, 95% CI) | 0.0 [0.0, 0.0] |
| 4.42 Sofosbuvir | 0 | 0 | Odds Ratio (M‐H, Fixed, 95% CI) | 0.0 [0.0, 0.0] |
| 4.43 Sovaprevir | 0 | 0 | Odds Ratio (M‐H, Fixed, 95% CI) | 0.0 [0.0, 0.0] |
| 4.44 Tegobuvir | 0 | 0 | Odds Ratio (M‐H, Fixed, 95% CI) | 0.0 [0.0, 0.0] |
| 4.45 Telaprevir | 0 | 0 | Odds Ratio (M‐H, Fixed, 95% CI) | 0.0 [0.0, 0.0] |
| 4.46 Valopicitabine | 0 | 0 | Odds Ratio (M‐H, Fixed, 95% CI) | 0.0 [0.0, 0.0] |
| 4.47 Vaniprevir | 0 | 0 | Odds Ratio (M‐H, Fixed, 95% CI) | 0.0 [0.0, 0.0] |
| 4.48 VCH‐759 | 0 | 0 | Odds Ratio (M‐H, Fixed, 95% CI) | 0.0 [0.0, 0.0] |
| 4.49 VCH‐916 | 0 | 0 | Odds Ratio (M‐H, Fixed, 95% CI) | 0.0 [0.0, 0.0] |
| 4.50 Velpatasvir | 0 | 0 | Odds Ratio (M‐H, Fixed, 95% CI) | 0.0 [0.0, 0.0] |
| 4.51 VX‐222 | 0 | 0 | Odds Ratio (M‐H, Fixed, 95% CI) | 0.0 [0.0, 0.0] |
| 4.52 Mixed | 0 | 0 | Odds Ratio (M‐H, Fixed, 95% CI) | 0.0 [0.0, 0.0] |
| 5 Hepatitis C‐related morbidity or all‐cause mortality ‐ according to group of DAA | 0 | 0 | Odds Ratio (M‐H, Fixed, 95% CI) | 0.0 [0.0, 0.0] |
| 5.1 Cyclophilin | 0 | 0 | Odds Ratio (M‐H, Fixed, 95% CI) | 0.0 [0.0, 0.0] |
| 5.2 NS3/NS4A inhibitors | 0 | 0 | Odds Ratio (M‐H, Fixed, 95% CI) | 0.0 [0.0, 0.0] |
| 5.3 NS5B inhibitors (NPI) | 0 | 0 | Odds Ratio (M‐H, Fixed, 95% CI) | 0.0 [0.0, 0.0] |
| 5.4 NS5B inhibitors (NNPI) | 0 | 0 | Odds Ratio (M‐H, Fixed, 95% CI) | 0.0 [0.0, 0.0] |
| 5.5 NS5A inhibitors | 0 | 0 | Odds Ratio (M‐H, Fixed, 95% CI) | 0.0 [0.0, 0.0] |
| 5.6 VPU‐ion channel inhibitors | 0 | 0 | Odds Ratio (M‐H, Fixed, 95% CI) | 0.0 [0.0, 0.0] |
| 5.7 Mixed | 0 | 0 | Odds Ratio (M‐H, Fixed, 95% CI) | 0.0 [0.0, 0.0] |
| 6 Hepatitis C‐related morbidity or all‐cause mortality ‐ according to HIV‐infection | 0 | 0 | Odds Ratio (M‐H, Fixed, 95% CI) | 0.0 [0.0, 0.0] |
| 6.1 With HIV‐infection | 0 | 0 | Odds Ratio (M‐H, Fixed, 95% CI) | 0.0 [0.0, 0.0] |
| 6.2 Without HIV‐infection | 0 | 0 | Odds Ratio (M‐H, Fixed, 95% CI) | 0.0 [0.0, 0.0] |
| 6.3 Mixed (with and without HIV‐infection) | 0 | 0 | Odds Ratio (M‐H, Fixed, 95% CI) | 0.0 [0.0, 0.0] |
| 6.4 Unclear | 0 | 0 | Odds Ratio (M‐H, Fixed, 95% CI) | 0.0 [0.0, 0.0] |
| 7 Hepatitis C‐related morbidity or all‐cause mortality ‐ according to comorbidity | 0 | 0 | Odds Ratio (M‐H, Fixed, 95% CI) | 0.0 [0.0, 0.0] |
| 7.1 With comorbidity | 0 | 0 | Odds Ratio (M‐H, Fixed, 95% CI) | 0.0 [0.0, 0.0] |
| 7.2 Without comorbidity | 0 | 0 | Odds Ratio (M‐H, Fixed, 95% CI) | 0.0 [0.0, 0.0] |
| 7.3 Unclear | 0 | 0 | Odds Ratio (M‐H, Fixed, 95% CI) | 0.0 [0.0, 0.0] |
| 8 Hepatitis C‐related morbidity or all‐cause mortality ‐ according to viral genotype | 0 | 0 | Odds Ratio (M‐H, Fixed, 95% CI) | 0.0 [0.0, 0.0] |
| 8.1 Genotype 1 | 0 | 0 | Odds Ratio (M‐H, Fixed, 95% CI) | 0.0 [0.0, 0.0] |
| 8.2 Genotype 2 | 0 | 0 | Odds Ratio (M‐H, Fixed, 95% CI) | 0.0 [0.0, 0.0] |
| 8.3 Genotype 3 | 0 | 0 | Odds Ratio (M‐H, Fixed, 95% CI) | 0.0 [0.0, 0.0] |
| 8.4 Genotype 4 | 0 | 0 | Odds Ratio (M‐H, Fixed, 95% CI) | 0.0 [0.0, 0.0] |
| 8.5 Unclear | 0 | 0 | Odds Ratio (M‐H, Fixed, 95% CI) | 0.0 [0.0, 0.0] |
| 9 Hepatitis C‐related morbidity or all‐cause mortality ‐ according to human genotype (IL28b) | 0 | 0 | Odds Ratio (M‐H, Fixed, 95% CI) | 0.0 [0.0, 0.0] |
| 9.1 IL28b (CC) | 0 | 0 | Odds Ratio (M‐H, Fixed, 95% CI) | 0.0 [0.0, 0.0] |
| 9.2 IL28B (CT) | 0 | 0 | Odds Ratio (M‐H, Fixed, 95% CI) | 0.0 [0.0, 0.0] |
| 9.3 IL28B (TT) | 0 | 0 | Odds Ratio (M‐H, Fixed, 95% CI) | 0.0 [0.0, 0.0] |
| 9.4 IL28B (CT + TT) | 0 | 0 | Odds Ratio (M‐H, Fixed, 95% CI) | 0.0 [0.0, 0.0] |
| 9.5 Unclear | 0 | 0 | Odds Ratio (M‐H, Fixed, 95% CI) | 0.0 [0.0, 0.0] |
| 10 Hepatitis C‐related morbidity or all‐cause mortality ‐ according to Asian‐region | 0 | 0 | Odds Ratio (M‐H, Fixed, 95% CI) | 0.0 [0.0, 0.0] |
| 10.1 From Asian region | 0 | 0 | Odds Ratio (M‐H, Fixed, 95% CI) | 0.0 [0.0, 0.0] |
| 10.2 Not from Asian region | 0 | 0 | Odds Ratio (M‐H, Fixed, 95% CI) | 0.0 [0.0, 0.0] |
| 10.3 Mixed | 0 | 0 | Odds Ratio (M‐H, Fixed, 95% CI) | 0.0 [0.0, 0.0] |
| 10.4 Unclear | 0 | 0 | Odds Ratio (M‐H, Fixed, 95% CI) | 0.0 [0.0, 0.0] |
| 11 Hepatitis C‐related morbidity or all‐cause mortality ‐ according to specific ethnicities | 0 | 0 | Odds Ratio (M‐H, Fixed, 95% CI) | 0.0 [0.0, 0.0] |
| 11.1 White | 0 | 0 | Odds Ratio (M‐H, Fixed, 95% CI) | 0.0 [0.0, 0.0] |
| 11.2 Black | 0 | 0 | Odds Ratio (M‐H, Fixed, 95% CI) | 0.0 [0.0, 0.0] |
| 11.3 Hispanic | 0 | 0 | Odds Ratio (M‐H, Fixed, 95% CI) | 0.0 [0.0, 0.0] |
| 11.4 Mixed | 0 | 0 | Odds Ratio (M‐H, Fixed, 95% CI) | 0.0 [0.0, 0.0] |
| 11.5 Unclear | 0 | 0 | Odds Ratio (M‐H, Fixed, 95% CI) | 0.0 [0.0, 0.0] |
| 12 Hepatitis C‐related morbidity or all‐cause mortality ‐ according to reaching planned sample size | 0 | 0 | Odds Ratio (M‐H, Fixed, 95% CI) | 0.0 [0.0, 0.0] |
| 12.1 Trials reaching planned sample size | 0 | 0 | Odds Ratio (M‐H, Fixed, 95% CI) | 0.0 [0.0, 0.0] |
| 12.2 Trials not reaching planned sample size | 0 | 0 | Odds Ratio (M‐H, Fixed, 95% CI) | 0.0 [0.0, 0.0] |
| 12.3 Unclear | 0 | 0 | Odds Ratio (M‐H, Fixed, 95% CI) | 0.0 [0.0, 0.0] |
| 13 Hepatitis C‐related morbidity or all‐cause mortality ‐ according to prior treatment | 0 | 0 | Odds Ratio (M‐H, Fixed, 95% CI) | 0.0 [0.0, 0.0] |
| 13.1 Treatment‐naive | 0 | 0 | Odds Ratio (M‐H, Fixed, 95% CI) | 0.0 [0.0, 0.0] |
| 13.2 Treatment‐experienced | 0 | 0 | Odds Ratio (M‐H, Fixed, 95% CI) | 0.0 [0.0, 0.0] |
| 13.3 Mixed | 0 | 0 | Odds Ratio (M‐H, Fixed, 95% CI) | 0.0 [0.0, 0.0] |
| 13.4 Unclear | 0 | 0 | Odds Ratio (M‐H, Fixed, 95% CI) | 0.0 [0.0, 0.0] |
| 14 Hepatitis C‐related morbidity or all‐cause mortality ‐ according to interferon | 0 | 0 | Odds Ratio (M‐H, Fixed, 95% CI) | 0.0 [0.0, 0.0] |
| 14.1 Trials where both groups received interferon | 0 | 0 | Odds Ratio (M‐H, Fixed, 95% CI) | 0.0 [0.0, 0.0] |
| 14.2 Trials where neither group received interferon | 0 | 0 | Odds Ratio (M‐H, Fixed, 95% CI) | 0.0 [0.0, 0.0] |
| 14.3 Trials where only the experimental group received interferon | 0 | 0 | Odds Ratio (M‐H, Fixed, 95% CI) | 0.0 [0.0, 0.0] |
| 14.4 Trials where only the control group received interferon | 0 | 0 | Odds Ratio (M‐H, Fixed, 95% CI) | 0.0 [0.0, 0.0] |
| 15 Hepatitis C‐related morbidity or all‐cause mortality ‐ according to ribavirin | 0 | 0 | Odds Ratio (M‐H, Fixed, 95% CI) | 0.0 [0.0, 0.0] |
| 15.1 Trials where both groups received ribavirin | 0 | 0 | Odds Ratio (M‐H, Fixed, 95% CI) | 0.0 [0.0, 0.0] |
| 15.2 Trials where neither group received ribavirin | 0 | 0 | Odds Ratio (M‐H, Fixed, 95% CI) | 0.0 [0.0, 0.0] |
| 15.3 Trials where only the experimental group received ribavirin | 0 | 0 | Odds Ratio (M‐H, Fixed, 95% CI) | 0.0 [0.0, 0.0] |
| 15.4 Trials where only the control group received ribavirin | 0 | 0 | Odds Ratio (M‐H, Fixed, 95% CI) | 0.0 [0.0, 0.0] |
| 16 Hepatitis C‐related morbidity or all‐cause mortality ‐ according to chronic kidney disease | 0 | 0 | Odds Ratio (M‐H, Fixed, 95% CI) | 0.0 [0.0, 0.0] |
| 16.1 With chronic kidney disease | 0 | 0 | Odds Ratio (M‐H, Fixed, 95% CI) | 0.0 [0.0, 0.0] |
| 16.2 Without chronic kidney disease | 0 | 0 | Odds Ratio (M‐H, Fixed, 95% CI) | 0.0 [0.0, 0.0] |
| 16.3 Unclear | 0 | 0 | Odds Ratio (M‐H, Fixed, 95% CI) | 0.0 [0.0, 0.0] |
| 17 Hepatitis C‐related morbidity or all‐cause mortality ‐ according to cryoglobulinaemia | 0 | 0 | Odds Ratio (M‐H, Fixed, 95% CI) | 0.0 [0.0, 0.0] |
| 17.1 With cryoglobulinaemia | 0 | 0 | Odds Ratio (M‐H, Fixed, 95% CI) | 0.0 [0.0, 0.0] |
| 17.2 Without cryoglobulinaemia | 0 | 0 | Odds Ratio (M‐H, Fixed, 95% CI) | 0.0 [0.0, 0.0] |
| 17.3 Unclear | 0 | 0 | Odds Ratio (M‐H, Fixed, 95% CI) | 0.0 [0.0, 0.0] |
| 18 Hepatitis C‐related morbidity or all‐cause mortality ‐ according to DAA group as co‐intervention | 0 | 0 | Odds Ratio (M‐H, Fixed, 95% CI) | 0.0 [0.0, 0.0] |
| 18.1 Trials where DAA were used as co‐intervention | 0 | 0 | Odds Ratio (M‐H, Fixed, 95% CI) | 0.0 [0.0, 0.0] |
| 18.2 Trials where DAA were not a co‐intervention | 0 | 0 | Odds Ratio (M‐H, Fixed, 95% CI) | 0.0 [0.0, 0.0] |
| Outcome or subgroup title | No. of studies | No. of participants | Statistical method | Effect size |
| 1 Serious adverse events Show forest plot | 167 | Odds Ratio (M‐H, Fixed, 95% CI) | Totals not selected | |
| 1.1 Trials assessing DAAs on or on the way to the market | 101 | Odds Ratio (M‐H, Fixed, 95% CI) | 0.0 [0.0, 0.0] | |
| 1.2 Trials assessing DAAs withdrawn from market | 62 | Odds Ratio (M‐H, Fixed, 95% CI) | 0.0 [0.0, 0.0] | |
| 1.3 Trials using other medical intervention as control group | 3 | Odds Ratio (M‐H, Fixed, 95% CI) | 0.0 [0.0, 0.0] | |
| 1.4 Trials using other medical intervention as experimental group | 1 | Odds Ratio (M‐H, Fixed, 95% CI) | 0.0 [0.0, 0.0] | |
| 2 Serious adverse events ‐ bias risk Show forest plot | 167 | Odds Ratio (M‐H, Fixed, 95% CI) | Totals not selected | |
| 2.1 Trials with a high risk of bias | 167 | Odds Ratio (M‐H, Fixed, 95% CI) | 0.0 [0.0, 0.0] | |
| 2.2 Trials with a low risk of bias | 0 | Odds Ratio (M‐H, Fixed, 95% CI) | 0.0 [0.0, 0.0] | |
| 3 Serious adverse events ‐ according to type of DAA Show forest plot | 167 | Odds Ratio (M‐H, Fixed, 95% CI) | Totals not selected | |
| 3.1 ABT‐072 | 3 | Odds Ratio (M‐H, Fixed, 95% CI) | 0.0 [0.0, 0.0] | |
| 3.2 ACH‐2684 | 0 | Odds Ratio (M‐H, Fixed, 95% CI) | 0.0 [0.0, 0.0] | |
| 3.3 Alisporivir | 3 | Odds Ratio (M‐H, Fixed, 95% CI) | 0.0 [0.0, 0.0] | |
| 3.4 ALS‐2200 | 0 | Odds Ratio (M‐H, Fixed, 95% CI) | 0.0 [0.0, 0.0] | |
| 3.5 Asunaprevir | 6 | Odds Ratio (M‐H, Fixed, 95% CI) | 0.0 [0.0, 0.0] | |
| 3.6 Balapiravir | 9 | Odds Ratio (M‐H, Fixed, 95% CI) | 0.0 [0.0, 0.0] | |
| 3.7 Beclabuvir | 3 | Odds Ratio (M‐H, Fixed, 95% CI) | 0.0 [0.0, 0.0] | |
| 3.8 BILB‐1941 | 1 | Odds Ratio (M‐H, Fixed, 95% CI) | 0.0 [0.0, 0.0] | |
| 3.9 BIT‐225 | 0 | Odds Ratio (M‐H, Fixed, 95% CI) | 0.0 [0.0, 0.0] | |
| 3.10 Boceprevir | 13 | Odds Ratio (M‐H, Fixed, 95% CI) | 0.0 [0.0, 0.0] | |
| 3.11 Ciluprevir | 1 | Odds Ratio (M‐H, Fixed, 95% CI) | 0.0 [0.0, 0.0] | |
| 3.12 Daclatasvir | 14 | Odds Ratio (M‐H, Fixed, 95% CI) | 0.0 [0.0, 0.0] | |
| 3.13 Danoprevir | 9 | Odds Ratio (M‐H, Fixed, 95% CI) | 0.0 [0.0, 0.0] | |
| 3.14 Dasabuvir | 2 | Odds Ratio (M‐H, Fixed, 95% CI) | 0.0 [0.0, 0.0] | |
| 3.15 Deleobuvir | 1 | Odds Ratio (M‐H, Fixed, 95% CI) | 0.0 [0.0, 0.0] | |
| 3.16 Faldaprevir | 13 | Odds Ratio (M‐H, Fixed, 95% CI) | 0.0 [0.0, 0.0] | |
| 3.17 Filibuvir | 3 | Odds Ratio (M‐H, Fixed, 95% CI) | 0.0 [0.0, 0.0] | |
| 3.18 Grazoprevir | 0 | Odds Ratio (M‐H, Fixed, 95% CI) | 0.0 [0.0, 0.0] | |
| 3.19 GS‐6620 | 0 | Odds Ratio (M‐H, Fixed, 95% CI) | 0.0 [0.0, 0.0] | |
| 3.20 GS‐9256 | 0 | Odds Ratio (M‐H, Fixed, 95% CI) | 0.0 [0.0, 0.0] | |
| 3.21 GS‐9451 | 1 | Odds Ratio (M‐H, Fixed, 95% CI) | 0.0 [0.0, 0.0] | |
| 3.22 GS‐9669 | 0 | Odds Ratio (M‐H, Fixed, 95% CI) | 0.0 [0.0, 0.0] | |
| 3.23 GS‐9851 | 1 | Odds Ratio (M‐H, Fixed, 95% CI) | 0.0 [0.0, 0.0] | |
| 3.24 GS‐9857 | 0 | Odds Ratio (M‐H, Fixed, 95% CI) | 0.0 [0.0, 0.0] | |
| 3.25 GSK2336805 | 2 | Odds Ratio (M‐H, Fixed, 95% CI) | 0.0 [0.0, 0.0] | |
| 3.26 GSK2878175 | 0 | Odds Ratio (M‐H, Fixed, 95% CI) | 0.0 [0.0, 0.0] | |
| 3.27 IDX‐184 | 2 | Odds Ratio (M‐H, Fixed, 95% CI) | 0.0 [0.0, 0.0] | |
| 3.28 INX‐08189 | 0 | Odds Ratio (M‐H, Fixed, 95% CI) | 0.0 [0.0, 0.0] | |
| 3.29 Ledispasvir | 1 | Odds Ratio (M‐H, Fixed, 95% CI) | 0.0 [0.0, 0.0] | |
| 3.30 Mericitabine | 7 | Odds Ratio (M‐H, Fixed, 95% CI) | 0.0 [0.0, 0.0] | |
| 3.31 Narlaprevir | 2 | Odds Ratio (M‐H, Fixed, 95% CI) | 0.0 [0.0, 0.0] | |
| 3.32 Nesbuvir | 0 | Odds Ratio (M‐H, Fixed, 95% CI) | 0.0 [0.0, 0.0] | |
| 3.33 Odalasavir | 1 | Odds Ratio (M‐H, Fixed, 95% CI) | 0.0 [0.0, 0.0] | |
| 3.34 Ombitasvir | 1 | Odds Ratio (M‐H, Fixed, 95% CI) | 0.0 [0.0, 0.0] | |
| 3.35 Paritaprevir | 3 | Odds Ratio (M‐H, Fixed, 95% CI) | 0.0 [0.0, 0.0] | |
| 3.36 PHX1766 | 0 | Odds Ratio (M‐H, Fixed, 95% CI) | 0.0 [0.0, 0.0] | |
| 3.37 PPI‐461 | 3 | Odds Ratio (M‐H, Fixed, 95% CI) | 0.0 [0.0, 0.0] | |
| 3.38 PSI‐352938 | 1 | Odds Ratio (M‐H, Fixed, 95% CI) | 0.0 [0.0, 0.0] | |
| 3.39 Samatasvir | 1 | Odds Ratio (M‐H, Fixed, 95% CI) | 0.0 [0.0, 0.0] | |
| 3.40 Setrobuvir | 1 | Odds Ratio (M‐H, Fixed, 95% CI) | 0.0 [0.0, 0.0] | |
| 3.41 Simeprevir | 19 | Odds Ratio (M‐H, Fixed, 95% CI) | 0.0 [0.0, 0.0] | |
| 3.42 Sofosbuvir | 6 | Odds Ratio (M‐H, Fixed, 95% CI) | 0.0 [0.0, 0.0] | |
| 3.43 Sovaprevir | 1 | Odds Ratio (M‐H, Fixed, 95% CI) | 0.0 [0.0, 0.0] | |
| 3.44 Tegobuvir | 1 | Odds Ratio (M‐H, Fixed, 95% CI) | 0.0 [0.0, 0.0] | |
| 3.45 Telaprevir | 13 | Odds Ratio (M‐H, Fixed, 95% CI) | 0.0 [0.0, 0.0] | |
| 3.46 Valopicitabine | 0 | Odds Ratio (M‐H, Fixed, 95% CI) | 0.0 [0.0, 0.0] | |
| 3.47 Vaniprevir | 10 | Odds Ratio (M‐H, Fixed, 95% CI) | 0.0 [0.0, 0.0] | |
| 3.48 VCH‐759 | 0 | Odds Ratio (M‐H, Fixed, 95% CI) | 0.0 [0.0, 0.0] | |
| 3.49 VCH‐916 | 0 | Odds Ratio (M‐H, Fixed, 95% CI) | 0.0 [0.0, 0.0] | |
| 3.50 Velpatasvir | 1 | Odds Ratio (M‐H, Fixed, 95% CI) | 0.0 [0.0, 0.0] | |
| 3.51 VX‐222 | 0 | Odds Ratio (M‐H, Fixed, 95% CI) | 0.0 [0.0, 0.0] | |
| 3.52 Mixed | 8 | Odds Ratio (M‐H, Fixed, 95% CI) | 0.0 [0.0, 0.0] | |
| 4 Serious adverse events ‐ according to group of DAA Show forest plot | 167 | Odds Ratio (M‐H, Fixed, 95% CI) | Totals not selected | |
| 4.1 Cyclophilin | 3 | Odds Ratio (M‐H, Fixed, 95% CI) | 0.0 [0.0, 0.0] | |
| 4.2 NS3/NS4A inhibitors | 92 | Odds Ratio (M‐H, Fixed, 95% CI) | 0.0 [0.0, 0.0] | |
| 4.3 NS5B inhibitors (NPI) | 24 | Odds Ratio (M‐H, Fixed, 95% CI) | 0.0 [0.0, 0.0] | |
| 4.4 NS5B inhibitors (NNPI) | 14 | Odds Ratio (M‐H, Fixed, 95% CI) | 0.0 [0.0, 0.0] | |
| 4.5 NS5A inhibitors | 27 | Odds Ratio (M‐H, Fixed, 95% CI) | 0.0 [0.0, 0.0] | |
| 4.6 VPU‐ion channel inhibitors | 0 | Odds Ratio (M‐H, Fixed, 95% CI) | 0.0 [0.0, 0.0] | |
| 4.7 Mixed | 7 | Odds Ratio (M‐H, Fixed, 95% CI) | 0.0 [0.0, 0.0] | |
| 5 Serious adverse events ‐ according to HIV‐infection Show forest plot | 167 | Odds Ratio (M‐H, Fixed, 95% CI) | Totals not selected | |
| 5.1 With HIV‐infection | 2 | Odds Ratio (M‐H, Fixed, 95% CI) | 0.0 [0.0, 0.0] | |
| 5.2 Without HIV‐infection | 154 | Odds Ratio (M‐H, Fixed, 95% CI) | 0.0 [0.0, 0.0] | |
| 5.3 Mixed (with and without HIV‐infection) | 0 | Odds Ratio (M‐H, Fixed, 95% CI) | 0.0 [0.0, 0.0] | |
| 5.4 Unclear | 11 | Odds Ratio (M‐H, Fixed, 95% CI) | 0.0 [0.0, 0.0] | |
| 6 Serious adverse events ‐ according to comorbidity Show forest plot | 167 | Odds Ratio (M‐H, Fixed, 95% CI) | Totals not selected | |
| 6.1 With comorbidity | 0 | Odds Ratio (M‐H, Fixed, 95% CI) | 0.0 [0.0, 0.0] | |
| 6.2 Without comorbidity | 0 | Odds Ratio (M‐H, Fixed, 95% CI) | 0.0 [0.0, 0.0] | |
| 6.3 Unclear | 167 | Odds Ratio (M‐H, Fixed, 95% CI) | 0.0 [0.0, 0.0] | |
| 7 Serious adverse events ‐ according to viral genotype Show forest plot | 167 | Odds Ratio (M‐H, Fixed, 95% CI) | Totals not selected | |
| 7.1 Genotype 1 | 138 | Odds Ratio (M‐H, Fixed, 95% CI) | 0.0 [0.0, 0.0] | |
| 7.2 Genotype 2 | 1 | Odds Ratio (M‐H, Fixed, 95% CI) | 0.0 [0.0, 0.0] | |
| 7.3 Genotype 3 | 0 | Odds Ratio (M‐H, Fixed, 95% CI) | 0.0 [0.0, 0.0] | |
| 7.4 Genotype 4 | 2 | Odds Ratio (M‐H, Fixed, 95% CI) | 0.0 [0.0, 0.0] | |
| 7.5 Mixed | 26 | Odds Ratio (M‐H, Fixed, 95% CI) | 0.0 [0.0, 0.0] | |
| 8 Serious adverse events ‐ according to human genotype (IL28b) Show forest plot | 167 | Odds Ratio (M‐H, Fixed, 95% CI) | Totals not selected | |
| 8.1 IL28b (CC) | 0 | Odds Ratio (M‐H, Fixed, 95% CI) | 0.0 [0.0, 0.0] | |
| 8.2 IL28B (CT) | 0 | Odds Ratio (M‐H, Fixed, 95% CI) | 0.0 [0.0, 0.0] | |
| 8.3 IL28B (TT) | 0 | Odds Ratio (M‐H, Fixed, 95% CI) | 0.0 [0.0, 0.0] | |
| 8.4 IL28B (CT + TT) | 0 | Odds Ratio (M‐H, Fixed, 95% CI) | 0.0 [0.0, 0.0] | |
| 8.5 Unclear | 79 | Odds Ratio (M‐H, Fixed, 95% CI) | 0.0 [0.0, 0.0] | |
| 8.6 Mixed IL28b | 88 | Odds Ratio (M‐H, Fixed, 95% CI) | 0.0 [0.0, 0.0] | |
| 9 Serious adverse events ‐ according to Asian‐region Show forest plot | 167 | Odds Ratio (M‐H, Fixed, 95% CI) | Totals not selected | |
| 9.1 From Asian region | 12 | Odds Ratio (M‐H, Fixed, 95% CI) | 0.0 [0.0, 0.0] | |
| 9.2 Not from Asian region | 119 | Odds Ratio (M‐H, Fixed, 95% CI) | 0.0 [0.0, 0.0] | |
| 9.3 Mixed | 31 | Odds Ratio (M‐H, Fixed, 95% CI) | 0.0 [0.0, 0.0] | |
| 9.4 Unclear | 5 | Odds Ratio (M‐H, Fixed, 95% CI) | 0.0 [0.0, 0.0] | |
| 10 Serious adverse events ‐ according to specific ethnicities Show forest plot | 167 | Odds Ratio (M‐H, Fixed, 95% CI) | Totals not selected | |
| 10.1 White | 3 | Odds Ratio (M‐H, Fixed, 95% CI) | 0.0 [0.0, 0.0] | |
| 10.2 Black | 0 | Odds Ratio (M‐H, Fixed, 95% CI) | 0.0 [0.0, 0.0] | |
| 10.3 Hispanic | 0 | Odds Ratio (M‐H, Fixed, 95% CI) | 0.0 [0.0, 0.0] | |
| 10.4 Mixed | 133 | Odds Ratio (M‐H, Fixed, 95% CI) | 0.0 [0.0, 0.0] | |
| 10.5 Unclear | 31 | Odds Ratio (M‐H, Fixed, 95% CI) | 0.0 [0.0, 0.0] | |
| 11 Serious adverse events ‐ according to reaching planned sample size | 0 | Odds Ratio (M‐H, Fixed, 95% CI) | Totals not selected | |
| 11.1 Trials reaching planned sample size | 0 | Odds Ratio (M‐H, Fixed, 95% CI) | 0.0 [0.0, 0.0] | |
| 11.2 Trials not reaching planned sample size | 0 | Odds Ratio (M‐H, Fixed, 95% CI) | 0.0 [0.0, 0.0] | |
| 11.3 Unclear | 0 | Odds Ratio (M‐H, Fixed, 95% CI) | 0.0 [0.0, 0.0] | |
| 12 Serious adverse events ‐ according to prior treatment Show forest plot | 167 | Odds Ratio (M‐H, Fixed, 95% CI) | Totals not selected | |
| 12.1 Treatment‐naive | 122 | Odds Ratio (M‐H, Fixed, 95% CI) | 0.0 [0.0, 0.0] | |
| 12.2 Treatment‐experienced | 27 | Odds Ratio (M‐H, Fixed, 95% CI) | 0.0 [0.0, 0.0] | |
| 12.3 Mixed | 18 | Odds Ratio (M‐H, Fixed, 95% CI) | 0.0 [0.0, 0.0] | |
| 12.4 Unclear | 0 | Odds Ratio (M‐H, Fixed, 95% CI) | 0.0 [0.0, 0.0] | |
| 13 Serious adverse events ‐ according to interferon Show forest plot | 167 | Odds Ratio (M‐H, Fixed, 95% CI) | Totals not selected | |
| 13.1 Trials where both groups received interferon | 126 | Odds Ratio (M‐H, Fixed, 95% CI) | 0.0 [0.0, 0.0] | |
| 13.2 Trials where neither group received interferon | 40 | Odds Ratio (M‐H, Fixed, 95% CI) | 0.0 [0.0, 0.0] | |
| 13.3 Trials where only the experimental group received interferon | 0 | Odds Ratio (M‐H, Fixed, 95% CI) | 0.0 [0.0, 0.0] | |
| 13.4 Trials where only the control group received interferon | 1 | Odds Ratio (M‐H, Fixed, 95% CI) | 0.0 [0.0, 0.0] | |
| 14 Serious adverse events ‐ according to ribavirin Show forest plot | 167 | Odds Ratio (M‐H, Fixed, 95% CI) | Totals not selected | |
| 14.1 Trials where both groups received ribavirin | 127 | Odds Ratio (M‐H, Fixed, 95% CI) | 0.0 [0.0, 0.0] | |
| 14.2 Trials where neither group received ribavirin | 37 | Odds Ratio (M‐H, Fixed, 95% CI) | 0.0 [0.0, 0.0] | |
| 14.3 Trials where only the experimental group received ribavirin | 1 | Odds Ratio (M‐H, Fixed, 95% CI) | 0.0 [0.0, 0.0] | |
| 14.4 Trials where only the control group received ribavirin | 2 | Odds Ratio (M‐H, Fixed, 95% CI) | 0.0 [0.0, 0.0] | |
| 15 Serious adverse events ‐ according to chronic kidney disease Show forest plot | 167 | Odds Ratio (M‐H, Fixed, 95% CI) | Totals not selected | |
| 15.1 With chronic kidney disease | 0 | Odds Ratio (M‐H, Fixed, 95% CI) | 0.0 [0.0, 0.0] | |
| 15.2 Without chronic kidney disease | 0 | Odds Ratio (M‐H, Fixed, 95% CI) | 0.0 [0.0, 0.0] | |
| 15.3 Unclear | 167 | Odds Ratio (M‐H, Fixed, 95% CI) | 0.0 [0.0, 0.0] | |
| 16 Serious adverse events ‐ according to cryoglobulinaemia Show forest plot | 167 | Odds Ratio (M‐H, Fixed, 95% CI) | Totals not selected | |
| 16.1 With cryoglobulinaemia | 0 | Odds Ratio (M‐H, Fixed, 95% CI) | 0.0 [0.0, 0.0] | |
| 16.2 Without cryoglobulinaemia | 0 | Odds Ratio (M‐H, Fixed, 95% CI) | 0.0 [0.0, 0.0] | |
| 16.3 Unclear | 167 | Odds Ratio (M‐H, Fixed, 95% CI) | 0.0 [0.0, 0.0] | |
| 17 Serious adverse events ‐ according to DAA group as co‐intervention Show forest plot | 167 | Odds Ratio (M‐H, Fixed, 95% CI) | Totals not selected | |
| 17.1 Trials where DAA were used as co‐intervention | 2 | Odds Ratio (M‐H, Fixed, 95% CI) | 0.0 [0.0, 0.0] | |
| 17.2 Trials where DAA were not a co‐intervention | 165 | Odds Ratio (M‐H, Fixed, 95% CI) | 0.0 [0.0, 0.0] | |
| Outcome or subgroup title | No. of studies | No. of participants | Statistical method | Effect size |
| 1 Without sustained virological response Show forest plot | 107 | 17101 | Risk Ratio (M‐H, Random, 95% CI) | 0.53 [0.48, 0.59] |
| 1.1 Trials assessing DAAs on or on the way to the market | 60 | 6886 | Risk Ratio (M‐H, Random, 95% CI) | 0.44 [0.37, 0.52] |
| 1.2 Trials assessing DAAs withdrawn from market | 43 | 9075 | Risk Ratio (M‐H, Random, 95% CI) | 0.61 [0.55, 0.69] |
| 1.3 Trials using other medical intervention as control group | 3 | 862 | Risk Ratio (M‐H, Random, 95% CI) | 0.81 [0.36, 1.82] |
| 1.4 Trials using other medical intervention as experimental group | 1 | 278 | Risk Ratio (M‐H, Random, 95% CI) | 0.23 [0.17, 0.29] |
| Outcome or subgroup title | No. of studies | No. of participants | Statistical method | Effect size |
| 1 SF‐36 physical score Show forest plot | 1 | 215 | Mean Difference (IV, Fixed, 95% CI) | ‐1.17 [‐3.65, 1.31] |
| 2 SF‐36 mental score Show forest plot | 1 | 215 | Mean Difference (IV, Fixed, 95% CI) | 1.36 [‐1.53, 4.25] |
| Outcome or subgroup title | No. of studies | No. of participants | Statistical method | Effect size |
| 1 Hepatitis C‐related morbidity or all‐cause mortality Show forest plot | 14 | 666 | Odds Ratio (M‐H, Fixed, 95% CI) | 1.25 [0.06, 26.65] |
| 2 Hepatitis C‐related morbidity or all‐cause mortality ‐ according to dose Show forest plot | 14 | 666 | Odds Ratio (M‐H, Fixed, 95% CI) | 1.25 [0.06, 26.65] |
| 2.1 Over or equal to median dose | 7 | 374 | Odds Ratio (M‐H, Fixed, 95% CI) | 0.0 [0.0, 0.0] |
| 2.2 Under median dose | 7 | 292 | Odds Ratio (M‐H, Fixed, 95% CI) | 1.25 [0.06, 26.65] |
| 2.3 Not available | 0 | 0 | Odds Ratio (M‐H, Fixed, 95% CI) | 0.0 [0.0, 0.0] |
| 3 Serious adverse events Show forest plot | 13 | Odds Ratio (M‐H, Fixed, 95% CI) | Totals not selected | |
| 4 Serious adverse events ‐ according to median dose Show forest plot | 14 | Odds Ratio (M‐H, Fixed, 95% CI) | Totals not selected | |
| 4.1 Over or equal to median dose | 7 | Odds Ratio (M‐H, Fixed, 95% CI) | 0.0 [0.0, 0.0] | |
| 4.2 Under median dose | 8 | Odds Ratio (M‐H, Fixed, 95% CI) | 0.0 [0.0, 0.0] | |
| 4.3 Not available | 0 | Odds Ratio (M‐H, Fixed, 95% CI) | 0.0 [0.0, 0.0] | |
| 5 Without sustained virological response Show forest plot | 7 | 619 | Odds Ratio (M‐H, Fixed, 95% CI) | 0.40 [0.27, 0.59] |
| 6 Without sustained virological response ‐ according to median dose Show forest plot | 7 | 619 | Odds Ratio (M‐H, Fixed, 95% CI) | 0.40 [0.27, 0.59] |
| 6.1 Over or equal to median dose | 4 | 360 | Odds Ratio (M‐H, Fixed, 95% CI) | 0.43 [0.26, 0.70] |
| 6.2 Under median dose | 3 | 259 | Odds Ratio (M‐H, Fixed, 95% CI) | 0.36 [0.19, 0.68] |
| 6.3 Not available | 0 | 0 | Odds Ratio (M‐H, Fixed, 95% CI) | 0.0 [0.0, 0.0] |
| Outcome or subgroup title | No. of studies | No. of participants | Statistical method | Effect size |
| 1 Hepatitis C‐related morbidity or all‐cause mortality Show forest plot | 14 | 1589 | Odds Ratio (M‐H, Fixed, 95% CI) | 0.49 [0.08, 2.96] |
| 2 Hepatitis C‐related morbidity or all‐cause mortality ‐ according to dose Show forest plot | 14 | 1589 | Odds Ratio (M‐H, Fixed, 95% CI) | 0.49 [0.08, 2.96] |
| 2.1 Over or equal to median dose | 4 | 441 | Odds Ratio (M‐H, Fixed, 95% CI) | 0.51 [0.03, 8.21] |
| 2.2 Under median dose | 8 | 705 | Odds Ratio (M‐H, Fixed, 95% CI) | 0.41 [0.01, 12.22] |
| 2.3 Not available | 2 | 443 | Odds Ratio (M‐H, Fixed, 95% CI) | 0.55 [0.02, 13.62] |
| 3 Serious adverse events Show forest plot | 18 | Odds Ratio (M‐H, Fixed, 95% CI) | Totals not selected | |
| 4 Serious adverse events ‐ according to median dose Show forest plot | 18 | Odds Ratio (M‐H, Fixed, 95% CI) | Totals not selected | |
| 4.1 Over or equal to median dose | 7 | Odds Ratio (M‐H, Fixed, 95% CI) | 0.0 [0.0, 0.0] | |
| 4.2 Under median dose | 9 | Odds Ratio (M‐H, Fixed, 95% CI) | 0.0 [0.0, 0.0] | |
| 4.3 Not available | 2 | Odds Ratio (M‐H, Fixed, 95% CI) | 0.0 [0.0, 0.0] | |
| 5 Without sustained virological response Show forest plot | 19 | 2898 | Odds Ratio (M‐H, Fixed, 95% CI) | 0.22 [0.19, 0.27] |
| 6 Without sustained virological response ‐ according to median dose Show forest plot | 19 | 2898 | Odds Ratio (M‐H, Fixed, 95% CI) | 0.22 [0.19, 0.27] |
| 6.1 Over or equal to median dose | 9 | 1765 | Odds Ratio (M‐H, Fixed, 95% CI) | 0.25 [0.20, 0.32] |
| 6.2 Under median dose | 8 | 696 | Odds Ratio (M‐H, Fixed, 95% CI) | 0.19 [0.13, 0.29] |
| 6.3 Not available | 2 | 437 | Odds Ratio (M‐H, Fixed, 95% CI) | 0.13 [0.07, 0.24] |
| Outcome or subgroup title | No. of studies | No. of participants | Statistical method | Effect size |
| 1 Hepatitis C‐related morbidity or all‐cause mortality Show forest plot | 9 | 379 | Odds Ratio (M‐H, Fixed, 95% CI) | 0.76 [0.03, 18.90] |
| 2 Hepatitis C‐related morbidity or all‐cause mortality ‐ according to dose Show forest plot | 9 | 379 | Odds Ratio (M‐H, Fixed, 95% CI) | 0.76 [0.03, 18.90] |
| 2.1 Over or equal to median dose | 6 | 313 | Odds Ratio (M‐H, Fixed, 95% CI) | 0.76 [0.03, 18.90] |
| 2.2 Under median dose | 3 | 66 | Odds Ratio (M‐H, Fixed, 95% CI) | 0.0 [0.0, 0.0] |
| 2.3 Not available | 0 | 0 | Odds Ratio (M‐H, Fixed, 95% CI) | 0.0 [0.0, 0.0] |
| 3 Serious adverse events Show forest plot | 10 | Odds Ratio (M‐H, Fixed, 95% CI) | Totals not selected | |
| 4 Serious adverse events ‐ according to median dose Show forest plot | 10 | Odds Ratio (M‐H, Fixed, 95% CI) | Totals not selected | |
| 4.1 Over or equal to median dose | 6 | Odds Ratio (M‐H, Fixed, 95% CI) | 0.0 [0.0, 0.0] | |
| 4.2 Under median dose | 4 | Odds Ratio (M‐H, Fixed, 95% CI) | 0.0 [0.0, 0.0] | |
| 4.3 Not available | 0 | Odds Ratio (M‐H, Fixed, 95% CI) | 0.0 [0.0, 0.0] | |
| 5 Without sustained virological response Show forest plot | 9 | 333 | Odds Ratio (M‐H, Fixed, 95% CI) | 0.12 [0.06, 0.22] |
| 6 Without sustained virological response ‐ according to median dose Show forest plot | 9 | 333 | Odds Ratio (M‐H, Fixed, 95% CI) | 0.12 [0.06, 0.22] |
| 6.1 Over or equal to median dose | 6 | 280 | Odds Ratio (M‐H, Fixed, 95% CI) | 0.10 [0.05, 0.20] |
| 6.2 Under median dose | 3 | 53 | Odds Ratio (M‐H, Fixed, 95% CI) | 0.26 [0.06, 1.04] |
| 6.3 Not available | 0 | 0 | Odds Ratio (M‐H, Fixed, 95% CI) | 0.0 [0.0, 0.0] |
| Outcome or subgroup title | No. of studies | No. of participants | Statistical method | Effect size |
| 1 Without significant reductions in ALT/AST serum levels Show forest plot | 11 | 2099 | Risk Ratio (M‐H, Random, 95% CI) | 0.79 [0.68, 0.92] |
| 2 Without significant reductions in ALT/AST serum levels ‐ according to DAA status Show forest plot | 11 | 2099 | Risk Ratio (M‐H, Random, 95% CI) | 0.79 [0.68, 0.92] |
| 2.1 Trials assessing DAAs on or on the way to the market | 0 | 0 | Risk Ratio (M‐H, Random, 95% CI) | 0.0 [0.0, 0.0] |
| 2.2 Trials assessing DAAs withdrawn from market | 11 | 2099 | Risk Ratio (M‐H, Random, 95% CI) | 0.79 [0.68, 0.92] |
| 3 Without significant reductions in ALT/AST serum levels ‐ according to type of drug Show forest plot | 11 | 2099 | Risk Ratio (M‐H, Random, 95% CI) | 0.79 [0.68, 0.92] |
| 3.1 Faldaprevir | 8 | 2019 | Risk Ratio (M‐H, Random, 95% CI) | 0.81 [0.69, 0.96] |
| 3.2 Balaparavir | 3 | 80 | Risk Ratio (M‐H, Random, 95% CI) | 0.61 [0.41, 0.92] |