非類固醇抗發炎藥(NSAIDs)對慢性下背痛的治療
Abstract
背景
慢性背痛是一項重要的健康議題。非類固醇類抗發炎藥(NSAIDs)廣泛的使用在治療有下背痛的病人,尤其是急性背部疼痛的患者。短期使用NSAIDs也被推薦於緩解慢性背痛。目前有兩類可用於治療背痛的NSAIDs: 非選擇性NSAIDs與選擇性COX‐2類NSAIDs。2008年,一篇考科藍文獻回顧指出在比較NSAIDs與安慰劑組別於慢性背痛病人中,NSAIDs組有小但顯著的效果。本文獻回顧係更新2008年考科藍的文獻回顧,並針對慢性下背疼痛的患者。
目的
確認NSAIDs比較其他不同治療對非特定慢性下背痛是否更有效,如果是,哪個種類的NSAIDs效果最好。
搜尋策略
我們搜尋發表在CENTRAL, MEDLINE, EMBASE, PubMed與兩個臨床試驗資料庫,搜尋至2015年6月24日之以英文、德文或荷蘭語發表隨機對照試驗,我們也搜尋了其他相關文獻回顧引用的文獻資料。
選擇標準
我們納入用NSAIDs治療慢性下背痛病人的雙盲或單盲之隨機對照試驗。
資料收集與分析
兩位作者依納入標準獨立地審核此文獻回顧相關的試驗。其中一位作者萃取數據,而另一位作者則確認這些數據。兩位作者獨立地評估所有收錄試驗的偏差風險。如果資料其臨床上的同質性,我們進行統合分析且使用GRADE方法評斷試驗證據的品質。
主要結果
我們納入了13個試驗在本篇考科藍文獻回顧中。10個研究屬於低風險偏差。6個共1,354位受試者的研究比較使用NSAIDs與安慰劑。於NSAIDs較安慰劑組有效的低證據品質,疼痛強度分數以0到100分的視覺類比量表(visual analogue scale,VAS)平均差為‐3.30 (95% CI −5.33 至 −1.27),相較治療前其追蹤天數中位數56天(四分位距IQR 13到91 天)。四個研究以羅蘭-摩理斯生活障礙問卷(Roland Morris Disability Questionnaire)測量生活障礙,顯示NSAIDs比安慰劑組更有效:相較於治療前,以0到24分的生活障礙量表平均差為 ‐0.85(95% CI ‐1.30至 ‐0.40),追蹤天數中位數84天 (IQR 42 到105天),證據品質低。6個有安慰劑控制組的試驗都有報告發生不良事件的紀錄,但NSAIDs組的副作用發生頻率比上安慰劑組,沒有達到統計上顯著差異(RR 1.04, 95% CI 0.92 至 1.17)。因為大部分納入試驗相對的,樣本數目較小且追蹤天數較短,病人有副作用的比率有可能被低估
兩個研究比較不同種類的非選擇性NSAIDs,主要是ibuprofen比diclofenac、piroxicam比indomethacin。試驗中沒有發現這些不同NSAIDs有任何的差異,但兩組試驗樣本數都很小。一個試驗報告選擇性與非選擇性NSAIDs在疼痛強度上兩組並無差異。另一個試驗中比較diflunisal與paracetamol,在疼痛強度評分相較於治療前顯示沒有差別。一個試驗則顯示出celecoxib整體改善的效果優於tramadol。
一項試驗比較NSAIDs與〝居家運動〞(home‐based exercise),生活障礙的進步在有運動的受試者比服用NSAIDs的受試者好,但疼痛評分結果相同。
作者結論
在疼痛強度中,13個納入的隨機對照試驗中的6個顯示出NSAIDs比安慰劑組別更有效。在生活障礙情形中,NSAIDs稍稍比安慰劑組別有效。然而,有效的程度不大,且證據等級低。當我們在所有納入的隨機對照試驗中,只分析低風險偏差試驗時,NSAIDs與安慰劑組的效果差異則減少了。我們發現用不同種類的NSAID效果沒有差別,包含選擇性比非選擇性NSAID也一樣。因為我們只納入隨機對照試驗,由於大部分試驗相對較小的樣本數與相對短的追蹤時間,我們不能確切聲稱關於副作用的發生,或長期使用NSAIDs是否安全。
PICO
Plain language summary
非類固醇抗發炎藥(NSAIDs)對慢性下背痛的治療
文獻回顧問題
我們評估在慢性下背痛病人中使用非類固醇抗發炎藥(NSAIDs)效果的證據,包括NSAIDs與安慰劑組、各種類NSAIDs、其他藥物或其他治療效果比較。
背景
慢性下背痛非常普遍,且會造成疼痛與生活障礙(disability)。NSAIDs經常被使用於治療慢性下背痛,且不同分類、不同化學成分皆可由非處方(over‐the‐counter,OTC)與處方藥方式取得。
研究特色
我們蒐集了所有已發表的隨機對照試驗(至2015年6月24),評估NSAIDs的作用。我們納入13個試驗,包括比較使用非類固醇抗發炎藥(NSAIDs) 與安慰劑組、以及其他種類NSAIDs、其他藥物或其他形式的治療效果於慢性下背疼痛的患者。6個試驗比較NSAIDs與安慰劑,總共包含了1354位受試者。追蹤時間在9天與16周之間。
重要結果
NSAIDs與安慰劑比較,可減少慢性下背痛病人的疼痛與生活障礙。然而,其差異不大: 在以疼痛強度評分中總分100分的量表中有3.3分的改善。生活障礙的改善上,在0到24分生活障礙程度評分中,接受NSAIDs組的病人改善0.9分。發生不良事件方面,接受NSAIDs組的病人與安慰劑組沒有顯著差異,但仍需進行時間較長的大型研究,以確認延遲發生、罕見的不良事件或長期使用與重要的藥物交互作用及不良事件等。
不同種類的NSAIDs沒有顯示出效果上的顯著差異。13個研究中的3個比較了兩種不同種類的NSAIDs,並沒有發現差異。
NSAIDs也與其他類型藥物比較: paracetamol, tramadol與pregabalin。在NSAIDs與paracetamol和pregabalin比較中,藥物效果與不良事件都無差異。但有一個研究中比較celecoxib與tramadol,發現使用celecoxib的病人中有更佳的整體改善。
一項試驗比較了NSAIDs與居家運動。在生活障礙問題上,有運動的人比服用NSAIDs人們好,但疼痛分數上沒有統計的差異。
研究證據品質
在慢性下背痛病人上,使用NSAIDs稍微比安慰劑有效果,其證據品質低。當我們只分析較高品質的試驗結果時,此一些微差異的程度也減少了。
Authors' conclusions
Summary of findings
| NSAIDs for people with chronic low back pain compared to placebo | |||||
| Participant or population: people with chronic low back pain | |||||
| Outcomes | Illustrative comparative risks* (95% CI) | Relative effect | Number of participants | Quality of the evidence | |
| Assumed risk | Corresponding risk | ||||
| Control | NSAIDs | ||||
| Change in pain intensity from baseline | Not estimable | The mean change in pain intensity from baseline in the intervention groups was | ‐ | 1354 | ⊕⊕⊝⊝ |
| Change in disability from baseline | Not estimable | The mean change in disability from baseline in the intervention groups was | ‐ | 1161 | ⊕⊕⊝⊝ |
| Proportion of participants experiencing adverse events | Study population | RR 1.04 | 1354 | ⊕⊕⊝⊝ | |
| 410 per 1000 | 427 per 1000 | ||||
| Moderate | |||||
| 477 per 1000 | 496 per 1000 | ||||
| Sensitivity analysis: change in pain intensity from baseline | Not estimable | The mean sensitivity analysis change in pain intensity from baseline. in the intervention groups was | ‐ | 728 | ⊕⊕⊕⊝ |
| Sensitivity analysis: change in disability from baseline | Not estimable | The mean sensitivity analysis change in disability from baseline in the intervention groups was | ‐ | 654 | ⊕⊕⊕⊝ |
| Sensitivity analysis: proportion of participants experiencing adverse events. Follow‐up ≤ 16 weeks | Study population | RR 0.93 | 728 | ⊕⊕⊕⊝ | |
| 536 per 1000 | 498 per 1000 | ||||
| Moderate | |||||
| 522 per 1000 | 485 per 1000 | ||||
| *The basis for the assumed risk (e.g. the median control group risk across studies) is provided in footnotes. The corresponding risk (and its 95% CI) is based on the assumed risk in the comparison group and the relative effect of the intervention (and its 95% CI). | |||||
| GRADE Working Group grades of evidence | |||||
| 1Allocation concealment was uncertain in most included trials, and randomization was uncertain in half of the included trials, therefore selection bias is likely. Five out of six trials had high drop‐out rates, so attrition bias is likely, one level downgrade. | |||||
Background
Description of the condition
Low back pain is a major health problem and has a reported lifetime prevalence of up to 84% (Cassidy 1998; Walker 2000). More than one quarter of North Americans have reported to have experienced low back pain within the previous three months (Deyo 2006) and low back pain is a leading cause of years lived with disability (Vos 2012). In the first three months, a large proportion of patients will recover, but most people still experience pain after one year (Itz 2013). Chronic low back pain is associated with more disability and these people make a great demand on the healthcare system (Webb 2003). Also, low back pain is the most common type of pain in people experiencing any chronic pain (Müller‐Schwefe 2011a) and people with chronic low back pain use healthcare more compared to people with acute low back pain (Müller‐Schwefe 2011b). For treatment, guidelines recommend staying active and exercising, if necessary with the use of analgesics. Non‐steroidal anti‐inflammatory drugs (NSAIDs) are one of the most frequently used analgesics in low back pain management (Gore 2012; Piccoliori 2013). People with acute low back pain can receive NSAIDs for their pain, and short term NSAID use is recommended for pain relief in people with chronic back pain (Airaksinen 2006).
Description of the intervention
Most guidelines on treatment of low back pain recommend using paracetamol as first choice, followed by NSAIDs if paracetamol is insufficient (Koes 2010). NSAIDs are widely available in several types and brands and both over‐the‐counter and on prescription. NSAID treatment is based on the analgesic and anti‐inflammatory mechanisms of the drug, but is also associated with adverse events, such as gastro‐intestinal (Sostres 2013; Wehling 2014) and cardiovascular events (Kearney 2006).
How the intervention might work
Cyclooxygenase‐1 (COX‐1) and cyclooxygenase‐2 (COX‐2) are key enzymes in prostaglandin synthesis, which contribute to inflammation, pain and fever. NSAIDs inhibit the COX enzymes and can therefore inhibit the production of prostaglandins. Consequently this can reduce inflammation, pain and fever. COX‐1 produces prostaglandins that also support platelets and protect the stomach lining. It also helps to maintain kidney function. COX‐1 inhibition can raise the risk of renal insufficiency and gastro‐intestinal adverse events, such as gastritis or stomach bleeding.
There are two types of NSAIDs: non‐selective NSAIDs, which inhibit both COX‐1 and COX‐2 enzymes, and selective NSAIDs, which inhibit only the COX‐2 enzyme. Both selective and non‐selective NSAIDs are available for pain treatment, and the choice of NSAID is mostly based on the different possible known adverse events, convenience of use, and cost.
Non‐selective or traditional NSAIDs have a higher risk compared to selective NSAIDs regarding gastro‐intestinal adverse events (Sostres 2013) due to the inhibition of both COX enzymes. However, aside from these gastro‐intestinal benefits of selective NSAIDs, there is a known cardiovascular risk from use of these NSAID types. Cardiovascular risks are also present in non‐selective NSAIDs and should be taken into account when prescribing any NSAIDs (CNT Collaboration 2013; Trelle 2011).
Why it is important to do this review
This Cochrane review is one of a series of Cochrane reviews of NSAIDs for people with low back pain and is an update of a Cochrane review first published in 2008 (Roelofs 2008). The original review consisted of 65 randomized controlled trials (RCTs); for this update we decided to create a series of Cochrane reviews regarding NSAID use for acute back pain, chronic back pain and sciatica. Also, efficacy of treatment with NSAIDs can differ among these different types of back pain. This Cochrane review focuses on NSAIDs for treating people with chronic low back pain.
Objectives
To determine if NSAIDs are more efficacious than various comparison treatments for non‐specific chronic low back pain and if so, which type of NSAID is most efficacious.
Methods
Criteria for considering studies for this review
Types of studies
We included double‐blinded and single‐blinded randomized controlled trials (RCTs). We only included English, German or Dutch trials, as we had stated in the original Cochrane protocol.
Types of participants
We included participants aged 18 years or older, who were treated for non‐specific chronic low back pain. We defined chronic low back pain as pain for at least 12 weeks. If the trial did not describe the duration of back pain, but labeled back pain as chronic, we included the trial. If a trial included mixed populations of acute, sub‐acute or chronic low back pain, we only included these trials if they presented chronic low back pain data separately. We excluded participants with sciatica or with specific low back pain caused by pathological entities, such as infection, neoplasm, metastasis, osteoporosis, rheumatoid arthritis or fractures.
Types of interventions
We included RCTs that assessed one or more types of NSAIDs. We permitted additional interventions if there was a contrast for NSAIDs in the trial. For example, we included trials that compared NSAIDs plus muscle relaxants versus muscle relaxants alone, but excluded trials that compared NSAIDs plus muscle relaxants versus paracetamol.
We excluded trials that used NSAIDs which are no longer available on the market, such as rofecoxib.
Types of outcome measures
Primary outcomes
Primary outcome measures were:
-
pain intensity (e.g. visual analogue scale (VAS) or Numerical Rating Scale (NRS))
-
global measure (e.g. overall improvement, proportion of participants that recover)
-
back pain‐specific functional status (e.g. Roland Disability Questionnaire, Oswestry Scale)
-
return to work (e.g. return to work status, number of days off work)
-
adverse events (proportion of participants experiencing adverse events)
Secondary outcomes
Secondary outcome measures were physiological outcomes (e.g. range of motion, spinal flexibility, degrees of straight leg raising or muscle strength) and generic functional status (e.g. Short Form 36 (SF‐36), Nottingham Health Profile, Sickness Impact Profile). We also considered other symptoms, such as health care consumption.
Search methods for identification of studies
Electronic searches
We identified RCTs for inclusion by searching the following databases up to 24 June 2015:
-
Cochrane Central Register of Controlled Trials (CENTRAL, the Cochrane Library, Issue 5 of 12, May 2015)
-
MEDLINE (OvidSP, 1946 to June Week 2 2015)
-
MEDLINE In‐Process & Other Non‐Indexed Citations (OvidSP, June 23, 2015)
-
EMBASE (OvidSP, 1980 to 2015 Week 25)
-
World Health Organization International Clinical Trials Registry Platform (WHO ICTRP)
For this update, we conducted the literature searches annually between May 2012 and 24 June 2015. We added the trial registers (clinicaltrials.gov and WHO ICTRP) in 2013, MEDLINE In‐Process & Other Non‐Indexed Citations in 2014 and PubMed in 2015 to identify studies not in MEDLINE using the strategy recommended by Duffy 2014. We have presented the search strategies in Appendix 1, Appendix 2, Appendix 3, Appendix 4 and Appendix 5.
A research librarian from the Cochrane Back and Neck Review Group devised and performed these searches according to the guidelines of the Cochrane Back and Neck Review Group (Furlan 2009).
Searching other resources
After the electronic search, we screened systematic reviews regarding NSAIDs for chronic low back pain. We included articles that we had included in the previous version of this Cochrane review (Roelofs 2008).
Data collection and analysis
Selection of studies
Two review authors (BK and PR, or PR and WE) independently screened all search results. We excluded clearly ineligible studies based on title and abstract. We retrieved full‐text articles of all remaining studies and two review authors screened these articles independently for inclusion. We resolved any disagreements regarding inclusion by consensus between the review authors.
Data extraction and management
One review author, WE, extracted the data, and a second review author, PR, checked the extracted data. The review authors extracted data on type and dose of NSAIDs, type of reference treatment, follow‐up time, duration of current symptoms and the outcomes described above. If data were unavailable for data extraction due to use of a different format, we contacted the trial authors for further information. We resolved any disagreements through consensus between all review authors.
Assessment of risk of bias in included studies
Two review authors (WE and PR) independently evaluated the risk of bias of all included trials, using the criteria list recommended by the Cochrane Back Review Group (Furlan 2009) and described in Appendix 6. We scored each of the criteria as either 'low', 'high' or 'unclear' risk. If we scored the criteria as unclear, we did not contact the trial authors for further information. We resolved any disagreements by consensus and consulted a third review author if disagreements persisted.
Measures of treatment effect
The primary outcome, pain intensity, is measured with the VAS or NRS on a scale from 0 to 100 and 0 to 10 respectively. Global improvement is measured by the proportion of participants that recovered. Disability is measured on different disability scales, (e.g. Roland Morris Disability Questionnaire (RDQ) on a 0 to 24 scale). Adverse events are measured by the proportion of participants experiencing any adverse event.
Dealing with missing data
We did not include data in this review that were not reported in the article and that we considered missing. If trials showed data in graphs instead of describing data in the text but were shown in graphs, we collected data from the graphs.
Assessment of heterogeneity
We assessed clinical heterogeneity for all included RCTs that reported similar outcomes. We judged the included trials based on setting, participants and intervention. If trials were clinically heterogeneous, we did not pool them. We assessed statistical heterogeneity using the Chi² test and I² statistic. If I² statistic values were greater than 50%, substantial heterogeneity could be present (Higgins 2011) and we pooled data using a random‐effects model. When we suspected no, low or moderate heterogeneity, we used a fixed‐effect model.
Assessment of reporting biases
We used funnel plots to investigate reporting bias when we included at least four trials in a particular comparison.
Data synthesis
We analysed dichotomous outcomes by calculating the relative risk (RR). We analysed continuous outcomes by calculating the mean difference (MD) when the same instrument was used to measure outcomes, or the standardized mean difference (SMD) when different instruments were used to measure the outcomes. We expressed uncertainty with 95% confidence intervals (95% CIs). We performed a meta‐analysis if studies were clinically homogeneous (comparable population, intervention and outcomes among trials) using a fixed‐effect model unless there was significant statistical heterogeneity, in which case we used a random‐effects model. We used the I² and chi² test to assess statistical heterogeneity as suggested in the Cochrane handbook (Higgins 2011). If meta‐analysis was not possible, we described the results from clinically comparable trials in the review text.
We assessed the overall quality of the evidence for each outcome using the GRADE approach, as recommended in the Cochrane Handbook for Systematic Reviews of Interventions (Higgins 2011) and adapted in the updated CBRG method guidelines (Furlan 2009). Five factors that may have decreased the quality of the evidence were: study design and risk of bias, inconsistency of results, indirectness (not generalizable), imprecision (sparse data) and other factors (e.g. reporting bias). We downgraded the quality of the evidence for a specific outcome by one level according to the performance of the studies against each of these five factors. We assessed the overall quality of the evidence for each outcome as:
-
High quality evidence: there are consistent findings among at least 75% of RCTs with low risk of bias, consistent, direct and precise data and no known or suspected publication biases. Further research is unlikely to change either the estimate or our confidence in the results.
-
Moderate quality evidence: one of the domains is not met. Further research is likely to have an important impact on our confidence in the estimate of effect and may change the estimate.
-
Low quality evidence: two of the domains are not met. Further research is very likely to have an important impact on our confidence in the estimate of effect and is likely to change the estimate.
-
Very low quality evidence: three of the domains are not met. We are very uncertain about the results.
-
No evidence: we did not identify any RCTs that addressed this outcome.
Subgroup analysis and investigation of heterogeneity
We performed subgroup analyses if both non‐selective and selective NSAIDs were present. We split these results into non‐selective and selective NSAIDs.
Sensitivity analysis
We performed a sensitivity analysis on the comparison between NSAIDs and placebo. We excluded trials at high risk of bias (less than six positive items on the 'Risk of bias' table) or trials with a 'flare design' from this analysis. A trial with a 'flare design' only includes participants who previously used NSAIDs and reported aggravated back complaints during a washout period.
Results
Description of studies
Results of the search
We identified a total of 3437 potential articles in the updated electronic search (Figure 1). After screening the titles and abstracts, we assessed full‐text articles and included 13 trials. Amongst these were seven of the nine articles on chronic low back pain from Roelofs 2008. Two trials reported on rofecoxib, which was withdrawn from the market, and we excluded these trials from this review (Chrubasik 2003; Katz 2003).

study flow diagram.
Included studies
The sample size of the 13 included trials ranged from 28 to 1593 participants, with a total of 4807 included participants. Six trials compared NSAIDs versus placebo (Allegrini 2009; Berry 1982; Birbara 2003; Coats 2004; Katz 2011; Kivitz 2013). Three trials compared two different types of NSAIDs (Driessens 1994; Videman 1984; Zerbini 2005). One trial compared NSAIDs versus paracetamol (Hickey 1982), one trial compared NSAIDs versus tramadol (O'Donnell 2009) and one trial compared NSAIDs versus pregabalin (Romanò 2009). One trial compared exercise therapy versus NSAIDs (Shirado 2010).
Excluded studies
We have described the reasons for exclusion of studies in the 'Characteristics of excluded studies' table. We excluded most studies because it was unclear whether participants had chronic low back pain.
Risk of bias in included studies
We have presented the 'Risk of bias' assessment in Figure 2 and Figure 3. Ten of the 13 studies were considered having a low risk of bias. (Berry 1982; Birbara 2003; Coats 2004; Driessens 1994; Hickey 1982; Katz 2011; Kivitz 2013; O'Donnell 2009; Shirado 2010; Zerbini 2005).

'Risk of bias' summary: review authors' judgements about each 'Risk of bias' item for each included trial.
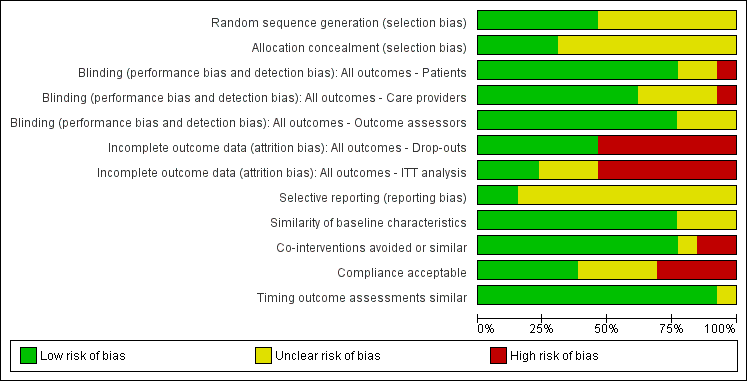
'Risk of bias' graph: review authors' judgements about each 'Risk of bias' item presented as percentages across all included trials.
Allocation
Of the 13 included studies, six reported a randomization procedure (Allegrini 2009; Birbara 2003; Coats 2004; Hickey 1982; O'Donnell 2009; Shirado 2010). Of these six studies, only four also adequately described concealment of treatment allocation (Birbara 2003; Hickey 1982; O'Donnell 2009; Shirado 2010). Most studies did not report the method of randomization or allocation concealment and were scored as 'unclear' on these items.
Blinding
Seven included trials reported blinding of patients, care providers and outcome assessors (Berry 1982; Birbara 2003; Driessens 1994; Hickey 1982; O'Donnell 2009; Videman 1984; Zerbini 2005). The other six trials did not blind patients, care providers, or outcome assessors or they did not report on blinding.
Incomplete outcome data
Six trials reported low drop out rates (Berry 1982; Hickey 1982; Romanò 2009; Shirado 2010; Videman 1984; Zerbini 2005). The seven other studies reported drop‐out rates higher than 20% (Allegrini 2009; Birbara 2003; Coats 2004; Driessens 1994; Katz 2011; Kivitz 2013; O'Donnell 2009).
Only three trials performed an intention to treat (ITT) analysis (Coats 2004; Katz 2011; O'Donnell 2009).
Selective reporting
Only two RCTs were registered in an accessible clinical trial registry (Katz 2011; Kivitz 2013) and had low risk of reporting bias.
Other potential sources of bias
Most studies showed similarity of baseline characteristics; only three RCTs did not report this (Allegrini 2009; Hickey 1982; Videman 1984).
Regarding co‐interventions, only paracetamol as rescue medication was allowed; other types of medication were not. All but two trials avoided co‐interventions (Berry 1982; Birbara 2003) and one trial did not state anything about co‐interventions (Shirado 2010).
Nine trials reported compliance, and five trials had acceptable compliance (Allegrini 2009; Coats 2004; Katz 2011; Romanò 2009; Zerbini 2005). Four other trials had unacceptable compliance (Berry 1982; Birbara 2003; Driessens 1994; O'Donnell 2009).
Timing of outcome assessment was similar between the groups in almost all included trials.
We created funnel plots to assess risk of publication bias and for the analysis of NSAIDs versus placebo (Figure 4; Figure 5; Figure 6). We could not identify publication bias. We did not create any funnel plots for other comparisons, since less than four RCTs were available for this analysis.
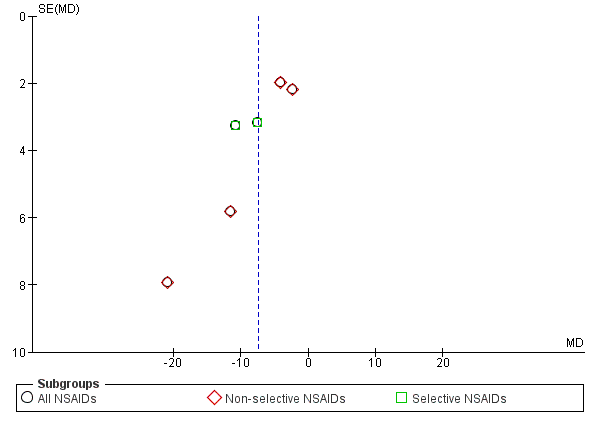
Funnel plot of comparison: 1 NSAIDs versus placebo, outcome: 1.1 Change in pain intensity from baseline on 100 mm VAS. Follow‐up ≤ 12 weeks.
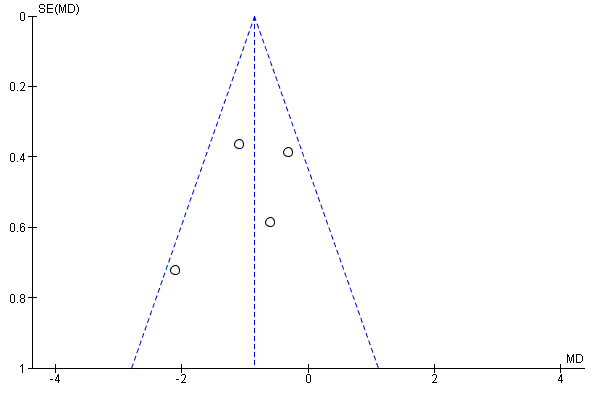
Funnel plot of comparison: 1 NSAIDs versus placebo, outcome: 1.2 Change in disability from baseline.
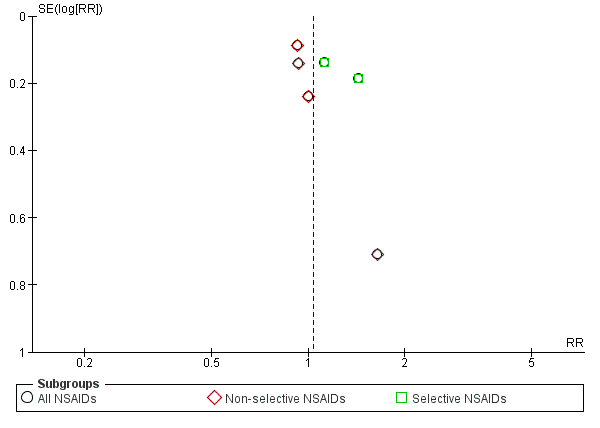
Funnel plot of comparison: 1 NSAIDs versus placebo, outcome: 1.3 Proportion of patients experiencing adverse events. Follow‐up ≤ 16 weeks.
Half of the included trials reported a potential conflict of interest. Three studies reported support from a pharmaceutical company (Birbara 2003; Hickey 1982; Zerbini 2005) and the authors of four RCTs had affiliations with a pharmaceutical company (Coats 2004; Katz 2011; Kivitz 2013; O'Donnell 2009). The remaining six RCTs did not report any potential conflict of interest.
Effects of interventions
See: Summary of findings for the main comparison NSAIDs for people with chronic low back pain
See: 'Summary of findings' table 1.
Efficacy of NSAIDs compared to placebo
Six RCTs compared NSAIDs with placebo (Allegrini 2009; Berry 1982; Birbara 2003; Coats 2004; Katz 2011; Kivitz 2013). Median follow‐up was 56 days (IQR 13 to 91 days). Three of these trials reported short‐term outcomes of four weeks or less (Allegrini 2009; Berry 1982; Coats 2004). The other three trials had a duration of follow‐up of 12 or 16 weeks (Birbara 2003; Katz 2011; Kivitz 2013). Naproxen was the most common type of NSAID (Berry 1982; Katz 2011; Kivitz 2013), but piroxicam patch, etoricoxib and valdecoxib were also compared to placebo.
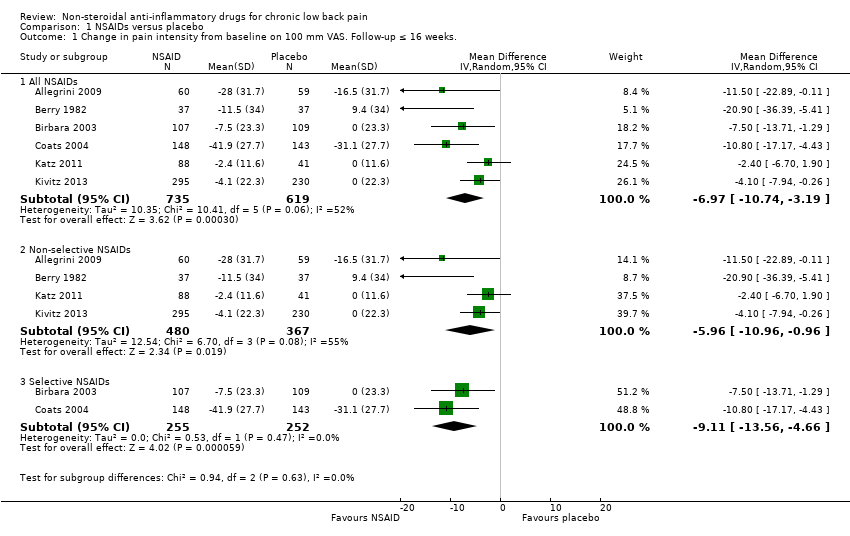
All RCTs reported pain intensity on a 100 mm VAS or 11‐point numerical rating scale (NRS). The Chi² value for homogeneity of the mean difference (MD) was 10.41 (P 0.06) and I² statistic 52%, which suggests substantial statistical heterogeneity. This might be due to different types of NSAIDs used in the trials and we used a random‐effects model to pool these data. The pooled mean difference in pain intensity score from baseline was −6.97 (95% CI −10.74 to −3.19; Analysis 1.1), indicating a statistically significant effect in favour of participants receiving NSAIDs compared to participants receiving placebo. The quality of this evidence was low (summary of findings Table for the main comparison). When we split results into selective and non‐selective NSAIDs versus placebo, there was still a substantial statistical heterogeneity among the trials considering non‐selective NSAIDs, although three out of four RCTs used naproxen as trial medication. There was statistical homogeneity among the trials on selective NSAIDs. The effect of selective NSAIDs was somewhat larger and the effect of non‐selective NSAIDs was smaller.
Four RCTs compared NSAIDs with placebo, with disability as outcome measure, measured with the Roland Morris Disability Questionnaire (RDQ) (Birbara 2003; Coats 2004; Katz 2011; Kivitz 2013) on a 0 to 24 scale. Median follow‐up was 84 days (IQR 42 to 105 days). The Chi² value for homogeneity of the mean difference (MD) was 5.53 (P = 0.14) and the I² statistic was 46%, indicating moderate statistical heterogeneity among these trials. The pooled mean difference in disability from baseline was −0.85 (95% CI −1.30 to −0.40; Analysis 1.2). The quality of this evidence was low ('Summary of findings' table 1).
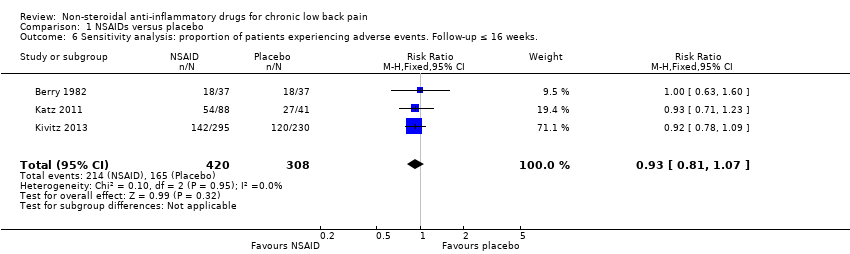
All trials also reported adverse events. The Chi² value for homogeneity of the RR for adverse events in all RCTs was 6.22 (P = 0.28) and the I² statistic value was 20%, indicating no statistical heterogeneity among the RCTs. The pooled RR for adverse events was 1.04 (95% CI 0.92 to 1.17; Analysis 1.3), indicating that adverse events were not statistically significant more present in participants using NSAIDs compared to placebo. Using the GRADE approach, we assessed the quality of evidence of these trials as low ('Summary of findings' table 1). Results did not change when we specified NSAIDs into selective and non‐selective NSAIDs, although adverse events in selective NSAIDs showed a trend in favour of placebo. However, RCTs have low power in detecting uncommon and delayed adverse events. The sample sizes of most included trials were relatively small and duration of follow‐up was relatively short. It is possible that not all adverse events had emerged, especially since most important adverse events are rare and can take weeks or months to present. Therefore, we cannot make firm statements about the difference in occurrence of adverse events between different NSAID types.
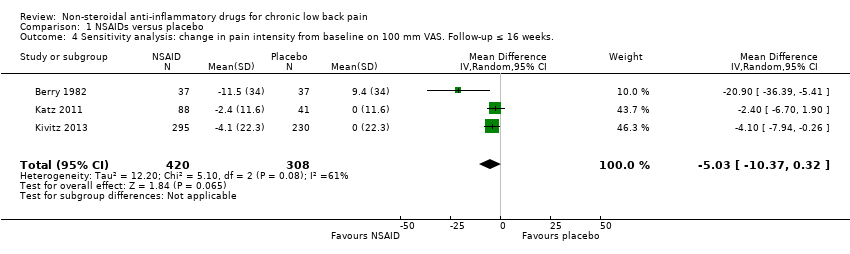
Of the trials that compared NSAIDs with placebo, we considered three trials at high risk of bias (Allegrini 2009; Birbara 2003; Coats 2004). The latter two trials used a 'flare design'. We performed a sensitivity analysis using the three RCTs which were at low risk of bias (Berry 1982; Katz 2011; Kivitz 2013). The difference between NSAIDs and placebo on pain intensity score (on 0 to 100 mm VAS) and the disability (measured with RDQ 0 to 24) became smaller and was no longer statistically significant; the difference in pain intensity score between NSAIDs and placebo was −5.03 (95% CI −10.37 to 0.32; Analysis 1.4) and for disability was −0.41 (95% CI −1.04 to 0.23; Analysis 1.5). We assessed the quality of evidence as moderate ('Summary of findings' table 1).
Efficacy of selective versus non‐selective NSAIDs and non‐selective versus non‐selective NSAIDs
Two small RCTs compared two types of non‐selective NSAIDs (Driessens 1994; Videman 1984). Driessens 1994 compared ibuprofen (1600 mg/day) and diclofenac (100 mg/day) for two weeks, Videman 1984 compared piroxicam (20 mg/day) and indomethacin (75 mg/day) for six weeks. Both trials found no significant difference between the two types of non‐selective NSAIDs. The number of adverse events in Driessens 1994 was statistically significant higher in the diclofenac group. In Videman 1984 there was no statistically significant difference in experienced adverse events between the two trial groups. One other RCT, Zerbini 2005, compared a non‐selective NSAID with a COX‐2 inhibitor (diclofenac 150 mg/day versus etoricoxib 60 mg/day for four weeks). This trial included 440 participants in the analysis and found no significant difference in change in pain intensity from baseline between the non‐selective NSAIDs and COX‐2 inhibitor. The trial also did not find any differences in adverse events in general and specific gastrointestinal adverse events between the two trial groups.
Efficacy of NSAIDs versus other drugs
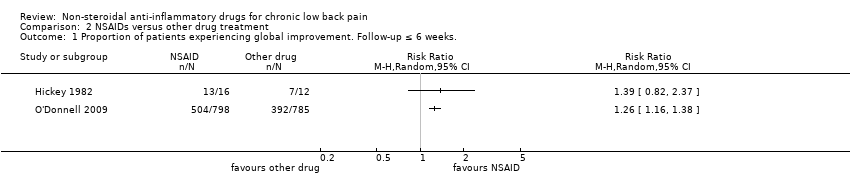
NSAIDs compared to other drug types are shown in Analysis 2.1 and Analysis 2.2. We did not pool these RCTs because the trials used different types of medication as comparison. Hickey 1982, which had with 30 participants, compared NSAIDs (diflunisal 1000 mg/day) with paracetamol (4000 mg/day). In this trial, NSAIDs were not significantly better than paracetamol and adverse events were not significantly more present in patients using NSAIDs compared to the other studied drugs.
O'Donnell 2009 included 1593 participants and compared NSAIDs (celecoxib 400 mg/day) with tramadol (200 mg/day) for six weeks. Results of global improvement (RR 1.26, 95% CI 1.16 to 1.38) and adverse events (RR 0.83, 95% CI 0.75 to 0.91) after six weeks both favoured celecoxib.
Romanò 2009 compared celecoxib with pregabalin and scored change in pain intensity from baseline to four weeks on a VAS score. There was no significant difference between the two trial groups and adverse events were similar in number in both celecoxib and pregabalin trial groups.
Efficacy of NSAIDs versus non‐drug treatment
One RCT, Shirado 2010, compared NSAIDs with 'home‐based exercise'. Improvement in functional status between baseline and eight weeks was significantly better in exercise participants then participants receiving NSAIDs, but there was no difference in pain intensity.
Discussion
Summary of main results
In this Cochrane review we included 13 RCTs that assessed NSAID efficacy for the management of chronic low back pain. Six trials comparing NSAIDs with placebo showed low quality evidence that NSAIDs are more effective than placebo, with a mean difference in pain intensity score from baseline of ‐6.97 (95% CI −10.74 to −3.19) on a 0 to 100 visual analogue scale (VAS) with a median follow‐up of 56 days (IQR 13 to 91 days). There is also low quality evidence that NSAIDs are more effective than placebo on disability, with a mean difference from baseline of −0.85 (95% CI −1.30 to −0.40) on a scale from 0 to 24 with a median follow‐up of 84 days (IQR 42 to 105 days). When only trials with low risk of bias were included in the analysis, the difference between NSAIDs and placebo was no longer significant. Adverse events were not significantly more present in the NSAIDs or placebo trial group, but this could be because we only included RCTs in this review, or the short duration of use and the short follow‐up period in most included trials.
Studies comparing non‐selective versus selective NSAIDs or comparing different types of non‐selective NSAIDs were also limited available. All three included RCTs showed no significant effect between the different NSAID types.
Whether NSAIDs are more effective than other drugs or non‐drug therapies for people with chronic low back pain remains unclear. A limited number of trials compared NSAIDs versus other drug treatments and all trials included different kind of drugs as comparator. One large RCT compared celecoxib to tramadol. Results of global improvement and adverse events were both in favour of celecoxib after six weeks.
Overall completeness and applicability of evidence
In this Cochrane review we used strict inclusion criteria regarding the duration of back pain, meaning that we only included trials that reported results on people with chronic low back pain. This means that fewer trials met the inclusion criteria of this Cochrane review, but it makes the review results more distinct for people with non‐specific chronic low back pain.
Two included trials used a 'flare design'. These trials included participants who responded well to NSAIDs when they showed a worsening in back pain during a wash‐out period. As these participants already responded well to NSAIDs, these trials are likely to have overestimated the effect of NSAIDs. It may also reduce the external validity since this is a select group of participants. When we excluded these RCTs from the analysis together with one other trial with a high risk of bias, the results changed. The magnitude of effect of NSAIDs became smaller and the difference was not statistically significant anymore.
Some included trials operationalized outcomes differently and not all trials included disability as outcome. None of the included trials mentioned return to work or other work outcomes, although this might be an important outcome in patients with chronic low back pain.
Almost all included RCTs mentioned adverse events. Most trials reported the overall number of adverse events, and some trials also mentioned specific gastrointestinal adverse events. Cardiovascular adverse events are rarely mentioned. However, these trials were powered to investigate treatment effects of the primary outcomes. As most important adverse events are rare and can take weeks or months to evolve, it is likely that sample sizes of these trials were too small and follow‐up periods too short to draw clear conclusions from these trials regarding the risks for gastrointestinal and other adverse events of NSAIDs.
Quality of the evidence
Three included RCTs were considered high risk of bias. Even in the 10 other RCTs with low risk of bias other methodological shortcomings were present, such as no clear description of the randomization procedure, high drop‐out rates and low or unclear compliance in the trial groups. Uncertain or low compliance makes it difficult to interpret the measured effect in the study and can both under‐ and overestimate the results found. The level of evidence, which we assessed using the GRADE approach, was low due to similar issues. The most common reasons for downgrading evidence were 'risk of bias' and 'imprecision' for the included trials.
Most trials had a follow‐up period of at least four weeks, and only three trials had follow‐up periods of less than four weeks (ranging from nine days to two weeks). NSAIDs are usually used for a short period of time. This short follow up period might not have consequences on our results, since effects are expected shortly after the start of the NSAIDs. Although it is difficult due to this short follow‐up period to assess adverse events.
Included RCTs had different trial population sizes; four trials included less than 50 participants and may lack statistical power to detect differences in effects. Pooling may overcome this problem. However, the most important question is whether the effect is clinically relevant. The main finding that NSAIDs are more effective than placebo on pain intensity was based on a meta‐analysis that showed a mean difference of 3.30 on a 0 to 100 scale. Although statistically significant, one could argue that this effect is too small to be clinically relevant.
A sensitivity analysis with a moderate quality of evidence showed that the positive effect of NSAIDs compared to placebo was reduced and no longer statistically significant when we only included RCTs in the analysis that were of low risk of bias.
Potential biases in the review process
We only included trials published in English, German or Dutch, which could have led to the exclusion of trials published in other languages from this Cochrane review. Reports on language bias show conflicting results (Higgins 2011; Jüni 2002; Moher 2003). It is not to be expected that inclusion of articles written in other languages will change the results in this review, especially since there seems to be a shift in publishing more articles in English and less frequent in other languages (Galandi 2006; Higgins 2011).
Only one review author extracted data and the second review author checked the extracted data. This could have led to a higher risk of error in data extraction.
Different types and chemical entities of NSAIDs are available, which makes it difficult to compare different NSAIDs. Regarding the comparison of NSAIDs versus placebo, we included both selective and non‐selective NSAIDs. An analysis of two separate comparisons showed no differences in directions of the findings when we compared selective and non‐selective NSAIDs separately with placebo.
Publication bias may have occurred, but this was difficult to assess due to the limited number of included trials. In particular the comparisons of different NSAID types or NSAIDs compared to other types of drugs we could not examine publication bias using a funnel plot. Half of the included trials were supported by or included authors from pharmaceutical companies. Clinical trials sponsored by pharmaceutical companies are less likely to be published and are more likely to have outcomes in favour of the sponsor (Lexchin 2003), which could have caused publication bias. Even when publication bias would have occurred, this will not change the found results. The found effect is already very small and not clinically relevant.
Agreements and disagreements with other studies or reviews
In the previous version of this Cochrane review, Roelofs 2008, we studied NSAIDs for people with sciatica, acute and chronic low back pain based on literature published from September 1998 to June 2007. These trials found a change in pain intensity in favour of NSAIDs compared to placebo. In this review update we found similar results, but the magnitude of the results in our review was smaller than found in Roelofs 2008. Adverse events were statistically more present in the NSAID group in Roelofs 2008, but we did not find a statistically significant difference in our review. Most trials included in this Cochrane review had a small sample size or short‐time follow‐up, or both, and were not suited to evaluate adverse events. A large meta‐analysis on adverse events in RCTs (CNT Collaboration 2013) and observational data (Castellsague 2012) showed that adverse events are more present in participants using NSAIDs compared to placebo.
After 2008, several systematic reviews were published regarding NSAIDs as a therapeutic option in treating people with chronic low back pain. Pain scores between NSAIDs and placebo were often reported. In 2013, a review on NSAIDs showed that COX‐2 selective NSAIDs were significantly more effective in reducing VAS score and disability measured with RDQ (Chung 2013). Four studies were included in Chung's analysis, of which we did not include two in this Cochrane review. We excluded one trial, Pallay 2004, from the previous version of this review because it is additional information to an earlier reported study that was already included in the review (Birbara 2003). Including both would lead to double counting. The other study, Katz 2003, reported on rofecoxib and was excluded from this review because it was withdrawn from the market. Kuijpers 2011 found similar results to Chung 2013 and concluded that there is low quality evidence that NSAIDs are more effective than placebo. This is comparable to findings in this Cochrane review. Chung 2013 also assessed disability and results were comparable to our findings..
Chung 2013 also evaluated selective and non‐selective NSAIDs and found no differences in efficacy between these two groups. Two studies were analysed in the review; one of those was also examined in this review and found the same results. We excluded the other study used in Chung 2013 from this Cochrane review because it included rofecoxib.

study flow diagram.

'Risk of bias' summary: review authors' judgements about each 'Risk of bias' item for each included trial.

'Risk of bias' graph: review authors' judgements about each 'Risk of bias' item presented as percentages across all included trials.

Funnel plot of comparison: 1 NSAIDs versus placebo, outcome: 1.1 Change in pain intensity from baseline on 100 mm VAS. Follow‐up ≤ 12 weeks.

Funnel plot of comparison: 1 NSAIDs versus placebo, outcome: 1.2 Change in disability from baseline.

Funnel plot of comparison: 1 NSAIDs versus placebo, outcome: 1.3 Proportion of patients experiencing adverse events. Follow‐up ≤ 16 weeks.
Comparison 1 NSAIDs versus placebo, Outcome 1 Change in pain intensity from baseline on 100 mm VAS. Follow‐up ≤ 16 weeks..

Comparison 1 NSAIDs versus placebo, Outcome 2 Change in disability from baseline.

Comparison 1 NSAIDs versus placebo, Outcome 3 Proportion of patients experiencing adverse events. Follow‐up ≤ 16 weeks..
Comparison 1 NSAIDs versus placebo, Outcome 4 Sensitivity analysis: change in pain intensity from baseline on 100 mm VAS. Follow‐up ≤ 16 weeks..

Comparison 1 NSAIDs versus placebo, Outcome 5 Sensitivity analysis: change in disability from baseline.
Comparison 1 NSAIDs versus placebo, Outcome 6 Sensitivity analysis: proportion of patients experiencing adverse events. Follow‐up ≤ 16 weeks..
Comparison 2 NSAIDs versus other drug treatment, Outcome 1 Proportion of patients experiencing global improvement. Follow‐up ≤ 6 weeks..

Comparison 2 NSAIDs versus other drug treatment, Outcome 2 Proportion of patients experiencing adverse events. Follow‐up ≤ 6 weeks..
| NSAIDs for people with chronic low back pain compared to placebo | |||||
| Participant or population: people with chronic low back pain | |||||
| Outcomes | Illustrative comparative risks* (95% CI) | Relative effect | Number of participants | Quality of the evidence | |
| Assumed risk | Corresponding risk | ||||
| Control | NSAIDs | ||||
| Change in pain intensity from baseline | Not estimable | The mean change in pain intensity from baseline in the intervention groups was | ‐ | 1354 | ⊕⊕⊝⊝ |
| Change in disability from baseline | Not estimable | The mean change in disability from baseline in the intervention groups was | ‐ | 1161 | ⊕⊕⊝⊝ |
| Proportion of participants experiencing adverse events | Study population | RR 1.04 | 1354 | ⊕⊕⊝⊝ | |
| 410 per 1000 | 427 per 1000 | ||||
| Moderate | |||||
| 477 per 1000 | 496 per 1000 | ||||
| Sensitivity analysis: change in pain intensity from baseline | Not estimable | The mean sensitivity analysis change in pain intensity from baseline. in the intervention groups was | ‐ | 728 | ⊕⊕⊕⊝ |
| Sensitivity analysis: change in disability from baseline | Not estimable | The mean sensitivity analysis change in disability from baseline in the intervention groups was | ‐ | 654 | ⊕⊕⊕⊝ |
| Sensitivity analysis: proportion of participants experiencing adverse events. Follow‐up ≤ 16 weeks | Study population | RR 0.93 | 728 | ⊕⊕⊕⊝ | |
| 536 per 1000 | 498 per 1000 | ||||
| Moderate | |||||
| 522 per 1000 | 485 per 1000 | ||||
| *The basis for the assumed risk (e.g. the median control group risk across studies) is provided in footnotes. The corresponding risk (and its 95% CI) is based on the assumed risk in the comparison group and the relative effect of the intervention (and its 95% CI). | |||||
| GRADE Working Group grades of evidence | |||||
| 1Allocation concealment was uncertain in most included trials, and randomization was uncertain in half of the included trials, therefore selection bias is likely. Five out of six trials had high drop‐out rates, so attrition bias is likely, one level downgrade. | |||||
| Outcome or subgroup title | No. of studies | No. of participants | Statistical method | Effect size |
| 1 Change in pain intensity from baseline on 100 mm VAS. Follow‐up ≤ 16 weeks. Show forest plot | 6 | Mean Difference (IV, Random, 95% CI) | Subtotals only | |
| 1.1 All NSAIDs | 6 | 1354 | Mean Difference (IV, Random, 95% CI) | ‐6.97 [‐10.74, ‐3.19] |
| 1.2 Non‐selective NSAIDs | 4 | 847 | Mean Difference (IV, Random, 95% CI) | ‐5.96 [‐10.96, ‐0.96] |
| 1.3 Selective NSAIDs | 2 | 507 | Mean Difference (IV, Random, 95% CI) | ‐9.11 [‐13.56, ‐4.66] |
| 2 Change in disability from baseline Show forest plot | 4 | 1161 | Mean Difference (IV, Fixed, 95% CI) | ‐0.85 [‐1.30, ‐0.40] |
| 3 Proportion of patients experiencing adverse events. Follow‐up ≤ 16 weeks. Show forest plot | 6 | Risk Ratio (M‐H, Fixed, 95% CI) | Subtotals only | |
| 3.1 All NSAIDs | 6 | 1354 | Risk Ratio (M‐H, Fixed, 95% CI) | 1.04 [0.92, 1.17] |
| 3.2 Non‐selective NSAIDs | 4 | 847 | Risk Ratio (M‐H, Fixed, 95% CI) | 0.94 [0.82, 1.08] |
| 3.3 Selective NSAIDs | 2 | 507 | Risk Ratio (M‐H, Fixed, 95% CI) | 1.25 [1.00, 1.56] |
| 4 Sensitivity analysis: change in pain intensity from baseline on 100 mm VAS. Follow‐up ≤ 16 weeks. Show forest plot | 3 | 728 | Mean Difference (IV, Random, 95% CI) | ‐5.03 [‐10.37, 0.32] |
| 5 Sensitivity analysis: change in disability from baseline Show forest plot | 2 | 654 | Mean Difference (IV, Fixed, 95% CI) | ‐0.41 [‐1.04, 0.23] |
| 6 Sensitivity analysis: proportion of patients experiencing adverse events. Follow‐up ≤ 16 weeks. Show forest plot | 3 | 728 | Risk Ratio (M‐H, Fixed, 95% CI) | 0.93 [0.81, 1.07] |
| Outcome or subgroup title | No. of studies | No. of participants | Statistical method | Effect size |
| 1 Proportion of patients experiencing global improvement. Follow‐up ≤ 6 weeks. Show forest plot | 2 | Risk Ratio (M‐H, Random, 95% CI) | Totals not selected | |
| 2 Proportion of patients experiencing adverse events. Follow‐up ≤ 6 weeks. Show forest plot | 3 | Risk Ratio (M‐H, Random, 95% CI) | Totals not selected | |