Ejercicios de control motor para el dolor lumbar agudo inespecífico
Información
- DOI:
- https://doi.org/10.1002/14651858.CD012085Copiar DOI

- Base de datos:
-
- Cochrane Database of Systematic Reviews
- Versión publicada:
-
- 10 febrero 2016see what's new
- Tipo:
-
- Intervention
- Etapa:
-
- Review
- Grupo Editorial Cochrane:
-
Grupo Cochrane de Espalda y cuello
- Copyright:
-
- Copyright © 2016 The Cochrane Collaboration. Published by John Wiley & Sons, Ltd.
Cifras del artículo
Altmetric:
Citado por:
Autores
Contributions of authors
Luciana Gazzi Macedo, Bruno Tirotti Saragiotto, Leonardo Costa, Luciola Menezes Costa and Chris Maher selected all studies for inclusion. Bruno Tirotti Saragiotto and Tiê Parma Yamato assessed risk of bias of the articles and extracted and analysed study data. All other review authors contributed to writing of the protocol and writing and editing of the review.
Sources of support
Internal sources
-
None, Other.
External sources
-
None, Other.
Declarations of interest
None known.
Acknowledgements
The authors would like to thank institutions providing funding to the authors of this review. Dr Luciana G Macedo is supported by the Canadian Institutes of Health Research and the Alberta Innovates Health Solutions. Professor Chris Maher is supported by a National Health and Medical Research Council Fellowship. Bruno T Saragiotto is supported by CNPQ (Conselho Nacional de Desenvolvimento Científico e Tecnológico), in Brazil, and Tiê P Yamato is supported by CAPES (Coordenacção de Aperfeiçoamento de Pessoal de Nível Superior), also in Brazil.
Version history
| Published | Title | Stage | Authors | Version |
| 2016 Feb 10 | Motor control exercise for acute non‐specific low back pain | Review | Luciana G Macedo, Bruno T Saragiotto, Tiê P Yamato, Leonardo OP Costa, Luciola C Menezes Costa, Raymond WJG Ostelo, Christopher G Maher | |
Differences between protocol and review
No previous protocol published.
Keywords
MeSH
Medical Subject Headings (MeSH) Keywords
Medical Subject Headings Check Words
Humans;
PICO
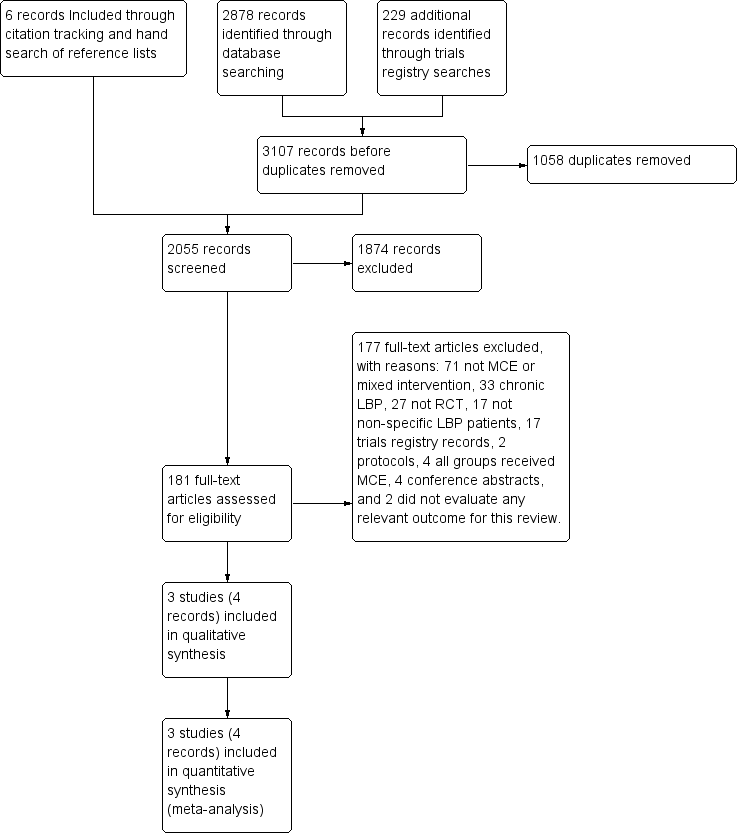
Study flow diagram.

Risk of bias summary: review authors' judgements about each risk of bias item for each included study.

Forest plot of comparison: 2 Motor control exercise vs other exercises, outcome: 2.1 Pain.
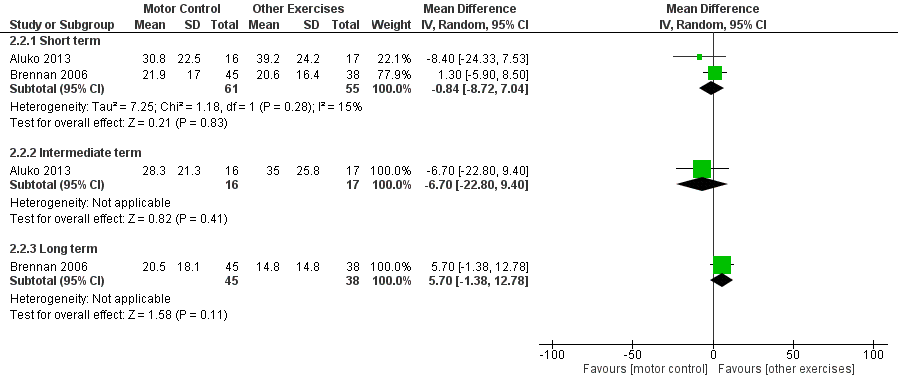
Forest plot of comparison: 2 Motor control exercise vs other exercises, outcome: 2.2 Disability.

Comparison 1 Motor control exercise vs spinal manipulative therapy, Outcome 1 Pain.
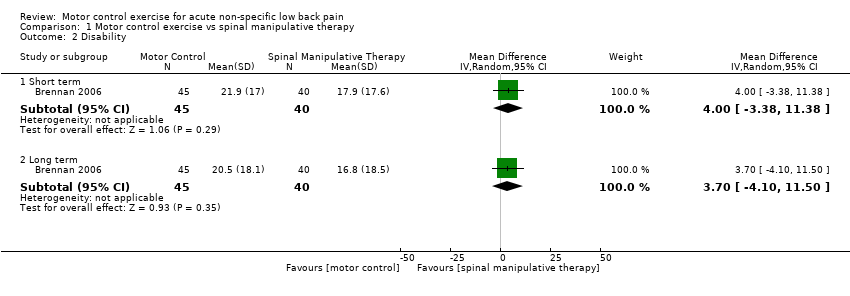
Comparison 1 Motor control exercise vs spinal manipulative therapy, Outcome 2 Disability.

Comparison 2 Motor control exercise vs other exercises, Outcome 1 Pain.
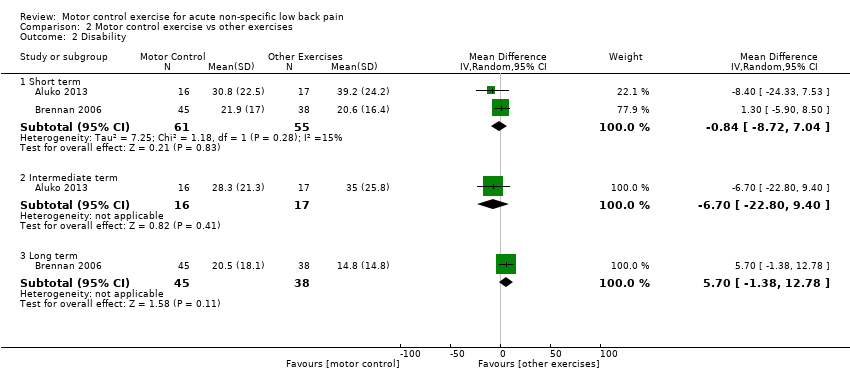
Comparison 2 Motor control exercise vs other exercises, Outcome 2 Disability.
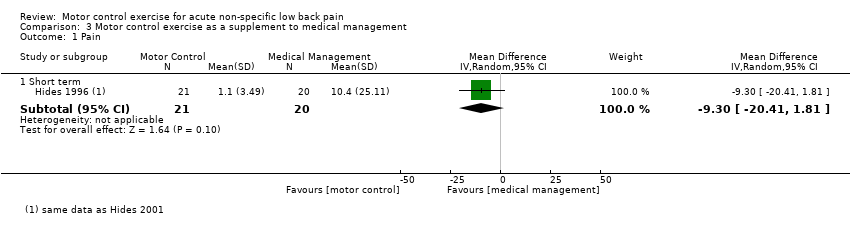
Comparison 3 Motor control exercise as a supplement to medical management, Outcome 1 Pain.
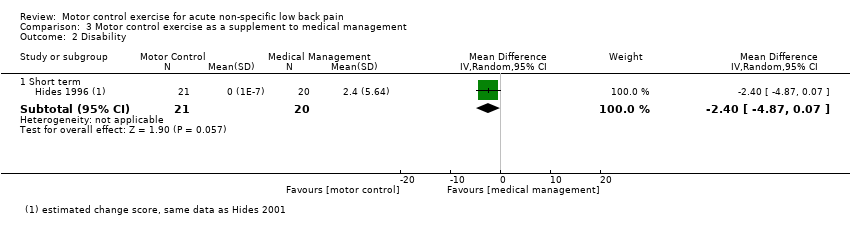
Comparison 3 Motor control exercise as a supplement to medical management, Outcome 2 Disability.

Comparison 3 Motor control exercise as a supplement to medical management, Outcome 3 Recurrence.
| Motor control exercise vs spinal manipulative therapy for acute low back pain | ||||
| Patient or population: patients with acute low back pain Settings: primary or tertiary care Intervention: motor control exercise Comparison: spinal manipulative therapy | ||||
| Outcomes | Illustrative comparative risks* (95% CI) | Number of participants | Quality of the evidence | |
| Assumed risk | Corresponding risk | |||
| Spinal manipulative therapy | Motor control exercise | |||
| Pain VAS (0 to 100) Follow‐up: short term (< 3 months from randomisation) | Mean pain in the control group was 15 points | Mean pain in the intervention group was 9 points higher (1.56 lower to 19.56 higher) | 58 participants (1 study) | ⊕⊕⊝⊝ |
| Disability Oswestry Disability Index (0 to 100) Follow‐up: short term (< 3 months from randomisation) | Mean disability in the control group was 17.9 points | Mean disability in the intervention group was 4 points higher (3.38 lower to 11.38 higher) | 85 participants | ⊕⊕⊝⊝ |
| Disability Oswestry Disability Index (0 to 100) Follow‐up: intermediate term (> 3 months, < 12 months) | Mean disability in the control group was 16.8 points | Mean disability in the intervention group was 3.7 points higher (4.10 lower to 11.50 higher) | 85 participants | ⊕⊕⊝⊝ |
| Adverse events None of the included studies evaluated adverse events | Not reported | Not reported | ||
| *The basis for the assumed risk (e.g. median control group risk across studies) is provided in footnotes. The corresponding risk (and its 95% confidence interval) is based on the assumed risk in the comparison group and the relative effect of the intervention (and its 95% CI) | ||||
| GRADE Working Group grades of evidence | ||||
| aDowngraded for imprecision bDowngraded for inconsistency | ||||
| Motor control exercise vs other exercises for acute low back pain | ||||
| Patient or population: patients with acute low back pain Settings: primary or tertiary care Intervention: motor control exercise Comparison: other exercises | ||||
| Outcomes | Illustrative comparative risks* (95% CI) | Number of participants | Quality of the evidence | |
| Assumed risk | Corresponding risk | |||
| Other exercises | Motor control exercise | |||
| Pain VAS (0 to 100) Follow‐up: short term (< 3 months from randomisation) | Mean pain ranged across control groups from | Mean pain in the intervention groups was 5.74 points higher (3.34 lower to 14.82 higher) | 89 participants | ⊕⊕⊕⊝ |
| Pain VAS (0 to 100) Follow‐up: intermediate term (> 3 months, < 12 months) | Mean pain in the control group was | Mean pain in the intervention groups was 1.2 points lower (18.24 lower to 15.84 higher) | 33 participants | ⊕⊕⊝⊝ |
| Disability Multiple scales (transformed 0 to 100) Follow‐up: short term (< 3 months from randomisation) | Mean disability ranged across control groups from | Mean disability in the intervention groups was 0.84 points lower (8.72 lower to 7.04 higher) | 116 participants | ⊕⊕⊕⊝ |
| Disability Roland Morris Disability Questionnaire (transformed 0 to 100) Follow‐up: intermediate term (> 3 months, < 12 months) | Mean disability in the control group was | Mean disability in the intervention groups was 6.70 points lower (22.80 lower to 9.40 higher) | 33 participants | ⊕⊕⊝⊝ |
| Disability Oswestry Disability Index (0 to 100) Follow‐up: long term (< 3 months after randomisation) | Mean disability in the control group was 20.5 | Mean disability in the intervention groups was (1.38 lower to 12.78 higher] | 83 participants | ⊕⊕⊝⊝ |
| Adverse events None of the included studies evaluated adverse events | Not reported | not reported | ||
| *The basis for the assumed risk (e.g. median control group risk across studies) is provided in footnotes. The corresponding risk (and its 95% confidence interval) is based on the assumed risk in the comparison group and the relative effect of the intervention (and its 95% CI) | ||||
| GRADE Working Group grades of evidence | ||||
| aDowngraded for imprecision bDowngraded for inconsistency | ||||
| Motor control exercise as a supplement to medical management for patients with acute low back pain | |||||
| Patient or population: patients with acute LBP Settings: primary or tertiary care Intervention: motor control exercise Comparison: medical management | |||||
| Outcomes | Illustrative comparative risks* (95% CI) | Relative effect | Number of participants | Quality of the evidence | |
| Assumed risk | Corresponding risk | ||||
| Medical management | Motor control exercise | ||||
| Pain VAS (0 to 100) Follow‐up: short term (< 3 months from randomisation) | Mean pain in the control group was | Mean pain in the intervention group was 9.30 points lower (20.41 lower to 1.81 higher) | 41 participants | ⊕⊕⊝⊝ | |
| Disability Roland Morris Disability Questionnaire (transformed 0 to 100) Follow‐up: short term (< 3 months from randomisation) | Mean disability in the control group was 2.4 | Mean disability in the intervention group was (4.87 lower to 0.07 higher) | 41 participants | ⊕⊕⊝⊝ | |
| Recurrence Follow‐up: long term (1 year) | 16 of 19 | 6 of 20 | RR 0.36 (0.18 to 0.72) | 39 participants (1 study) | ⊕⊕⊝⊝ |
| Adverse events None of the included studies evaluated adverse events | Not reported | Not reported | |||
| *The basis for the assumed risk (e.g. median control group risk across studies) is provided in footnotes. The corresponding risk (and its 95% confidence interval) is based on the assumed risk in the comparison group and the relative effect of the intervention (and its 95% CI) | |||||
| GRADE Working Group grades of evidence | |||||
| aDowngraded for imprecision bDowngraded for inconsistency cDowngraded for high risk of bias | |||||
| Outcome or subgroup title | No. of studies | No. of participants | Statistical method | Effect size |
| 1 Pain Show forest plot | 1 | Mean Difference (IV, Random, 95% CI) | Subtotals only | |
| 1.1 Short term | 1 | 58 | Mean Difference (IV, Random, 95% CI) | 9.0 [‐1.56, 19.56] |
| 2 Disability Show forest plot | 1 | Mean Difference (IV, Random, 95% CI) | Subtotals only | |
| 2.1 Short term | 1 | 85 | Mean Difference (IV, Random, 95% CI) | 4.0 [‐3.38, 11.38] |
| 2.2 Long term | 1 | 85 | Mean Difference (IV, Random, 95% CI) | 3.70 [‐4.10, 11.50] |
| Outcome or subgroup title | No. of studies | No. of participants | Statistical method | Effect size |
| 1 Pain Show forest plot | 2 | Mean Difference (IV, Random, 95% CI) | Subtotals only | |
| 1.1 Short term | 2 | 89 | Mean Difference (IV, Random, 95% CI) | 5.74 [‐3.34, 14.82] |
| 1.2 Intermediate term | 1 | 33 | Mean Difference (IV, Random, 95% CI) | ‐1.20 [‐18.24, 15.84] |
| 2 Disability Show forest plot | 2 | Mean Difference (IV, Random, 95% CI) | Subtotals only | |
| 2.1 Short term | 2 | 116 | Mean Difference (IV, Random, 95% CI) | ‐0.84 [‐8.72, 7.04] |
| 2.2 Intermediate term | 1 | 33 | Mean Difference (IV, Random, 95% CI) | ‐6.70 [‐22.80, 9.40] |
| 2.3 Long term | 1 | 83 | Mean Difference (IV, Random, 95% CI) | 5.70 [‐1.38, 12.78] |
| Outcome or subgroup title | No. of studies | No. of participants | Statistical method | Effect size |
| 1 Pain Show forest plot | 1 | Mean Difference (IV, Random, 95% CI) | Subtotals only | |
| 1.1 Short term | 1 | 41 | Mean Difference (IV, Random, 95% CI) | ‐9.3 [‐20.41, 1.81] |
| 2 Disability Show forest plot | 1 | Mean Difference (IV, Random, 95% CI) | Subtotals only | |
| 2.1 Short term | 1 | 41 | Mean Difference (IV, Random, 95% CI) | ‐2.4 [‐4.87, 0.07] |
| 3 Recurrence Show forest plot | 1 | Risk Ratio (M‐H, Random, 95% CI) | Subtotals only | |
| 3.1 Long term | 1 | 39 | Risk Ratio (M‐H, Random, 95% CI) | 0.36 [0.18, 0.72] |