Scolaris Content Display Scolaris Content Display

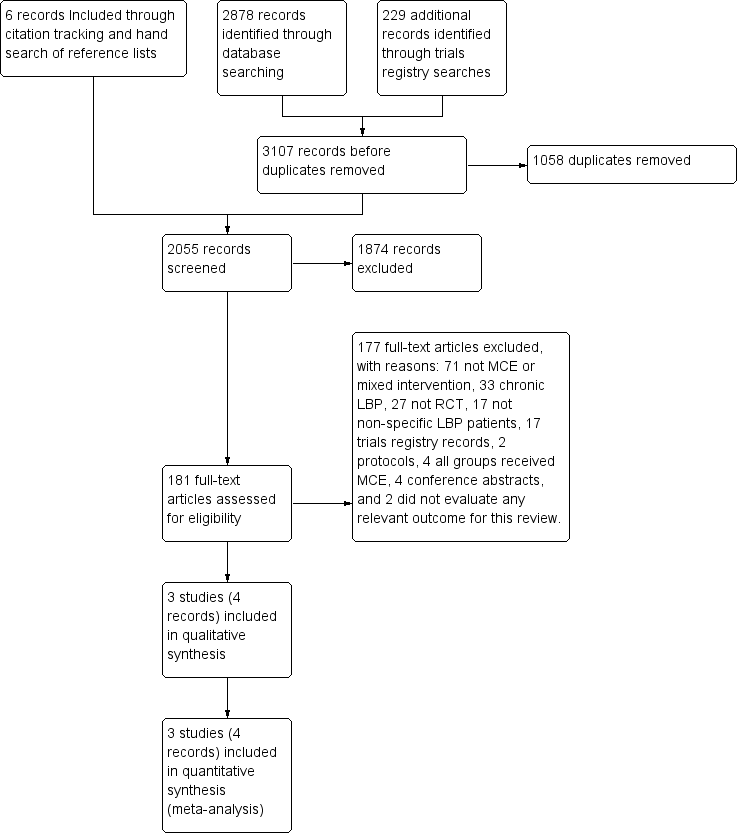
Study flow diagram.
Figuras y tablas -
Figure 1

Study flow diagram.

Risk of bias summary: review authors' judgements about each risk of bias item for each included study.
Figuras y tablas -
Figure 2

Risk of bias summary: review authors' judgements about each risk of bias item for each included study.

Forest plot of comparison: 2 Motor control exercise vs other exercises, outcome: 2.1 Pain.
Figuras y tablas -
Figure 3

Forest plot of comparison: 2 Motor control exercise vs other exercises, outcome: 2.1 Pain.

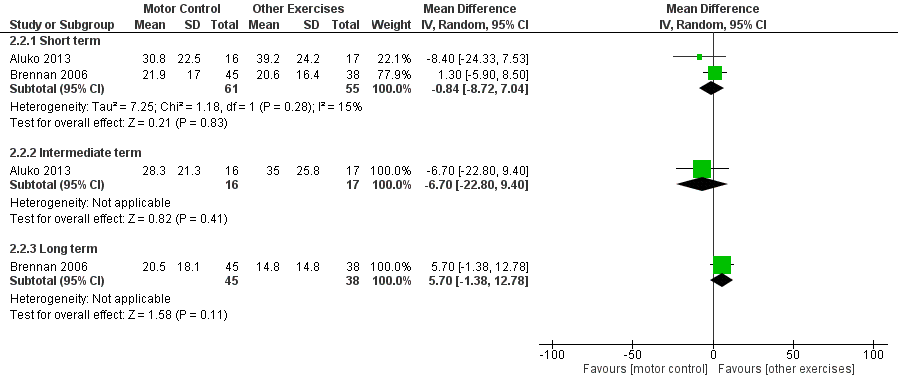
Forest plot of comparison: 2 Motor control exercise vs other exercises, outcome: 2.2 Disability.
Figuras y tablas -
Figure 4

Forest plot of comparison: 2 Motor control exercise vs other exercises, outcome: 2.2 Disability.

Comparison 1 Motor control exercise vs spinal manipulative therapy, Outcome 1 Pain.
Figuras y tablas -
Analysis 1.1

Comparison 1 Motor control exercise vs spinal manipulative therapy, Outcome 1 Pain.

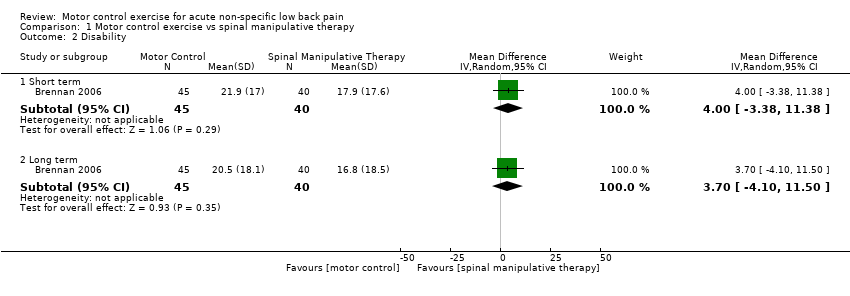
Comparison 1 Motor control exercise vs spinal manipulative therapy, Outcome 2 Disability.
Figuras y tablas -
Analysis 1.2

Comparison 1 Motor control exercise vs spinal manipulative therapy, Outcome 2 Disability.

Comparison 2 Motor control exercise vs other exercises, Outcome 1 Pain.
Figuras y tablas -
Analysis 2.1

Comparison 2 Motor control exercise vs other exercises, Outcome 1 Pain.

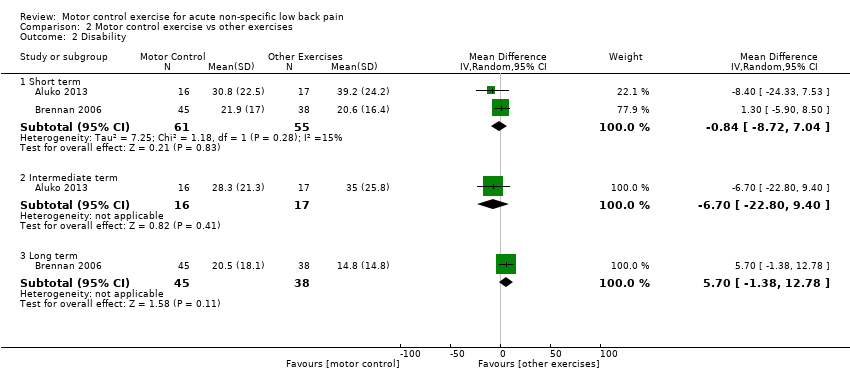
Comparison 2 Motor control exercise vs other exercises, Outcome 2 Disability.
Figuras y tablas -
Analysis 2.2

Comparison 2 Motor control exercise vs other exercises, Outcome 2 Disability.

Comparison 3 Motor control exercise as a supplement to medical management, Outcome 1 Pain.
Figuras y tablas -
Analysis 3.1

Comparison 3 Motor control exercise as a supplement to medical management, Outcome 1 Pain.

Comparison 3 Motor control exercise as a supplement to medical management, Outcome 2 Disability.
Figuras y tablas -
Analysis 3.2

Comparison 3 Motor control exercise as a supplement to medical management, Outcome 2 Disability.

Comparison 3 Motor control exercise as a supplement to medical management, Outcome 3 Recurrence.
Figuras y tablas -
Analysis 3.3

Comparison 3 Motor control exercise as a supplement to medical management, Outcome 3 Recurrence.

Motor control exercise vs spinal manipulative therapy for acute low back pain

Patient or population: patients with acute low back pain

Settings: primary or tertiary care

Intervention: motor control exercise

Comparison: spinal manipulative therapy

Outcomes

Illustrative comparative risks* (95% CI)

Number of participants
(studies)

Quality of the evidence
(GRADE)

Assumed risk

Corresponding risk

Spinal manipulative therapy

Motor control exercise

Pain

VAS (0 to 100)

Follow‐up: short term (< 3 months from randomisation)

Mean pain in the control group was

15 points

Mean pain in the intervention group was

9 points higher

(1.56 lower to 19.56 higher)

58 participants

(1 study)

⊕⊕⊝⊝
Lowa,b

Disability

Oswestry Disability Index (0 to 100)

Follow‐up: short term (< 3 months from randomisation)

Mean disability in the control group was

17.9 points

Mean disability in the intervention group was

4 points higher

(3.38 lower to 11.38 higher)

85 participants
(1 study)

⊕⊕⊝⊝
Lowa,b

Disability

Oswestry Disability Index (0 to 100)

Follow‐up: intermediate term (> 3 months, < 12 months)

Mean disability in the control group was

16.8 points

Mean disability in the intervention group was

3.7 points higher

(4.10 lower to 11.50 higher)

85 participants
(1 study)

⊕⊕⊝⊝
Lowa,b

Adverse events

None of the included studies evaluated adverse events

Not reported

Not reported

*The basis for the assumed risk (e.g. median control group risk across studies) is provided in footnotes. The corresponding risk (and its 95% confidence interval) is based on the assumed risk in the comparison group and the relative effect of the intervention (and its 95% CI)
CI: Confidence interval

GRADE Working Group grades of evidence
High quality: Further research is very unlikely to change our confidence in the estimate of effect
Moderate quality: Further research is likely to have an important impact on our confidence in the estimate of effect and may change the estimate
Low quality: Further research is very likely to have an important impact on our confidence in the estimate of effect and is likely to change the estimate
Very low quality: We are very uncertain about the estimate

aDowngraded for imprecision

bDowngraded for inconsistency

Figuras y tablas -

Motor control exercise vs other exercises for acute low back pain

Patient or population: patients with acute low back pain

Settings: primary or tertiary care

Intervention: motor control exercise

Comparison: other exercises

Outcomes

Illustrative comparative risks* (95% CI)

Number of participants
(studies)

Quality of the evidence
(GRADE)

Assumed risk

Corresponding risk

Other exercises

Motor control exercise

Pain

VAS (0 to 100)

Follow‐up: short term (< 3 months from randomisation)

Mean pain ranged across control groups from
18 to 26.7 points

Mean pain in the intervention groups was

5.74 points higher

(3.34 lower to 14.82 higher)

89 participants
(2 studies)

⊕⊕⊕⊝
Moderatea

Pain

VAS (0 to 100)

Follow‐up: intermediate term (> 3 months, < 12 months)

Mean pain in the control group was
27.1 points

Mean pain in the intervention groups was

1.2 points lower

(18.24 lower to 15.84 higher)

33 participants
(1 study)

⊕⊕⊝⊝
Lowa,b

Disability

Multiple scales (transformed 0 to 100)

Follow‐up: short term (< 3 months from randomisation)

Mean disability ranged across control groups from
20.6 to 39.2 points

Mean disability in the intervention groups was

0.84 points lower

(8.72 lower to 7.04 higher)

116 participants
(2 studies)

⊕⊕⊕⊝
Moderatea

Disability

Roland Morris Disability Questionnaire (transformed 0 to 100)

Follow‐up: intermediate term (> 3 months, < 12 months)

Mean disability in the control group was
28.3 points

Mean disability in the intervention groups was

6.70 points lower

(22.80 lower to 9.40 higher)

33 participants
(1 study)

⊕⊕⊝⊝
Lowa,b

Disability

Oswestry Disability Index (0 to 100)

Follow‐up: long term (< 3 months after randomisation)

Mean disability in the control group was

20.5

Mean disability in the intervention groups was
5.70 points higher

(1.38 lower to 12.78 higher]

83 participants
(1 study)

⊕⊕⊝⊝
Lowa,b

Adverse events

None of the included studies evaluated adverse events

Not reported

not reported

*The basis for the assumed risk (e.g. median control group risk across studies) is provided in footnotes. The corresponding risk (and its 95% confidence interval) is based on the assumed risk in the comparison group and the relative effect of the intervention (and its 95% CI)
CI: Confidence interval

GRADE Working Group grades of evidence
High quality: Further research is very unlikely to change our confidence in the estimate of effect
Moderate quality: Further research is likely to have an important impact on our confidence in the estimate of effect and may change the estimate
Low quality: Further research is very likely to have an important impact on our confidence in the estimate of effect and is likely to change the estimate
Very low quality: We are very uncertain about the estimate

aDowngraded for imprecision

bDowngraded for inconsistency

Figuras y tablas -

Motor control exercise as a supplement to medical management for patients with acute low back pain

Patient or population: patients with acute LBP

Settings: primary or tertiary care

Intervention: motor control exercise

Comparison: medical management

Outcomes

Illustrative comparative risks* (95% CI)

Relative effect
(95% CI)

Number of participants
(studies)

Quality of the evidence
(GRADE)

Assumed risk

Corresponding risk

Medical management

Motor control exercise

Pain

VAS (0 to 100)

Follow‐up: short term (< 3 months from randomisation)

Mean pain in the control group was
10.4

Mean pain in the intervention group was

9.30 points lower

(20.41 lower to 1.81 higher)

41 participants
(1 study)

⊕⊕⊝⊝
Very lowa,b,c

Disability

Roland Morris Disability Questionnaire (transformed 0 to 100)

Follow‐up: short term (< 3 months from randomisation)

Mean disability in the control group was

2.4

Mean disability in the intervention group was
2.40 points lower

(4.87 lower to 0.07 higher)

41 participants
(1 study)

⊕⊕⊝⊝
Very lowa,b,c

Recurrence

Follow‐up: long term (1 year)

16 of 19

6 of 20

RR 0.36

(0.18 to 0.72)

39 participants

(1 study)

⊕⊕⊝⊝
Very lowa,b,c

Adverse events

None of the included studies evaluated adverse events

Not reported

Not reported

*The basis for the assumed risk (e.g. median control group risk across studies) is provided in footnotes. The corresponding risk (and its 95% confidence interval) is based on the assumed risk in the comparison group and the relative effect of the intervention (and its 95% CI)
CI: Confidence interval

GRADE Working Group grades of evidence
High quality: Further research is very unlikely to change our confidence in the estimate of effect
Moderate quality: Further research is likely to have an important impact on our confidence in the estimate of effect and may change the estimate
Low quality: Further research is very likely to have an important impact on our confidence in the estimate of effect and is likely to change the estimate
Very low quality: We are very uncertain about the estimate

aDowngraded for imprecision

bDowngraded for inconsistency

cDowngraded for high risk of bias

Figuras y tablas -
Comparison 1. Motor control exercise vs spinal manipulative therapy

Outcome or subgroup title

No. of studies

No. of participants

Statistical method

Effect size

1 Pain Show forest plot

1

Mean Difference (IV, Random, 95% CI)

Subtotals only

1.1 Short term

1

58

Mean Difference (IV, Random, 95% CI)

9.0 [‐1.56, 19.56]

2 Disability Show forest plot

1

Mean Difference (IV, Random, 95% CI)

Subtotals only

2.1 Short term

1

85

Mean Difference (IV, Random, 95% CI)

4.0 [‐3.38, 11.38]

2.2 Long term

1

85

Mean Difference (IV, Random, 95% CI)

3.70 [‐4.10, 11.50]

Figuras y tablas -
Comparison 1. Motor control exercise vs spinal manipulative therapy
Comparison 2. Motor control exercise vs other exercises

Outcome or subgroup title

No. of studies

No. of participants

Statistical method

Effect size

1 Pain Show forest plot

2

Mean Difference (IV, Random, 95% CI)

Subtotals only

1.1 Short term

2

89

Mean Difference (IV, Random, 95% CI)

5.74 [‐3.34, 14.82]

1.2 Intermediate term

1

33

Mean Difference (IV, Random, 95% CI)

‐1.20 [‐18.24, 15.84]

2 Disability Show forest plot

2

Mean Difference (IV, Random, 95% CI)

Subtotals only

2.1 Short term

2

116

Mean Difference (IV, Random, 95% CI)

‐0.84 [‐8.72, 7.04]

2.2 Intermediate term

1

33

Mean Difference (IV, Random, 95% CI)

‐6.70 [‐22.80, 9.40]

2.3 Long term

1

83

Mean Difference (IV, Random, 95% CI)

5.70 [‐1.38, 12.78]

Figuras y tablas -
Comparison 2. Motor control exercise vs other exercises
Comparison 3. Motor control exercise as a supplement to medical management

Outcome or subgroup title

No. of studies

No. of participants

Statistical method

Effect size

1 Pain Show forest plot

1

Mean Difference (IV, Random, 95% CI)

Subtotals only

1.1 Short term

1

41

Mean Difference (IV, Random, 95% CI)

‐9.3 [‐20.41, 1.81]

2 Disability Show forest plot

1

Mean Difference (IV, Random, 95% CI)

Subtotals only

2.1 Short term

1

41

Mean Difference (IV, Random, 95% CI)

‐2.4 [‐4.87, 0.07]

3 Recurrence Show forest plot

1

Risk Ratio (M‐H, Random, 95% CI)

Subtotals only

3.1 Long term

1

39

Risk Ratio (M‐H, Random, 95% CI)

0.36 [0.18, 0.72]

Figuras y tablas -
Comparison 3. Motor control exercise as a supplement to medical management