Programas de agujas y jeringas y tratamiento de sustitución de opiáceos para la prevención de la transmisión de la hepatitis C en personas que se inyectan drogas
Información
- DOI:
- https://doi.org/10.1002/14651858.CD012021.pub2Copiar DOI

- Base de datos:
-
- Cochrane Database of Systematic Reviews
- Versión publicada:
-
- 18 septiembre 2017see what's new
- Tipo:
-
- Intervention
- Etapa:
-
- Review
- Grupo Editorial Cochrane:
-
Grupo Cochrane de Alcohol y drogas
- Copyright:
-
- Copyright © 2017 The Authors. Cochrane Database of Systematic Reviews published by John Wiley & Sons, Ltd. on behalf of The Cochrane Collaboration.
- This is an open access article under the terms of the Creative Commons Attribution‐Non‐Commercial Licence, which permits use, distribution and reproduction in any medium, provided the original work is properly cited and is not used for commercial purposes.
Cifras del artículo
Altmetric:
Citado por:
Autores
Contributions of authors
Lucy Platt led the writing of the protocol, the screening of papers, data extraction, analyses and write‐up of the review.
Silvia Minozzi contributed to prepare the protocol, assessed risk of bias of the included studies and contributed to writing the text of the review.
Jennifer Reed contributed to the literature search, 'Risk of bias' assessment and data extraction.
Peter Vickerman contributed to the development of the protocol, interpretation of findings and the write‐up of text of the review.
Holly Hagan contributed to the 'Risk of bias' assessment, the analysis plan and interpretation of findings and the write‐up of review text.
Clare French led on the 'Risk of bias' assessment.
Ashly Jordan contributed to the risk of bias assessment and interpretation of findings.
Louisa Degenhardt contributed to the development of the protocol as well as the write‐up of the review.
Vivian Hope contributed to the interpretation of findings and write‐up of the review.
Sharon Hutchinson contributed to the interpretation of findings and write up of the review.
Lisa Maher contributed to the development of the protocol, the identification of unpublished data, the interpretation of findings and write‐up of the review.
Norah Palmateer contributed to the development of the protocol and write‐up of the review.
Avril Taylor contributed to the development of the protocol and write‐up of the review.
Julie Bruneau contributed to the identification of unpublished data and the write‐up of the review.
Matthew Hickman contributed to the development of the protocol, interpretation of findings and the write‐up of text of the review.
Sources of support
Internal sources
-
No sources of support supplied
External sources
-
National Institute of Health Research (NIHR), UK.
The project was funded by the NIHR’s Public Health Research Programme (grant number: 12/3070/13). Clare French was funded by the NIHR Health Protection Research Unit in Evaluation of Interventions at University of Bristol (grant number: HPRU‐2012‐10026). The views expressed are those of the author(s) and not necessarily those of the NHS, the NIHR, the Department of Health or Public Health England.
-
European Commission Drug Prevention and Information Programme (DIPP) Grant "Treatment as Prevention in Europe: Model Projections of Impact And Strengthening Evidence Base On Intervention Coverage and Effect and HCV Morbidity". [JUST/2013/DPIP/AG/4812], Other.
-
National Institutes of Health/ National Institute on Drug Abuse (NIDA), USA.
Holly Hagan, Ashly Jordan and Jennifer Reed are supported by NIH‐NIDA grant [1 R01 DA034637]
-
Lisa Maher is supported by an Australian National Health and Medical Research Council Senior Research Fellowship, Australia.
Declarations of interest
Lucy Platt: none known.
Jennifer Reed: none known.
Silvia Minozzi: none known.
Peter Vickerman: received research grant funding off Gilead for doing work unrelated to this project.
Holly Hagan: none known.
Clare French: none known.
Ashly Jordan: none known.
Louisa Degenhardt: I have received untied educational grants from Reckitt Benckiser for the postmarketing surveillance of buprenorphine‐naloxone tablets and soluble film (2006 to 2013), the development of an opioid‐related behaviour scale (2010), and from Mundipharma for the conduct of postmarketing surveillance studies following the introduction of a new formulation of oxycodone in Australia. All such studies' design, conduct and interpretation of findings are the work of the investigators; the funders had no role in these. They had no knowledge of this work.
Vivian Hope: none known.
Sharon Hutchinson: outside the submitted work, received honoraria from pharma (Abbvie and Gilead) for speaking at conferences/meetings on the epidemiology and treatment of HCV infection.
Lisa Maher: none known.
Norah Palmateer: none known.
Avril Taylor: the Scottish Government funded the Needle Exchange Surveillance Initiative. Some of the data from this is used in the paper under consideration.
Julie Bruneau: outside the submitted work, received honoraria from pharma (Merck and Gilead) as advisor on the treatment of HCV infection among people who inject drugs.
Matthew Hickman: none known.
Acknowledgements
We thank Shruti Mehta, Thomas Kerr, Meghan Morris and Ali Judd for access to unpublished data and providing measures of association between the interventions and HCV risk acquisition that were used in the analysis. We thank Zuzana Mitrova for her support with the searches. We thank Julian Higgins for his advice on the use of the ACROBAT 'Risk of bias' assessment tool and statistical advice on the options for pooling different observational study designs.
Version history
| Published | Title | Stage | Authors | Version |
| 2017 Sep 18 | Needle syringe programmes and opioid substitution therapy for preventing hepatitis C transmission in people who inject drugs | Review | Lucy Platt, Silvia Minozzi, Jennifer Reed, Peter Vickerman, Holly Hagan, Clare French, Ashly Jordan, Louisa Degenhardt, Vivian Hope, Sharon Hutchinson, Lisa Maher, Norah Palmateer, Avril Taylor, Julie Bruneau, Matthew Hickman | |
| 2016 Jan 12 | Effectiveness of needle/syringe programmes and opiate substitution therapy in preventing HCV transmission among people who inject drugs | Protocol | Lucy Platt, Jennifer Reed, Silvia Minozzi, Peter Vickerman, Holly Hagan, Clare French, Ashly Jordan, Louisa Degenhardt, Vivian Hope, Sharon Hutchinson, Lisa Maher, Norah Palmateer, Avril Taylor, Matthew Hickman | |
Differences between protocol and review
We have added a final review author, Prof Julie Bruneau, who contributed some of the unpublished data and advised on the review analyses and write‐up.
We have changed the title to refer to opioids instead of opiates. Opioid encompasses synthetic opiates as well as those derived from opium, whereas opiates just include drugs derived from opium.
We added in another control intervention that included low coverage of NSP. This became necessary as it was clear following data extraction that many comparisons were made against this intervention exposure.
We also added to the description of the 'Risk of bias' assessment following its application. When the protocol was first published the tool was being piloted, and it was updated during the course of the review. We adapted our protocol to reflect these changes. We also added in additional confounders to be extracted from the protocol, since after extracting the first few papers it became clear that we had omitted relevant confounders.
We updated our approach to dealing with measures of treatment effect to reflect the dominant effect estimates that we were extracting. We treated odds ratios as an approximation of the risk ratio despite the variation in HCV incidence. We checked the legitimacy of this approach in a sensitivity analysis, excluding studies reporting odds ratios only.
We excluded studies where data regarding drug treatment or NSP were missing or unavailable from the analysis but not the review. We updated the review to clarify this point.
The subgroup analysis differed from that specified in the review protocol since there was insufficient information to assess impact by type of NSP, frequency of injecting, dose of OST, duration or age, ethnicity of participants. We did not assess impact by recruitment site of participants either since most studies recruited across multiple sites and methods, making it difficult to clearly differentiate methods.
The sensitivity analysis differed from that specified in the protocol in several ways. We did not exclude studies that reported incident rate ratios as effect estimates, since only a few studies used incident rate ratios. Instead we removed estimates derived from unpublished datasets as part of our sensitivity analyses since more estimates were derived in this way, making them a more substantive part of the analysis. The original protocol also stated that we would exclude studies that only assessed the impact of the intervention at baseline. We did this in the review but changed the wording to say that we excluded studies that used odds ratios as effect estimates and were cross‐sectional in design. This is the same as excluding baseline measures only, but we wanted to more clearly specify that the sensitivity analysis had explored the effect of pooling different study designs.
Keywords
MeSH
Medical Subject Headings (MeSH) Keywords
Medical Subject Headings Check Words
Female; Humans; Male;
PICO

Study flow diagram.
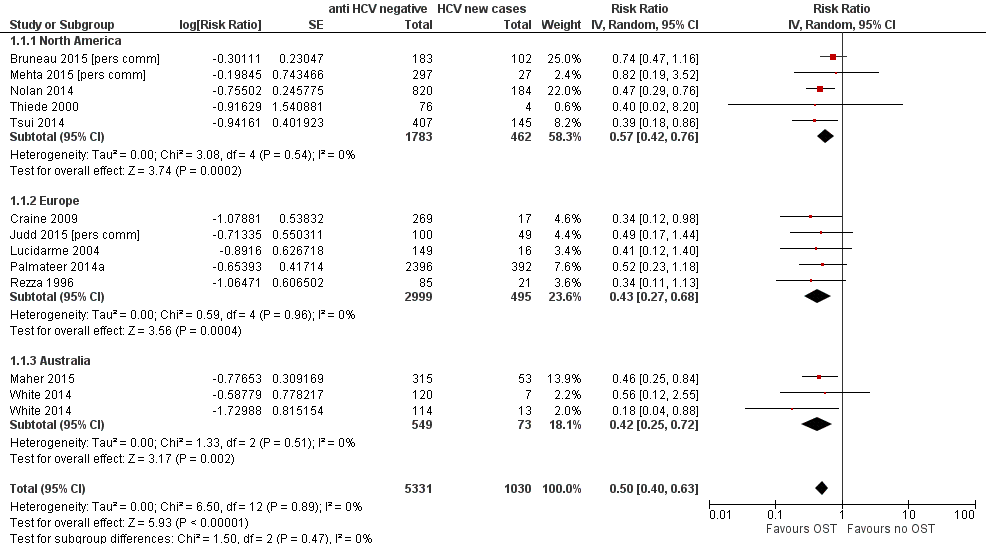
Forest plot of comparison: 1 Current OST versus no OST, outcome: 1.1 HCV incidence adjusted analyses by region.

Funnel plot of comparison: 1 Current OST versus no OST, outcome: 1.1 HCV incidence adjusted analyses by region.

Forest plot of comparison: 2 High NSP coverage versus no/low NSP coverage, outcome: 2.1 HCV incidence adjusted analyses by region.
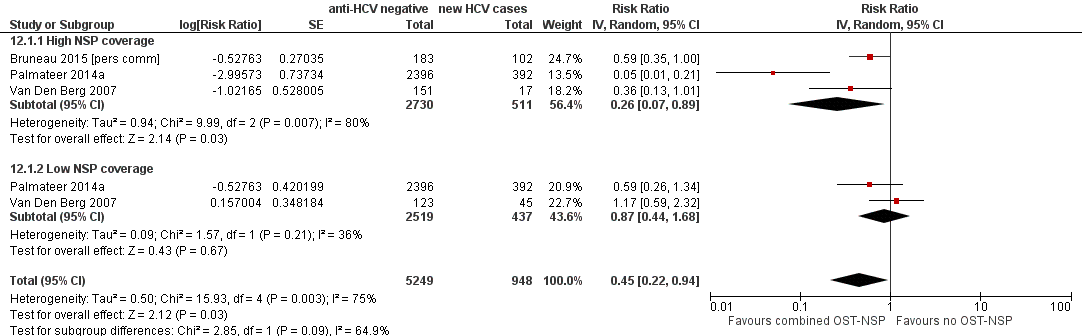
Forest plot of comparison: 4 Combined OST and high/low NSP versus no OST and low/no NSP, outcome: 4.1 HCV incidence adjusted analyses.

Comparison 1 Current OST versus no OST, Outcome 1 HCV incidence adjusted analyses by region.

Comparison 1 Current OST versus no OST, Outcome 2 HCV incidence adjusted analysis by study design.
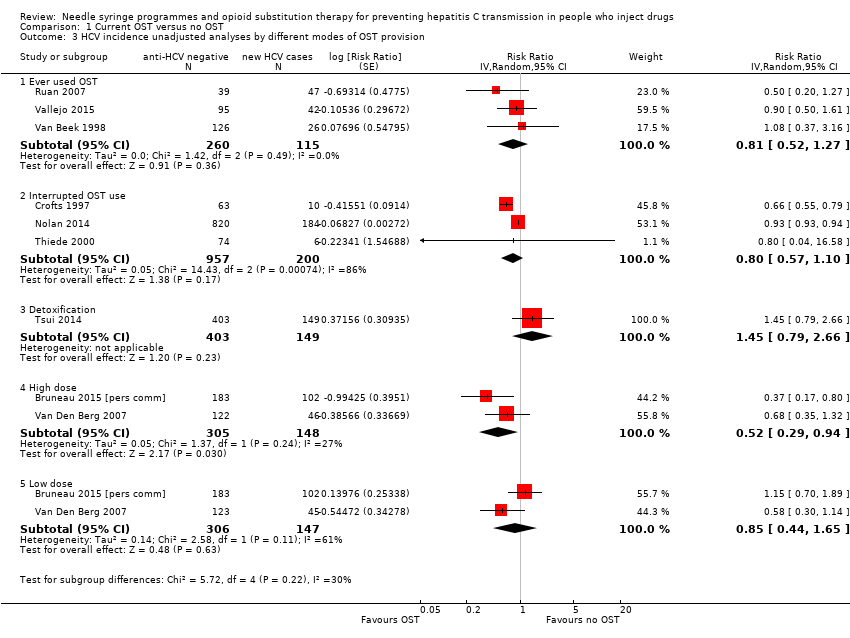
Comparison 1 Current OST versus no OST, Outcome 3 HCV incidence unadjusted analyses by different modes of OST provision.
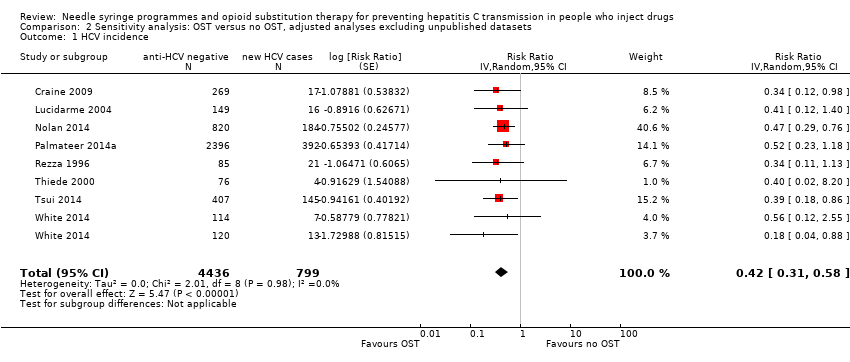
Comparison 2 Sensitivity analysis: OST versus no OST, adjusted analyses excluding unpublished datasets, Outcome 1 HCV incidence.

Comparison 3 Sensitivity analysis: OST versus no OST, adjusted analyses excluding studies at critical risk of bias, Outcome 1 HCV incidence.

Comparison 4 Sensitivity analysis: OST versus no OST, adjusted analyses excluding cross‐sectional studies, Outcome 1 HCV incidence.

Comparison 5 OST versus no OST, unadjusted analysis, Outcome 1 HCV incidence.

Comparison 6 High NSP coverage versus no/low NSP coverage, Outcome 1 HCV incidence adjusted analyses by region.

Comparison 6 High NSP coverage versus no/low NSP coverage, Outcome 2 HCV incidence adjusted analyses by study design.
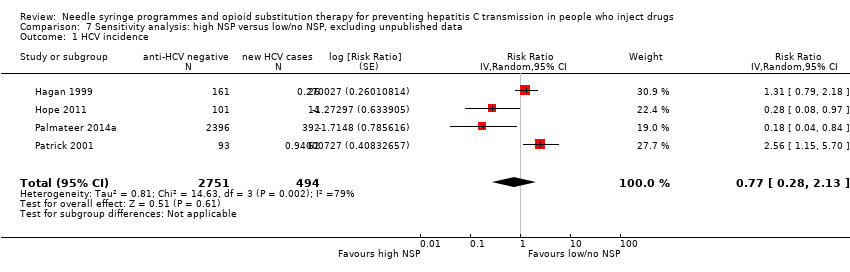
Comparison 7 Sensitivity analysis: high NSP versus low/no NSP, excluding unpublished data, Outcome 1 HCV incidence.

Comparison 8 Sensitivity analysis: high NSP versus low/no NSP, excluding cross‐sectional surveys, Outcome 1 HCV incidence.

Comparison 9 High NSP coverage versus low/no coverage, unadjusted estimates, Outcome 1 HCV incidence.

Comparison 10 Low NSP coverage versus no coverage, Outcome 1 HCV incidence, adjusted analyses.

Comparison 11 Low NSP coverage versus no NSP, unadjusted analysis, Outcome 1 HCV incidence.

Comparison 12 Combined OST and high/low NSP versus no OST and low/no NSP, Outcome 1 HCV incidence adjusted analyses.
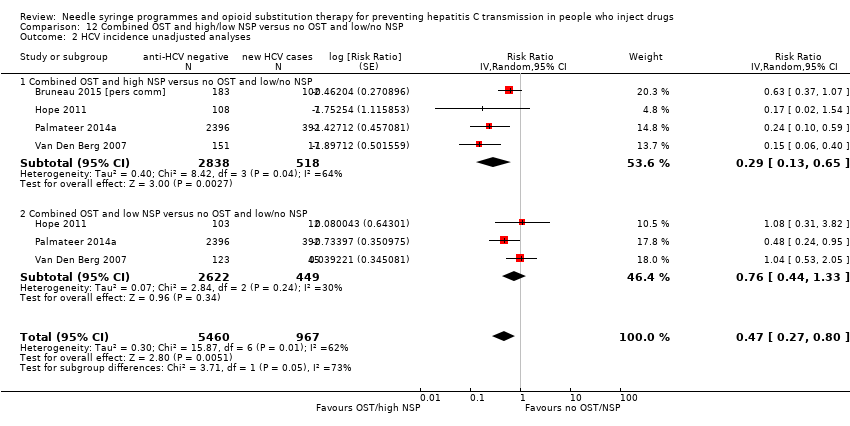
Comparison 12 Combined OST and high/low NSP versus no OST and low/no NSP, Outcome 2 HCV incidence unadjusted analyses.
| Current OST versus no OST | |||||
| Patient or population: people who inject drugs | |||||
| Outcomes | Illustrative comparative risks* (95% CI) | Relative effect | No of participants | Quality of the evidence | |
| Assumed risk | Corresponding risk | ||||
| No OST | Current OST | ||||
| HCV incidence adjusted analyses | — | — | RR 0.50 (0.40 to 0.63) | 6361 | ⊕⊕⊝⊝ |
| *The basis for the assumed risk (e.g. the median control group risk across studies) is provided in footnotes. The corresponding risk (and its 95% confidence interval) is based on the assumed risk in the comparison group and the relative effect of the intervention (and its 95% CI). | |||||
| GRADE Working Group grades of evidence | |||||
| aDowngraded one level due to overall moderate risk of bias in 2 studies, overall serious risk of bias in 6 studies, 2 studies at overall critical risk of bias in 2 studies; not enough information to make judgment in 2 studies. | |||||
| High NSP coverage versus no/low NSP coverage | |||||
| Patient or population: people who inject drugs | |||||
| Outcomes | Illustrative comparative risks* (95% CI) | Relative effect | No of participants | Quality of the evidence | |
| Assumed risk | Corresponding risk | ||||
| No/low NSP coverage | High NSP coverage | ||||
| HCV incidence adjusted analyses | — | — | RR: 0.79 (0.39 to 1.61) | 3530 | ⊕⊝⊝⊝ |
| *The basis for the assumed risk (e.g. the median control group risk across studies) is provided in footnotes. The corresponding risk (and its 95% confidence interval) is based on the assumed risk in the comparison group and the relative effect of the intervention (and its 95% CI). | |||||
| GRADE Working Group grades of evidence | |||||
| aDowngraded one level due to serious overall risk of bias in all the studies. | |||||
| Combined OST and highNSP versus no OST and low/no NSP | |||||
| Patient or population: people who inject drugs | |||||
| Outcomes | Illustrative comparative risks* (95% CI) | Relative effect | No of participants | Quality of the evidence | |
| Assumed risk | Corresponding risk | ||||
| No OST and low/no NSP | Combined OST and high NSP | ||||
| HCV incidence adjusted analyses | — | — | RR: 0.26 (0.07 to 0.89) | 3241 | ⊕⊕⊕⊝ Lowa,b |
| *The basis for the assumed risk (e.g. the median control group risk across studies) is provided in footnotes. The corresponding risk (and its 95% confidence interval) is based on the assumed risk in the comparison group and the relative effect of the intervention (and its 95% CI). | |||||
| GRADE Working Group grades of evidence | |||||
| aDowngraded one level due to serious overall risk of bias in all studies. | |||||
| Study | Confounding | Selection bias | Measurement of interventions | Departures from intended interventions | Missing data | Measurement of outcomes | Selection of reported result | Overall risk of bias |
| Critical | Critical | Serious | No info | Critical | Low | No info | Critical | |
| Moderate | Serious | Moderate | No info | No info | Low | Low | Serious | |
| Serious | Serious | Serious | No info | Serious | Low | Low | Serious | |
| Critical | Serious | Low | No info | Serious | Serious | Low | Critical | |
| Serious | Serious | Serious | No info | Low | Low | Low | Serious | |
| Moderate | Serious | Low | No info | Low | Low | Low | Serious | |
| Serious | Serious | Moderate | No info | No info | Low | Low | Serious | |
| Moderate | Moderate | Serious | No info | Low | Low | Low | Serious | |
| Moderate | Moderate | Serious | No info | No info | Low | Low | Serious | |
| Moderate | Critical | Critical | No info | Critical | Low | Low | Critical | |
| Moderate | Serious | Serious | No info | Serious | Low | Low | Serious | |
| Moderate | Serious | Serious | No info | No info | Low | Low | Serious | |
| Moderate | No info | No info | No info | No info | Low | Low | No info | |
| Serious | Serious | Moderate | No info | Low | Low | Low | Serious | |
| Moderate | No info | No info | No info | No info | Low | Low | No info | |
| Serious | Serious | Moderate | No info | Serious | Low | Low | Serious | |
| Serious | Moderate | Serious | No info | Serious | Low | Low | Serious | |
| Serious | Low | Serious | No info | Critical | Low | Low | Critical | |
| Serious | Serious | Serious | No info | Critical | Low | Low | Critical | |
| Critical | Critical | Serious | No info | Serious | Low | Low | Critical | |
| Serious | Serious | Moderate | No info | Low | Low | Low | Serious | |
| Moderate | Moderate | Low | No info | Low | Low | Low | Moderate | |
| Serious | Serious | Serious | No info | Moderate | Low | Low | Serious | |
| Moderate | Moderate | Low | No info | Moderate | Low | Low | Moderate | |
| Serious | Serious | Low | No info | Serious | Low | Low | Serious | |
| Critical | Serious | Serious | No info | Critical | Low | Low | Critical | |
| Serious | Serious | Moderate | No info | Serious | Low | Low | Serious | |
| Moderate | Serious | Moderate | No info | No info | Low | Low | Serious |
| Variable | Studies | Univariable rate ratio (95% CI) | Ratio of rate ratios (95% CI) | P value | Tau2 |
| Geographic region | |||||
| Europe | 8 | 0.51 (0.37‐0.70) | 1.0 (ref) | — | — |
| Australia | 5 | 0.55 (0.28‐1.11) | 1.12 (0.52‐2.41) | — | — |
| North America | 6 | 0.69 (0.44‐1.08) | 1.42 (0.73‐2.78) | 0.53 | 0.10 |
| Site of recruitment | |||||
| Service attenders | 12 | 0.67 (0.49‐0.92) | 1.0 (ref) | — | — |
| Community | 7 | 0.49 (0.33‐0.73) | 0.73 (0.42‐1.27) | 0.256 | 0.06 |
| Study design | |||||
| Cross‐sectional | 4 | 0.51 (0.31‐0.85) | 1.0 | — | — |
| Prospective cohort | 15 | 0.58 (0.43‐0.77) | 1.12 (0.48‐2.61) | 0.784 | 0.10 |
| Females | 17 | — | 1.59 (1.13‐2.29) | 0.01 | 0.04 |
| Prison experience | 11 | — | 1.057 (0.61‐1.79) | 0.821 | 0.43 |
| Experience of homelessness | 12 | — | 1.08 (0.83‐1.40) | 0.521 | 0.23 |
| Injection of stimulants | 12 | — | 0.89 (0.65‐1.22) | 0.373 | 0.17 |
| Daily injection | 7 | — | 0.88 (0.64‐1.22) | 0.373 | 0.17 |
| CI: confidence interval; HCV: hepatitis C virus; OST: opioid substitution therapy. | |||||
| Variable | Studies | Univariable rate ratio (95%CI) | Ratio of rate ratios (95%CI) | P value | Tau2 |
| Geographic region | |||||
| Europe | 5 | 0.44 (0.24‐0.80) | 1.0 (Ref) | — | — |
| North America | 3 | 1.58 (0.57‐4.42) | 3.73 (0.95‐14.7) | 0.057 | 0.41 |
| Recruitment site | |||||
| Service attenders | 3 | 0.67 (0.28‐1.59) | 1.0 (Ref) | — | — |
| Community | 5 | 0.82 (0.29‐2.32) | 0.76(0.12‐4.88) | 0.74 | 0.89 |
| Study design | |||||
| Cross‐sectional survey | 3 | 0.34 (0.16‐0.75) | 1.0 (Ref) | — | — |
| Prospective cohort | 4 | 1.26 (0.55‐2.93) | 3.53 (0.78‐15.86) | 0.087 | 0.48 |
| Females | 7 | — | 2.97(0.38‐23.1) | 0.24 | 0.87 |
| Prison experience | 3 | — | NA | — | — |
| Experience of homelessness | 6 | — | 1.01 (0.38‐2.67) | 0.976 | 1.53 |
| Injection of stimulants | 7 | — | 1.08 (0.47‐2.51) | 0.827 | 1.15 |
| Daily injection | 5 | — | 3.66 (0.22‐61.3) | 0.239 | 1.15 |
| CI: confidence interval; HCV: hepatitis C virus; NSP: needle syringe programmes. | |||||
| Outcome or subgroup title | No. of studies | No. of participants | Statistical method | Effect size |
| 1 HCV incidence adjusted analyses by region Show forest plot | 12 | 6361 | Risk Ratio (Random, 95% CI) | 0.50 [0.40, 0.63] |
| 1.1 North America | 5 | 2245 | Risk Ratio (Random, 95% CI) | 0.57 [0.42, 0.76] |
| 1.2 Europe | 5 | 3494 | Risk Ratio (Random, 95% CI) | 0.43 [0.27, 0.68] |
| 1.3 Australia | 2 | 622 | Risk Ratio (Random, 95% CI) | 0.42 [0.25, 0.72] |
| 2 HCV incidence adjusted analysis by study design Show forest plot | 12 | 6361 | Risk Ratio (Random, 95% CI) | 0.50 [0.40, 0.63] |
| 2.1 Prospective cohort | 10 | 3467 | Risk Ratio (Random, 95% CI) | 0.51 [0.40, 0.65] |
| 2.2 Cross‐sectional surveys | 2 | 2894 | Risk Ratio (Random, 95% CI) | 0.46 [0.23, 0.89] |
| 3 HCV incidence unadjusted analyses by different modes of OST provision Show forest plot | 9 | Risk Ratio (Random, 95% CI) | Subtotals only | |
| 3.1 Ever used OST | 3 | 375 | Risk Ratio (Random, 95% CI) | 0.81 [0.52, 1.27] |
| 3.2 Interrupted OST use | 3 | 1157 | Risk Ratio (Random, 95% CI) | 0.80 [0.57, 1.10] |
| 3.3 Detoxification | 1 | 552 | Risk Ratio (Random, 95% CI) | 1.45 [0.79, 2.66] |
| 3.4 High dose | 2 | 453 | Risk Ratio (Random, 95% CI) | 0.52 [0.29, 0.94] |
| 3.5 Low dose | 2 | 453 | Risk Ratio (Random, 95% CI) | 0.85 [0.44, 1.65] |
| Outcome or subgroup title | No. of studies | No. of participants | Statistical method | Effect size |
| 1 HCV incidence Show forest plot | 8 | 5235 | Risk Ratio (Random, 95% CI) | 0.42 [0.31, 0.58] |
| Outcome or subgroup title | No. of studies | No. of participants | Statistical method | Effect size |
| 1 HCV incidence Show forest plot | 9 | 5782 | Risk Ratio (Random, 95% CI) | 0.51 [0.40, 0.64] |
| Outcome or subgroup title | No. of studies | No. of participants | Statistical method | Effect size |
| 1 HCV incidence Show forest plot | 10 | 3467 | Risk Ratio (Random, 95% CI) | 0.51 [0.40, 0.65] |
| Outcome or subgroup title | No. of studies | No. of participants | Statistical method | Effect size |
| 1 HCV incidence Show forest plot | 16 | 9499 | Risk Ratio (Random, 95% CI) | 0.57 [0.45, 0.73] |
| Outcome or subgroup title | No. of studies | No. of participants | Statistical method | Effect size |
| 1 HCV incidence adjusted analyses by region Show forest plot | 5 | 3530 | Risk Ratio (Random, 95% CI) | 0.79 [0.39, 1.61] |
| 1.1 North America | 3 | 627 | Risk Ratio (Random, 95% CI) | 1.25 [0.63, 2.46] |
| 1.2 Europe | 2 | 2903 | Risk Ratio (Random, 95% CI) | 0.24 [0.09, 0.62] |
| 2 HCV incidence adjusted analyses by study design Show forest plot | 5 | 3530 | Risk Ratio (Random, 95% CI) | 0.95 [0.50, 1.82] |
| 2.1 Prospective cohorts | 3 | 627 | Risk Ratio (Random, 95% CI) | 1.44 [1.01, 2.05] |
| 2.2 Cross‐sectional surveys | 2 | 2903 | Risk Ratio (Random, 95% CI) | 0.24 [0.09, 0.62] |
| Outcome or subgroup title | No. of studies | No. of participants | Statistical method | Effect size |
| 1 HCV incidence Show forest plot | 4 | 3245 | Risk Ratio (Random, 95% CI) | 0.77 [0.28, 2.13] |
| Outcome or subgroup title | No. of studies | No. of participants | Statistical method | Effect size |
| 1 HCV incidence Show forest plot | 3 | 627 | Risk Ratio (Random, 95% CI) | 1.25 [0.63, 2.46] |
| Outcome or subgroup title | No. of studies | No. of participants | Statistical method | Effect size |
| 1 HCV incidence Show forest plot | 7 | 6455 | Risk Ratio (Random, 95% CI) | 0.78 [0.39, 1.55] |
| Outcome or subgroup title | No. of studies | No. of participants | Statistical method | Effect size |
| 1 HCV incidence, adjusted analyses Show forest plot | 6 | 2765 | Risk Ratio (Random, 95% CI) | 1.43 [0.82, 2.49] |
| Outcome or subgroup title | No. of studies | No. of participants | Statistical method | Effect size |
| 1 HCV incidence Show forest plot | 9 | 3242 | Risk Ratio (Random, 95% CI) | 1.41 [0.95, 2.09] |
| Outcome or subgroup title | No. of studies | No. of participants | Statistical method | Effect size |
| 1 HCV incidence adjusted analyses Show forest plot | 3 | 6197 | Risk Ratio (Random, 95% CI) | 0.45 [0.22, 0.94] |
| 1.1 High NSP coverage | 3 | 3241 | Risk Ratio (Random, 95% CI) | 0.26 [0.07, 0.89] |
| 1.2 Low NSP coverage | 2 | 2956 | Risk Ratio (Random, 95% CI) | 0.87 [0.44, 1.68] |
| 2 HCV incidence unadjusted analyses Show forest plot | 4 | 6427 | Risk Ratio (Random, 95% CI) | 0.47 [0.27, 0.80] |
| 2.1 Combined OST and high NSP versus no OST and low/no NSP | 4 | 3356 | Risk Ratio (Random, 95% CI) | 0.29 [0.13, 0.65] |
| 2.2 Combined OST and low NSP versus no OST and low/no NSP | 3 | 3071 | Risk Ratio (Random, 95% CI) | 0.76 [0.44, 1.33] |